Gibsonville, NC Map & Demographics
Gibsonville Map
Gibsonville Overview
$37,955
PER CAPITA INCOME
$112,115
AVG FAMILY INCOME
$98,558
AVG HOUSEHOLD INCOME
43.0%
WAGE / INCOME GAP [ % ]
57.0¢/ $1
WAGE / INCOME GAP [ $ ]
0.32
INEQUALITY / GINI INDEX
8,827
TOTAL POPULATION
3,718
MALE POPULATION
5,109
FEMALE POPULATION
72.77
MALES / 100 FEMALES
137.41
FEMALES / 100 MALES
40.3
MEDIAN AGE
3.2
AVG FAMILY SIZE
2.6
AVG HOUSEHOLD SIZE
4,561
LABOR FORCE [ PEOPLE ]
68.5%
PERCENT IN LABOR FORCE
2.4%
UNEMPLOYMENT RATE
Gibsonville Zip Codes
Gibsonville Area Codes
Income in Gibsonville
Income Overview in Gibsonville
Per Capita Income in Gibsonville is $37,955, while median incomes of families and households are $112,115 and $98,558 respectively.
| Characteristic | Number | Measure |
| Per Capita Income | 8,827 | $37,955 |
| Median Family Income | 2,266 | $112,115 |
| Mean Family Income | 2,266 | $109,222 |
| Median Household Income | 3,321 | $98,558 |
| Mean Household Income | 3,321 | $100,877 |
| Income Deficit | 2,266 | $0 |
| Wage / Income Gap (%) | 8,827 | 43.02% |
| Wage / Income Gap ($) | 8,827 | 56.98¢ per $1 |
| Gini / Inequality Index | 8,827 | 0.32 |
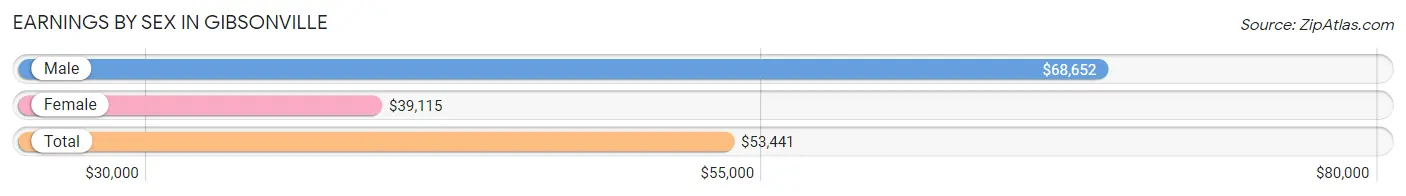
Earnings by Sex in Gibsonville
Average Earnings in Gibsonville are $53,441, $68,652 for men and $39,115 for women, a difference of 43.0%.
| Sex | Number | Average Earnings |
| Male | 2,102 (45.7%) | $68,652 |
| Female | 2,496 (54.3%) | $39,115 |
| Total | 4,598 (100.0%) | $53,441 |
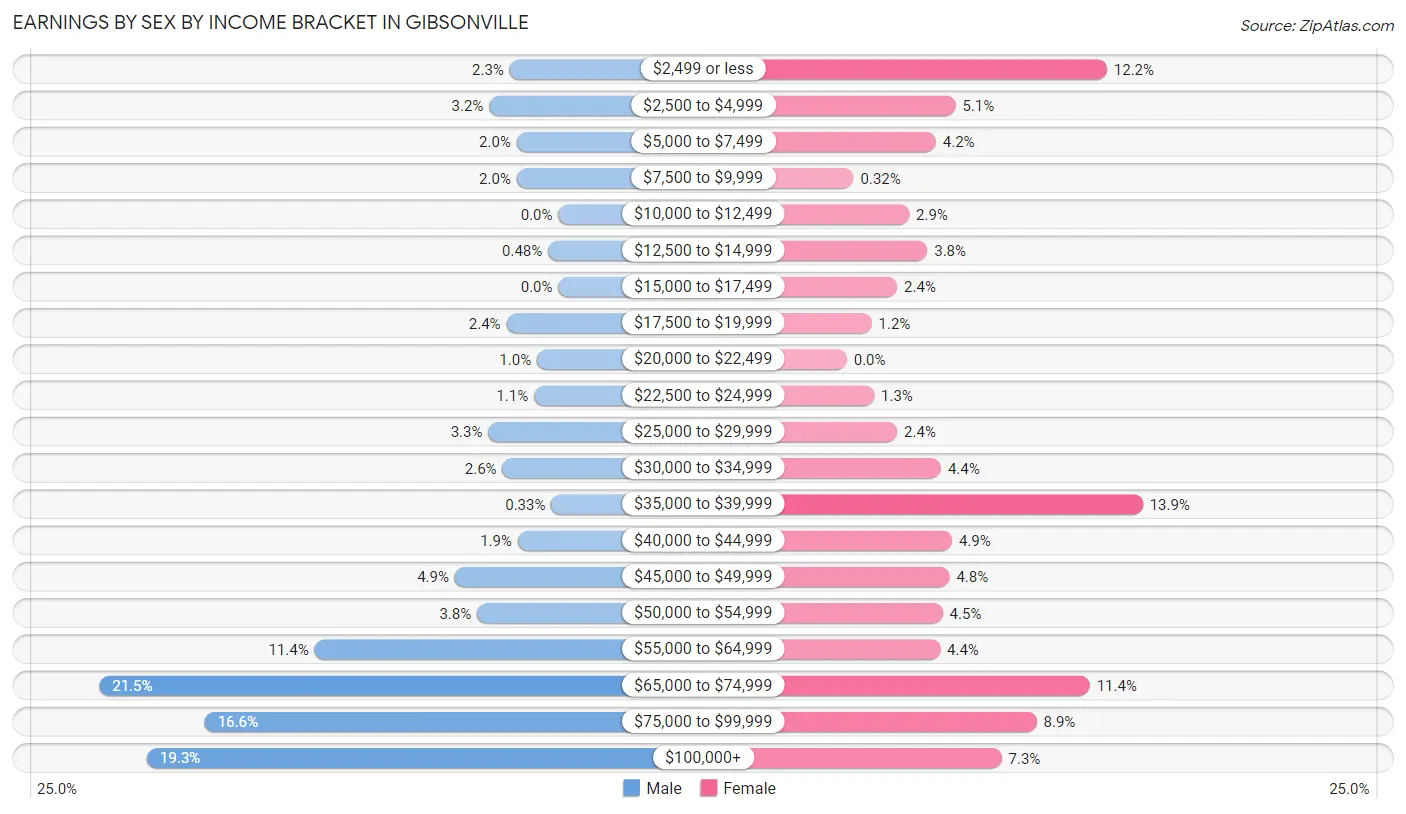
Earnings by Sex by Income Bracket in Gibsonville
The most common earnings brackets in Gibsonville are $65,000 to $74,999 for men (452 | 21.5%) and $35,000 to $39,999 for women (346 | 13.9%).
| Income | Male | Female |
| $2,499 or less | 48 (2.3%) | 304 (12.2%) |
| $2,500 to $4,999 | 68 (3.2%) | 127 (5.1%) |
| $5,000 to $7,499 | 41 (1.9%) | 104 (4.2%) |
| $7,500 to $9,999 | 41 (1.9%) | 8 (0.3%) |
| $10,000 to $12,499 | 0 (0.0%) | 73 (2.9%) |
| $12,500 to $14,999 | 10 (0.5%) | 94 (3.8%) |
| $15,000 to $17,499 | 0 (0.0%) | 59 (2.4%) |
| $17,500 to $19,999 | 51 (2.4%) | 29 (1.2%) |
| $20,000 to $22,499 | 21 (1.0%) | 0 (0.0%) |
| $22,500 to $24,999 | 24 (1.1%) | 32 (1.3%) |
| $25,000 to $29,999 | 69 (3.3%) | 59 (2.4%) |
| $30,000 to $34,999 | 55 (2.6%) | 110 (4.4%) |
| $35,000 to $39,999 | 7 (0.3%) | 346 (13.9%) |
| $40,000 to $44,999 | 40 (1.9%) | 123 (4.9%) |
| $45,000 to $49,999 | 102 (4.9%) | 120 (4.8%) |
| $50,000 to $54,999 | 80 (3.8%) | 112 (4.5%) |
| $55,000 to $64,999 | 240 (11.4%) | 109 (4.4%) |
| $65,000 to $74,999 | 452 (21.5%) | 284 (11.4%) |
| $75,000 to $99,999 | 348 (16.6%) | 222 (8.9%) |
| $100,000+ | 405 (19.3%) | 181 (7.2%) |
| Total | 2,102 (100.0%) | 2,496 (100.0%) |
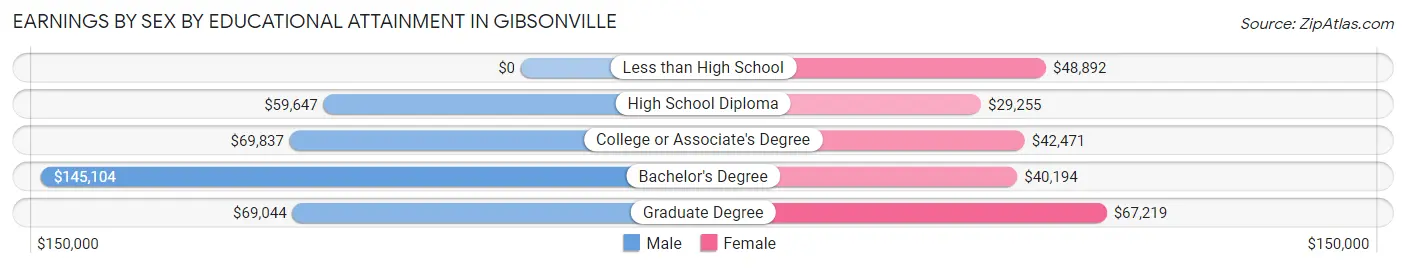
Earnings by Sex by Educational Attainment in Gibsonville
Average earnings in Gibsonville are $69,424 for men and $43,452 for women, a difference of 37.4%. Men with an educational attainment of bachelor's degree enjoy the highest average annual earnings of $145,104, while those with high school diploma education earn the least with $59,647. Women with an educational attainment of graduate degree earn the most with the average annual earnings of $67,219, while those with high school diploma education have the smallest earnings of $29,255.
| Educational Attainment | Male Income | Female Income |
| Less than High School | - | - |
| High School Diploma | $59,647 | $29,255 |
| College or Associate's Degree | $69,837 | $42,471 |
| Bachelor's Degree | $145,104 | $40,194 |
| Graduate Degree | $69,044 | $67,219 |
| Total | $69,424 | $43,452 |
Family Income in Gibsonville
Family Income Brackets in Gibsonville
According to the Gibsonville family income data, there are 868 families falling into the $100,000 to $149,999 income range, which is the most common income bracket and makes up 38.3% of all families. Conversely, the less than $10,000 income bracket is the least frequent group with only 16 families (0.7%) belonging to this category.
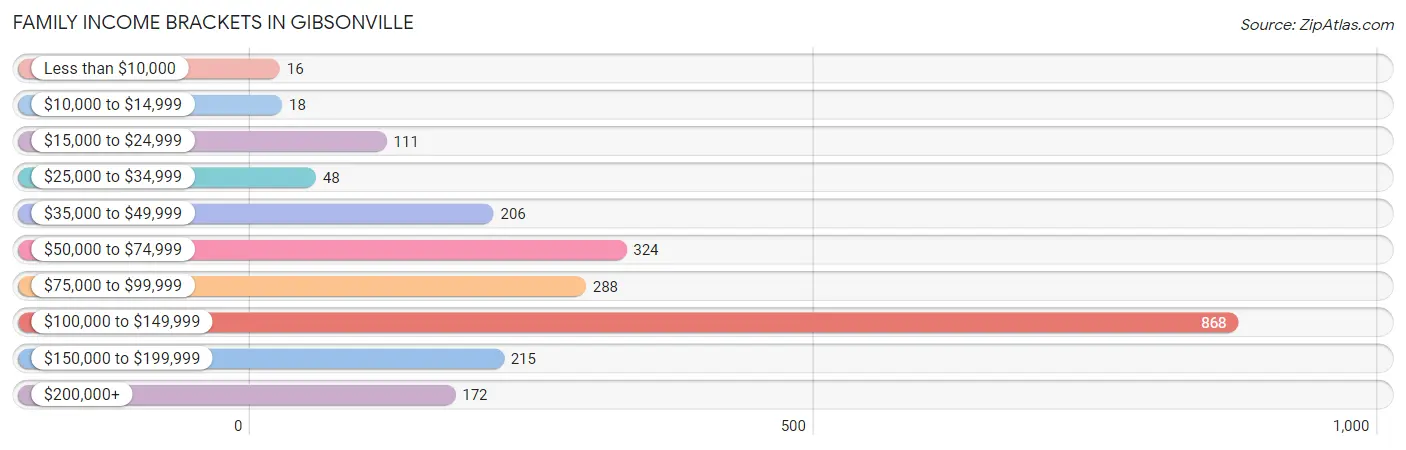
| Income Bracket | # Families | % Families |
| Less than $10,000 | 16 | 0.7% |
| $10,000 to $14,999 | 18 | 0.8% |
| $15,000 to $24,999 | 111 | 4.9% |
| $25,000 to $34,999 | 48 | 2.1% |
| $35,000 to $49,999 | 206 | 9.1% |
| $50,000 to $74,999 | 324 | 14.3% |
| $75,000 to $99,999 | 288 | 12.7% |
| $100,000 to $149,999 | 868 | 38.3% |
| $150,000 to $199,999 | 215 | 9.5% |
| $200,000+ | 172 | 7.6% |
Family Income by Famaliy Size in Gibsonville
6-person families (105 | 4.6%) account for the highest median family income in Gibsonville with $184,189 per family, while 2-person families (1,002 | 44.2%) have the highest median income of $47,887 per family member.
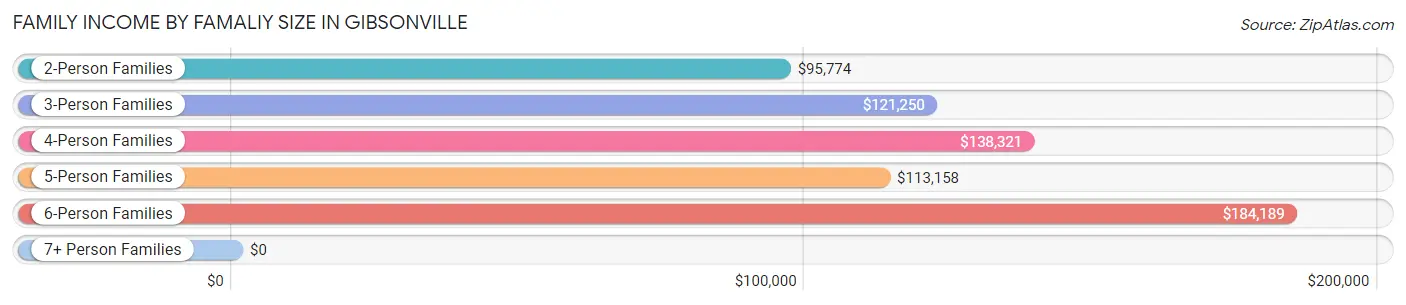
| Income Bracket | # Families | Median Income |
| 2-Person Families | 1,002 (44.2%) | $95,774 |
| 3-Person Families | 615 (27.1%) | $121,250 |
| 4-Person Families | 283 (12.5%) | $138,321 |
| 5-Person Families | 178 (7.9%) | $113,158 |
| 6-Person Families | 105 (4.6%) | $184,189 |
| 7+ Person Families | 83 (3.7%) | $0 |
| Total | 2,266 (100.0%) | $112,115 |
Family Income by Number of Earners in Gibsonville
The median family income in Gibsonville is $112,115, with families comprising 2 earners (1,067) having the highest median family income of $127,530, while families with 1 earner (529) have the lowest median family income of $61,750, accounting for 47.1% and 23.4% of families, respectively.
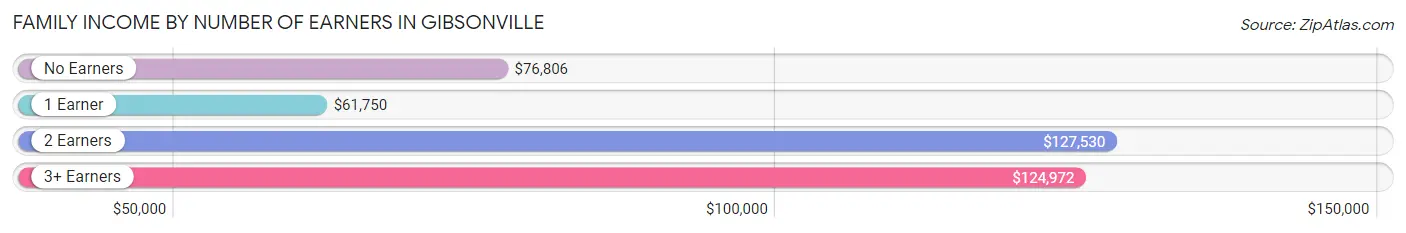
| Number of Earners | # Families | Median Income |
| No Earners | 402 (17.7%) | $76,806 |
| 1 Earner | 529 (23.4%) | $61,750 |
| 2 Earners | 1,067 (47.1%) | $127,530 |
| 3+ Earners | 268 (11.8%) | $124,972 |
| Total | 2,266 (100.0%) | $112,115 |
Household Income in Gibsonville
Household Income Brackets in Gibsonville
With 1,192 households falling in the category, the $100,000 to $149,999 income range is the most frequent in Gibsonville, accounting for 35.9% of all households. In contrast, only 13 households (0.4%) fall into the $10,000 to $14,999 income bracket, making it the least populous group.
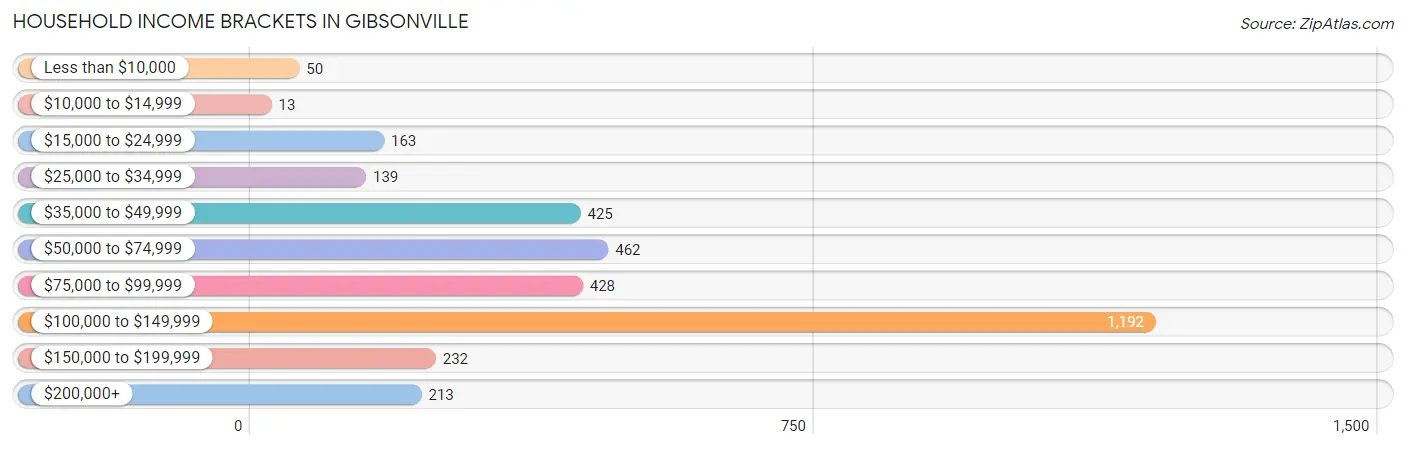
| Income Bracket | # Households | % Households |
| Less than $10,000 | 50 | 1.5% |
| $10,000 to $14,999 | 13 | 0.4% |
| $15,000 to $24,999 | 163 | 4.9% |
| $25,000 to $34,999 | 139 | 4.2% |
| $35,000 to $49,999 | 425 | 12.8% |
| $50,000 to $74,999 | 462 | 13.9% |
| $75,000 to $99,999 | 428 | 12.9% |
| $100,000 to $149,999 | 1,192 | 35.9% |
| $150,000 to $199,999 | 232 | 7.0% |
| $200,000+ | 213 | 6.4% |
Household Income by Householder Age in Gibsonville
The median household income in Gibsonville is $98,558, with the highest median household income of $122,539 found in the 25 to 44 years age bracket for the primary householder. A total of 882 households (26.6%) fall into this category. Meanwhile, the 15 to 24 years age bracket for the primary householder has the lowest median household income of $60,833, with 38 households (1.1%) in this group.
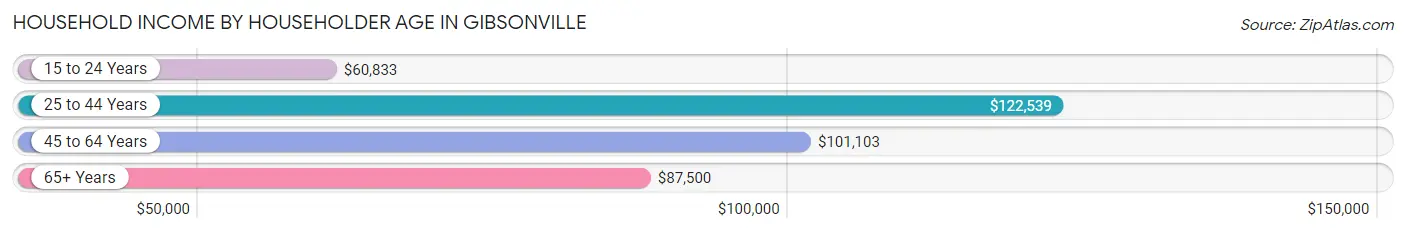
| Income Bracket | # Households | Median Income |
| 15 to 24 Years | 38 (1.1%) | $60,833 |
| 25 to 44 Years | 882 (26.6%) | $122,539 |
| 45 to 64 Years | 1,601 (48.2%) | $101,103 |
| 65+ Years | 800 (24.1%) | $87,500 |
| Total | 3,321 (100.0%) | $98,558 |
Poverty in Gibsonville
Income Below Poverty by Sex and Age in Gibsonville
With 7.6% poverty level for males and 7.8% for females among the residents of Gibsonville, 25 to 34 year old males and 18 to 24 year old females are the most vulnerable to poverty, with 56 males (23.3%) and 106 females (26.6%) in their respective age groups living below the poverty level.
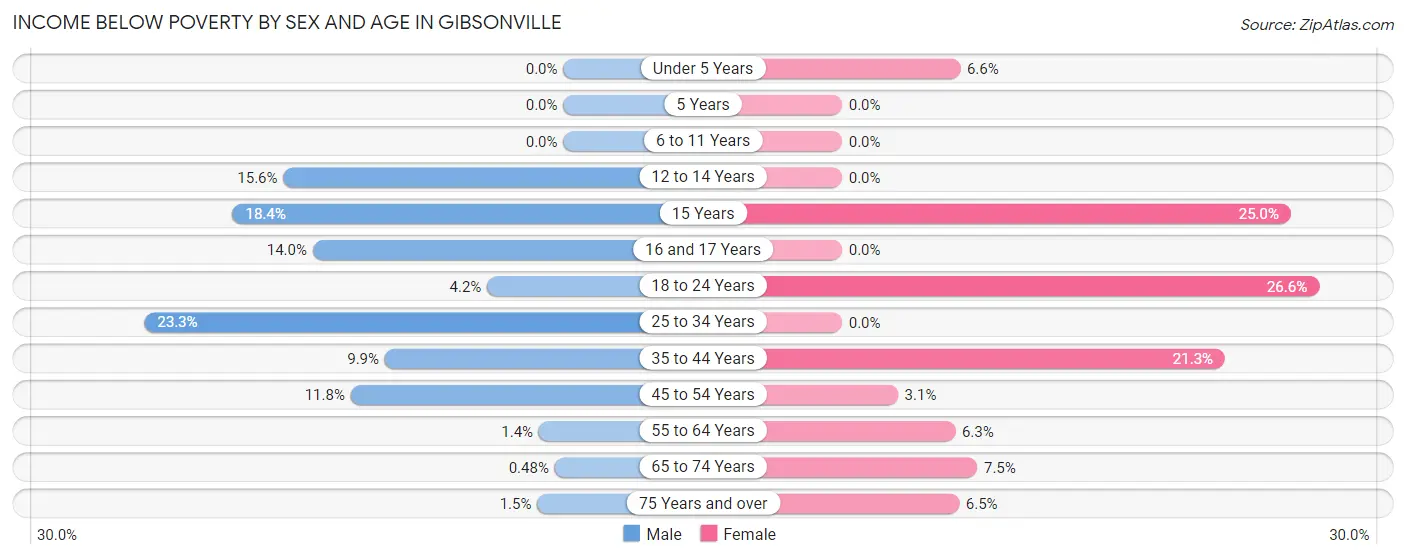
| Age Bracket | Male | Female |
| Under 5 Years | 0 (0.0%) | 20 (6.6%) |
| 5 Years | 0 (0.0%) | 0 (0.0%) |
| 6 to 11 Years | 0 (0.0%) | 0 (0.0%) |
| 12 to 14 Years | 58 (15.6%) | 0 (0.0%) |
| 15 Years | 14 (18.4%) | 10 (25.0%) |
| 16 and 17 Years | 6 (14.0%) | 0 (0.0%) |
| 18 to 24 Years | 7 (4.2%) | 106 (26.6%) |
| 25 to 34 Years | 56 (23.3%) | 0 (0.0%) |
| 35 to 44 Years | 62 (9.9%) | 138 (21.3%) |
| 45 to 54 Years | 67 (11.8%) | 18 (3.1%) |
| 55 to 64 Years | 9 (1.4%) | 52 (6.3%) |
| 65 to 74 Years | 2 (0.5%) | 35 (7.5%) |
| 75 Years and over | 3 (1.5%) | 18 (6.5%) |
| Total | 284 (7.6%) | 397 (7.8%) |
Income Above Poverty by Sex and Age in Gibsonville
According to the poverty statistics in Gibsonville, males aged under 5 years and females aged 5 years are the age groups that are most secure financially, with 100.0% of males and 100.0% of females in these age groups living above the poverty line.
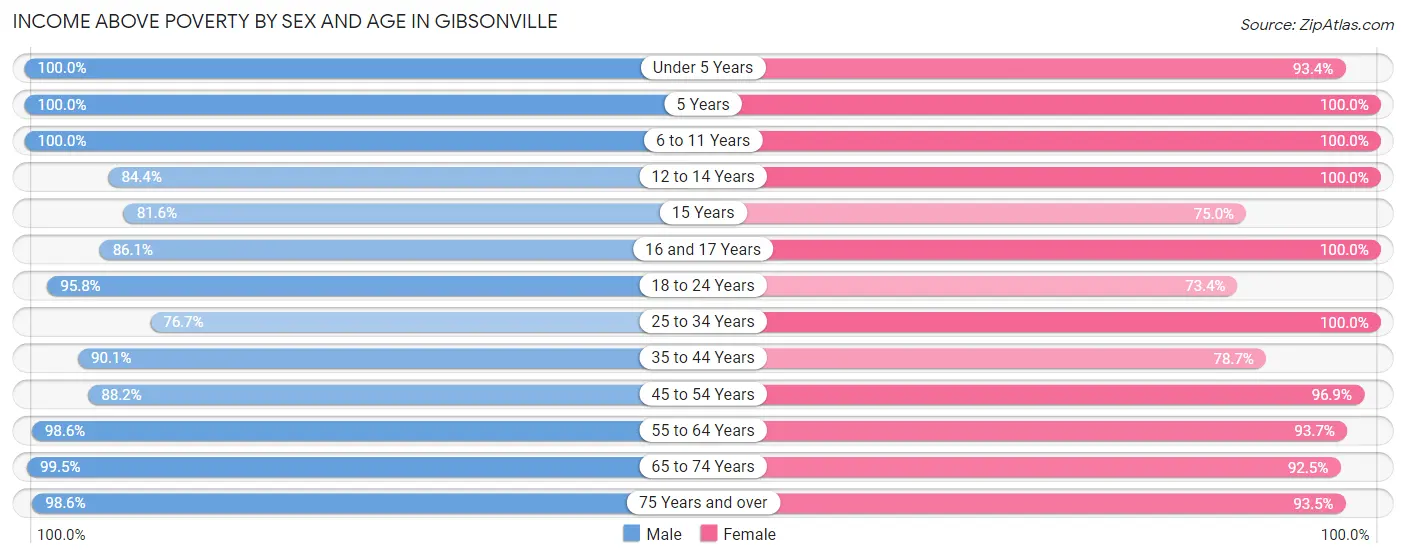
| Age Bracket | Male | Female |
| Under 5 Years | 112 (100.0%) | 284 (93.4%) |
| 5 Years | 15 (100.0%) | 93 (100.0%) |
| 6 to 11 Years | 213 (100.0%) | 723 (100.0%) |
| 12 to 14 Years | 314 (84.4%) | 221 (100.0%) |
| 15 Years | 62 (81.6%) | 30 (75.0%) |
| 16 and 17 Years | 37 (86.1%) | 124 (100.0%) |
| 18 to 24 Years | 158 (95.8%) | 293 (73.4%) |
| 25 to 34 Years | 184 (76.7%) | 414 (100.0%) |
| 35 to 44 Years | 562 (90.1%) | 509 (78.7%) |
| 45 to 54 Years | 499 (88.2%) | 560 (96.9%) |
| 55 to 64 Years | 655 (98.6%) | 773 (93.7%) |
| 65 to 74 Years | 419 (99.5%) | 430 (92.5%) |
| 75 Years and over | 204 (98.6%) | 258 (93.5%) |
| Total | 3,434 (92.4%) | 4,712 (92.2%) |
Income Below Poverty Among Married-Couple Families in Gibsonville
The poverty statistics for married-couple families in Gibsonville show that 5.0% or 95 of the total 1,920 families live below the poverty line. Families with 1 or 2 children have the highest poverty rate of 12.3%, comprising of 76 families. On the other hand, families with 3 or 4 children have the lowest poverty rate of 0.0%, which includes 0 families.
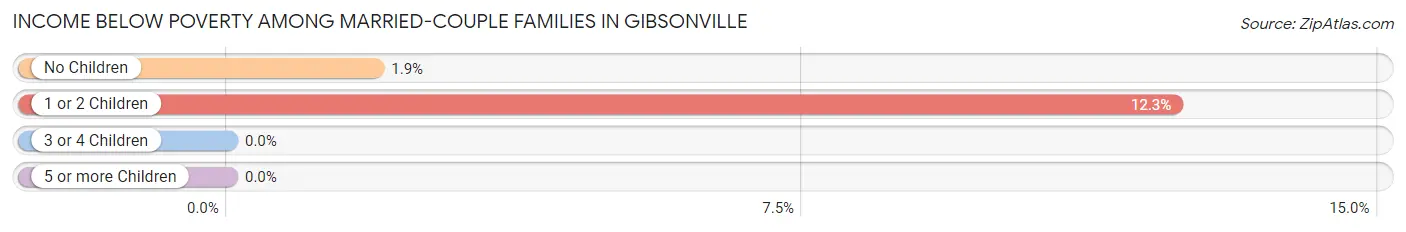
| Children | Above Poverty | Below Poverty |
| No Children | 977 (98.1%) | 19 (1.9%) |
| 1 or 2 Children | 540 (87.7%) | 76 (12.3%) |
| 3 or 4 Children | 225 (100.0%) | 0 (0.0%) |
| 5 or more Children | 83 (100.0%) | 0 (0.0%) |
| Total | 1,825 (95.1%) | 95 (5.0%) |
Income Below Poverty Among Single-Parent Households in Gibsonville
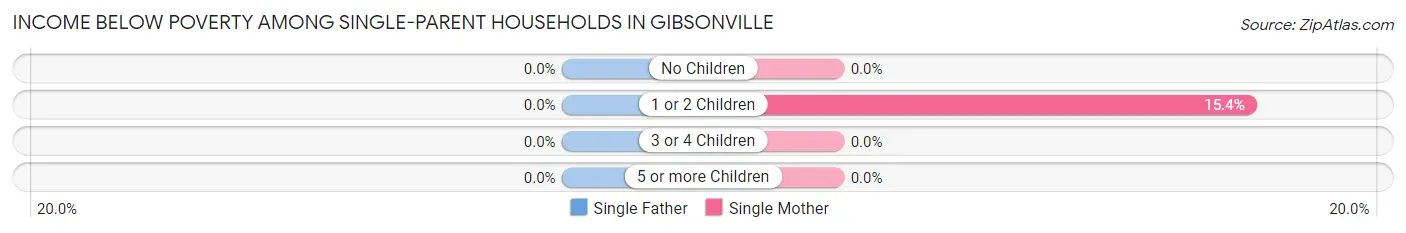
| Children | Single Father | Single Mother |
| No Children | 0 (0.0%) | 0 (0.0%) |
| 1 or 2 Children | 0 (0.0%) | 24 (15.4%) |
| 3 or 4 Children | 0 (0.0%) | 0 (0.0%) |
| 5 or more Children | 0 (0.0%) | 0 (0.0%) |
| Total | 0 (0.0%) | 24 (8.8%) |
Income Below Poverty Among Married-Couple vs Single-Parent Households in Gibsonville
The poverty data for Gibsonville shows that 95 of the married-couple family households (5.0%) and 24 of the single-parent households (6.9%) are living below the poverty level. Within the married-couple family households, those with 1 or 2 children have the highest poverty rate, with 76 households (12.3%) falling below the poverty line. Among the single-parent households, those with 1 or 2 children have the highest poverty rate, with 24 household (13.6%) living below poverty.
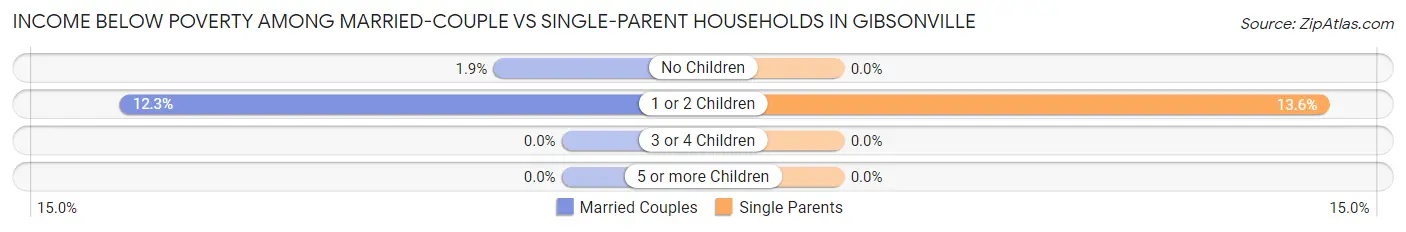
| Children | Married-Couple Families | Single-Parent Households |
| No Children | 19 (1.9%) | 0 (0.0%) |
| 1 or 2 Children | 76 (12.3%) | 24 (13.6%) |
| 3 or 4 Children | 0 (0.0%) | 0 (0.0%) |
| 5 or more Children | 0 (0.0%) | 0 (0.0%) |
| Total | 95 (5.0%) | 24 (6.9%) |
Race in Gibsonville
The most populous races in Gibsonville are White / Caucasian (6,009 | 68.1%), Black / African American (2,620 | 29.7%), and Two or more Races (105 | 1.2%).
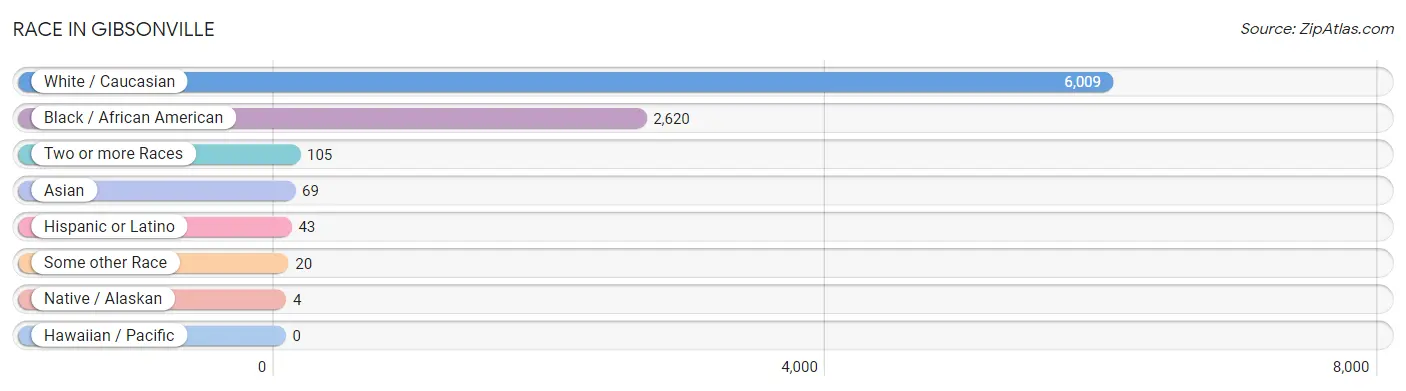
| Race | # Population | % Population |
| Asian | 69 | 0.8% |
| Black / African American | 2,620 | 29.7% |
| Hawaiian / Pacific | 0 | 0.0% |
| Hispanic or Latino | 43 | 0.5% |
| Native / Alaskan | 4 | 0.1% |
| White / Caucasian | 6,009 | 68.1% |
| Two or more Races | 105 | 1.2% |
| Some other Race | 20 | 0.2% |
| Total | 8,827 | 100.0% |
Ancestry in Gibsonville
The most populous ancestries reported in Gibsonville are English (1,253 | 14.2%), German (853 | 9.7%), Irish (750 | 8.5%), Scotch-Irish (484 | 5.5%), and Italian (444 | 5.0%), together accounting for 42.9% of all Gibsonville residents.
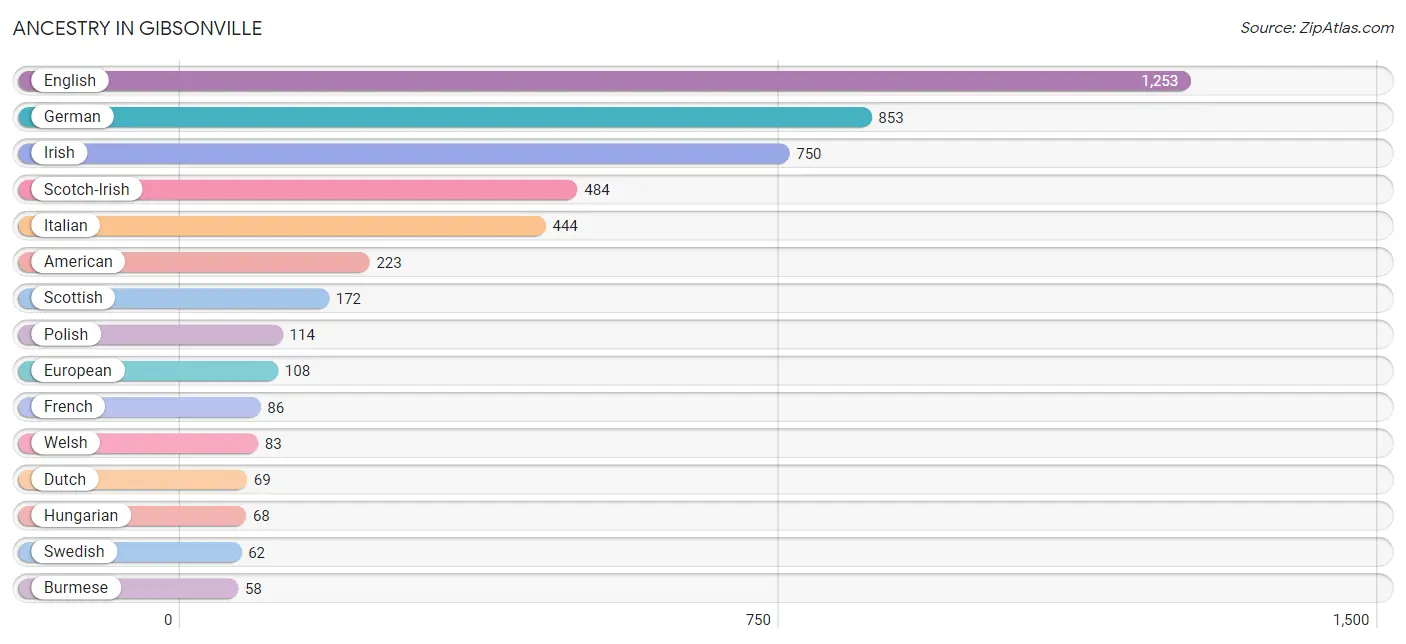
| Ancestry | # Population | % Population |
| American | 223 | 2.5% |
| Blackfeet | 6 | 0.1% |
| British | 38 | 0.4% |
| Bulgarian | 22 | 0.3% |
| Burmese | 58 | 0.7% |
| Celtic | 22 | 0.3% |
| Cherokee | 28 | 0.3% |
| Croatian | 17 | 0.2% |
| Dutch | 69 | 0.8% |
| English | 1,253 | 14.2% |
| European | 108 | 1.2% |
| Finnish | 38 | 0.4% |
| French | 86 | 1.0% |
| French Canadian | 36 | 0.4% |
| German | 853 | 9.7% |
| Greek | 8 | 0.1% |
| Hungarian | 68 | 0.8% |
| Indian (Asian) | 17 | 0.2% |
| Iranian | 22 | 0.3% |
| Irish | 750 | 8.5% |
| Iroquois | 5 | 0.1% |
| Italian | 444 | 5.0% |
| Korean | 26 | 0.3% |
| Mexican | 20 | 0.2% |
| Native Hawaiian | 21 | 0.2% |
| Northern European | 46 | 0.5% |
| Norwegian | 27 | 0.3% |
| Polish | 114 | 1.3% |
| Puerto Rican | 23 | 0.3% |
| Russian | 7 | 0.1% |
| Scandinavian | 15 | 0.2% |
| Scotch-Irish | 484 | 5.5% |
| Scottish | 172 | 1.9% |
| Swedish | 62 | 0.7% |
| Thai | 26 | 0.3% |
| Ukrainian | 51 | 0.6% |
| Welsh | 83 | 0.9% | View All 37 Rows |
Immigrants in Gibsonville
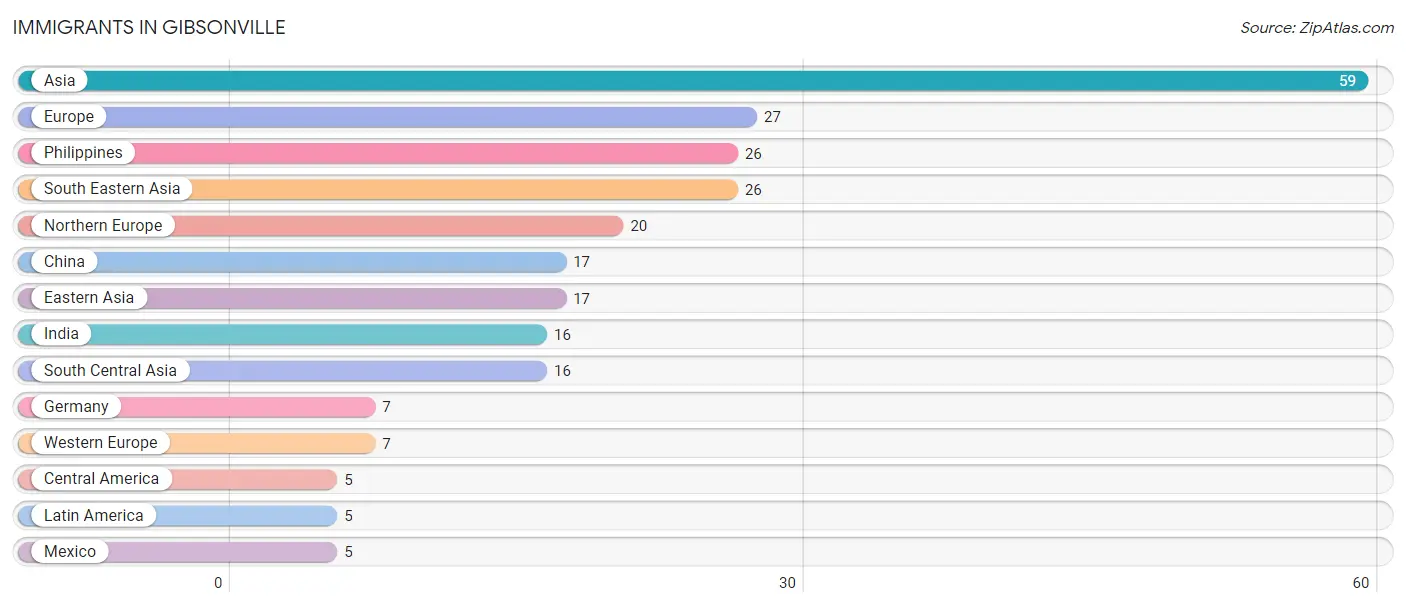
The most numerous immigrant groups reported in Gibsonville came from Asia (59 | 0.7%), Europe (27 | 0.3%), Philippines (26 | 0.3%), South Eastern Asia (26 | 0.3%), and Northern Europe (20 | 0.2%), together accounting for 1.8% of all Gibsonville residents.
| Immigration Origin | # Population | % Population |
| Asia | 59 | 0.7% |
| Central America | 5 | 0.1% |
| China | 17 | 0.2% |
| Eastern Asia | 17 | 0.2% |
| Europe | 27 | 0.3% |
| Germany | 7 | 0.1% |
| India | 16 | 0.2% |
| Latin America | 5 | 0.1% |
| Mexico | 5 | 0.1% |
| Northern Europe | 20 | 0.2% |
| Philippines | 26 | 0.3% |
| South Central Asia | 16 | 0.2% |
| South Eastern Asia | 26 | 0.3% |
| Western Europe | 7 | 0.1% | View All 14 Rows |
Sex and Age in Gibsonville
Sex and Age in Gibsonville
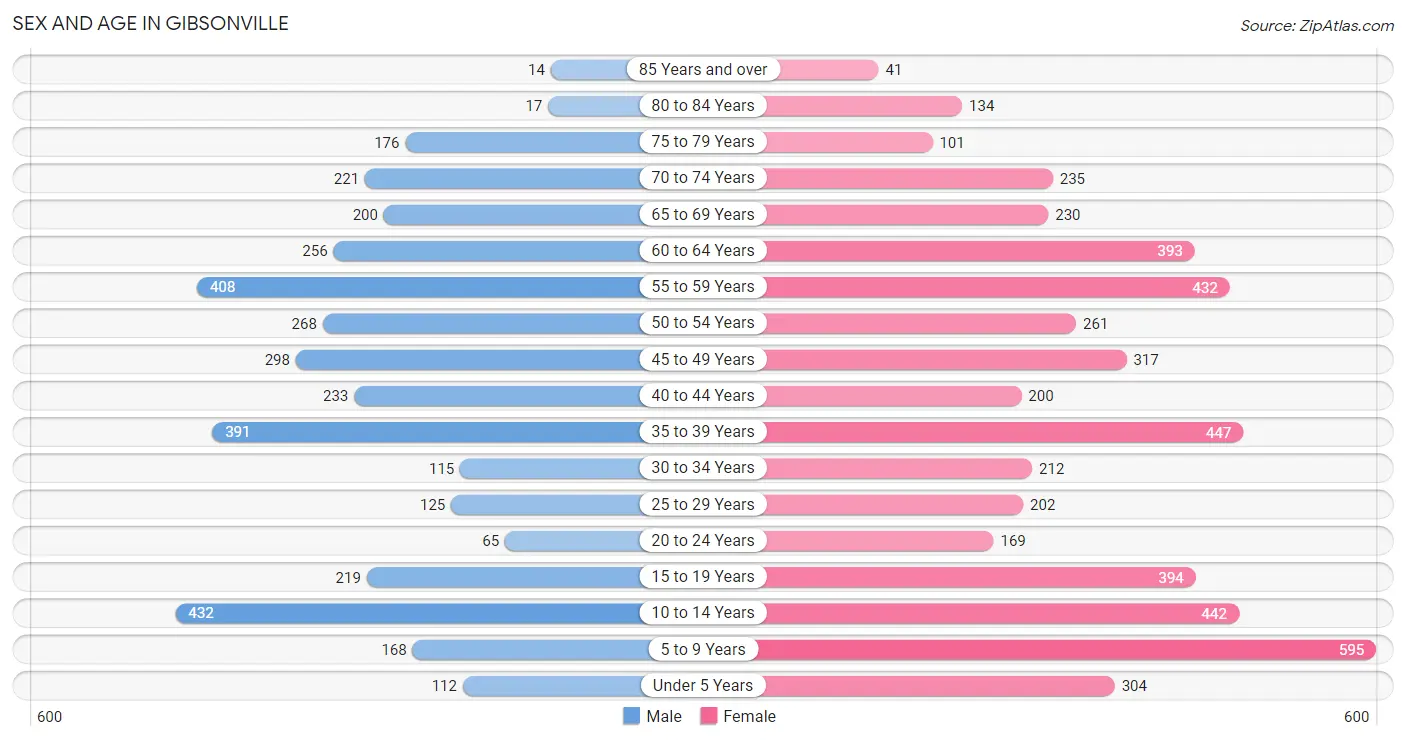
The most populous age groups in Gibsonville are 10 to 14 Years (432 | 11.6%) for men and 5 to 9 Years (595 | 11.7%) for women.
| Age Bracket | Male | Female |
| Under 5 Years | 112 (3.0%) | 304 (5.9%) |
| 5 to 9 Years | 168 (4.5%) | 595 (11.7%) |
| 10 to 14 Years | 432 (11.6%) | 442 (8.6%) |
| 15 to 19 Years | 219 (5.9%) | 394 (7.7%) |
| 20 to 24 Years | 65 (1.8%) | 169 (3.3%) |
| 25 to 29 Years | 125 (3.4%) | 202 (4.0%) |
| 30 to 34 Years | 115 (3.1%) | 212 (4.2%) |
| 35 to 39 Years | 391 (10.5%) | 447 (8.7%) |
| 40 to 44 Years | 233 (6.3%) | 200 (3.9%) |
| 45 to 49 Years | 298 (8.0%) | 317 (6.2%) |
| 50 to 54 Years | 268 (7.2%) | 261 (5.1%) |
| 55 to 59 Years | 408 (11.0%) | 432 (8.5%) |
| 60 to 64 Years | 256 (6.9%) | 393 (7.7%) |
| 65 to 69 Years | 200 (5.4%) | 230 (4.5%) |
| 70 to 74 Years | 221 (5.9%) | 235 (4.6%) |
| 75 to 79 Years | 176 (4.7%) | 101 (2.0%) |
| 80 to 84 Years | 17 (0.5%) | 134 (2.6%) |
| 85 Years and over | 14 (0.4%) | 41 (0.8%) |
| Total | 3,718 (100.0%) | 5,109 (100.0%) |
Families and Households in Gibsonville
Median Family Size in Gibsonville
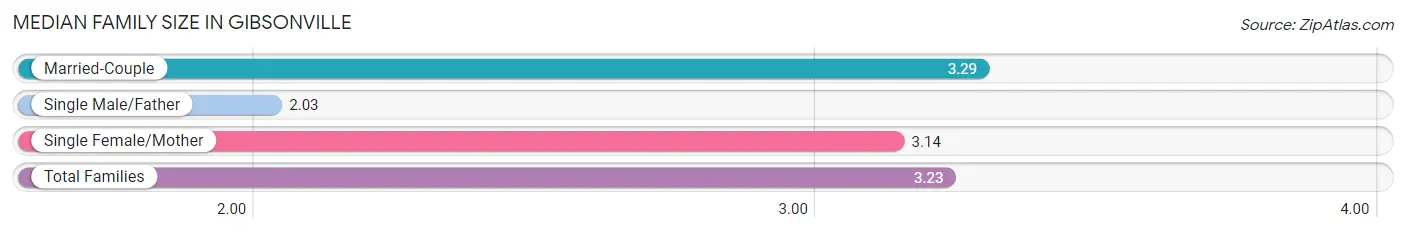
The median family size in Gibsonville is 3.23 persons per family, with married-couple families (1,920 | 84.7%) accounting for the largest median family size of 3.29 persons per family. On the other hand, single male/father families (72 | 3.2%) represent the smallest median family size with 2.03 persons per family.
| Family Type | # Families | Family Size |
| Married-Couple | 1,920 (84.7%) | 3.29 |
| Single Male/Father | 72 (3.2%) | 2.03 |
| Single Female/Mother | 274 (12.1%) | 3.14 |
| Total Families | 2,266 (100.0%) | 3.23 |
Median Household Size in Gibsonville
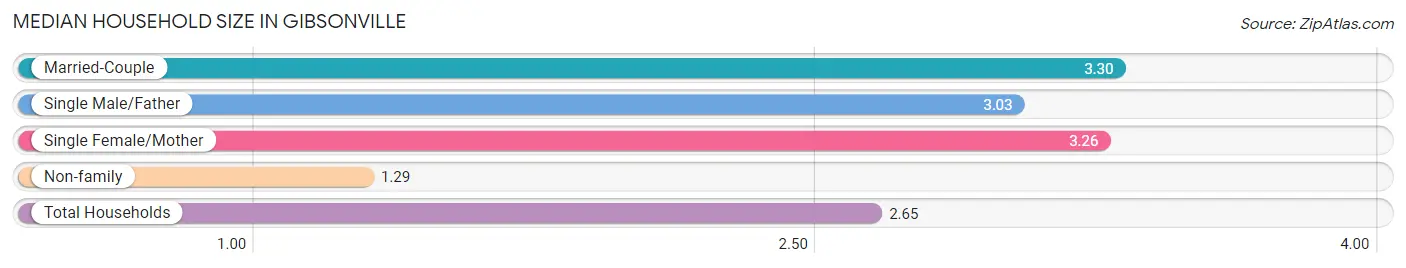
The median household size in Gibsonville is 2.65 persons per household, with married-couple households (1,920 | 57.8%) accounting for the largest median household size of 3.3 persons per household. non-family households (1,055 | 31.8%) represent the smallest median household size with 1.29 persons per household.
| Household Type | # Households | Household Size |
| Married-Couple | 1,920 (57.8%) | 3.30 |
| Single Male/Father | 72 (2.2%) | 3.03 |
| Single Female/Mother | 274 (8.3%) | 3.26 |
| Non-family | 1,055 (31.8%) | 1.29 |
| Total Households | 3,321 (100.0%) | 2.65 |
Household Size by Marriage Status in Gibsonville
Out of a total of 3,321 households in Gibsonville, 2,266 (68.2%) are family households, while 1,055 (31.8%) are nonfamily households. The most numerous type of family households are 2-person households, comprising 921, and the most common type of nonfamily households are 1-person households, comprising 845.
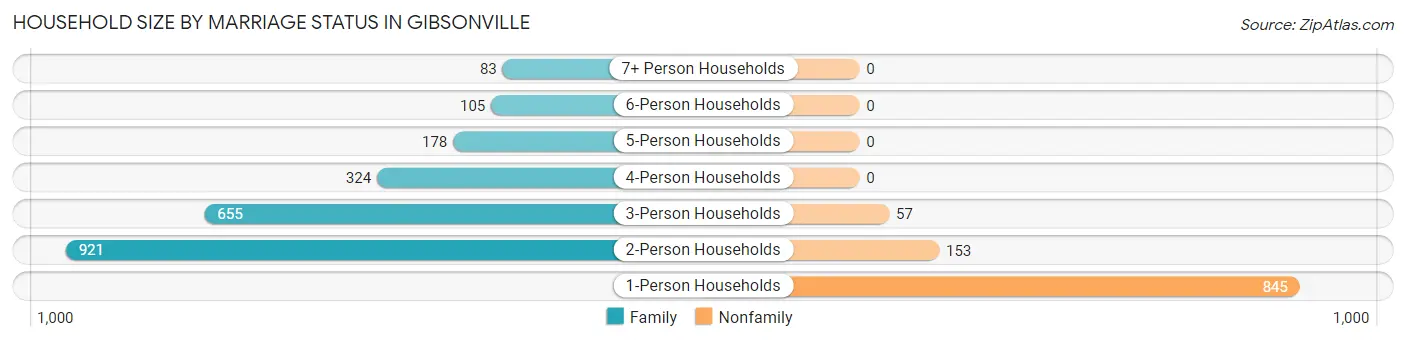
| Household Size | Family Households | Nonfamily Households |
| 1-Person Households | - | 845 (25.4%) |
| 2-Person Households | 921 (27.7%) | 153 (4.6%) |
| 3-Person Households | 655 (19.7%) | 57 (1.7%) |
| 4-Person Households | 324 (9.8%) | 0 (0.0%) |
| 5-Person Households | 178 (5.4%) | 0 (0.0%) |
| 6-Person Households | 105 (3.2%) | 0 (0.0%) |
| 7+ Person Households | 83 (2.5%) | 0 (0.0%) |
| Total | 2,266 (68.2%) | 1,055 (31.8%) |
Female Fertility in Gibsonville
Fertility by Age in Gibsonville
Average fertility rate in Gibsonville is 35.0 births per 1,000 women. Women in the age bracket of 20 to 34 years have the highest fertility rate with 103.0 births per 1,000 women. Women in the age bracket of 20 to 34 years acount for 84.5% of all women with births.
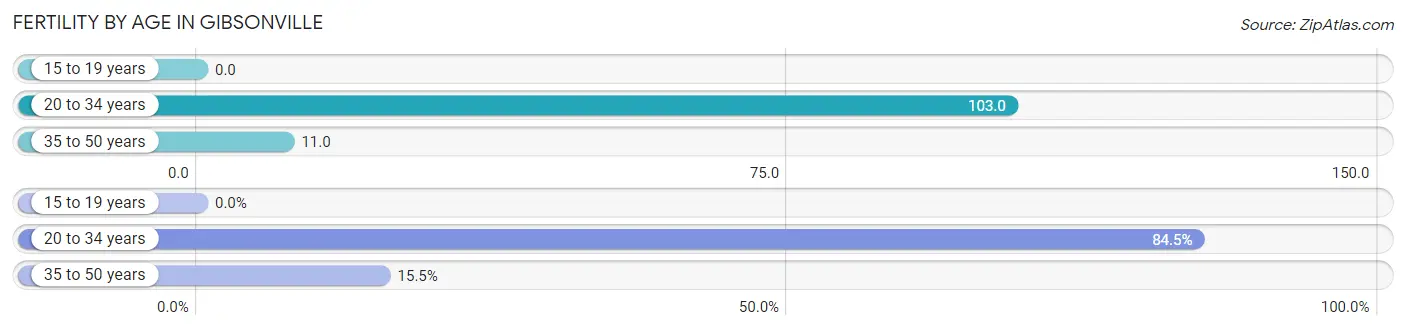
| Age Bracket | Women with Births | Births / 1,000 Women |
| 15 to 19 years | 0 (0.0%) | 0.0 |
| 20 to 34 years | 60 (84.5%) | 103.0 |
| 35 to 50 years | 11 (15.5%) | 11.0 |
| Total | 71 (100.0%) | 35.0 |
Fertility by Age by Marriage Status in Gibsonville
78.9% of women with births (71) in Gibsonville are married. The highest percentage of unmarried women with births falls into 20 to 34 years age bracket with 25.0% of them unmarried at the time of birth, while the lowest percentage of unmarried women with births belong to 35 to 50 years age bracket with 0.0% of them unmarried.
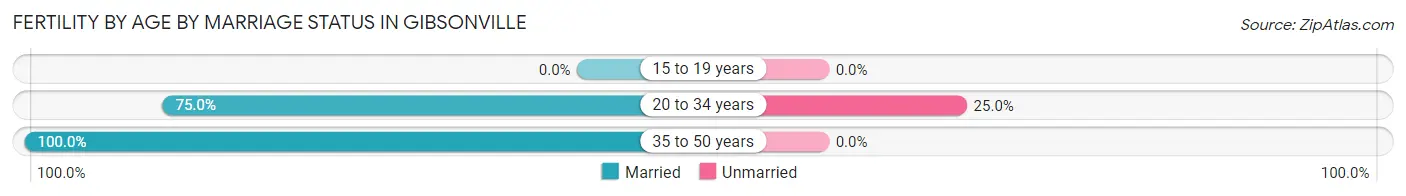
| Age Bracket | Married | Unmarried |
| 15 to 19 years | 0 (0.0%) | 0 (0.0%) |
| 20 to 34 years | 45 (75.0%) | 15 (25.0%) |
| 35 to 50 years | 11 (100.0%) | 0 (0.0%) |
| Total | 56 (78.9%) | 15 (21.1%) |
Fertility by Education in Gibsonville
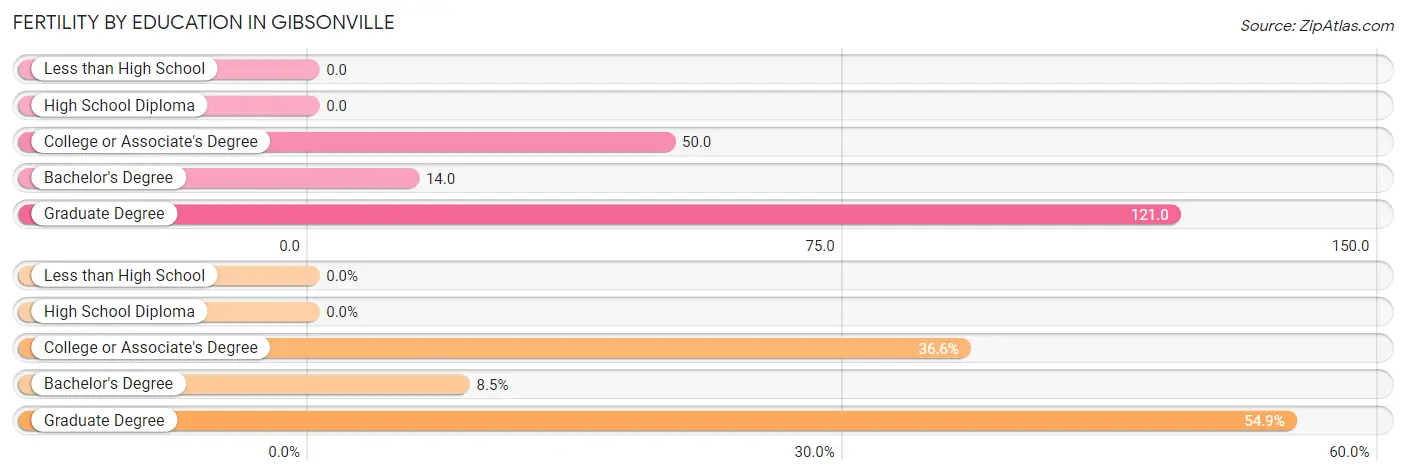
| Educational Attainment | Women with Births | Births / 1,000 Women |
| Less than High School | 0 (0.0%) | 0.0 |
| High School Diploma | 0 (0.0%) | 0.0 |
| College or Associate's Degree | 26 (36.6%) | 50.0 |
| Bachelor's Degree | 6 (8.5%) | 14.0 |
| Graduate Degree | 39 (54.9%) | 121.0 |
| Total | 71 (100.0%) | 35.0 |
Fertility by Education by Marriage Status in Gibsonville
21.1% of women with births in Gibsonville are unmarried. Women with the educational attainment of bachelor's degree are most likely to be married with 100.0% of them married at childbirth, while women with the educational attainment of college or associate's degree are least likely to be married with 57.7% of them unmarried at childbirth.
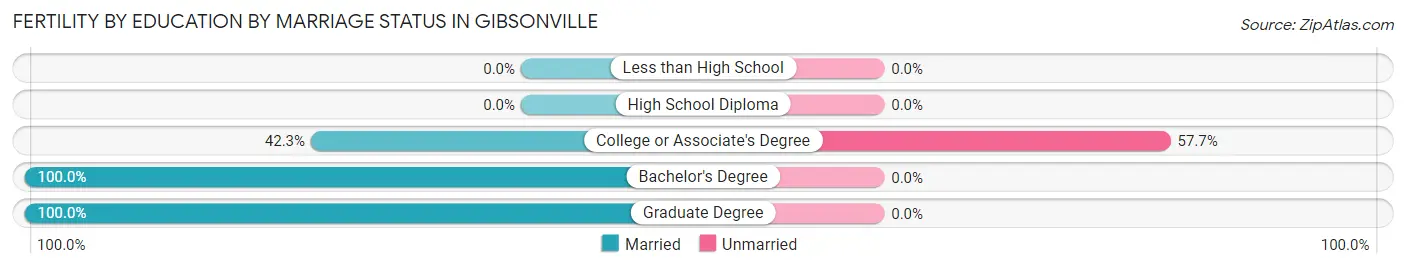
| Educational Attainment | Married | Unmarried |
| Less than High School | 0 (0.0%) | 0 (0.0%) |
| High School Diploma | 0 (0.0%) | 0 (0.0%) |
| College or Associate's Degree | 11 (42.3%) | 15 (57.7%) |
| Bachelor's Degree | 6 (100.0%) | 0 (0.0%) |
| Graduate Degree | 39 (100.0%) | 0 (0.0%) |
| Total | 56 (78.9%) | 15 (21.1%) |
Employment Characteristics in Gibsonville
Employment by Class of Employer in Gibsonville
Among the 4,381 employed individuals in Gibsonville, private company employees (2,794 | 63.8%), state government employees (377 | 8.6%), and local government employees (369 | 8.4%) make up the most common classes of employment.
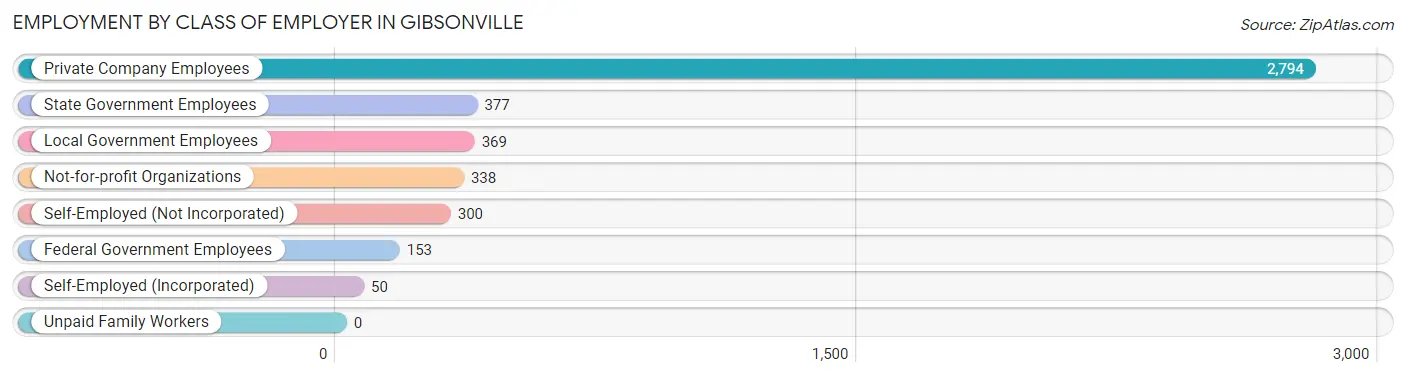
| Employer Class | # Employees | % Employees |
| Private Company Employees | 2,794 | 63.8% |
| Self-Employed (Incorporated) | 50 | 1.1% |
| Self-Employed (Not Incorporated) | 300 | 6.9% |
| Not-for-profit Organizations | 338 | 7.7% |
| Local Government Employees | 369 | 8.4% |
| State Government Employees | 377 | 8.6% |
| Federal Government Employees | 153 | 3.5% |
| Unpaid Family Workers | 0 | 0.0% |
| Total | 4,381 | 100.0% |
Employment Status by Age in Gibsonville
According to the labor force statistics for Gibsonville, out of the total population over 16 years of age (6,658), 68.5% or 4,561 individuals are in the labor force, with 2.4% or 109 of them unemployed. The age group with the highest labor force participation rate is 20 to 24 years, with 93.6% or 219 individuals in the labor force. Within the labor force, the 65 to 74 years age range has the highest percentage of unemployed individuals, with 11.3% or 21 of them being unemployed.
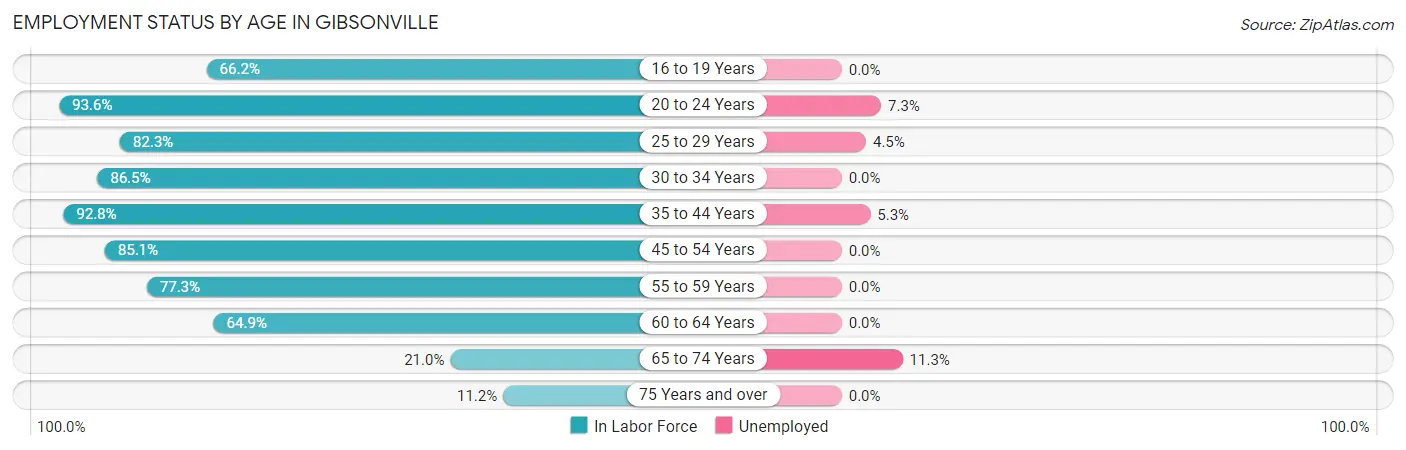
| Age Bracket | In Labor Force | Unemployed |
| 16 to 19 Years | 329 (66.2%) | 0 (0.0%) |
| 20 to 24 Years | 219 (93.6%) | 16 (7.3%) |
| 25 to 29 Years | 269 (82.3%) | 12 (4.5%) |
| 30 to 34 Years | 283 (86.5%) | 0 (0.0%) |
| 35 to 44 Years | 1,179 (92.8%) | 62 (5.3%) |
| 45 to 54 Years | 974 (85.1%) | 0 (0.0%) |
| 55 to 59 Years | 649 (77.3%) | 0 (0.0%) |
| 60 to 64 Years | 421 (64.9%) | 0 (0.0%) |
| 65 to 74 Years | 186 (21.0%) | 21 (11.3%) |
| 75 Years and over | 54 (11.2%) | 0 (0.0%) |
| Total | 4,561 (68.5%) | 109 (2.4%) |
Employment Status by Educational Attainment in Gibsonville
According to labor force statistics for Gibsonville, 82.8% of individuals (3,774) out of the total population between 25 and 64 years of age (4,558) are in the labor force, with 2.0% or 75 of them being unemployed. The group with the highest labor force participation rate are those with the educational attainment of bachelor's degree or higher, with 86.8% or 1,443 individuals in the labor force. Within the labor force, individuals with high school diploma education have the highest percentage of unemployment, with 8.5% or 59 of them being unemployed.
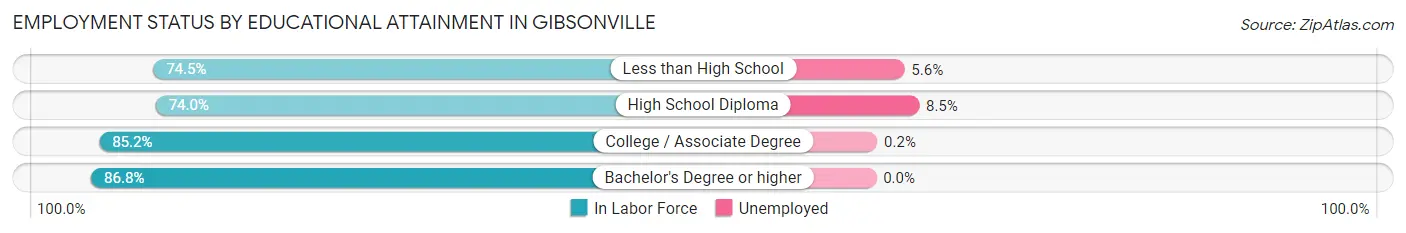
| Educational Attainment | In Labor Force | Unemployed |
| Less than High School | 216 (74.5%) | 16 (5.6%) |
| High School Diploma | 694 (74.0%) | 80 (8.5%) |
| College / Associate Degree | 1,420 (85.2%) | 3 (0.2%) |
| Bachelor's Degree or higher | 1,443 (86.8%) | 0 (0.0%) |
| Total | 3,774 (82.8%) | 91 (2.0%) |
Employment Occupations by Sex in Gibsonville
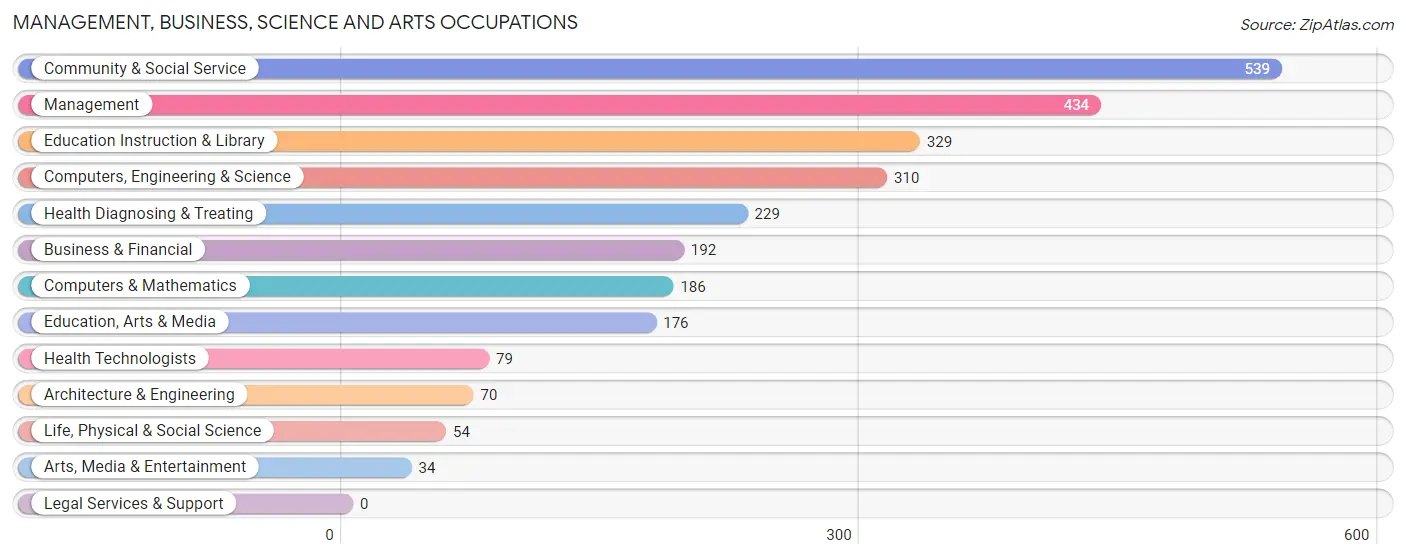
Management, Business, Science and Arts Occupations
The most common Management, Business, Science and Arts occupations in Gibsonville are Community & Social Service (539 | 12.1%), Management (434 | 9.8%), Education Instruction & Library (329 | 7.4%), Computers, Engineering & Science (310 | 7.0%), and Health Diagnosing & Treating (229 | 5.1%).
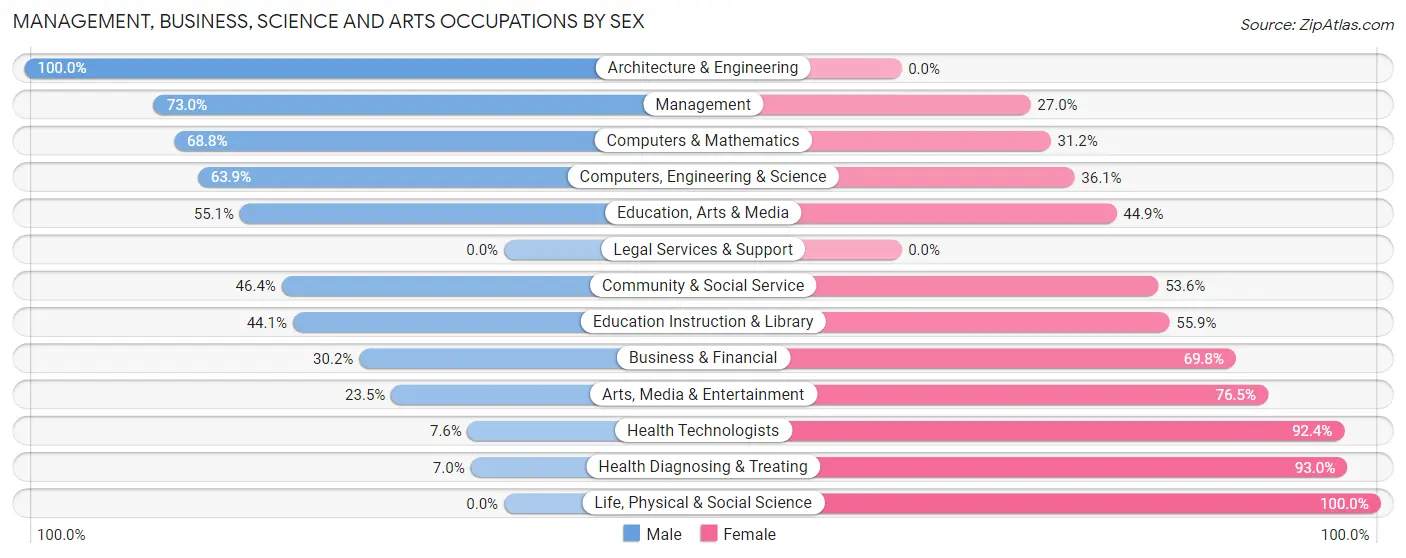
Management, Business, Science and Arts Occupations by Sex
Within the Management, Business, Science and Arts occupations in Gibsonville, the most male-oriented occupations are Architecture & Engineering (100.0%), Management (73.0%), and Computers & Mathematics (68.8%), while the most female-oriented occupations are Life, Physical & Social Science (100.0%), Health Diagnosing & Treating (93.0%), and Health Technologists (92.4%).
| Occupation | Male | Female |
| Management | 317 (73.0%) | 117 (27.0%) |
| Business & Financial | 58 (30.2%) | 134 (69.8%) |
| Computers, Engineering & Science | 198 (63.9%) | 112 (36.1%) |
| Computers & Mathematics | 128 (68.8%) | 58 (31.2%) |
| Architecture & Engineering | 70 (100.0%) | 0 (0.0%) |
| Life, Physical & Social Science | 0 (0.0%) | 54 (100.0%) |
| Community & Social Service | 250 (46.4%) | 289 (53.6%) |
| Education, Arts & Media | 97 (55.1%) | 79 (44.9%) |
| Legal Services & Support | 0 (0.0%) | 0 (0.0%) |
| Education Instruction & Library | 145 (44.1%) | 184 (55.9%) |
| Arts, Media & Entertainment | 8 (23.5%) | 26 (76.5%) |
| Health Diagnosing & Treating | 16 (7.0%) | 213 (93.0%) |
| Health Technologists | 6 (7.6%) | 73 (92.4%) |
| Total (Category) | 839 (49.2%) | 865 (50.8%) |
| Total (Overall) | 2,038 (45.8%) | 2,413 (54.2%) |
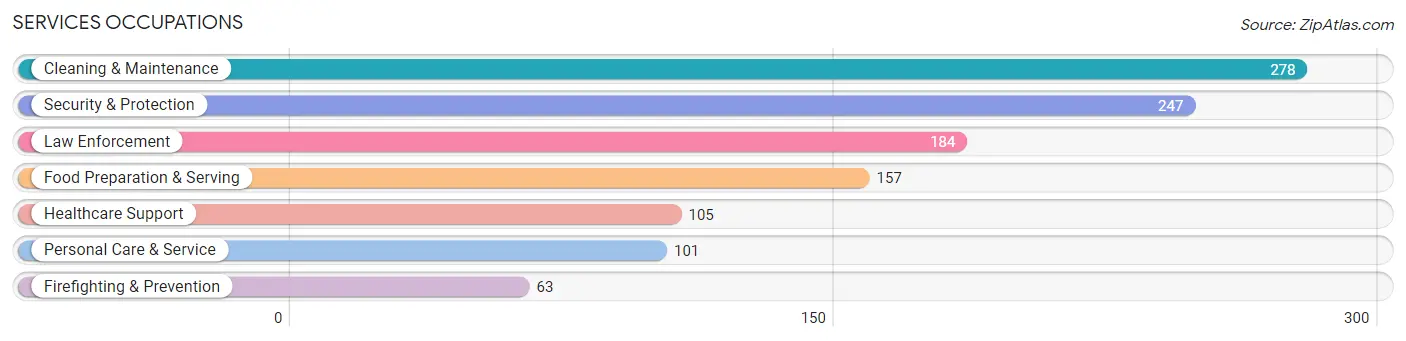
Services Occupations
The most common Services occupations in Gibsonville are Cleaning & Maintenance (278 | 6.2%), Security & Protection (247 | 5.6%), Law Enforcement (184 | 4.1%), Food Preparation & Serving (157 | 3.5%), and Healthcare Support (105 | 2.4%).
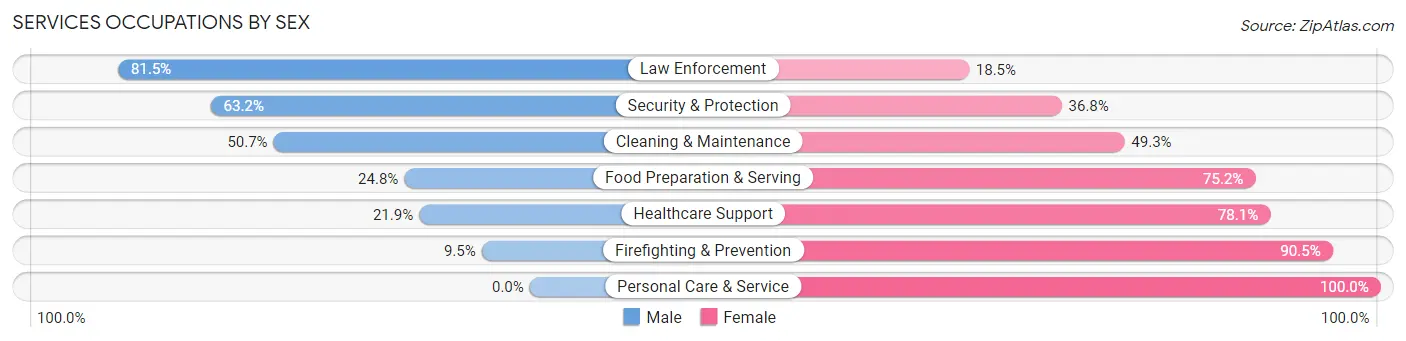
Services Occupations by Sex
Within the Services occupations in Gibsonville, the most male-oriented occupations are Law Enforcement (81.5%), Security & Protection (63.2%), and Cleaning & Maintenance (50.7%), while the most female-oriented occupations are Personal Care & Service (100.0%), Firefighting & Prevention (90.5%), and Healthcare Support (78.1%).
| Occupation | Male | Female |
| Healthcare Support | 23 (21.9%) | 82 (78.1%) |
| Security & Protection | 156 (63.2%) | 91 (36.8%) |
| Firefighting & Prevention | 6 (9.5%) | 57 (90.5%) |
| Law Enforcement | 150 (81.5%) | 34 (18.5%) |
| Food Preparation & Serving | 39 (24.8%) | 118 (75.2%) |
| Cleaning & Maintenance | 141 (50.7%) | 137 (49.3%) |
| Personal Care & Service | 0 (0.0%) | 101 (100.0%) |
| Total (Category) | 359 (40.4%) | 529 (59.6%) |
| Total (Overall) | 2,038 (45.8%) | 2,413 (54.2%) |
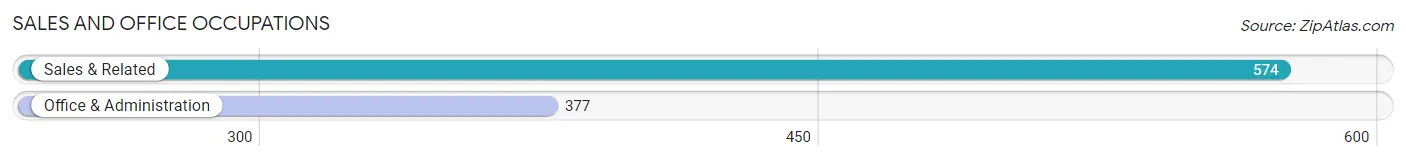
Sales and Office Occupations
The most common Sales and Office occupations in Gibsonville are Sales & Related (574 | 12.9%), and Office & Administration (377 | 8.5%).
Sales and Office Occupations by Sex
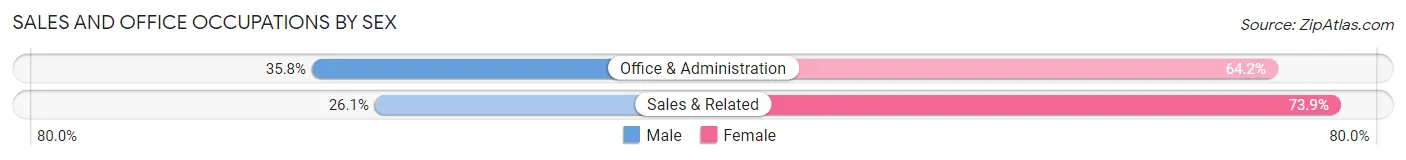
| Occupation | Male | Female |
| Sales & Related | 150 (26.1%) | 424 (73.9%) |
| Office & Administration | 135 (35.8%) | 242 (64.2%) |
| Total (Category) | 285 (30.0%) | 666 (70.0%) |
| Total (Overall) | 2,038 (45.8%) | 2,413 (54.2%) |
Natural Resources, Construction and Maintenance Occupations
The most common Natural Resources, Construction and Maintenance occupations in Gibsonville are Installation, Maintenance & Repair (208 | 4.7%), and Construction & Extraction (89 | 2.0%).

Natural Resources, Construction and Maintenance Occupations by Sex
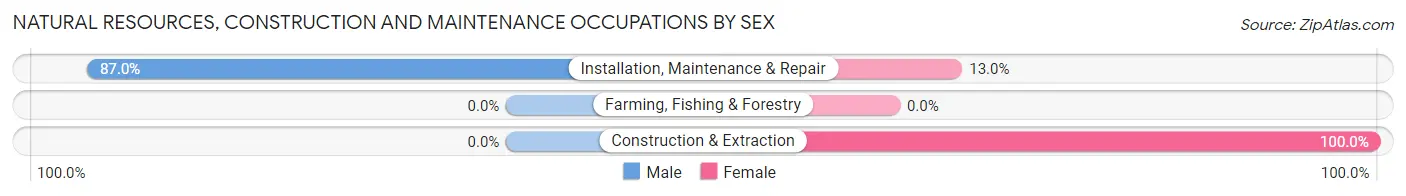
| Occupation | Male | Female |
| Farming, Fishing & Forestry | 0 (0.0%) | 0 (0.0%) |
| Construction & Extraction | 0 (0.0%) | 89 (100.0%) |
| Installation, Maintenance & Repair | 181 (87.0%) | 27 (13.0%) |
| Total (Category) | 181 (60.9%) | 116 (39.1%) |
| Total (Overall) | 2,038 (45.8%) | 2,413 (54.2%) |
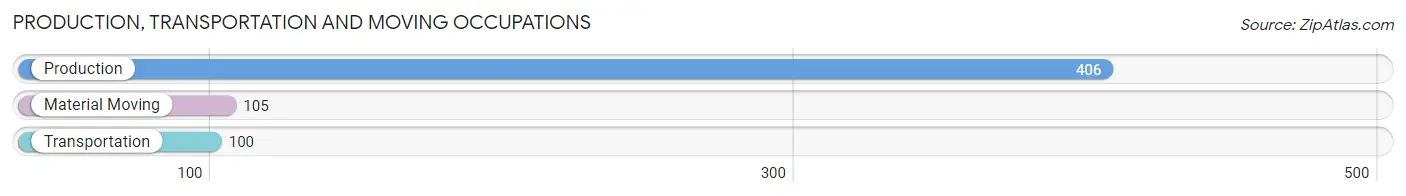
Production, Transportation and Moving Occupations
The most common Production, Transportation and Moving occupations in Gibsonville are Production (406 | 9.1%), Material Moving (105 | 2.4%), and Transportation (100 | 2.2%).
Production, Transportation and Moving Occupations by Sex
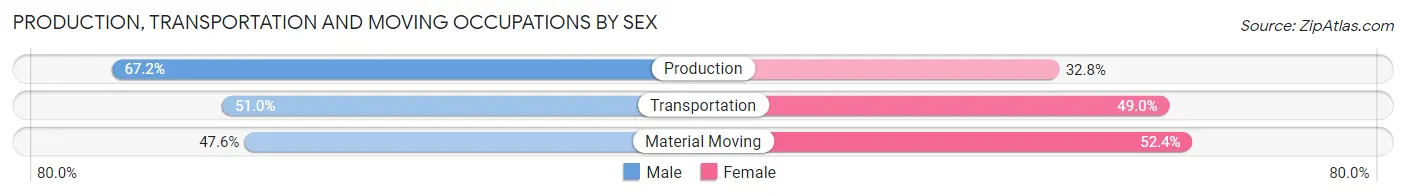
| Occupation | Male | Female |
| Production | 273 (67.2%) | 133 (32.8%) |
| Transportation | 51 (51.0%) | 49 (49.0%) |
| Material Moving | 50 (47.6%) | 55 (52.4%) |
| Total (Category) | 374 (61.2%) | 237 (38.8%) |
| Total (Overall) | 2,038 (45.8%) | 2,413 (54.2%) |
Employment Industries by Sex in Gibsonville
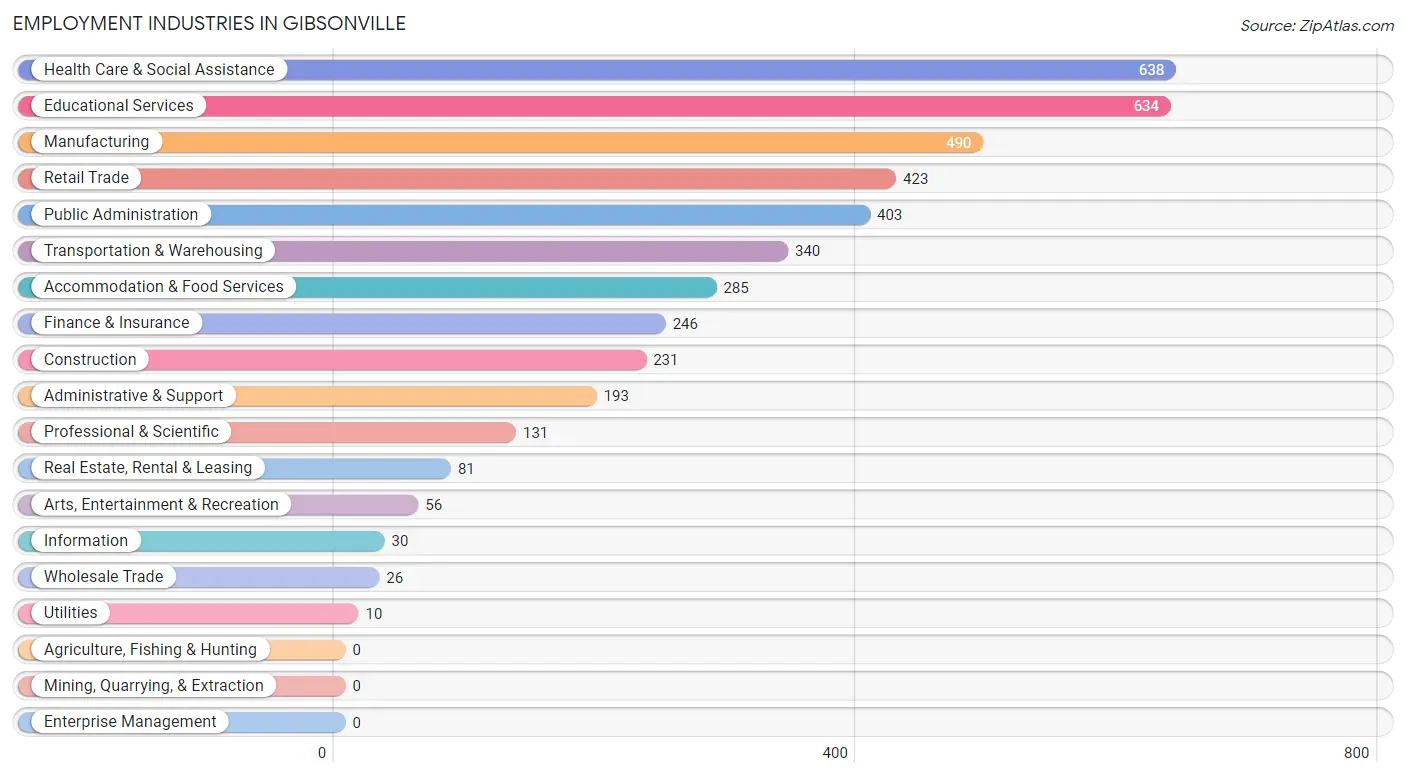
Employment Industries in Gibsonville
The major employment industries in Gibsonville include Health Care & Social Assistance (638 | 14.3%), Educational Services (634 | 14.2%), Manufacturing (490 | 11.0%), Retail Trade (423 | 9.5%), and Public Administration (403 | 9.0%).
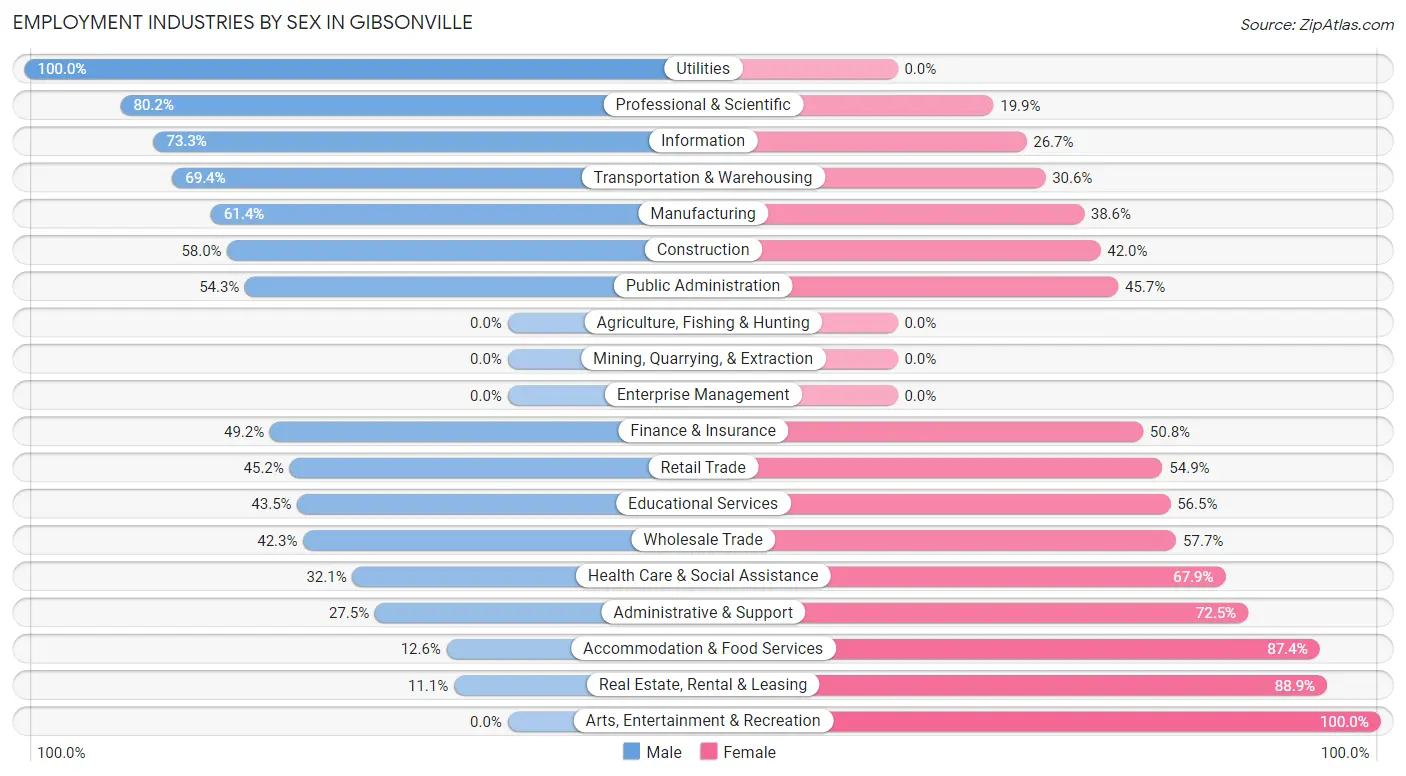
Employment Industries by Sex in Gibsonville
The Gibsonville industries that see more men than women are Utilities (100.0%), Professional & Scientific (80.1%), and Information (73.3%), whereas the industries that tend to have a higher number of women are Arts, Entertainment & Recreation (100.0%), Real Estate, Rental & Leasing (88.9%), and Accommodation & Food Services (87.4%).
| Industry | Male | Female |
| Agriculture, Fishing & Hunting | 0 (0.0%) | 0 (0.0%) |
| Mining, Quarrying, & Extraction | 0 (0.0%) | 0 (0.0%) |
| Construction | 134 (58.0%) | 97 (42.0%) |
| Manufacturing | 301 (61.4%) | 189 (38.6%) |
| Wholesale Trade | 11 (42.3%) | 15 (57.7%) |
| Retail Trade | 191 (45.2%) | 232 (54.8%) |
| Transportation & Warehousing | 236 (69.4%) | 104 (30.6%) |
| Utilities | 10 (100.0%) | 0 (0.0%) |
| Information | 22 (73.3%) | 8 (26.7%) |
| Finance & Insurance | 121 (49.2%) | 125 (50.8%) |
| Real Estate, Rental & Leasing | 9 (11.1%) | 72 (88.9%) |
| Professional & Scientific | 105 (80.1%) | 26 (19.9%) |
| Enterprise Management | 0 (0.0%) | 0 (0.0%) |
| Administrative & Support | 53 (27.5%) | 140 (72.5%) |
| Educational Services | 276 (43.5%) | 358 (56.5%) |
| Health Care & Social Assistance | 205 (32.1%) | 433 (67.9%) |
| Arts, Entertainment & Recreation | 0 (0.0%) | 56 (100.0%) |
| Accommodation & Food Services | 36 (12.6%) | 249 (87.4%) |
| Public Administration | 219 (54.3%) | 184 (45.7%) |
| Total | 2,038 (45.8%) | 2,413 (54.2%) |
Education in Gibsonville
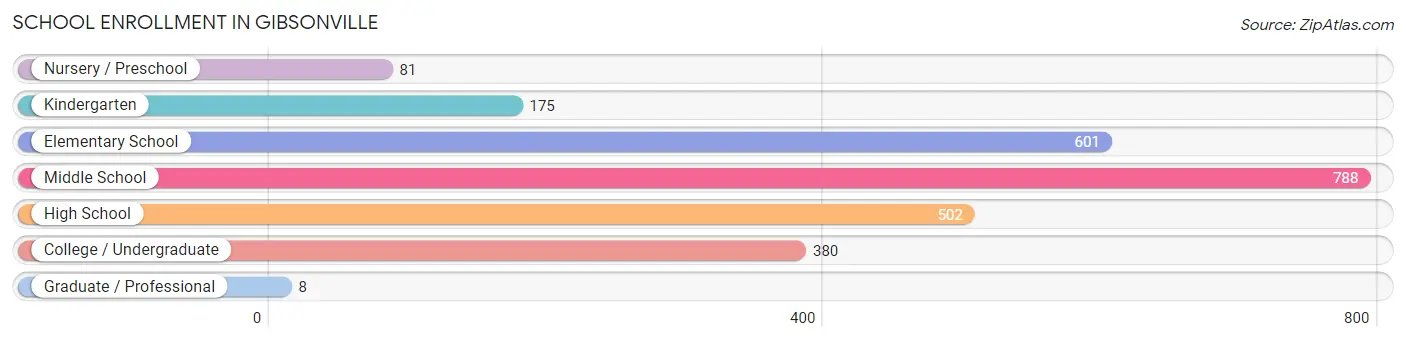
School Enrollment in Gibsonville
The most common levels of schooling among the 2,535 students in Gibsonville are middle school (788 | 31.1%), elementary school (601 | 23.7%), and high school (502 | 19.8%).
| School Level | # Students | % Students |
| Nursery / Preschool | 81 | 3.2% |
| Kindergarten | 175 | 6.9% |
| Elementary School | 601 | 23.7% |
| Middle School | 788 | 31.1% |
| High School | 502 | 19.8% |
| College / Undergraduate | 380 | 15.0% |
| Graduate / Professional | 8 | 0.3% |
| Total | 2,535 | 100.0% |
School Enrollment by Age by Funding Source in Gibsonville
Out of a total of 2,535 students who are enrolled in schools in Gibsonville, 284 (11.2%) attend a private institution, while the remaining 2,251 (88.8%) are enrolled in public schools. The age group of 3 to 4 year olds has the highest likelihood of being enrolled in private schools, with 22 (33.3% in the age bracket) enrolled. Conversely, the age group of 15 to 17 year olds has the lowest likelihood of being enrolled in a private school, with 283 (100.0% in the age bracket) attending a public institution.
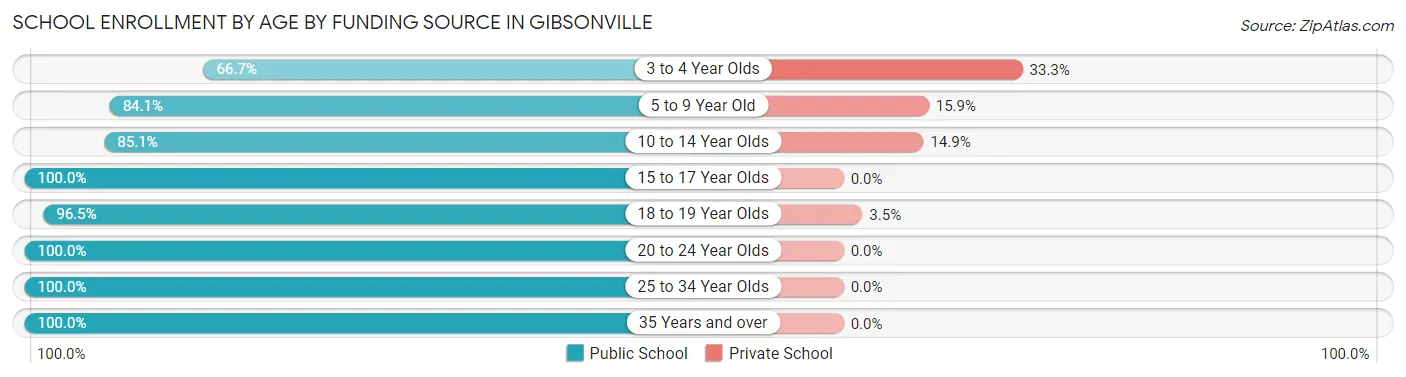
| Age Bracket | Public School | Private School |
| 3 to 4 Year Olds | 44 (66.7%) | 22 (33.3%) |
| 5 to 9 Year Old | 642 (84.1%) | 121 (15.9%) |
| 10 to 14 Year Olds | 744 (85.1%) | 130 (14.9%) |
| 15 to 17 Year Olds | 283 (100.0%) | 0 (0.0%) |
| 18 to 19 Year Olds | 304 (96.5%) | 11 (3.5%) |
| 20 to 24 Year Olds | 22 (100.0%) | 0 (0.0%) |
| 25 to 34 Year Olds | 21 (100.0%) | 0 (0.0%) |
| 35 Years and over | 191 (100.0%) | 0 (0.0%) |
| Total | 2,251 (88.8%) | 284 (11.2%) |
Educational Attainment by Field of Study in Gibsonville
Business (385 | 15.4%), education (352 | 14.1%), science & technology (319 | 12.8%), psychology (289 | 11.6%), and arts & humanities (245 | 9.8%) are the most common fields of study among 2,499 individuals in Gibsonville who have obtained a bachelor's degree or higher.
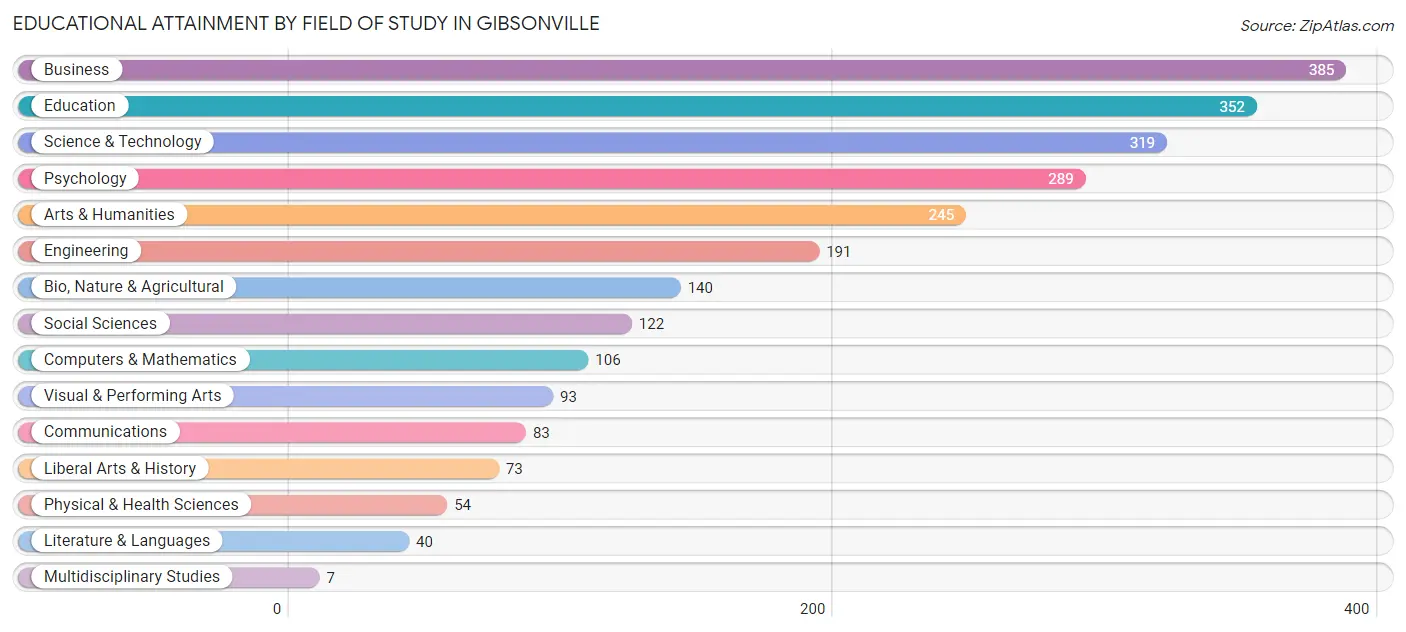
| Field of Study | # Graduates | % Graduates |
| Computers & Mathematics | 106 | 4.2% |
| Bio, Nature & Agricultural | 140 | 5.6% |
| Physical & Health Sciences | 54 | 2.2% |
| Psychology | 289 | 11.6% |
| Social Sciences | 122 | 4.9% |
| Engineering | 191 | 7.6% |
| Multidisciplinary Studies | 7 | 0.3% |
| Science & Technology | 319 | 12.8% |
| Business | 385 | 15.4% |
| Education | 352 | 14.1% |
| Literature & Languages | 40 | 1.6% |
| Liberal Arts & History | 73 | 2.9% |
| Visual & Performing Arts | 93 | 3.7% |
| Communications | 83 | 3.3% |
| Arts & Humanities | 245 | 9.8% |
| Total | 2,499 | 100.0% |
Transportation & Commute in Gibsonville
Vehicle Availability by Sex in Gibsonville
The most prevalent vehicle ownership categories in Gibsonville are males with 2 vehicles (744, accounting for 36.5%) and females with 2 vehicles (827, making up 31.8%).
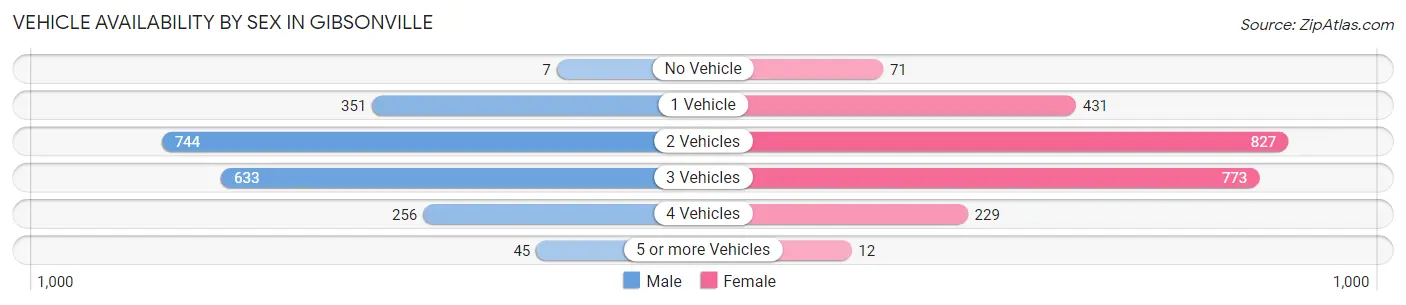
| Vehicles Available | Male | Female |
| No Vehicle | 7 (0.3%) | 71 (3.0%) |
| 1 Vehicle | 351 (17.2%) | 431 (18.4%) |
| 2 Vehicles | 744 (36.5%) | 827 (35.3%) |
| 3 Vehicles | 633 (31.1%) | 773 (33.0%) |
| 4 Vehicles | 256 (12.6%) | 229 (9.8%) |
| 5 or more Vehicles | 45 (2.2%) | 12 (0.5%) |
| Total | 2,036 (100.0%) | 2,343 (100.0%) |
Commute Time in Gibsonville
The most frequently occuring commute durations in Gibsonville are 10 to 14 minutes (816 commuters, 20.3%), 15 to 19 minutes (640 commuters, 15.9%), and 20 to 24 minutes (545 commuters, 13.6%).
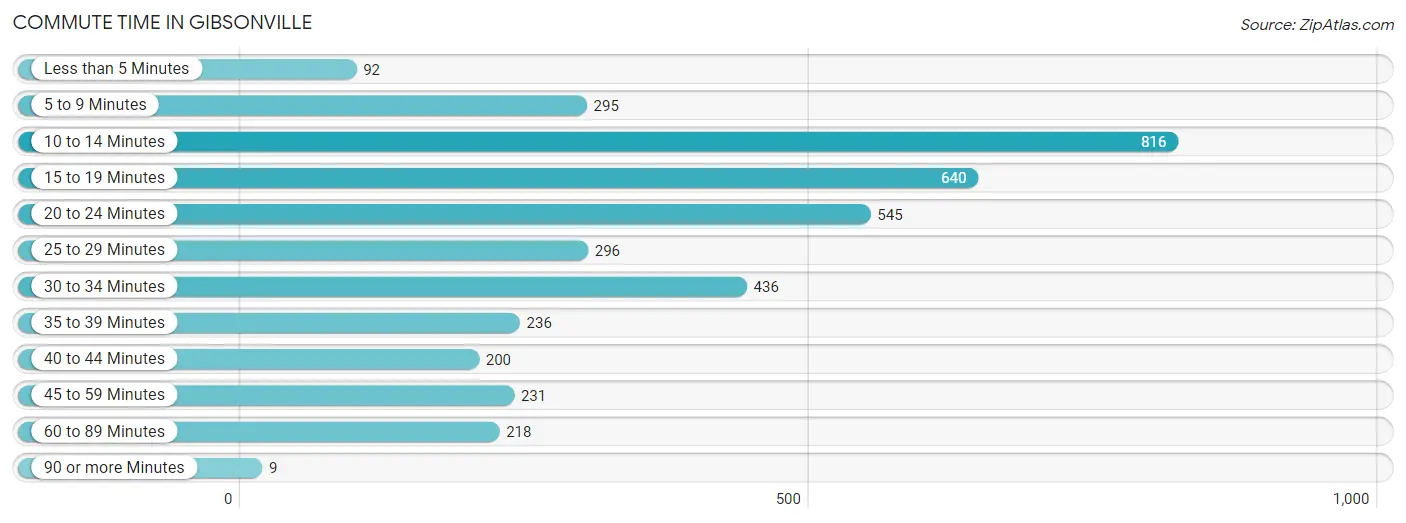
| Commute Time | # Commuters | % Commuters |
| Less than 5 Minutes | 92 | 2.3% |
| 5 to 9 Minutes | 295 | 7.3% |
| 10 to 14 Minutes | 816 | 20.3% |
| 15 to 19 Minutes | 640 | 15.9% |
| 20 to 24 Minutes | 545 | 13.6% |
| 25 to 29 Minutes | 296 | 7.4% |
| 30 to 34 Minutes | 436 | 10.9% |
| 35 to 39 Minutes | 236 | 5.9% |
| 40 to 44 Minutes | 200 | 5.0% |
| 45 to 59 Minutes | 231 | 5.8% |
| 60 to 89 Minutes | 218 | 5.4% |
| 90 or more Minutes | 9 | 0.2% |
Commute Time by Sex in Gibsonville
The most common commute times in Gibsonville are 10 to 14 minutes (451 commuters, 24.0%) for males and 15 to 19 minutes (431 commuters, 20.2%) for females.
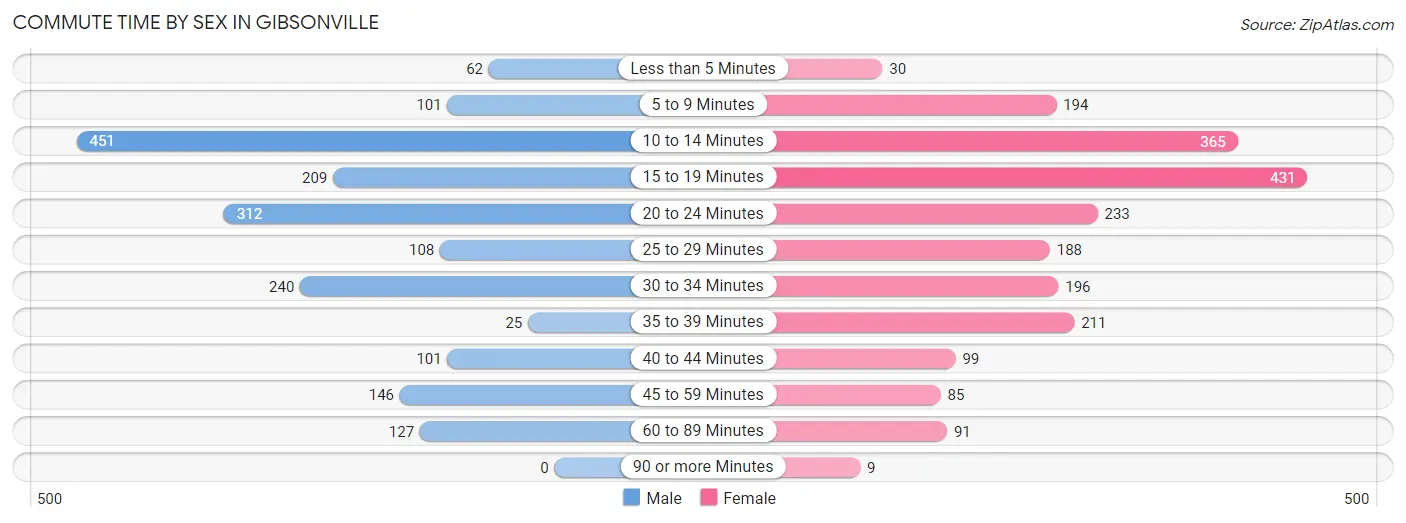
| Commute Time | Male | Female |
| Less than 5 Minutes | 62 (3.3%) | 30 (1.4%) |
| 5 to 9 Minutes | 101 (5.4%) | 194 (9.1%) |
| 10 to 14 Minutes | 451 (24.0%) | 365 (17.1%) |
| 15 to 19 Minutes | 209 (11.1%) | 431 (20.2%) |
| 20 to 24 Minutes | 312 (16.6%) | 233 (10.9%) |
| 25 to 29 Minutes | 108 (5.7%) | 188 (8.8%) |
| 30 to 34 Minutes | 240 (12.8%) | 196 (9.2%) |
| 35 to 39 Minutes | 25 (1.3%) | 211 (9.9%) |
| 40 to 44 Minutes | 101 (5.4%) | 99 (4.6%) |
| 45 to 59 Minutes | 146 (7.8%) | 85 (4.0%) |
| 60 to 89 Minutes | 127 (6.8%) | 91 (4.3%) |
| 90 or more Minutes | 0 (0.0%) | 9 (0.4%) |
Time of Departure to Work by Sex in Gibsonville
The most frequent times of departure to work in Gibsonville are 7:30 AM to 7:59 AM (416, 22.1%) for males and 8:00 AM to 8:29 AM (255, 12.0%) for females.
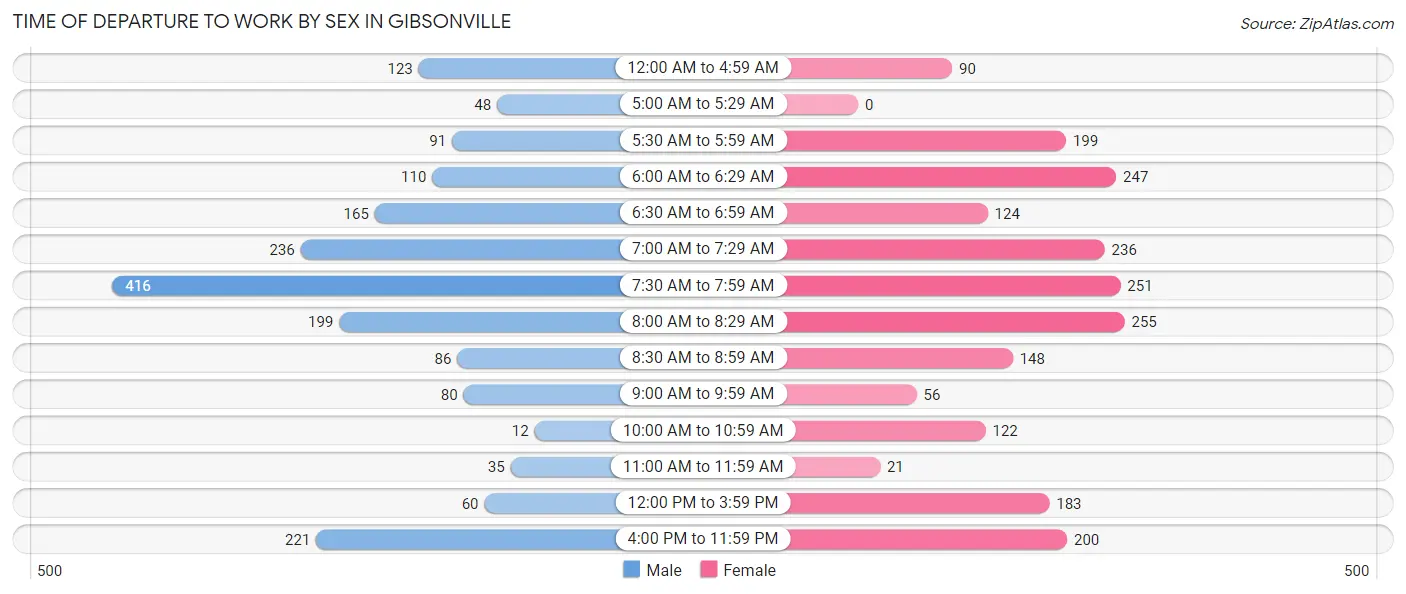
| Time of Departure | Male | Female |
| 12:00 AM to 4:59 AM | 123 (6.5%) | 90 (4.2%) |
| 5:00 AM to 5:29 AM | 48 (2.5%) | 0 (0.0%) |
| 5:30 AM to 5:59 AM | 91 (4.8%) | 199 (9.3%) |
| 6:00 AM to 6:29 AM | 110 (5.8%) | 247 (11.6%) |
| 6:30 AM to 6:59 AM | 165 (8.8%) | 124 (5.8%) |
| 7:00 AM to 7:29 AM | 236 (12.5%) | 236 (11.1%) |
| 7:30 AM to 7:59 AM | 416 (22.1%) | 251 (11.8%) |
| 8:00 AM to 8:29 AM | 199 (10.6%) | 255 (12.0%) |
| 8:30 AM to 8:59 AM | 86 (4.6%) | 148 (6.9%) |
| 9:00 AM to 9:59 AM | 80 (4.3%) | 56 (2.6%) |
| 10:00 AM to 10:59 AM | 12 (0.6%) | 122 (5.7%) |
| 11:00 AM to 11:59 AM | 35 (1.9%) | 21 (1.0%) |
| 12:00 PM to 3:59 PM | 60 (3.2%) | 183 (8.6%) |
| 4:00 PM to 11:59 PM | 221 (11.7%) | 200 (9.4%) |
| Total | 1,882 (100.0%) | 2,132 (100.0%) |
Housing Occupancy in Gibsonville
Occupancy by Ownership in Gibsonville
Of the total 3,321 dwellings in Gibsonville, owner-occupied units account for 2,825 (85.1%), while renter-occupied units make up 496 (14.9%).
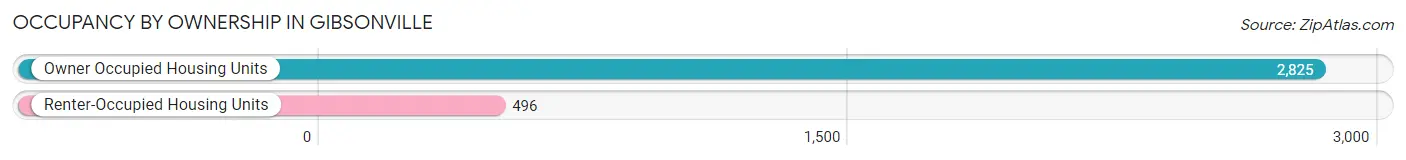
| Occupancy | # Housing Units | % Housing Units |
| Owner Occupied Housing Units | 2,825 | 85.1% |
| Renter-Occupied Housing Units | 496 | 14.9% |
| Total Occupied Housing Units | 3,321 | 100.0% |
Occupancy by Household Size in Gibsonville
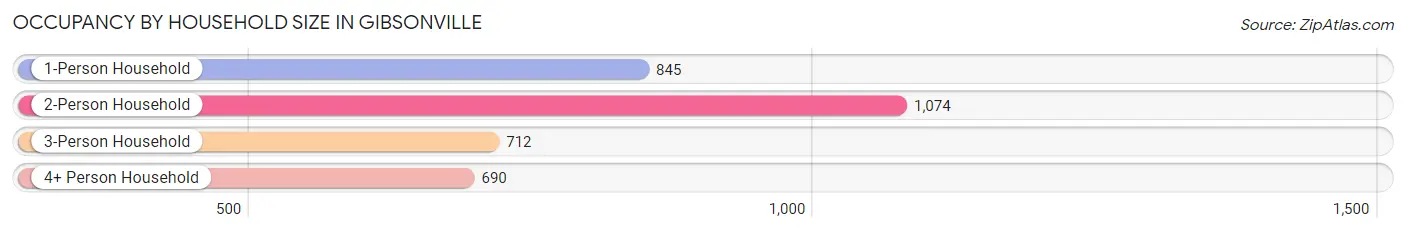
| Household Size | # Housing Units | % Housing Units |
| 1-Person Household | 845 | 25.4% |
| 2-Person Household | 1,074 | 32.3% |
| 3-Person Household | 712 | 21.4% |
| 4+ Person Household | 690 | 20.8% |
| Total Housing Units | 3,321 | 100.0% |
Occupancy by Ownership by Household Size in Gibsonville
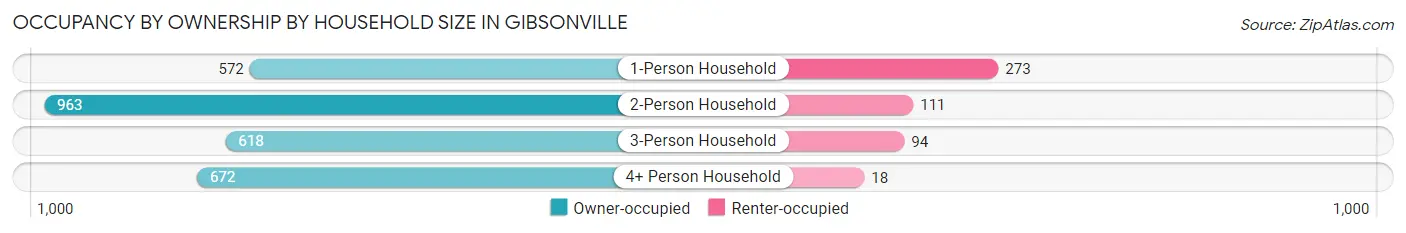
| Household Size | Owner-occupied | Renter-occupied |
| 1-Person Household | 572 (67.7%) | 273 (32.3%) |
| 2-Person Household | 963 (89.7%) | 111 (10.3%) |
| 3-Person Household | 618 (86.8%) | 94 (13.2%) |
| 4+ Person Household | 672 (97.4%) | 18 (2.6%) |
| Total Housing Units | 2,825 (85.1%) | 496 (14.9%) |
Occupancy by Educational Attainment in Gibsonville
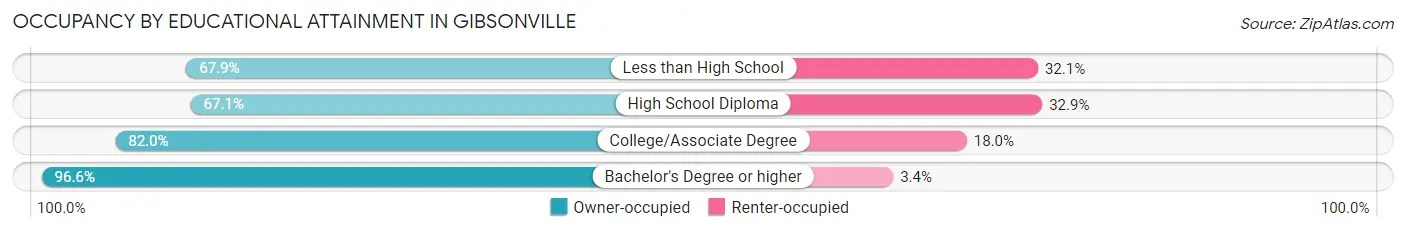
| Household Size | Owner-occupied | Renter-occupied |
| Less than High School | 72 (67.9%) | 34 (32.1%) |
| High School Diploma | 389 (67.1%) | 191 (32.9%) |
| College/Associate Degree | 1,022 (82.0%) | 224 (18.0%) |
| Bachelor's Degree or higher | 1,342 (96.6%) | 47 (3.4%) |
Occupancy by Age of Householder in Gibsonville
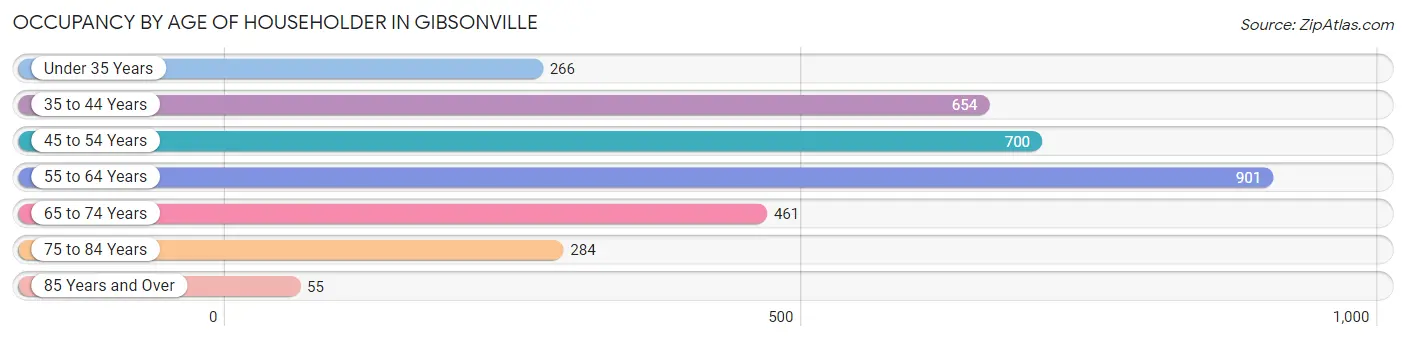
| Age Bracket | # Households | % Households |
| Under 35 Years | 266 | 8.0% |
| 35 to 44 Years | 654 | 19.7% |
| 45 to 54 Years | 700 | 21.1% |
| 55 to 64 Years | 901 | 27.1% |
| 65 to 74 Years | 461 | 13.9% |
| 75 to 84 Years | 284 | 8.6% |
| 85 Years and Over | 55 | 1.7% |
| Total | 3,321 | 100.0% |
Housing Finances in Gibsonville
Median Income by Occupancy in Gibsonville
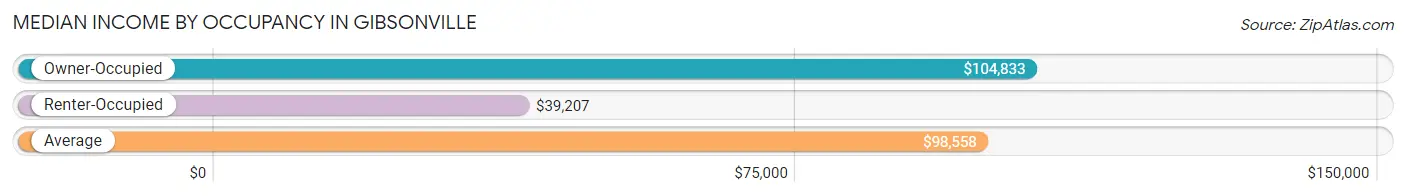
| Occupancy Type | # Households | Median Income |
| Owner-Occupied | 2,825 (85.1%) | $104,833 |
| Renter-Occupied | 496 (14.9%) | $39,207 |
| Average | 3,321 (100.0%) | $98,558 |
Occupancy by Householder Income Bracket in Gibsonville
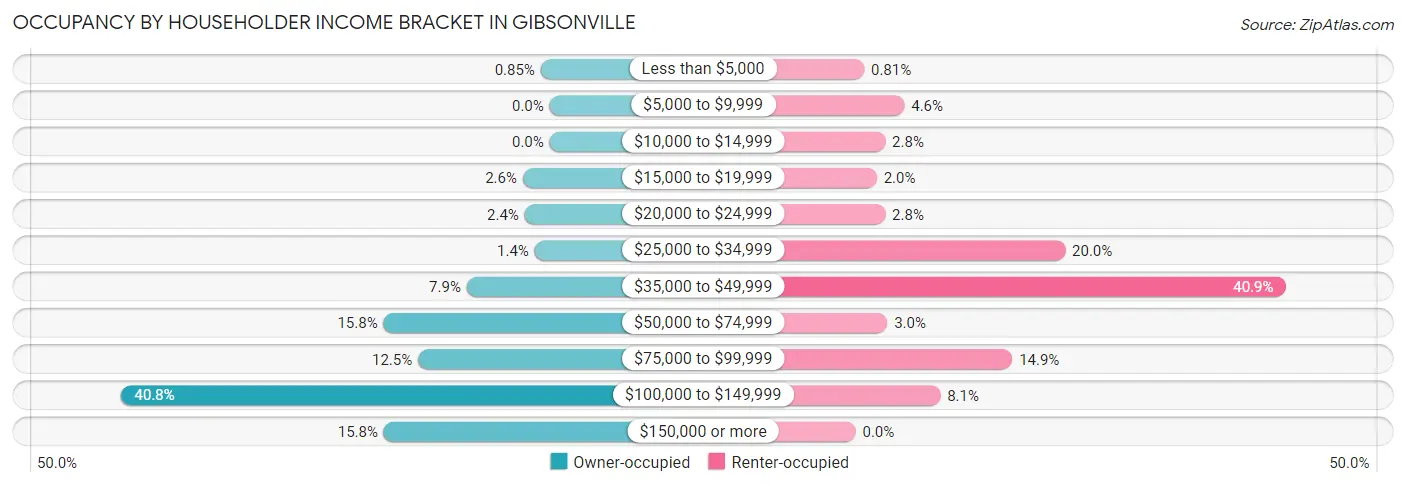
| Income Bracket | Owner-occupied | Renter-occupied |
| Less than $5,000 | 24 (0.9%) | 4 (0.8%) |
| $5,000 to $9,999 | 0 (0.0%) | 23 (4.6%) |
| $10,000 to $14,999 | 0 (0.0%) | 14 (2.8%) |
| $15,000 to $19,999 | 72 (2.5%) | 10 (2.0%) |
| $20,000 to $24,999 | 67 (2.4%) | 14 (2.8%) |
| $25,000 to $34,999 | 40 (1.4%) | 99 (20.0%) |
| $35,000 to $49,999 | 223 (7.9%) | 203 (40.9%) |
| $50,000 to $74,999 | 447 (15.8%) | 15 (3.0%) |
| $75,000 to $99,999 | 354 (12.5%) | 74 (14.9%) |
| $100,000 to $149,999 | 1,152 (40.8%) | 40 (8.1%) |
| $150,000 or more | 446 (15.8%) | 0 (0.0%) |
| Total | 2,825 (100.0%) | 496 (100.0%) |
Monthly Housing Cost Tiers in Gibsonville
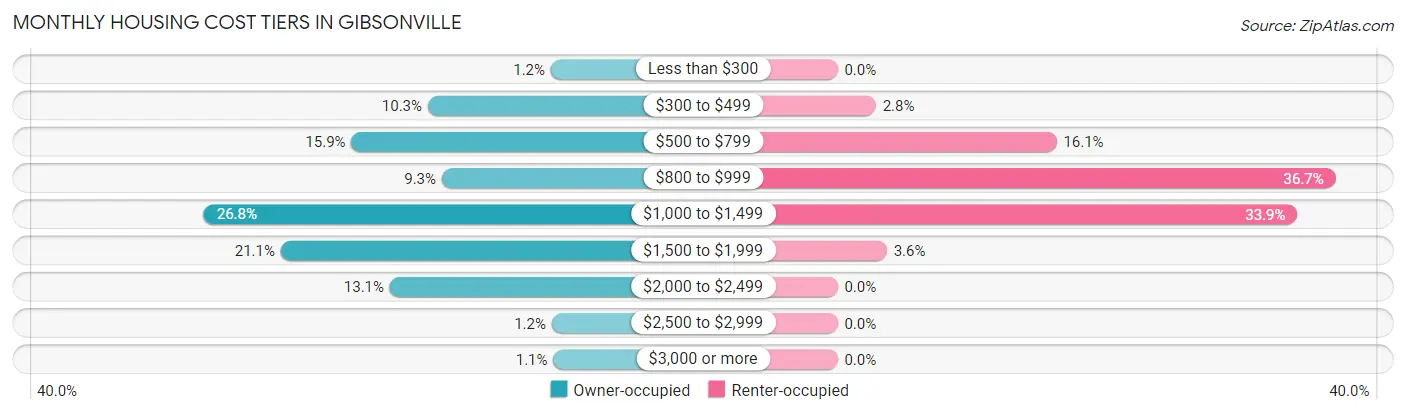
| Monthly Cost | Owner-occupied | Renter-occupied |
| Less than $300 | 35 (1.2%) | 0 (0.0%) |
| $300 to $499 | 291 (10.3%) | 14 (2.8%) |
| $500 to $799 | 450 (15.9%) | 80 (16.1%) |
| $800 to $999 | 262 (9.3%) | 182 (36.7%) |
| $1,000 to $1,499 | 757 (26.8%) | 168 (33.9%) |
| $1,500 to $1,999 | 597 (21.1%) | 18 (3.6%) |
| $2,000 to $2,499 | 370 (13.1%) | 0 (0.0%) |
| $2,500 to $2,999 | 33 (1.2%) | 0 (0.0%) |
| $3,000 or more | 30 (1.1%) | 0 (0.0%) |
| Total | 2,825 (100.0%) | 496 (100.0%) |
Physical Housing Characteristics in Gibsonville
Housing Structures in Gibsonville
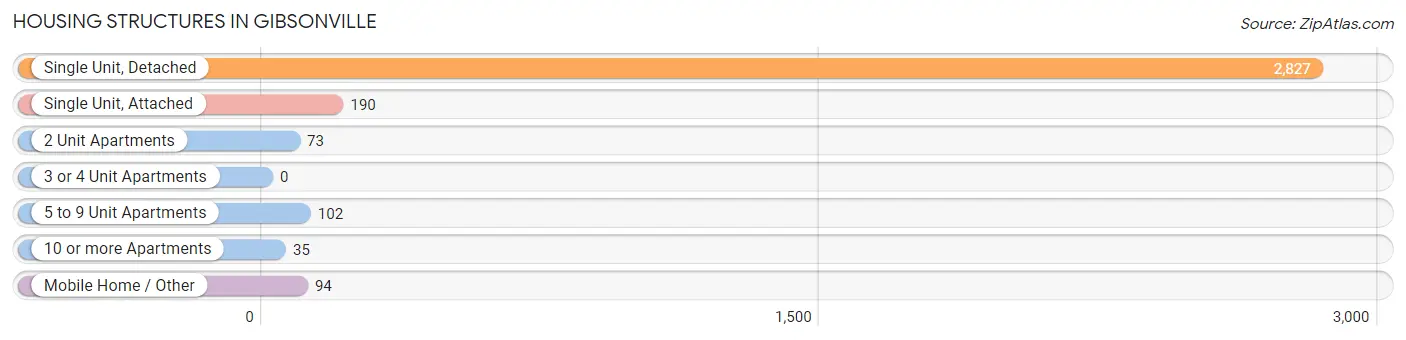
| Structure Type | # Housing Units | % Housing Units |
| Single Unit, Detached | 2,827 | 85.1% |
| Single Unit, Attached | 190 | 5.7% |
| 2 Unit Apartments | 73 | 2.2% |
| 3 or 4 Unit Apartments | 0 | 0.0% |
| 5 to 9 Unit Apartments | 102 | 3.1% |
| 10 or more Apartments | 35 | 1.1% |
| Mobile Home / Other | 94 | 2.8% |
| Total | 3,321 | 100.0% |
Housing Structures by Occupancy in Gibsonville
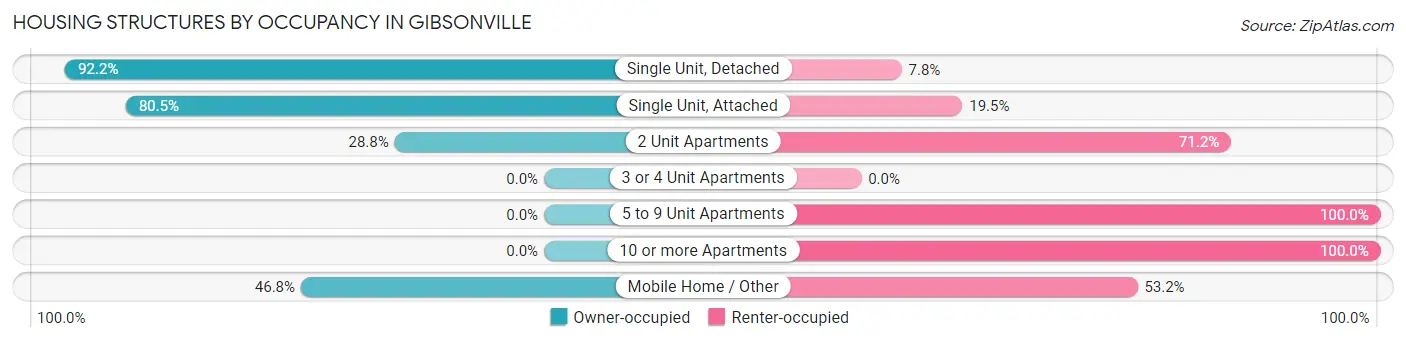
| Structure Type | Owner-occupied | Renter-occupied |
| Single Unit, Detached | 2,607 (92.2%) | 220 (7.8%) |
| Single Unit, Attached | 153 (80.5%) | 37 (19.5%) |
| 2 Unit Apartments | 21 (28.8%) | 52 (71.2%) |
| 3 or 4 Unit Apartments | 0 (0.0%) | 0 (0.0%) |
| 5 to 9 Unit Apartments | 0 (0.0%) | 102 (100.0%) |
| 10 or more Apartments | 0 (0.0%) | 35 (100.0%) |
| Mobile Home / Other | 44 (46.8%) | 50 (53.2%) |
| Total | 2,825 (85.1%) | 496 (14.9%) |
Housing Structures by Number of Rooms in Gibsonville
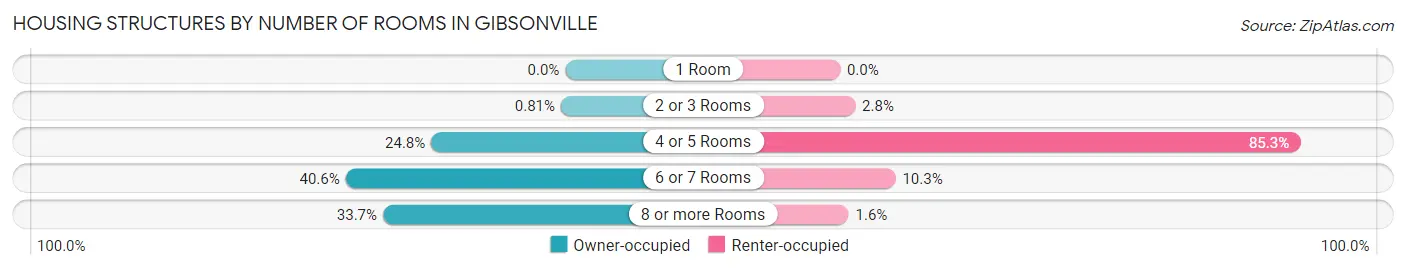
| Number of Rooms | Owner-occupied | Renter-occupied |
| 1 Room | 0 (0.0%) | 0 (0.0%) |
| 2 or 3 Rooms | 23 (0.8%) | 14 (2.8%) |
| 4 or 5 Rooms | 701 (24.8%) | 423 (85.3%) |
| 6 or 7 Rooms | 1,148 (40.6%) | 51 (10.3%) |
| 8 or more Rooms | 953 (33.7%) | 8 (1.6%) |
| Total | 2,825 (100.0%) | 496 (100.0%) |
Housing Structure by Heating Type in Gibsonville
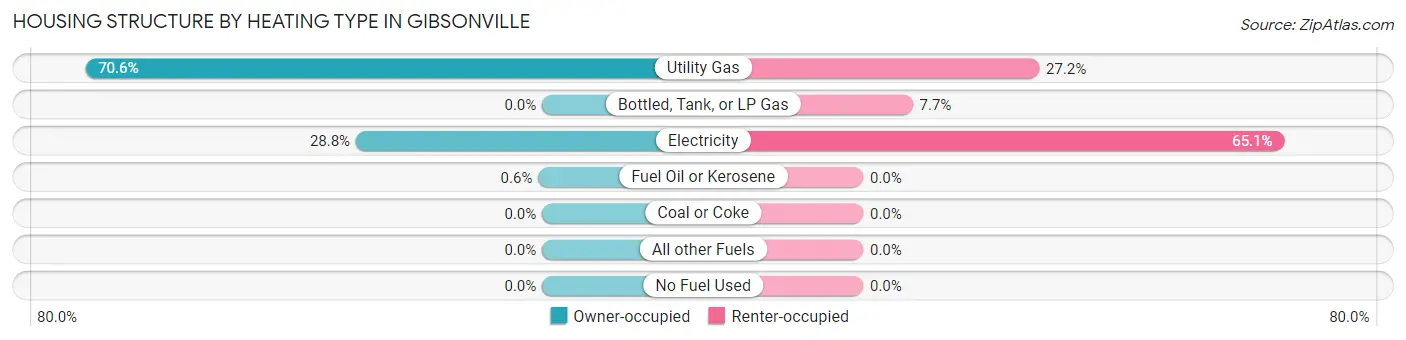
| Heating Type | Owner-occupied | Renter-occupied |
| Utility Gas | 1,995 (70.6%) | 135 (27.2%) |
| Bottled, Tank, or LP Gas | 0 (0.0%) | 38 (7.7%) |
| Electricity | 813 (28.8%) | 323 (65.1%) |
| Fuel Oil or Kerosene | 17 (0.6%) | 0 (0.0%) |
| Coal or Coke | 0 (0.0%) | 0 (0.0%) |
| All other Fuels | 0 (0.0%) | 0 (0.0%) |
| No Fuel Used | 0 (0.0%) | 0 (0.0%) |
| Total | 2,825 (100.0%) | 496 (100.0%) |
Household Vehicle Usage in Gibsonville
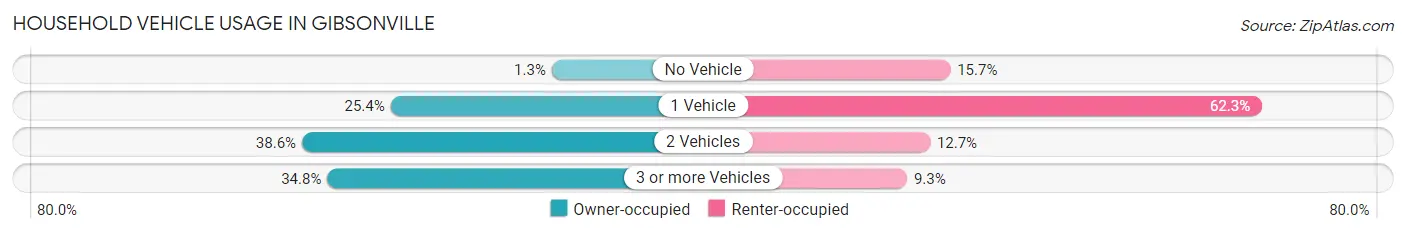
| Vehicles per Household | Owner-occupied | Renter-occupied |
| No Vehicle | 36 (1.3%) | 78 (15.7%) |
| 1 Vehicle | 716 (25.4%) | 309 (62.3%) |
| 2 Vehicles | 1,090 (38.6%) | 63 (12.7%) |
| 3 or more Vehicles | 983 (34.8%) | 46 (9.3%) |
| Total | 2,825 (100.0%) | 496 (100.0%) |
Real Estate & Mortgages in Gibsonville
Real Estate and Mortgage Overview in Gibsonville
| Characteristic | Without Mortgage | With Mortgage |
| Housing Units | 706 | 2,119 |
| Median Property Value | $266,700 | $245,100 |
| Median Household Income | $73,889 | $363 |
| Monthly Housing Costs | $519 | $30 |
| Real Estate Taxes | $2,591 | $117 |
Property Value by Mortgage Status in Gibsonville
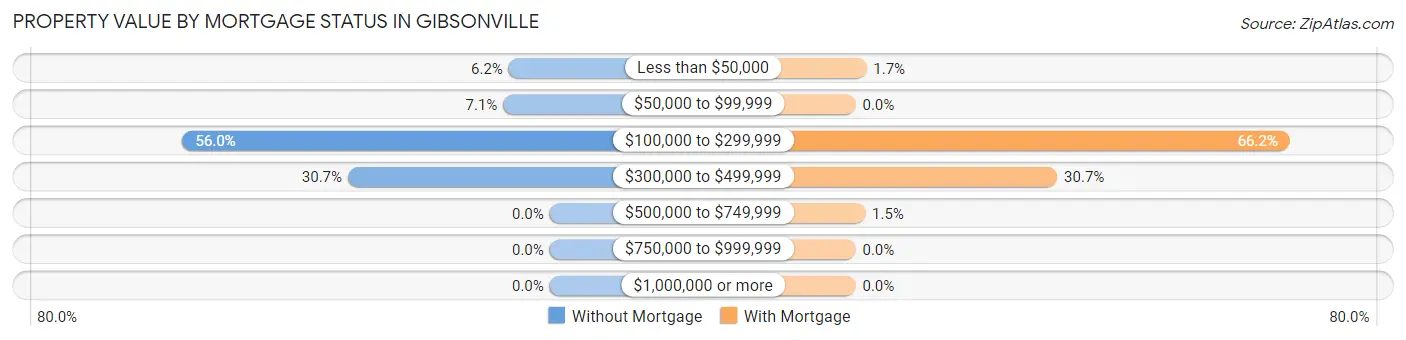
| Property Value | Without Mortgage | With Mortgage |
| Less than $50,000 | 44 (6.2%) | 35 (1.7%) |
| $50,000 to $99,999 | 50 (7.1%) | 0 (0.0%) |
| $100,000 to $299,999 | 395 (55.9%) | 1,402 (66.2%) |
| $300,000 to $499,999 | 217 (30.7%) | 651 (30.7%) |
| $500,000 to $749,999 | 0 (0.0%) | 31 (1.5%) |
| $750,000 to $999,999 | 0 (0.0%) | 0 (0.0%) |
| $1,000,000 or more | 0 (0.0%) | 0 (0.0%) |
| Total | 706 (100.0%) | 2,119 (100.0%) |
Household Income by Mortgage Status in Gibsonville
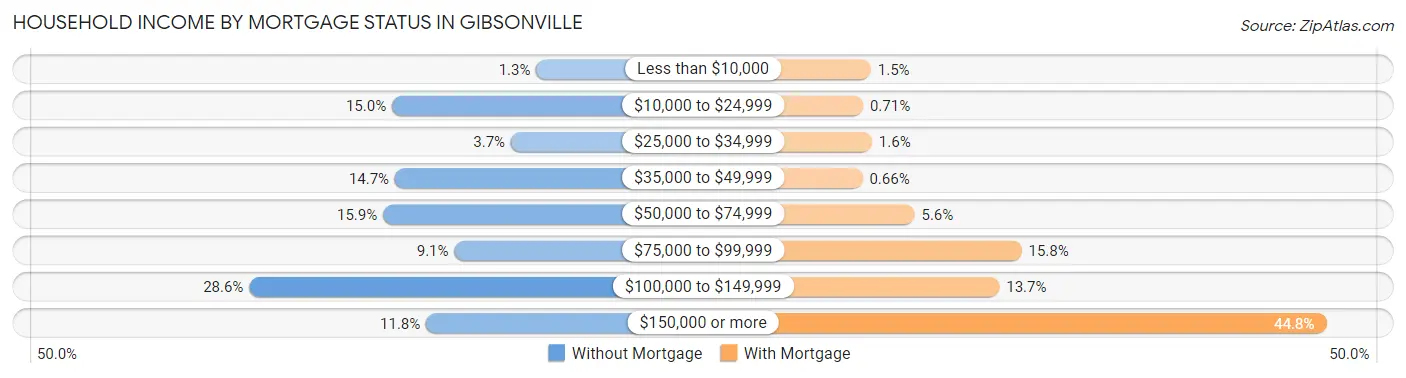
| Household Income | Without Mortgage | With Mortgage |
| Less than $10,000 | 9 (1.3%) | 31 (1.5%) |
| $10,000 to $24,999 | 106 (15.0%) | 15 (0.7%) |
| $25,000 to $34,999 | 26 (3.7%) | 33 (1.6%) |
| $35,000 to $49,999 | 104 (14.7%) | 14 (0.7%) |
| $50,000 to $74,999 | 112 (15.9%) | 119 (5.6%) |
| $75,000 to $99,999 | 64 (9.1%) | 335 (15.8%) |
| $100,000 to $149,999 | 202 (28.6%) | 290 (13.7%) |
| $150,000 or more | 83 (11.8%) | 950 (44.8%) |
| Total | 706 (100.0%) | 2,119 (100.0%) |
Property Value to Household Income Ratio in Gibsonville
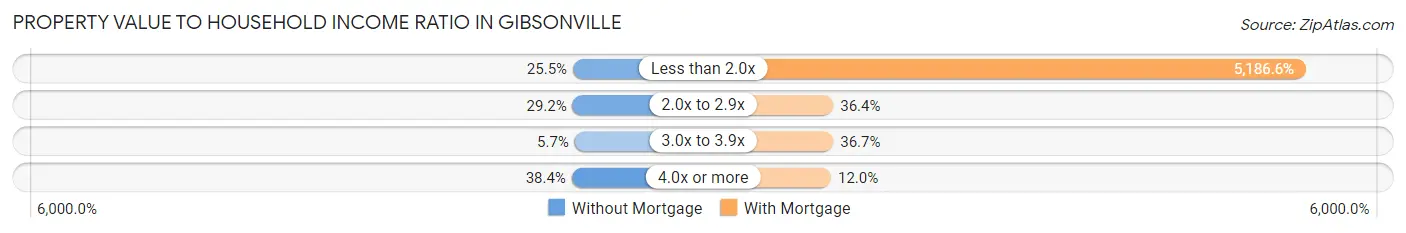
| Value-to-Income Ratio | Without Mortgage | With Mortgage |
| Less than 2.0x | 180 (25.5%) | 109,904 (5,186.6%) |
| 2.0x to 2.9x | 206 (29.2%) | 772 (36.4%) |
| 3.0x to 3.9x | 40 (5.7%) | 777 (36.7%) |
| 4.0x or more | 271 (38.4%) | 254 (12.0%) |
| Total | 706 (100.0%) | 2,119 (100.0%) |
Real Estate Taxes by Mortgage Status in Gibsonville
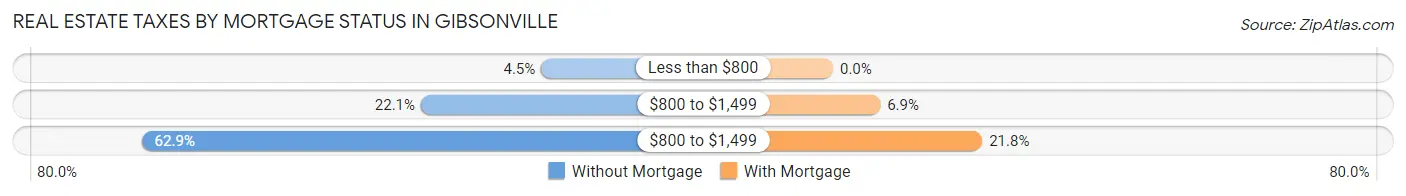
| Property Taxes | Without Mortgage | With Mortgage |
| Less than $800 | 32 (4.5%) | 0 (0.0%) |
| $800 to $1,499 | 156 (22.1%) | 146 (6.9%) |
| $800 to $1,499 | 444 (62.9%) | 462 (21.8%) |
| Total | 706 (100.0%) | 2,119 (100.0%) |
Health & Disability in Gibsonville
Health Insurance Coverage by Age in Gibsonville
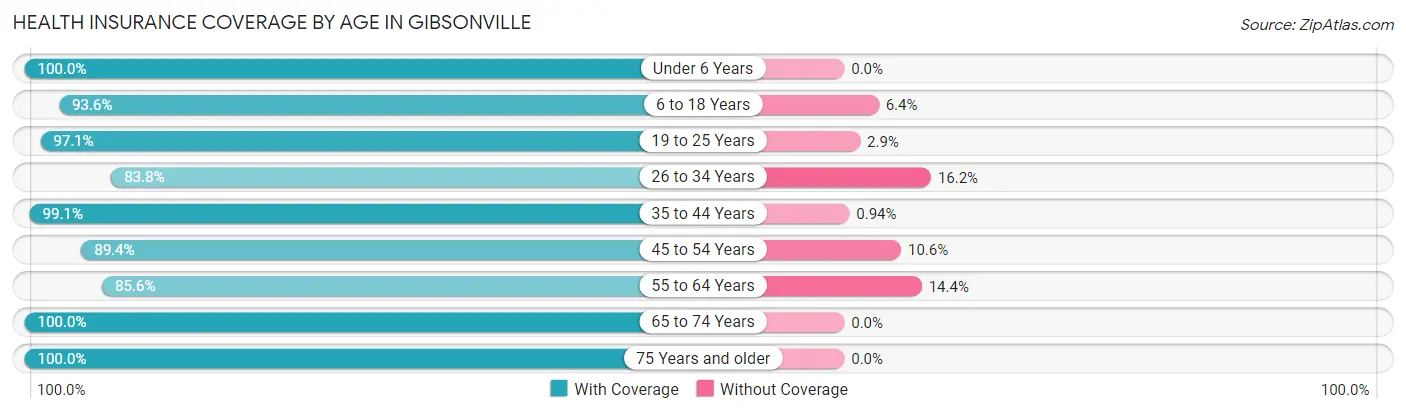
| Age Bracket | With Coverage | Without Coverage |
| Under 6 Years | 524 (100.0%) | 0 (0.0%) |
| 6 to 18 Years | 1,938 (93.6%) | 133 (6.4%) |
| 19 to 25 Years | 330 (97.1%) | 10 (2.9%) |
| 26 to 34 Years | 519 (83.8%) | 100 (16.2%) |
| 35 to 44 Years | 1,259 (99.1%) | 12 (0.9%) |
| 45 to 54 Years | 1,023 (89.4%) | 121 (10.6%) |
| 55 to 64 Years | 1,274 (85.6%) | 215 (14.4%) |
| 65 to 74 Years | 886 (100.0%) | 0 (0.0%) |
| 75 Years and older | 483 (100.0%) | 0 (0.0%) |
| Total | 8,236 (93.3%) | 591 (6.7%) |
Health Insurance Coverage by Citizenship Status in Gibsonville
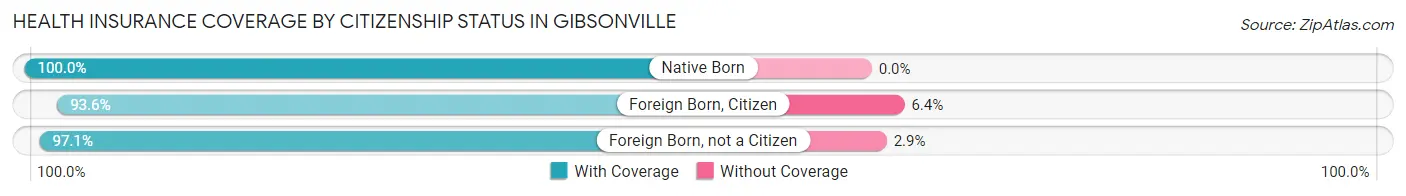
| Citizenship Status | With Coverage | Without Coverage |
| Native Born | 524 (100.0%) | 0 (0.0%) |
| Foreign Born, Citizen | 1,938 (93.6%) | 133 (6.4%) |
| Foreign Born, not a Citizen | 330 (97.1%) | 10 (2.9%) |
Health Insurance Coverage by Household Income in Gibsonville
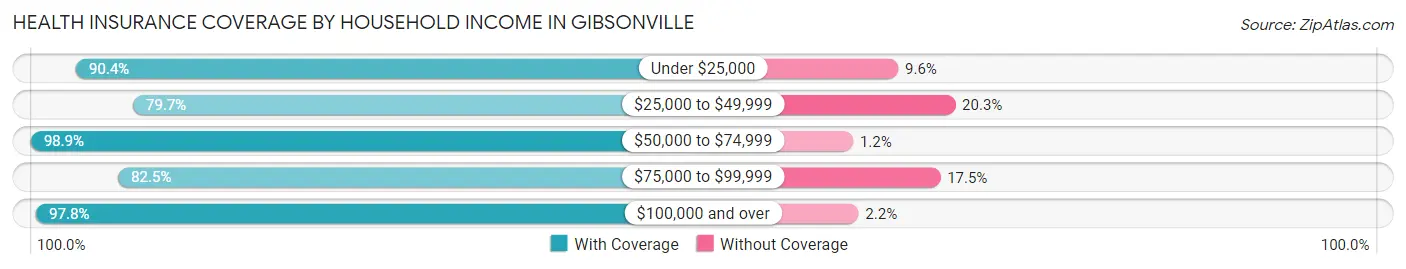
| Household Income | With Coverage | Without Coverage |
| Under $25,000 | 423 (90.4%) | 45 (9.6%) |
| $25,000 to $49,999 | 754 (79.7%) | 192 (20.3%) |
| $50,000 to $74,999 | 1,467 (98.9%) | 17 (1.1%) |
| $75,000 to $99,999 | 1,108 (82.5%) | 235 (17.5%) |
| $100,000 and over | 4,463 (97.8%) | 99 (2.2%) |
Public vs Private Health Insurance Coverage by Age in Gibsonville
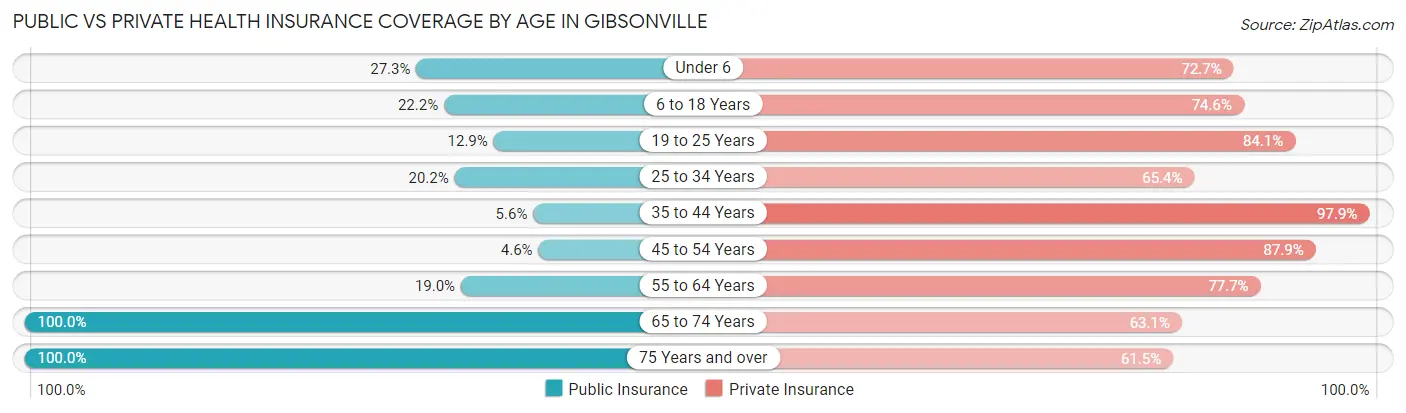
| Age Bracket | Public Insurance | Private Insurance |
| Under 6 | 143 (27.3%) | 381 (72.7%) |
| 6 to 18 Years | 459 (22.2%) | 1,545 (74.6%) |
| 19 to 25 Years | 44 (12.9%) | 286 (84.1%) |
| 25 to 34 Years | 125 (20.2%) | 405 (65.4%) |
| 35 to 44 Years | 71 (5.6%) | 1,244 (97.9%) |
| 45 to 54 Years | 53 (4.6%) | 1,006 (87.9%) |
| 55 to 64 Years | 283 (19.0%) | 1,157 (77.7%) |
| 65 to 74 Years | 886 (100.0%) | 559 (63.1%) |
| 75 Years and over | 483 (100.0%) | 297 (61.5%) |
| Total | 2,547 (28.8%) | 6,880 (77.9%) |
Disability Status by Sex by Age in Gibsonville
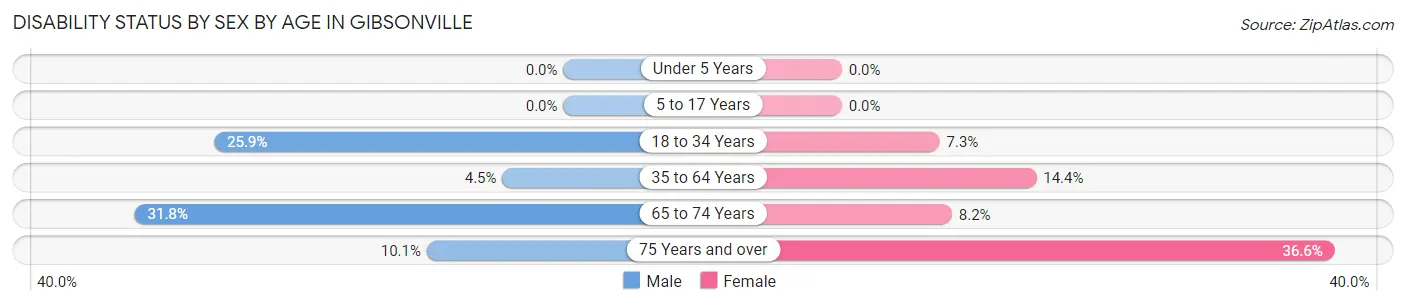
| Age Bracket | Male | Female |
| Under 5 Years | 0 (0.0%) | 0 (0.0%) |
| 5 to 17 Years | 0 (0.0%) | 0 (0.0%) |
| 18 to 34 Years | 105 (25.9%) | 59 (7.3%) |
| 35 to 64 Years | 84 (4.5%) | 296 (14.4%) |
| 65 to 74 Years | 134 (31.8%) | 38 (8.2%) |
| 75 Years and over | 21 (10.1%) | 101 (36.6%) |
Disability Class by Sex by Age in Gibsonville
Disability Class: Hearing Difficulty
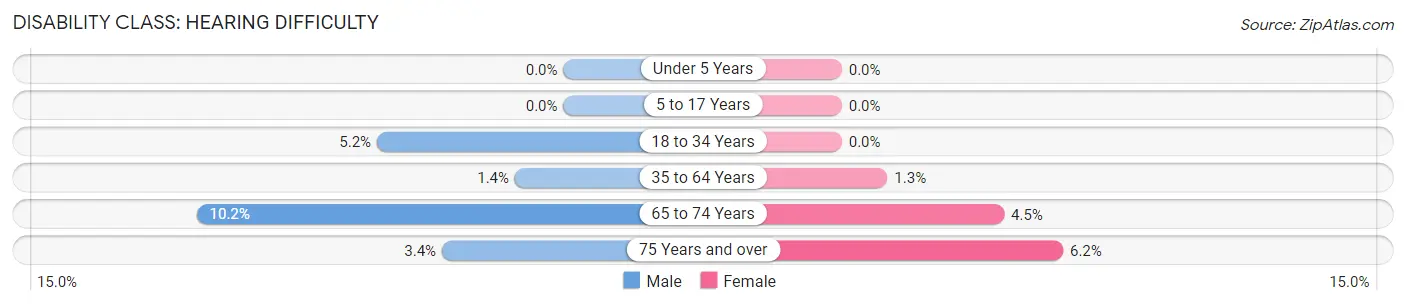
| Age Bracket | Male | Female |
| Under 5 Years | 0 (0.0%) | 0 (0.0%) |
| 5 to 17 Years | 0 (0.0%) | 0 (0.0%) |
| 18 to 34 Years | 21 (5.2%) | 0 (0.0%) |
| 35 to 64 Years | 25 (1.3%) | 26 (1.3%) |
| 65 to 74 Years | 43 (10.2%) | 21 (4.5%) |
| 75 Years and over | 7 (3.4%) | 17 (6.2%) |
Disability Class: Vision Difficulty
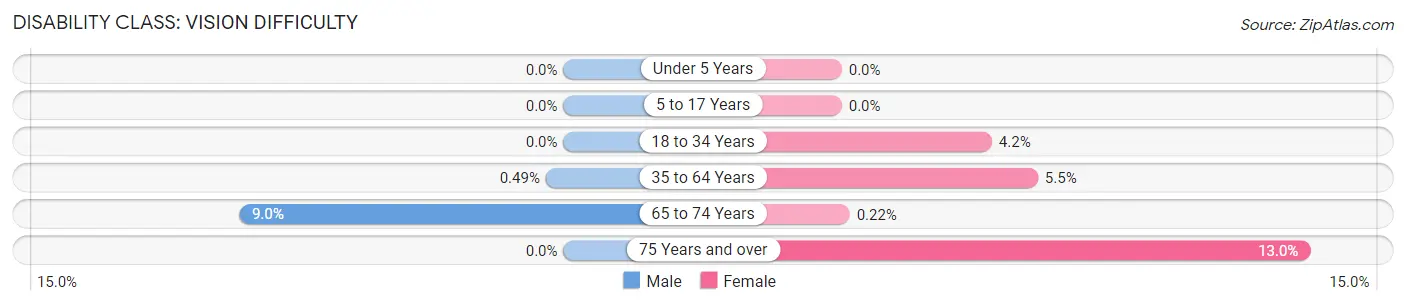
| Age Bracket | Male | Female |
| Under 5 Years | 0 (0.0%) | 0 (0.0%) |
| 5 to 17 Years | 0 (0.0%) | 0 (0.0%) |
| 18 to 34 Years | 0 (0.0%) | 34 (4.2%) |
| 35 to 64 Years | 9 (0.5%) | 112 (5.5%) |
| 65 to 74 Years | 38 (9.0%) | 1 (0.2%) |
| 75 Years and over | 0 (0.0%) | 36 (13.0%) |
Disability Class: Cognitive Difficulty
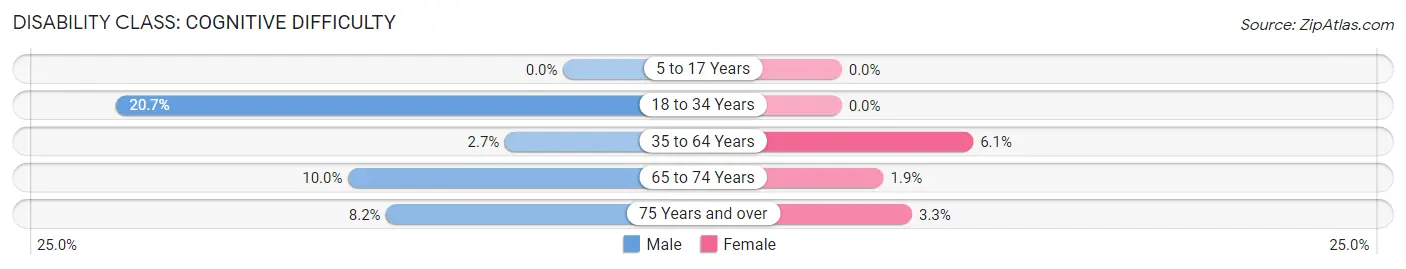
| Age Bracket | Male | Female |
| 5 to 17 Years | 0 (0.0%) | 0 (0.0%) |
| 18 to 34 Years | 84 (20.7%) | 0 (0.0%) |
| 35 to 64 Years | 50 (2.7%) | 125 (6.1%) |
| 65 to 74 Years | 42 (10.0%) | 9 (1.9%) |
| 75 Years and over | 17 (8.2%) | 9 (3.3%) |
Disability Class: Ambulatory Difficulty
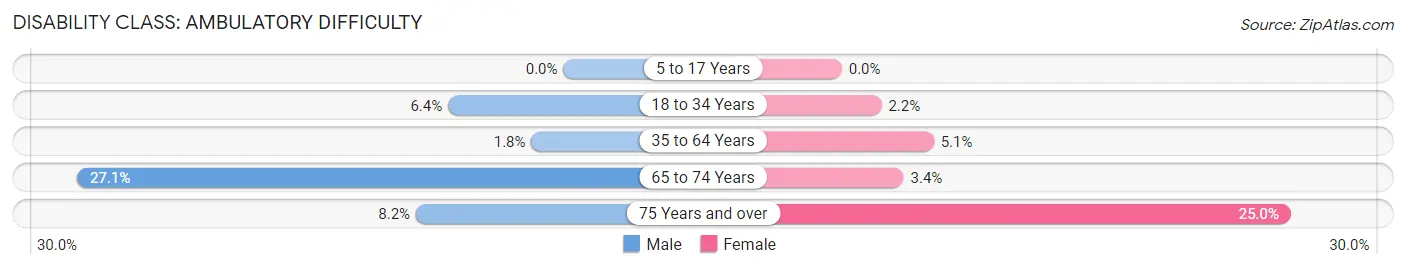
| Age Bracket | Male | Female |
| 5 to 17 Years | 0 (0.0%) | 0 (0.0%) |
| 18 to 34 Years | 26 (6.4%) | 18 (2.2%) |
| 35 to 64 Years | 33 (1.8%) | 105 (5.1%) |
| 65 to 74 Years | 114 (27.1%) | 16 (3.4%) |
| 75 Years and over | 17 (8.2%) | 69 (25.0%) |
Disability Class: Self-Care Difficulty
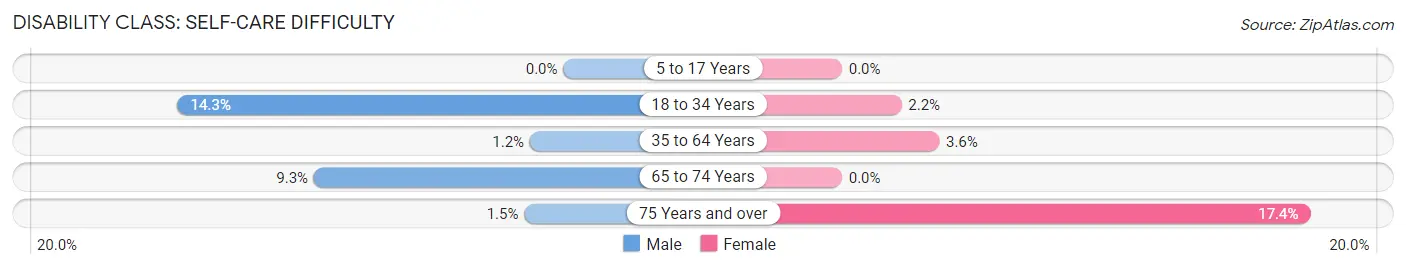
| Age Bracket | Male | Female |
| 5 to 17 Years | 0 (0.0%) | 0 (0.0%) |
| 18 to 34 Years | 58 (14.3%) | 18 (2.2%) |
| 35 to 64 Years | 23 (1.2%) | 74 (3.6%) |
| 65 to 74 Years | 39 (9.3%) | 0 (0.0%) |
| 75 Years and over | 3 (1.5%) | 48 (17.4%) |
Technology Access in Gibsonville
Computing Device Access in Gibsonville
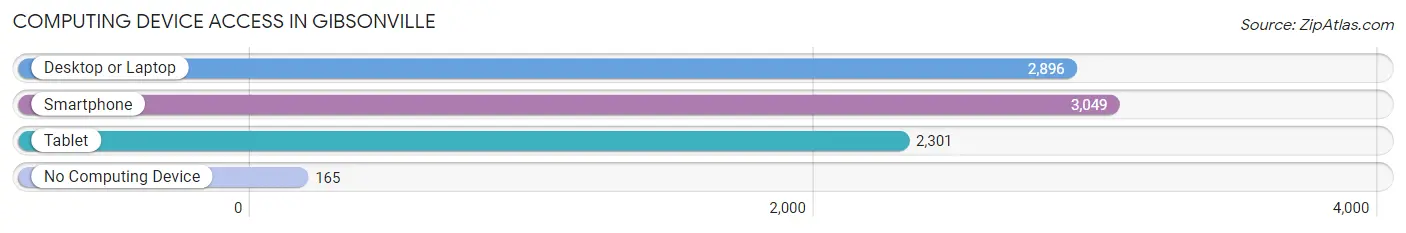
| Device Type | # Households | % Households |
| Desktop or Laptop | 2,896 | 87.2% |
| Smartphone | 3,049 | 91.8% |
| Tablet | 2,301 | 69.3% |
| No Computing Device | 165 | 5.0% |
| Total | 3,321 | 100.0% |
Internet Access in Gibsonville
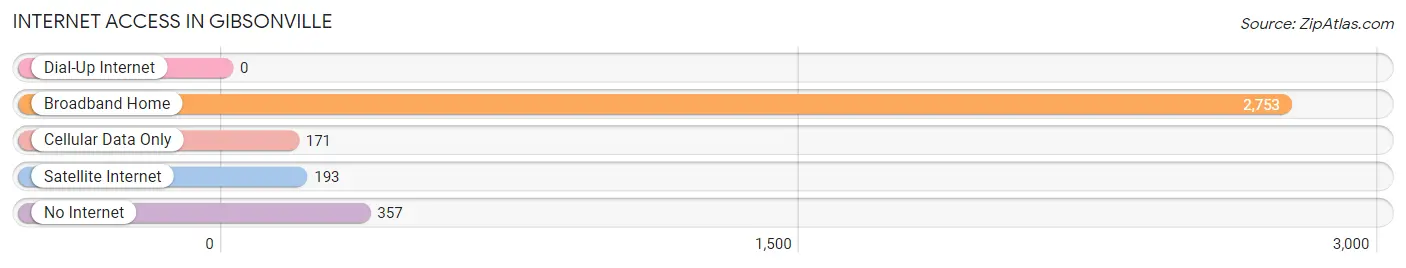
| Internet Type | # Households | % Households |
| Dial-Up Internet | 0 | 0.0% |
| Broadband Home | 2,753 | 82.9% |
| Cellular Data Only | 171 | 5.1% |
| Satellite Internet | 193 | 5.8% |
| No Internet | 357 | 10.7% |
| Total | 3,321 | 100.0% |
Gibsonville Summary
Gibsonville is a small town located in Guilford County, North Carolina. It is situated in the Piedmont region of the state, approximately 20 miles east of Greensboro. The town was founded in 1849 and named after its first postmaster, William Gibson. The population of Gibsonville was estimated to be 2,845 in 2019.
Geography
Gibsonville is located in the Piedmont region of North Carolina, approximately 20 miles east of Greensboro. The town is situated in the rolling hills of the region, with an elevation of 830 feet above sea level. The town is located in the Haw River watershed, and is bordered by the towns of Elon, Graham, and Burlington. The climate in Gibsonville is humid subtropical, with hot, humid summers and mild winters.
Economy
Gibsonville’s economy is largely based on agriculture and manufacturing. The town is home to several large farms, including the Gibsonville Dairy Farm, which produces milk, cheese, and other dairy products. The town is also home to several manufacturing companies, including the Gibsonville Furniture Company, which produces furniture for the home and office. Additionally, the town is home to several small businesses, including restaurants, retail stores, and service providers.
Demographics
Gibsonville is a predominantly white town, with a population that is approximately 85% white and 15% African American. The median household income in Gibsonville is $45,000, and the median home value is $150,000. The town has a low unemployment rate, and the poverty rate is below the national average.
History
Gibsonville was founded in 1849 and named after its first postmaster, William Gibson. The town was originally a farming community, and the first settlers were primarily of English and German descent. In the late 19th century, the town began to grow and develop, and the first railroad line was built in 1887. The town continued to grow throughout the 20th century, and in the 1950s, the town was incorporated.
Today, Gibsonville is a small, rural town with a population of approximately 2,845. The town is home to several farms and manufacturing companies, and the economy is largely based on agriculture and manufacturing. The town is also home to several small businesses, including restaurants, retail stores, and service providers. Gibsonville is a quiet, peaceful town with a rich history and a bright future.
Common Questions
What is Per Capita Income in Gibsonville?
Per Capita income in Gibsonville is $37,955.
What is the Median Family Income in Gibsonville?
Median Family Income in Gibsonville is $112,115.
What is the Median Household income in Gibsonville?
Median Household Income in Gibsonville is $98,558.
What is Income or Wage Gap in Gibsonville?
Income or Wage Gap in Gibsonville is 43.0%.
Women in Gibsonville earn 57.0 cents for every dollar earned by a man.
What is Inequality or Gini Index in Gibsonville?
Inequality or Gini Index in Gibsonville is 0.32.
What is the Total Population of Gibsonville?
Total Population of Gibsonville is 8,827.
What is the Total Male Population of Gibsonville?
Total Male Population of Gibsonville is 3,718.
What is the Total Female Population of Gibsonville?
Total Female Population of Gibsonville is 5,109.
What is the Ratio of Males per 100 Females in Gibsonville?
There are 72.77 Males per 100 Females in Gibsonville.
What is the Ratio of Females per 100 Males in Gibsonville?
There are 137.41 Females per 100 Males in Gibsonville.
What is the Median Population Age in Gibsonville?
Median Population Age in Gibsonville is 40.3 Years.
What is the Average Family Size in Gibsonville
Average Family Size in Gibsonville is 3.2 People.
What is the Average Household Size in Gibsonville
Average Household Size in Gibsonville is 2.6 People.
How Large is the Labor Force in Gibsonville?
There are 4,561 People in the Labor Forcein in Gibsonville.
What is the Percentage of People in the Labor Force in Gibsonville?
68.5% of People are in the Labor Force in Gibsonville.
What is the Unemployment Rate in Gibsonville?
Unemployment Rate in Gibsonville is 2.4%.