Hendersonville, NC Map & Demographics
Hendersonville Map
Hendersonville Overview
$38,318
PER CAPITA INCOME
$80,417
AVG FAMILY INCOME
$50,198
AVG HOUSEHOLD INCOME
16.4%
WAGE / INCOME GAP [ % ]
83.6¢/ $1
WAGE / INCOME GAP [ $ ]
0.50
INEQUALITY / GINI INDEX
15,102
TOTAL POPULATION
6,945
MALE POPULATION
8,157
FEMALE POPULATION
85.14
MALES / 100 FEMALES
117.45
FEMALES / 100 MALES
52.2
MEDIAN AGE
2.7
AVG FAMILY SIZE
1.9
AVG HOUSEHOLD SIZE
6,915
LABOR FORCE [ PEOPLE ]
53.8%
PERCENT IN LABOR FORCE
2.2%
UNEMPLOYMENT RATE
Hendersonville Area Codes
Income in Hendersonville
Income Overview in Hendersonville
Per Capita Income in Hendersonville is $38,318, while median incomes of families and households are $80,417 and $50,198 respectively.
| Characteristic | Number | Measure |
| Per Capita Income | 15,102 | $38,318 |
| Median Family Income | 3,567 | $80,417 |
| Mean Family Income | 3,567 | $108,996 |
| Median Household Income | 7,651 | $50,198 |
| Mean Household Income | 7,651 | $73,638 |
| Income Deficit | 3,567 | $0 |
| Wage / Income Gap (%) | 15,102 | 16.42% |
| Wage / Income Gap ($) | 15,102 | 83.58¢ per $1 |
| Gini / Inequality Index | 15,102 | 0.50 |
Earnings by Sex in Hendersonville
Average Earnings in Hendersonville are $30,772, $35,203 for men and $29,424 for women, a difference of 16.4%.
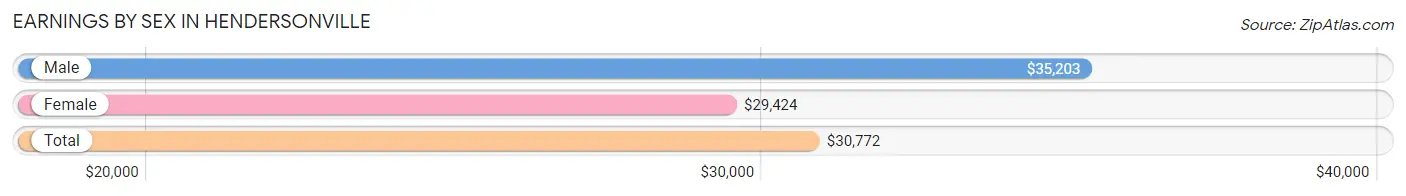
| Sex | Number | Average Earnings |
| Male | 3,582 (49.8%) | $35,203 |
| Female | 3,606 (50.2%) | $29,424 |
| Total | 7,188 (100.0%) | $30,772 |
Earnings by Sex by Income Bracket in Hendersonville
The most common earnings brackets in Hendersonville are $25,000 to $29,999 for men (462 | 12.9%) and $25,000 to $29,999 for women (501 | 13.9%).
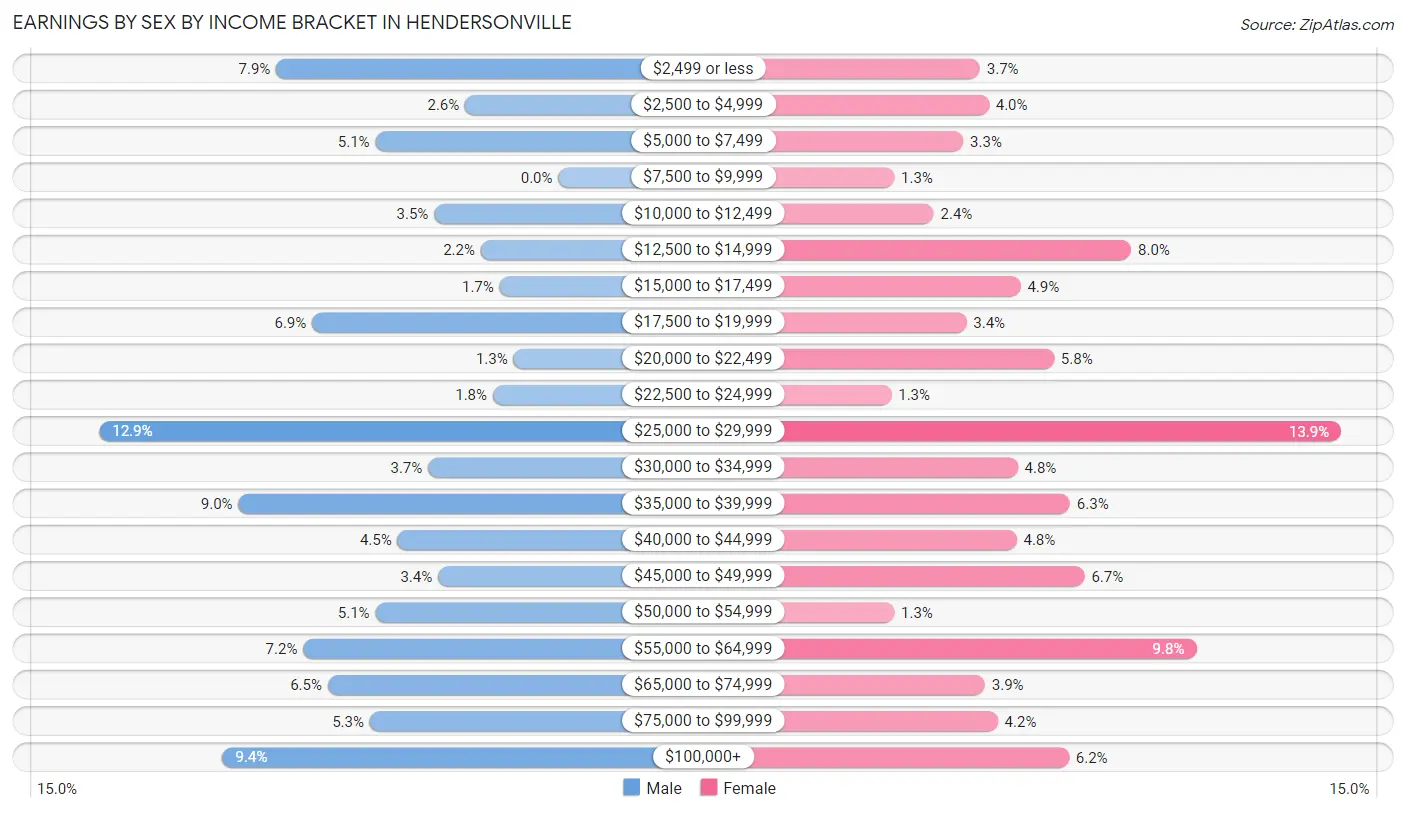
| Income | Male | Female |
| $2,499 or less | 284 (7.9%) | 135 (3.7%) |
| $2,500 to $4,999 | 94 (2.6%) | 144 (4.0%) |
| $5,000 to $7,499 | 184 (5.1%) | 118 (3.3%) |
| $7,500 to $9,999 | 0 (0.0%) | 48 (1.3%) |
| $10,000 to $12,499 | 125 (3.5%) | 88 (2.4%) |
| $12,500 to $14,999 | 78 (2.2%) | 288 (8.0%) |
| $15,000 to $17,499 | 59 (1.7%) | 176 (4.9%) |
| $17,500 to $19,999 | 248 (6.9%) | 121 (3.4%) |
| $20,000 to $22,499 | 45 (1.3%) | 210 (5.8%) |
| $22,500 to $24,999 | 66 (1.8%) | 45 (1.3%) |
| $25,000 to $29,999 | 462 (12.9%) | 501 (13.9%) |
| $30,000 to $34,999 | 131 (3.7%) | 173 (4.8%) |
| $35,000 to $39,999 | 322 (9.0%) | 226 (6.3%) |
| $40,000 to $44,999 | 162 (4.5%) | 172 (4.8%) |
| $45,000 to $49,999 | 121 (3.4%) | 241 (6.7%) |
| $50,000 to $54,999 | 184 (5.1%) | 48 (1.3%) |
| $55,000 to $64,999 | 257 (7.2%) | 354 (9.8%) |
| $65,000 to $74,999 | 232 (6.5%) | 140 (3.9%) |
| $75,000 to $99,999 | 190 (5.3%) | 153 (4.2%) |
| $100,000+ | 338 (9.4%) | 225 (6.2%) |
| Total | 3,582 (100.0%) | 3,606 (100.0%) |
Earnings by Sex by Educational Attainment in Hendersonville
Average earnings in Hendersonville are $38,276 for men and $31,380 for women, a difference of 18.0%. Men with an educational attainment of graduate degree enjoy the highest average annual earnings of $78,194, while those with less than high school education earn the least with $21,411. Women with an educational attainment of graduate degree earn the most with the average annual earnings of $57,119, while those with high school diploma education have the smallest earnings of $19,513.
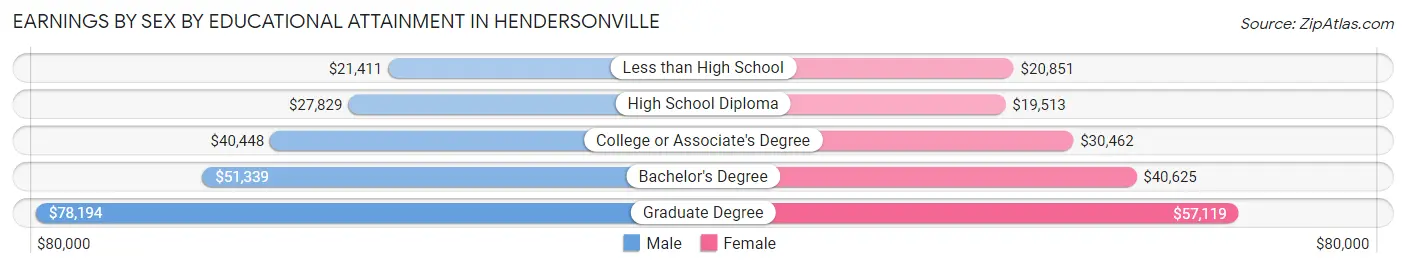
| Educational Attainment | Male Income | Female Income |
| Less than High School | $21,411 | $20,851 |
| High School Diploma | $27,829 | $19,513 |
| College or Associate's Degree | $40,448 | $30,462 |
| Bachelor's Degree | $51,339 | $40,625 |
| Graduate Degree | $78,194 | $57,119 |
| Total | $38,276 | $31,380 |
Family Income in Hendersonville
Family Income Brackets in Hendersonville
According to the Hendersonville family income data, there are 749 families falling into the $75,000 to $99,999 income range, which is the most common income bracket and makes up 21.0% of all families. Conversely, the less than $10,000 income bracket is the least frequent group with only 118 families (3.3%) belonging to this category.
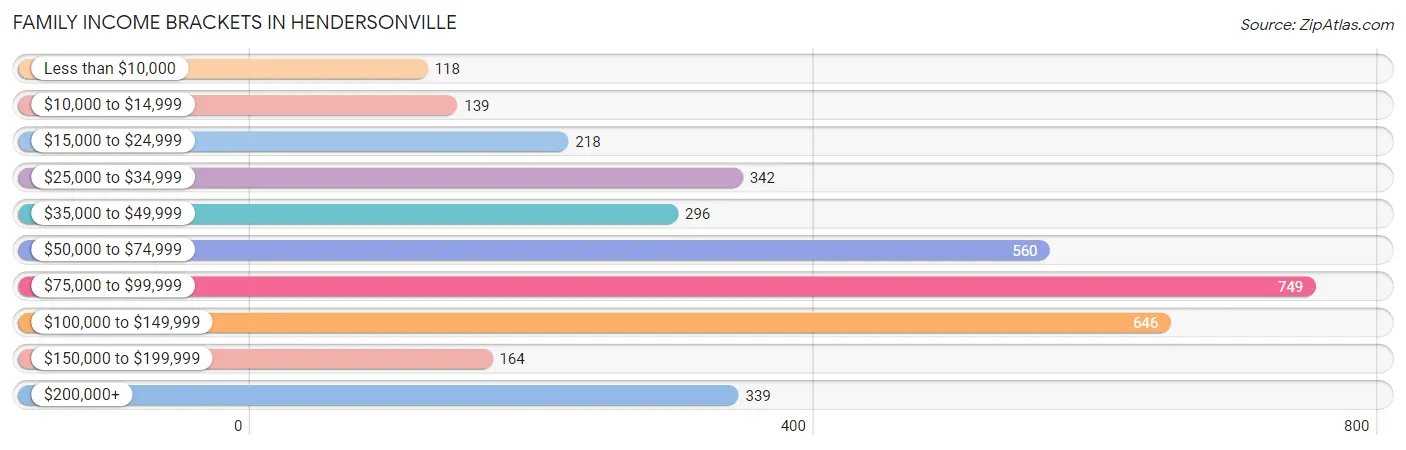
| Income Bracket | # Families | % Families |
| Less than $10,000 | 118 | 3.3% |
| $10,000 to $14,999 | 139 | 3.9% |
| $15,000 to $24,999 | 218 | 6.1% |
| $25,000 to $34,999 | 342 | 9.6% |
| $35,000 to $49,999 | 296 | 8.3% |
| $50,000 to $74,999 | 560 | 15.7% |
| $75,000 to $99,999 | 749 | 21.0% |
| $100,000 to $149,999 | 646 | 18.1% |
| $150,000 to $199,999 | 164 | 4.6% |
| $200,000+ | 339 | 9.5% |
Family Income by Famaliy Size in Hendersonville
6-person families (69 | 1.9%) account for the highest median family income in Hendersonville with $93,774 per family, while 2-person families (2,298 | 64.4%) have the highest median income of $41,722 per family member.
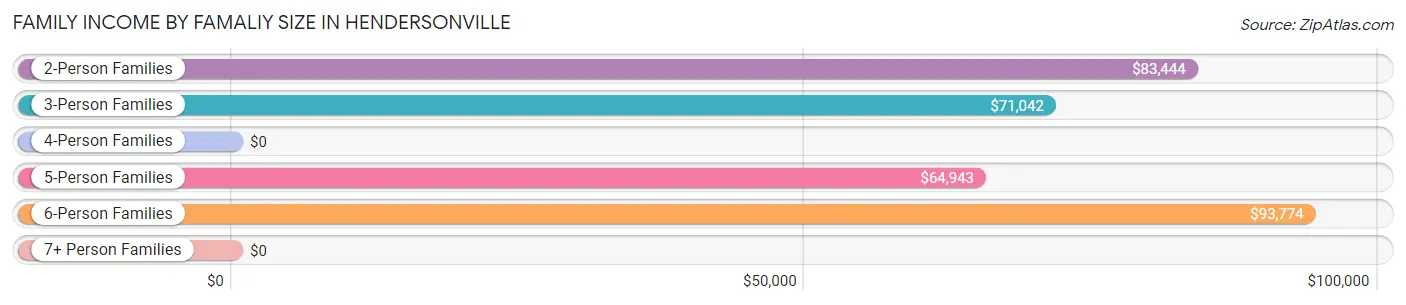
| Income Bracket | # Families | Median Income |
| 2-Person Families | 2,298 (64.4%) | $83,444 |
| 3-Person Families | 697 (19.5%) | $71,042 |
| 4-Person Families | 407 (11.4%) | $0 |
| 5-Person Families | 91 (2.5%) | $64,943 |
| 6-Person Families | 69 (1.9%) | $93,774 |
| 7+ Person Families | 5 (0.1%) | $0 |
| Total | 3,567 (100.0%) | $80,417 |
Family Income by Number of Earners in Hendersonville
The median family income in Hendersonville is $80,417, with families comprising 3+ earners (204) having the highest median family income of $94,038, while families with 1 earner (1,317) have the lowest median family income of $63,777, accounting for 5.7% and 36.9% of families, respectively.
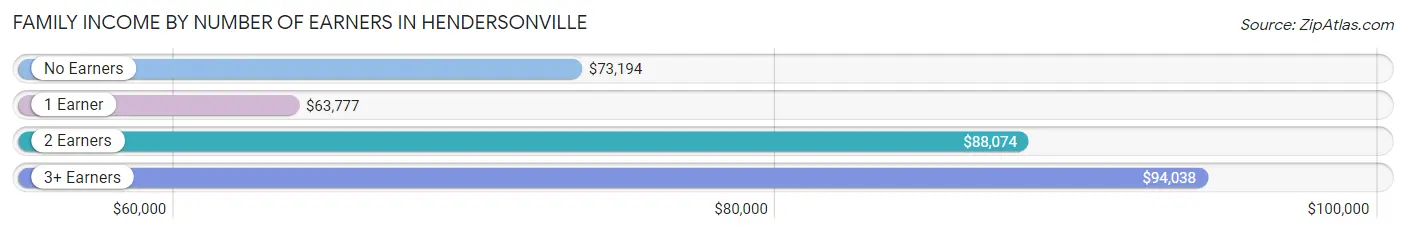
| Number of Earners | # Families | Median Income |
| No Earners | 835 (23.4%) | $73,194 |
| 1 Earner | 1,317 (36.9%) | $63,777 |
| 2 Earners | 1,211 (34.0%) | $88,074 |
| 3+ Earners | 204 (5.7%) | $94,038 |
| Total | 3,567 (100.0%) | $80,417 |
Household Income in Hendersonville
Household Income Brackets in Hendersonville
With 1,538 households falling in the category, the $50,000 to $74,999 income range is the most frequent in Hendersonville, accounting for 20.1% of all households. In contrast, only 237 households (3.1%) fall into the $150,000 to $199,999 income bracket, making it the least populous group.
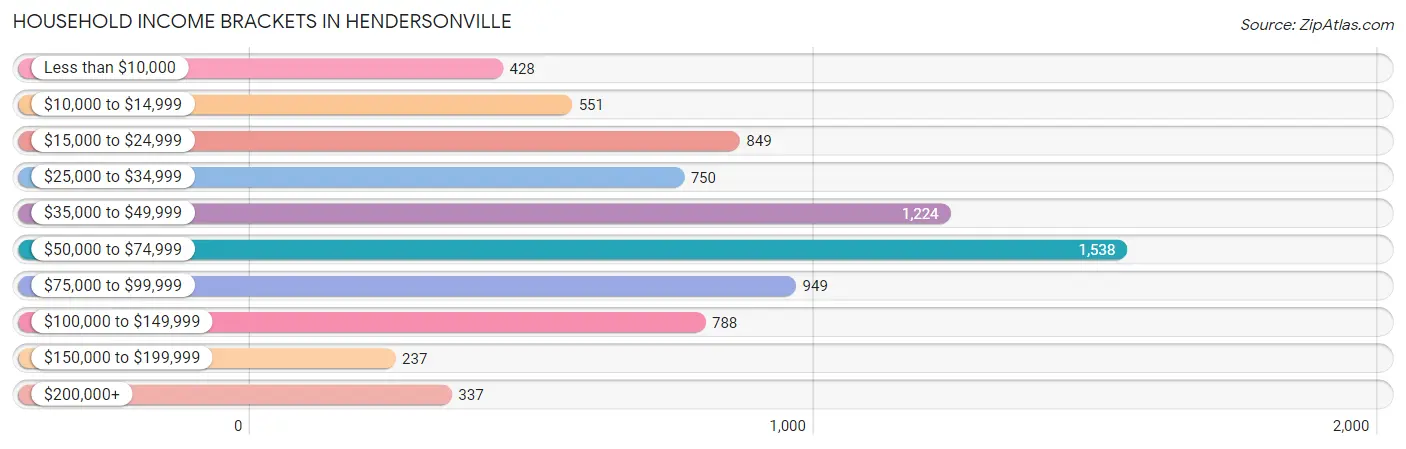
| Income Bracket | # Households | % Households |
| Less than $10,000 | 428 | 5.6% |
| $10,000 to $14,999 | 551 | 7.2% |
| $15,000 to $24,999 | 849 | 11.1% |
| $25,000 to $34,999 | 750 | 9.8% |
| $35,000 to $49,999 | 1,224 | 16.0% |
| $50,000 to $74,999 | 1,538 | 20.1% |
| $75,000 to $99,999 | 949 | 12.4% |
| $100,000 to $149,999 | 788 | 10.3% |
| $150,000 to $199,999 | 237 | 3.1% |
| $200,000+ | 337 | 4.4% |
Household Income by Householder Age in Hendersonville
The median household income in Hendersonville is $50,198, with the highest median household income of $54,467 found in the 45 to 64 years age bracket for the primary householder. A total of 2,241 households (29.3%) fall into this category. Meanwhile, the 15 to 24 years age bracket for the primary householder has the lowest median household income of $34,144, with 223 households (2.9%) in this group.
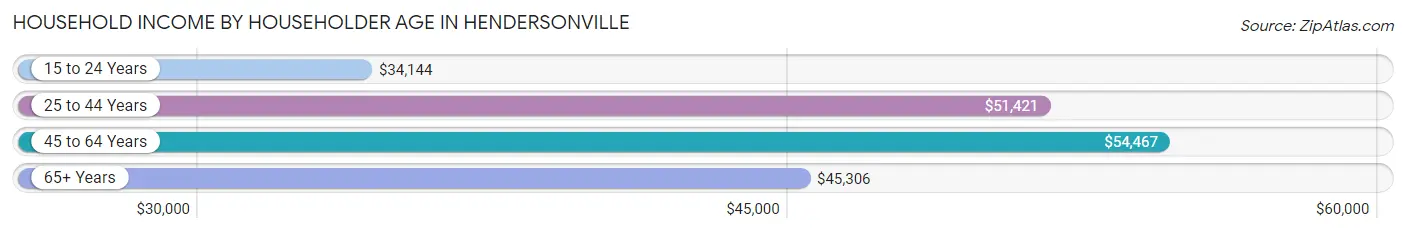
| Income Bracket | # Households | Median Income |
| 15 to 24 Years | 223 (2.9%) | $34,144 |
| 25 to 44 Years | 1,773 (23.2%) | $51,421 |
| 45 to 64 Years | 2,241 (29.3%) | $54,467 |
| 65+ Years | 3,414 (44.6%) | $45,306 |
| Total | 7,651 (100.0%) | $50,198 |
Poverty in Hendersonville
Income Below Poverty by Sex and Age in Hendersonville
With 13.9% poverty level for males and 18.8% for females among the residents of Hendersonville, under 5 year old males and under 5 year old females are the most vulnerable to poverty, with 127 males (50.6%) and 263 females (58.2%) in their respective age groups living below the poverty level.
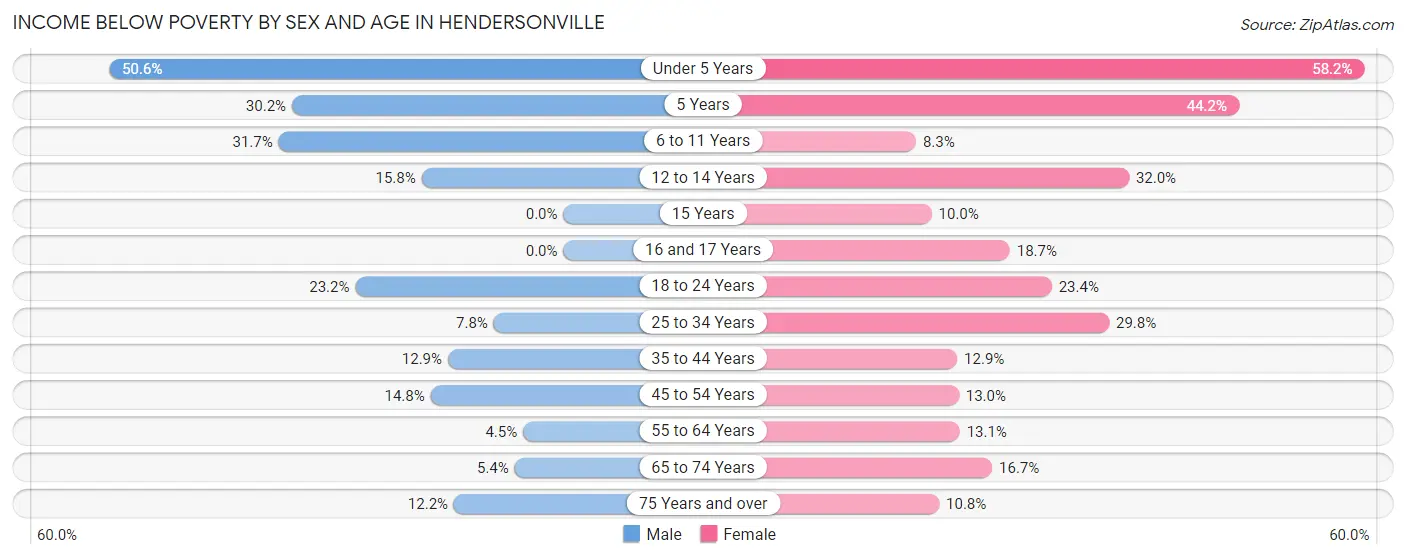
| Age Bracket | Male | Female |
| Under 5 Years | 127 (50.6%) | 263 (58.2%) |
| 5 Years | 26 (30.2%) | 42 (44.2%) |
| 6 to 11 Years | 196 (31.7%) | 18 (8.3%) |
| 12 to 14 Years | 30 (15.8%) | 63 (32.0%) |
| 15 Years | 0 (0.0%) | 4 (10.0%) |
| 16 and 17 Years | 0 (0.0%) | 26 (18.7%) |
| 18 to 24 Years | 120 (23.2%) | 90 (23.4%) |
| 25 to 34 Years | 66 (7.8%) | 247 (29.8%) |
| 35 to 44 Years | 72 (12.9%) | 118 (12.9%) |
| 45 to 54 Years | 104 (14.8%) | 95 (13.0%) |
| 55 to 64 Years | 48 (4.5%) | 154 (13.1%) |
| 65 to 74 Years | 39 (5.4%) | 216 (16.7%) |
| 75 Years and over | 114 (12.2%) | 162 (10.8%) |
| Total | 942 (13.9%) | 1,498 (18.8%) |
Income Above Poverty by Sex and Age in Hendersonville
According to the poverty statistics in Hendersonville, males aged 15 years and females aged 6 to 11 years are the age groups that are most secure financially, with 100.0% of males and 91.7% of females in these age groups living above the poverty line.
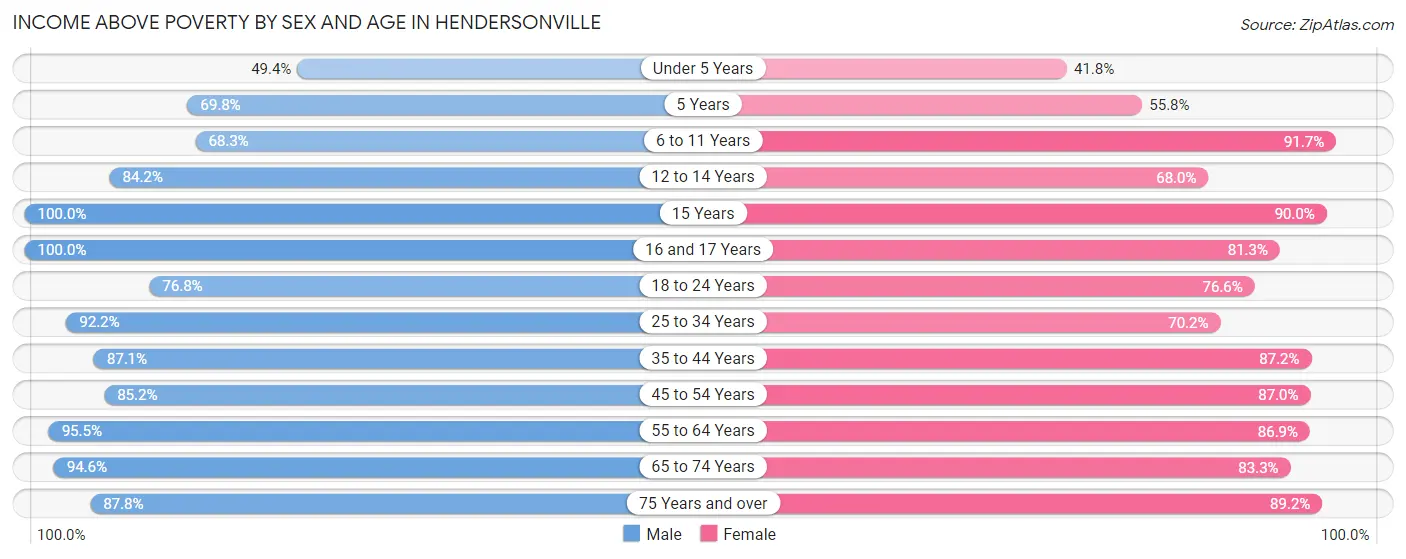
| Age Bracket | Male | Female |
| Under 5 Years | 124 (49.4%) | 189 (41.8%) |
| 5 Years | 60 (69.8%) | 53 (55.8%) |
| 6 to 11 Years | 422 (68.3%) | 200 (91.7%) |
| 12 to 14 Years | 160 (84.2%) | 134 (68.0%) |
| 15 Years | 101 (100.0%) | 36 (90.0%) |
| 16 and 17 Years | 157 (100.0%) | 113 (81.3%) |
| 18 to 24 Years | 398 (76.8%) | 295 (76.6%) |
| 25 to 34 Years | 785 (92.2%) | 583 (70.2%) |
| 35 to 44 Years | 488 (87.1%) | 800 (87.2%) |
| 45 to 54 Years | 599 (85.2%) | 634 (87.0%) |
| 55 to 64 Years | 1,021 (95.5%) | 1,019 (86.9%) |
| 65 to 74 Years | 679 (94.6%) | 1,074 (83.3%) |
| 75 Years and over | 821 (87.8%) | 1,332 (89.2%) |
| Total | 5,815 (86.1%) | 6,462 (81.2%) |
Income Below Poverty Among Married-Couple Families in Hendersonville
The poverty statistics for married-couple families in Hendersonville show that 4.3% or 112 of the total 2,620 families live below the poverty line. Families with 1 or 2 children have the highest poverty rate of 7.9%, comprising of 35 families. On the other hand, families with 3 or 4 children have the lowest poverty rate of 0.0%, which includes 0 families.
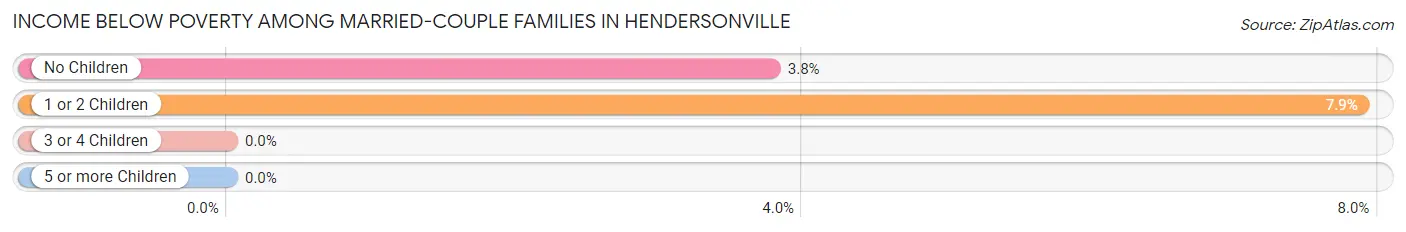
| Children | Above Poverty | Below Poverty |
| No Children | 1,959 (96.2%) | 77 (3.8%) |
| 1 or 2 Children | 409 (92.1%) | 35 (7.9%) |
| 3 or 4 Children | 140 (100.0%) | 0 (0.0%) |
| 5 or more Children | 0 (0.0%) | 0 (0.0%) |
| Total | 2,508 (95.7%) | 112 (4.3%) |
Income Below Poverty Among Single-Parent Households in Hendersonville
According to the poverty data in Hendersonville, 2.8% or 5 single-father households and 30.6% or 236 single-mother households are living below the poverty line. Among single-father households, those with no children have the highest poverty rate, with 5 households (6.8%) experiencing poverty. Likewise, among single-mother households, those with 3 or 4 children have the highest poverty rate, with 162 households (100.0%) falling below the poverty line.
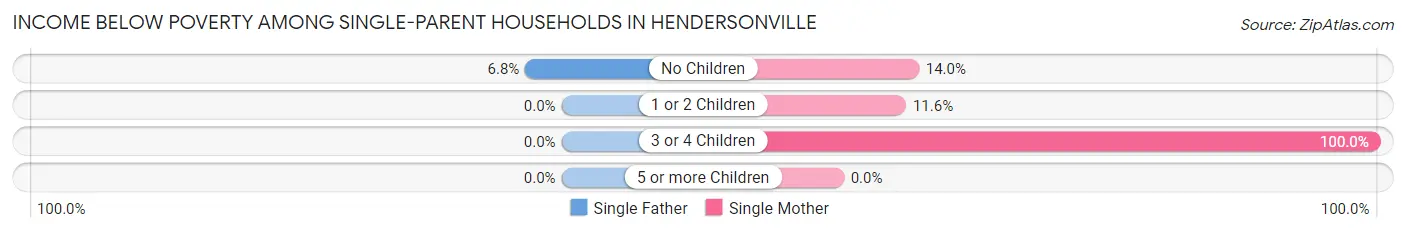
| Children | Single Father | Single Mother |
| No Children | 5 (6.8%) | 20 (14.0%) |
| 1 or 2 Children | 0 (0.0%) | 54 (11.6%) |
| 3 or 4 Children | 0 (0.0%) | 162 (100.0%) |
| 5 or more Children | 0 (0.0%) | 0 (0.0%) |
| Total | 5 (2.8%) | 236 (30.6%) |
Income Below Poverty Among Married-Couple vs Single-Parent Households in Hendersonville
The poverty data for Hendersonville shows that 112 of the married-couple family households (4.3%) and 241 of the single-parent households (25.5%) are living below the poverty level. Within the married-couple family households, those with 1 or 2 children have the highest poverty rate, with 35 households (7.9%) falling below the poverty line. Among the single-parent households, those with 3 or 4 children have the highest poverty rate, with 162 household (100.0%) living below poverty.
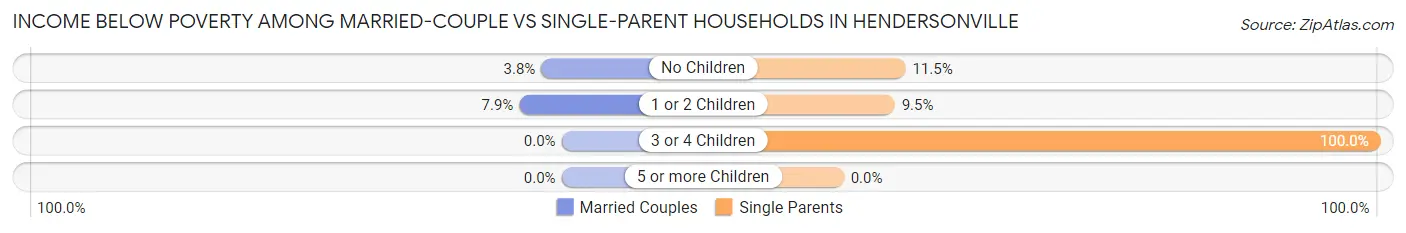
| Children | Married-Couple Families | Single-Parent Households |
| No Children | 77 (3.8%) | 25 (11.5%) |
| 1 or 2 Children | 35 (7.9%) | 54 (9.5%) |
| 3 or 4 Children | 0 (0.0%) | 162 (100.0%) |
| 5 or more Children | 0 (0.0%) | 0 (0.0%) |
| Total | 112 (4.3%) | 241 (25.5%) |
Race in Hendersonville
The most populous races in Hendersonville are White / Caucasian (12,610 | 83.5%), Hispanic or Latino (1,053 | 7.0%), and Black / African American (1,017 | 6.7%).
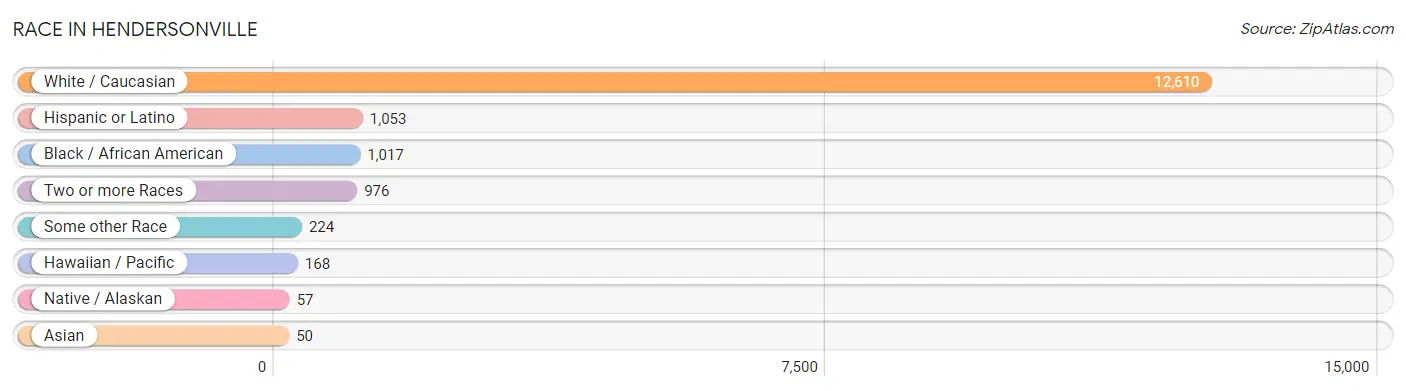
| Race | # Population | % Population |
| Asian | 50 | 0.3% |
| Black / African American | 1,017 | 6.7% |
| Hawaiian / Pacific | 168 | 1.1% |
| Hispanic or Latino | 1,053 | 7.0% |
| Native / Alaskan | 57 | 0.4% |
| White / Caucasian | 12,610 | 83.5% |
| Two or more Races | 976 | 6.5% |
| Some other Race | 224 | 1.5% |
| Total | 15,102 | 100.0% |
Ancestry in Hendersonville
The most populous ancestries reported in Hendersonville are English (3,013 | 20.0%), German (2,456 | 16.3%), Irish (2,240 | 14.8%), American (979 | 6.5%), and Scottish (915 | 6.1%), together accounting for 63.6% of all Hendersonville residents.
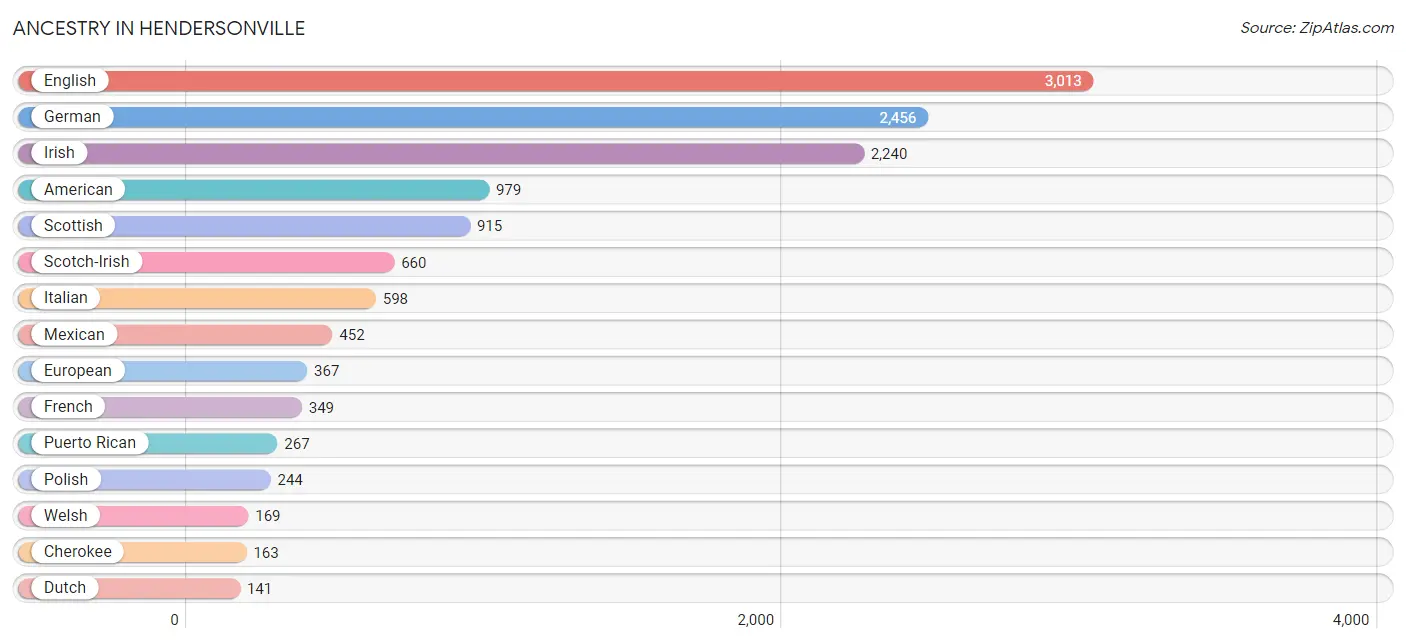
| Ancestry | # Population | % Population |
| American | 979 | 6.5% |
| Arab | 31 | 0.2% |
| Argentinean | 28 | 0.2% |
| Australian | 11 | 0.1% |
| Austrian | 12 | 0.1% |
| Blackfeet | 16 | 0.1% |
| British | 114 | 0.7% |
| Burmese | 1 | 0.0% |
| Canadian | 39 | 0.3% |
| Central American | 111 | 0.7% |
| Cherokee | 163 | 1.1% |
| Chippewa | 7 | 0.1% |
| Choctaw | 13 | 0.1% |
| Colombian | 71 | 0.5% |
| Croatian | 28 | 0.2% |
| Cuban | 39 | 0.3% |
| Czech | 44 | 0.3% |
| Czechoslovakian | 25 | 0.2% |
| Dutch | 141 | 0.9% |
| Eastern European | 20 | 0.1% |
| English | 3,013 | 20.0% |
| European | 367 | 2.4% |
| Finnish | 39 | 0.3% |
| French | 349 | 2.3% |
| French Canadian | 126 | 0.8% |
| German | 2,456 | 16.3% |
| Greek | 28 | 0.2% |
| Haitian | 28 | 0.2% |
| Honduran | 48 | 0.3% |
| Hungarian | 64 | 0.4% |
| Indian (Asian) | 33 | 0.2% |
| Irish | 2,240 | 14.8% |
| Israeli | 31 | 0.2% |
| Italian | 598 | 4.0% |
| Jamaican | 65 | 0.4% |
| Japanese | 16 | 0.1% |
| Kenyan | 6 | 0.0% |
| Lebanese | 31 | 0.2% |
| Lithuanian | 31 | 0.2% |
| Lumbee | 7 | 0.1% |
| Mexican | 452 | 3.0% |
| Nicaraguan | 15 | 0.1% |
| Northern European | 13 | 0.1% |
| Norwegian | 123 | 0.8% |
| Pennsylvania German | 8 | 0.1% |
| Polish | 244 | 1.6% |
| Portuguese | 11 | 0.1% |
| Puerto Rican | 267 | 1.8% |
| Russian | 98 | 0.6% |
| Salvadoran | 48 | 0.3% |
| Scandinavian | 11 | 0.1% |
| Scotch-Irish | 660 | 4.4% |
| Scottish | 915 | 6.1% |
| Slavic | 8 | 0.1% |
| Slovak | 18 | 0.1% |
| Slovene | 9 | 0.1% |
| South American | 99 | 0.7% |
| Spaniard | 34 | 0.2% |
| Spanish | 31 | 0.2% |
| Subsaharan African | 6 | 0.0% |
| Swedish | 94 | 0.6% |
| Swiss | 104 | 0.7% |
| Ukrainian | 33 | 0.2% |
| Welsh | 169 | 1.1% | View All 64 Rows |
Immigrants in Hendersonville
The most numerous immigrant groups reported in Hendersonville came from Latin America (315 | 2.1%), Central America (223 | 1.5%), Europe (185 | 1.2%), Mexico (112 | 0.7%), and Oceania (106 | 0.7%), together accounting for 6.2% of all Hendersonville residents.
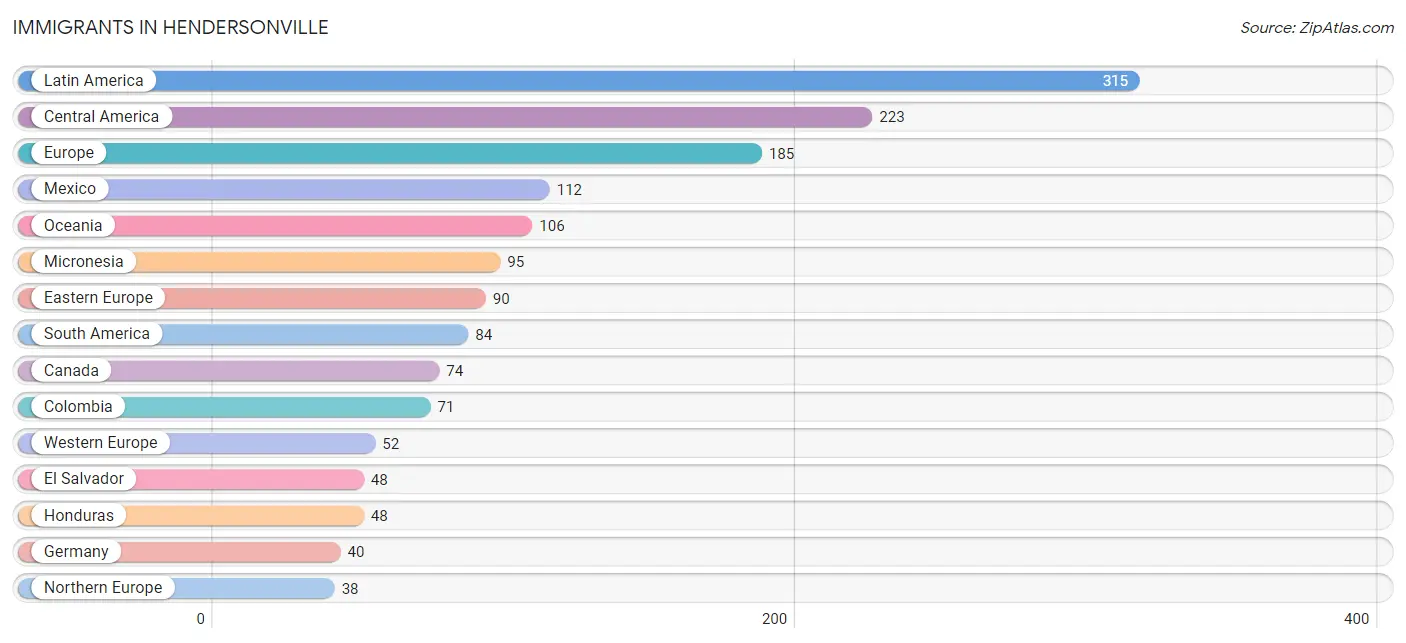
| Immigration Origin | # Population | % Population |
| Africa | 6 | 0.0% |
| Argentina | 13 | 0.1% |
| Asia | 35 | 0.2% |
| Australia | 11 | 0.1% |
| Cambodia | 16 | 0.1% |
| Canada | 74 | 0.5% |
| Caribbean | 8 | 0.1% |
| Central America | 223 | 1.5% |
| China | 19 | 0.1% |
| Colombia | 71 | 0.5% |
| Croatia | 10 | 0.1% |
| Czechoslovakia | 14 | 0.1% |
| Eastern Africa | 6 | 0.0% |
| Eastern Asia | 19 | 0.1% |
| Eastern Europe | 90 | 0.6% |
| El Salvador | 48 | 0.3% |
| England | 30 | 0.2% |
| Europe | 185 | 1.2% |
| Germany | 40 | 0.3% |
| Grenada | 8 | 0.1% |
| Honduras | 48 | 0.3% |
| Hungary | 30 | 0.2% |
| Kenya | 6 | 0.0% |
| Latin America | 315 | 2.1% |
| Mexico | 112 | 0.7% |
| Micronesia | 95 | 0.6% |
| Netherlands | 12 | 0.1% |
| Nicaragua | 15 | 0.1% |
| Northern Europe | 38 | 0.3% |
| Oceania | 106 | 0.7% |
| Poland | 36 | 0.2% |
| South America | 84 | 0.6% |
| South Eastern Asia | 16 | 0.1% |
| Southern Europe | 5 | 0.0% |
| Spain | 5 | 0.0% |
| Sweden | 5 | 0.0% |
| Western Europe | 52 | 0.3% | View All 37 Rows |
Sex and Age in Hendersonville
Sex and Age in Hendersonville
The most populous age groups in Hendersonville are 5 to 9 Years (582 | 8.4%) for men and 75 to 79 Years (753 | 9.2%) for women.
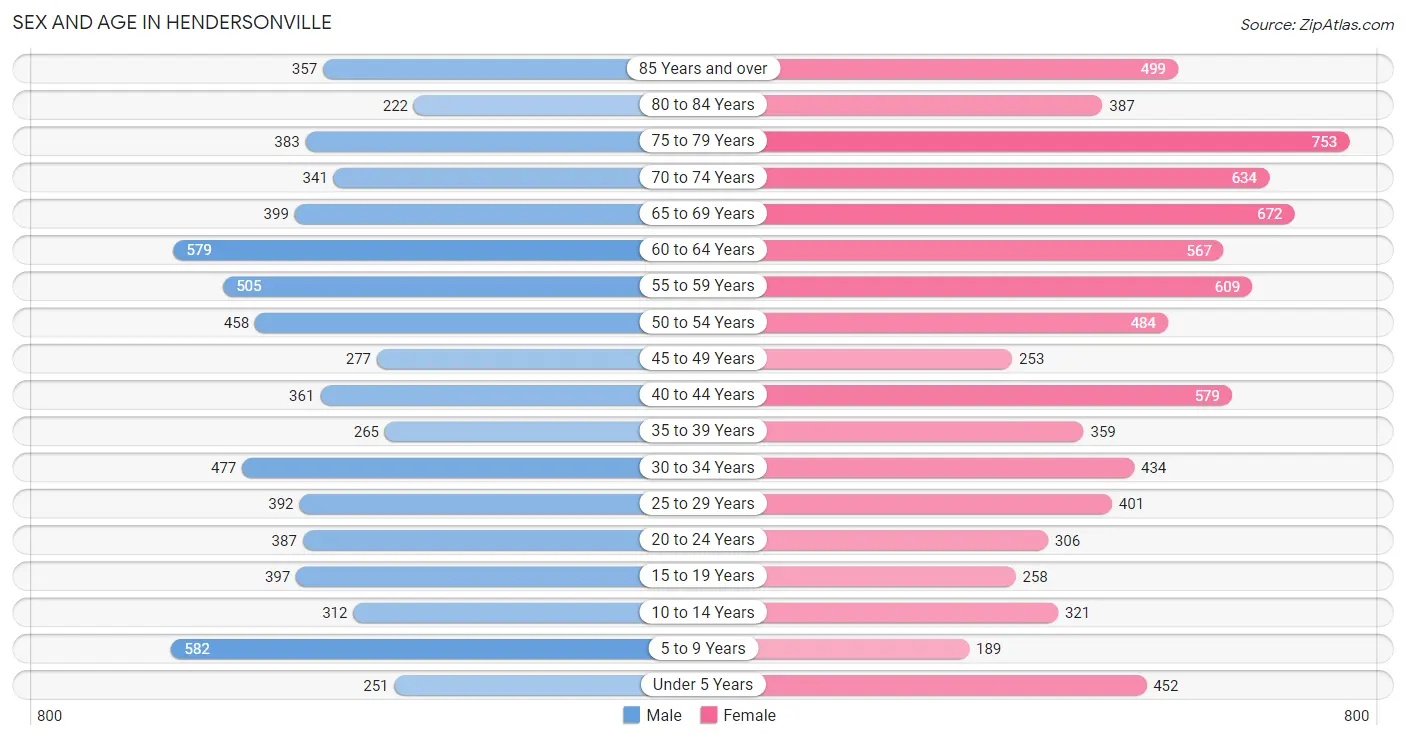
| Age Bracket | Male | Female |
| Under 5 Years | 251 (3.6%) | 452 (5.5%) |
| 5 to 9 Years | 582 (8.4%) | 189 (2.3%) |
| 10 to 14 Years | 312 (4.5%) | 321 (3.9%) |
| 15 to 19 Years | 397 (5.7%) | 258 (3.2%) |
| 20 to 24 Years | 387 (5.6%) | 306 (3.7%) |
| 25 to 29 Years | 392 (5.6%) | 401 (4.9%) |
| 30 to 34 Years | 477 (6.9%) | 434 (5.3%) |
| 35 to 39 Years | 265 (3.8%) | 359 (4.4%) |
| 40 to 44 Years | 361 (5.2%) | 579 (7.1%) |
| 45 to 49 Years | 277 (4.0%) | 253 (3.1%) |
| 50 to 54 Years | 458 (6.6%) | 484 (5.9%) |
| 55 to 59 Years | 505 (7.3%) | 609 (7.5%) |
| 60 to 64 Years | 579 (8.3%) | 567 (7.0%) |
| 65 to 69 Years | 399 (5.8%) | 672 (8.2%) |
| 70 to 74 Years | 341 (4.9%) | 634 (7.8%) |
| 75 to 79 Years | 383 (5.5%) | 753 (9.2%) |
| 80 to 84 Years | 222 (3.2%) | 387 (4.7%) |
| 85 Years and over | 357 (5.1%) | 499 (6.1%) |
| Total | 6,945 (100.0%) | 8,157 (100.0%) |
Families and Households in Hendersonville
Median Family Size in Hendersonville
The median family size in Hendersonville is 2.70 persons per family, with single female/mother families (770 | 21.6%) accounting for the largest median family size of 3.12 persons per family. On the other hand, single male/father families (177 | 5.0%) represent the smallest median family size with 2.40 persons per family.
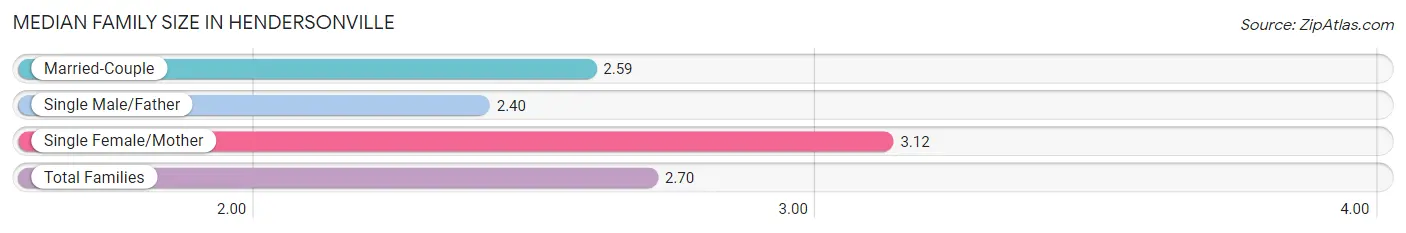
| Family Type | # Families | Family Size |
| Married-Couple | 2,620 (73.5%) | 2.59 |
| Single Male/Father | 177 (5.0%) | 2.40 |
| Single Female/Mother | 770 (21.6%) | 3.12 |
| Total Families | 3,567 (100.0%) | 2.70 |
Median Household Size in Hendersonville
The median household size in Hendersonville is 1.91 persons per household, with single male/father households (177 | 2.3%) accounting for the largest median household size of 3.4 persons per household. non-family households (4,084 | 53.4%) represent the smallest median household size with 1.16 persons per household.
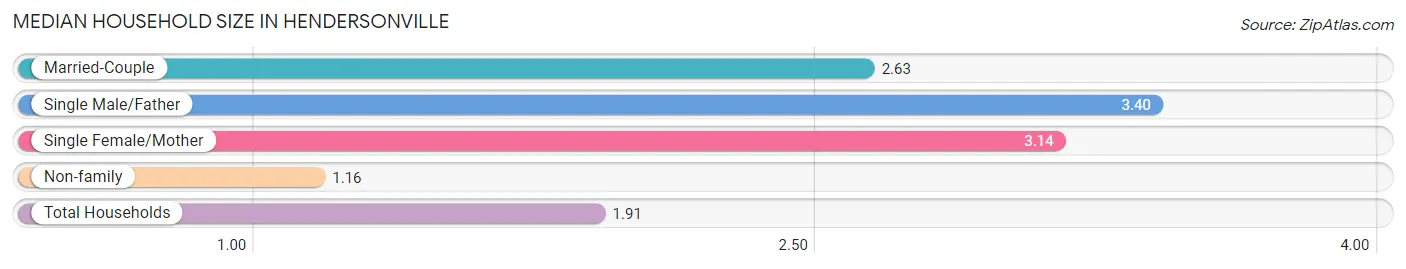
| Household Type | # Households | Household Size |
| Married-Couple | 2,620 (34.2%) | 2.63 |
| Single Male/Father | 177 (2.3%) | 3.40 |
| Single Female/Mother | 770 (10.1%) | 3.14 |
| Non-family | 4,084 (53.4%) | 1.16 |
| Total Households | 7,651 (100.0%) | 1.91 |
Household Size by Marriage Status in Hendersonville
Out of a total of 7,651 households in Hendersonville, 3,567 (46.6%) are family households, while 4,084 (53.4%) are nonfamily households. The most numerous type of family households are 2-person households, comprising 2,164, and the most common type of nonfamily households are 1-person households, comprising 3,602.
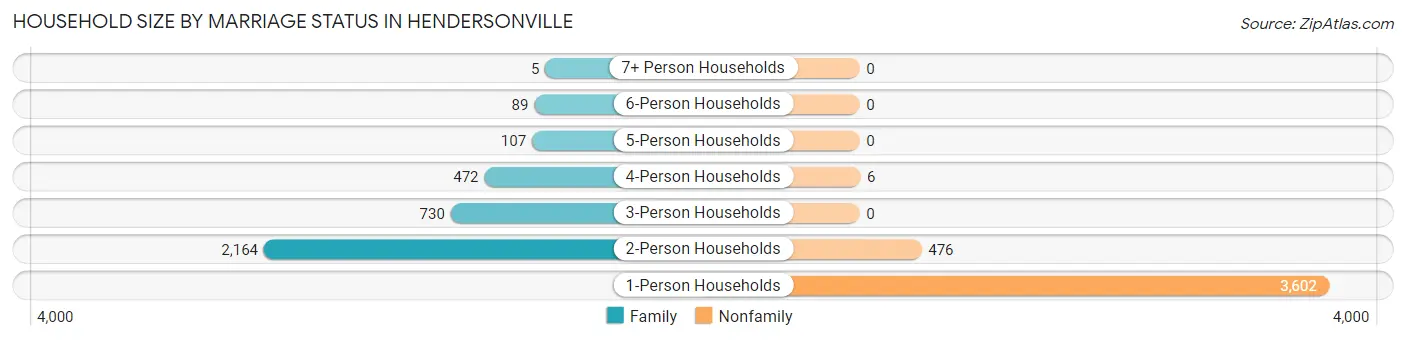
| Household Size | Family Households | Nonfamily Households |
| 1-Person Households | - | 3,602 (47.1%) |
| 2-Person Households | 2,164 (28.3%) | 476 (6.2%) |
| 3-Person Households | 730 (9.5%) | 0 (0.0%) |
| 4-Person Households | 472 (6.2%) | 6 (0.1%) |
| 5-Person Households | 107 (1.4%) | 0 (0.0%) |
| 6-Person Households | 89 (1.2%) | 0 (0.0%) |
| 7+ Person Households | 5 (0.1%) | 0 (0.0%) |
| Total | 3,567 (46.6%) | 4,084 (53.4%) |
Female Fertility in Hendersonville
Fertility by Age in Hendersonville
Average fertility rate in Hendersonville is 53.0 births per 1,000 women. Women in the age bracket of 20 to 34 years have the highest fertility rate with 113.0 births per 1,000 women. Women in the age bracket of 20 to 34 years acount for 90.8% of all women with births.
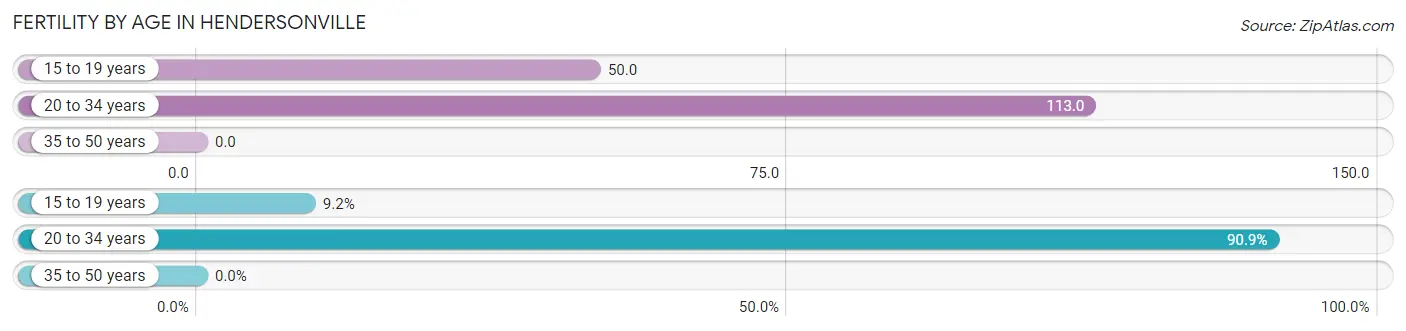
| Age Bracket | Women with Births | Births / 1,000 Women |
| 15 to 19 years | 13 (9.1%) | 50.0 |
| 20 to 34 years | 129 (90.8%) | 113.0 |
| 35 to 50 years | 0 (0.0%) | 0.0 |
| Total | 142 (100.0%) | 53.0 |
Fertility by Age by Marriage Status in Hendersonville
93.7% of women with births (142) in Hendersonville are married. The highest percentage of unmarried women with births falls into 15 to 19 years age bracket with 69.2% of them unmarried at the time of birth, while the lowest percentage of unmarried women with births belong to 20 to 34 years age bracket with 0.0% of them unmarried.
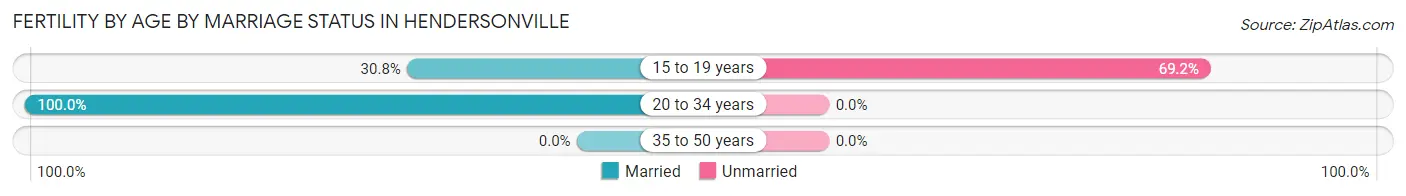
| Age Bracket | Married | Unmarried |
| 15 to 19 years | 4 (30.8%) | 9 (69.2%) |
| 20 to 34 years | 129 (100.0%) | 0 (0.0%) |
| 35 to 50 years | 0 (0.0%) | 0 (0.0%) |
| Total | 133 (93.7%) | 9 (6.3%) |
Fertility by Education in Hendersonville
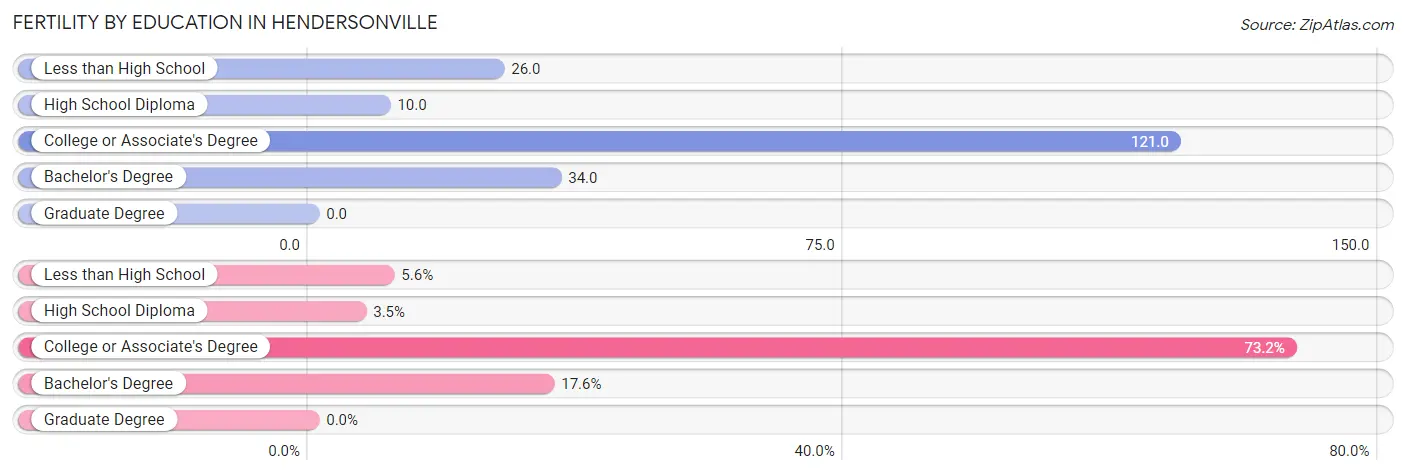
| Educational Attainment | Women with Births | Births / 1,000 Women |
| Less than High School | 8 (5.6%) | 26.0 |
| High School Diploma | 5 (3.5%) | 10.0 |
| College or Associate's Degree | 104 (73.2%) | 121.0 |
| Bachelor's Degree | 25 (17.6%) | 34.0 |
| Graduate Degree | 0 (0.0%) | 0.0 |
| Total | 142 (100.0%) | 53.0 |
Fertility by Education by Marriage Status in Hendersonville
6.3% of women with births in Hendersonville are unmarried. Women with the educational attainment of college or associate's degree are most likely to be married with 100.0% of them married at childbirth, while women with the educational attainment of high school diploma are least likely to be married with 100.0% of them unmarried at childbirth.
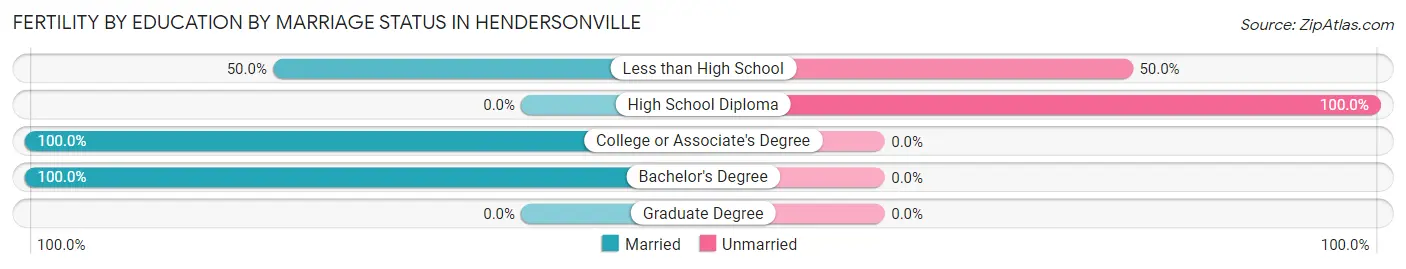
| Educational Attainment | Married | Unmarried |
| Less than High School | 4 (50.0%) | 4 (50.0%) |
| High School Diploma | 0 (0.0%) | 5 (100.0%) |
| College or Associate's Degree | 104 (100.0%) | 0 (0.0%) |
| Bachelor's Degree | 25 (100.0%) | 0 (0.0%) |
| Graduate Degree | 0 (0.0%) | 0 (0.0%) |
| Total | 133 (93.7%) | 9 (6.3%) |
Employment Characteristics in Hendersonville
Employment by Class of Employer in Hendersonville
Among the 6,667 employed individuals in Hendersonville, private company employees (4,316 | 64.7%), not-for-profit organizations (822 | 12.3%), and self-employed (not incorporated) (608 | 9.1%) make up the most common classes of employment.
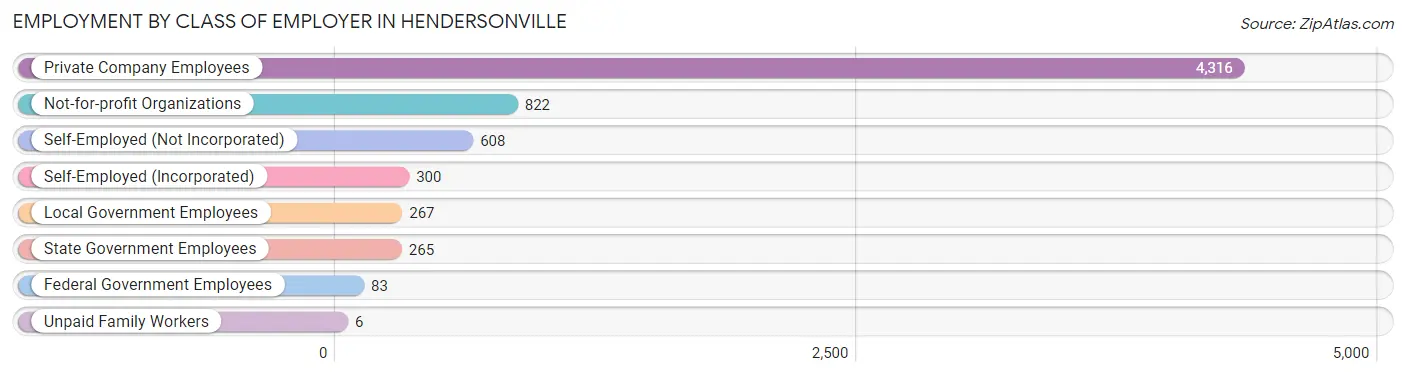
| Employer Class | # Employees | % Employees |
| Private Company Employees | 4,316 | 64.7% |
| Self-Employed (Incorporated) | 300 | 4.5% |
| Self-Employed (Not Incorporated) | 608 | 9.1% |
| Not-for-profit Organizations | 822 | 12.3% |
| Local Government Employees | 267 | 4.0% |
| State Government Employees | 265 | 4.0% |
| Federal Government Employees | 83 | 1.2% |
| Unpaid Family Workers | 6 | 0.1% |
| Total | 6,667 | 100.0% |
Employment Status by Age in Hendersonville
According to the labor force statistics for Hendersonville, out of the total population over 16 years of age (12,854), 53.8% or 6,915 individuals are in the labor force, with 2.2% or 152 of them unemployed. The age group with the highest labor force participation rate is 25 to 29 years, with 89.3% or 708 individuals in the labor force. Within the labor force, the 25 to 29 years age range has the highest percentage of unemployed individuals, with 5.5% or 39 of them being unemployed.
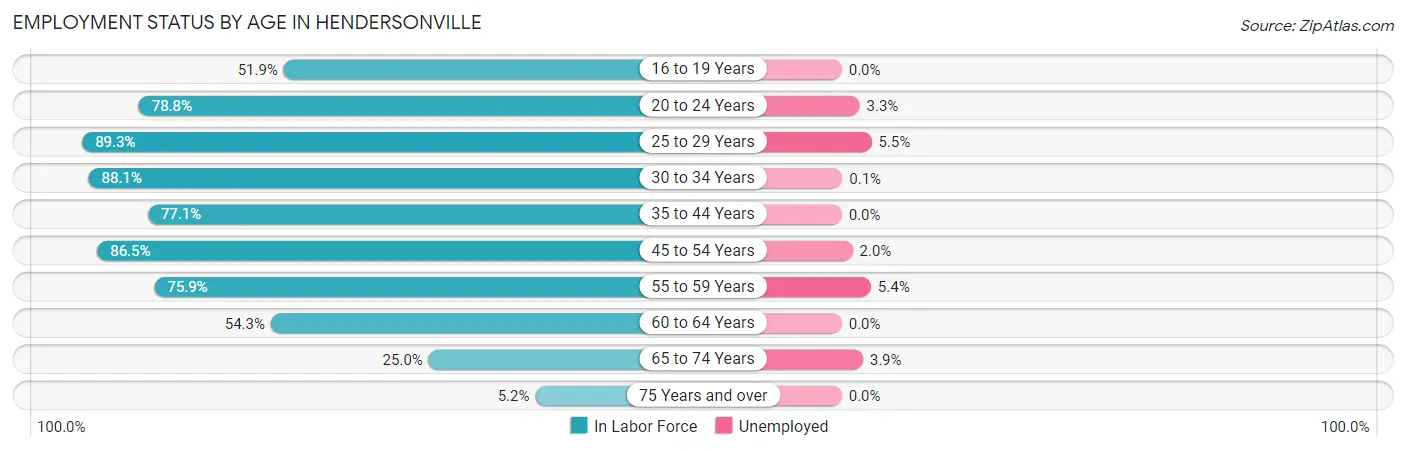
| Age Bracket | In Labor Force | Unemployed |
| 16 to 19 Years | 267 (51.9%) | 0 (0.0%) |
| 20 to 24 Years | 546 (78.8%) | 18 (3.3%) |
| 25 to 29 Years | 708 (89.3%) | 39 (5.5%) |
| 30 to 34 Years | 803 (88.1%) | 1 (0.1%) |
| 35 to 44 Years | 1,206 (77.1%) | 0 (0.0%) |
| 45 to 54 Years | 1,273 (86.5%) | 25 (2.0%) |
| 55 to 59 Years | 846 (75.9%) | 46 (5.4%) |
| 60 to 64 Years | 622 (54.3%) | 0 (0.0%) |
| 65 to 74 Years | 512 (25.0%) | 20 (3.9%) |
| 75 Years and over | 135 (5.2%) | 0 (0.0%) |
| Total | 6,915 (53.8%) | 152 (2.2%) |
Employment Status by Educational Attainment in Hendersonville
According to labor force statistics for Hendersonville, 78.0% of individuals (5,460) out of the total population between 25 and 64 years of age (7,000) are in the labor force, with 2.0% or 109 of them being unemployed. The group with the highest labor force participation rate are those with the educational attainment of bachelor's degree or higher, with 84.1% or 2,067 individuals in the labor force. Within the labor force, individuals with high school diploma education have the highest percentage of unemployment, with 5.0% or 57 of them being unemployed.
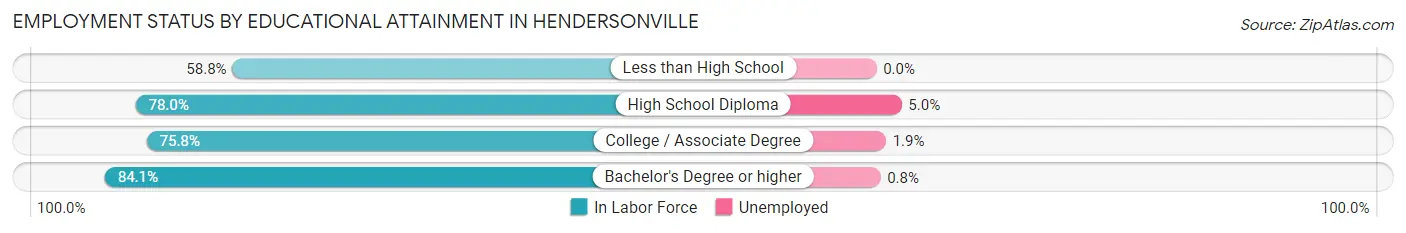
| Educational Attainment | In Labor Force | Unemployed |
| Less than High School | 297 (58.8%) | 0 (0.0%) |
| High School Diploma | 1,133 (78.0%) | 73 (5.0%) |
| College / Associate Degree | 1,959 (75.8%) | 49 (1.9%) |
| Bachelor's Degree or higher | 2,067 (84.1%) | 20 (0.8%) |
| Total | 5,460 (78.0%) | 140 (2.0%) |
Employment Occupations by Sex in Hendersonville
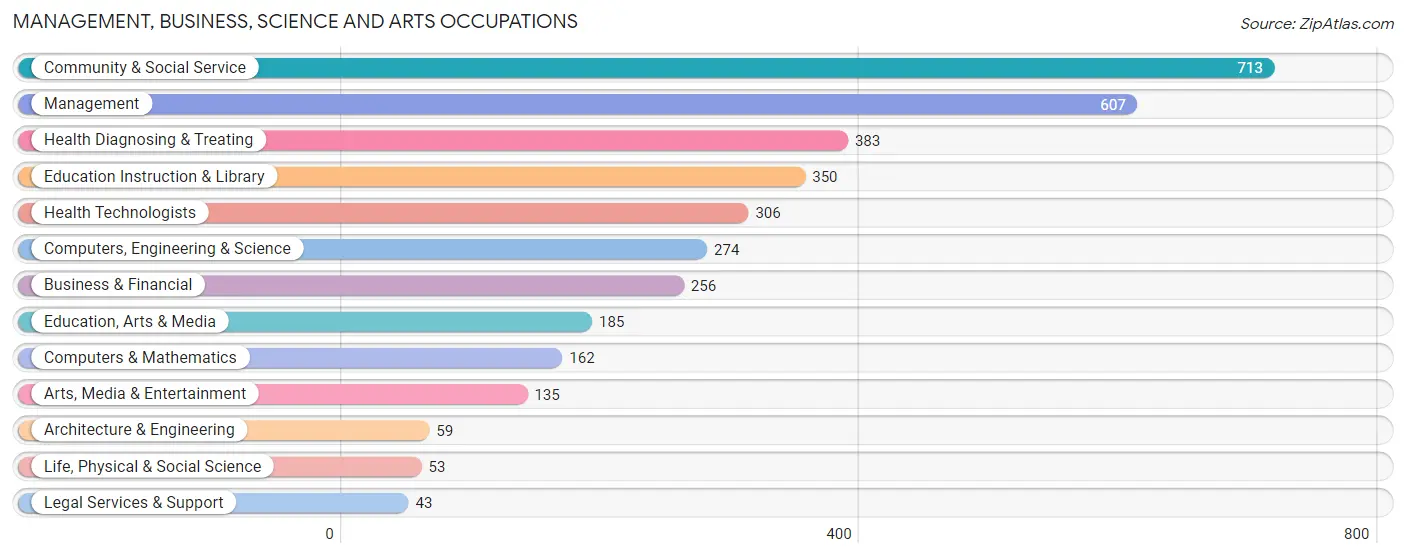
Management, Business, Science and Arts Occupations
The most common Management, Business, Science and Arts occupations in Hendersonville are Community & Social Service (713 | 10.5%), Management (607 | 9.0%), Health Diagnosing & Treating (383 | 5.7%), Education Instruction & Library (350 | 5.2%), and Health Technologists (306 | 4.5%).
Management, Business, Science and Arts Occupations by Sex
Within the Management, Business, Science and Arts occupations in Hendersonville, the most male-oriented occupations are Architecture & Engineering (100.0%), Computers & Mathematics (82.7%), and Arts, Media & Entertainment (77.0%), while the most female-oriented occupations are Life, Physical & Social Science (100.0%), Education Instruction & Library (85.1%), and Education, Arts & Media (71.4%).
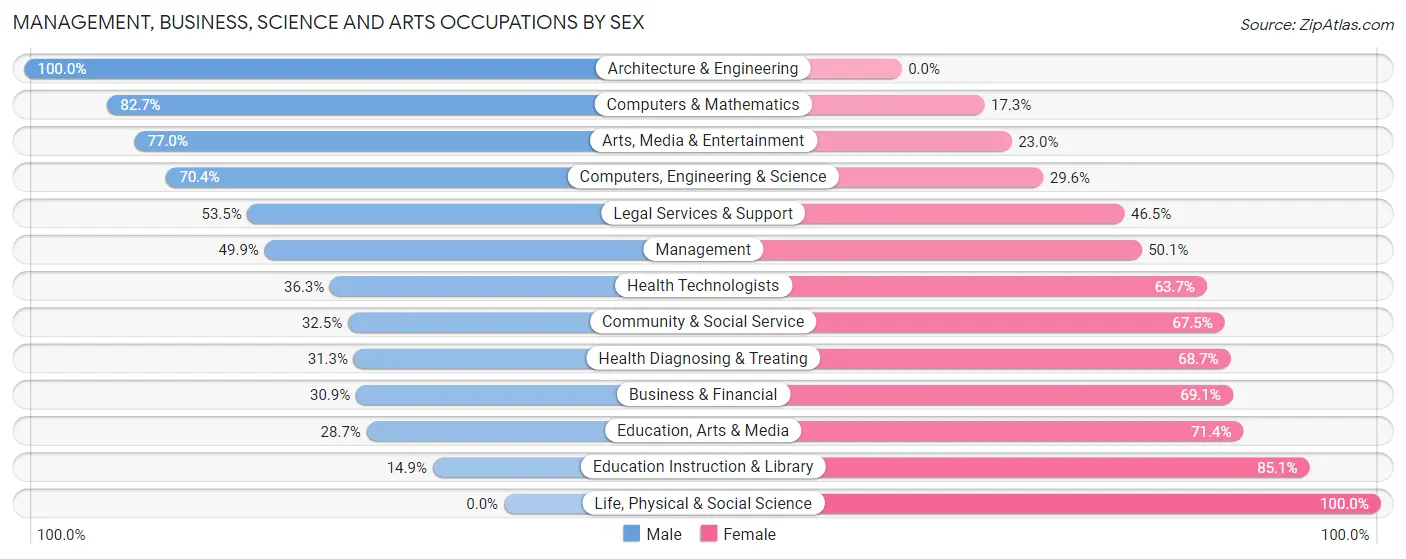
| Occupation | Male | Female |
| Management | 303 (49.9%) | 304 (50.1%) |
| Business & Financial | 79 (30.9%) | 177 (69.1%) |
| Computers, Engineering & Science | 193 (70.4%) | 81 (29.6%) |
| Computers & Mathematics | 134 (82.7%) | 28 (17.3%) |
| Architecture & Engineering | 59 (100.0%) | 0 (0.0%) |
| Life, Physical & Social Science | 0 (0.0%) | 53 (100.0%) |
| Community & Social Service | 232 (32.5%) | 481 (67.5%) |
| Education, Arts & Media | 53 (28.6%) | 132 (71.4%) |
| Legal Services & Support | 23 (53.5%) | 20 (46.5%) |
| Education Instruction & Library | 52 (14.9%) | 298 (85.1%) |
| Arts, Media & Entertainment | 104 (77.0%) | 31 (23.0%) |
| Health Diagnosing & Treating | 120 (31.3%) | 263 (68.7%) |
| Health Technologists | 111 (36.3%) | 195 (63.7%) |
| Total (Category) | 927 (41.5%) | 1,306 (58.5%) |
| Total (Overall) | 3,365 (49.7%) | 3,404 (50.3%) |
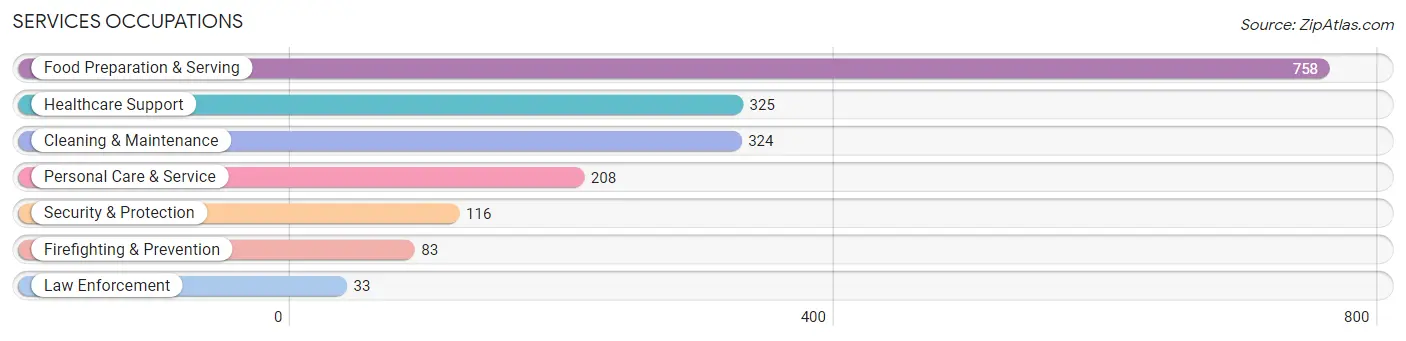
Services Occupations
The most common Services occupations in Hendersonville are Food Preparation & Serving (758 | 11.2%), Healthcare Support (325 | 4.8%), Cleaning & Maintenance (324 | 4.8%), Personal Care & Service (208 | 3.1%), and Security & Protection (116 | 1.7%).
Services Occupations by Sex
Within the Services occupations in Hendersonville, the most male-oriented occupations are Firefighting & Prevention (80.7%), Cleaning & Maintenance (70.1%), and Food Preparation & Serving (67.9%), while the most female-oriented occupations are Law Enforcement (100.0%), Personal Care & Service (96.6%), and Healthcare Support (94.5%).
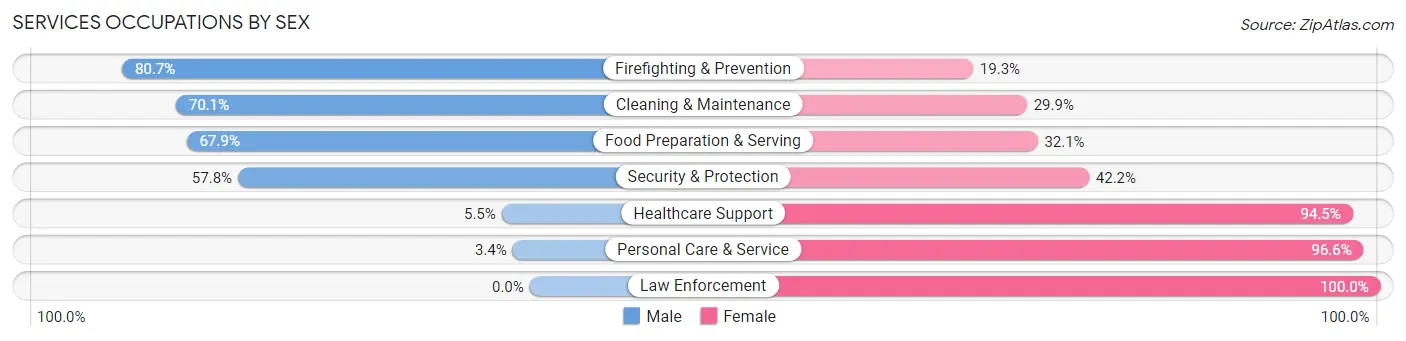
| Occupation | Male | Female |
| Healthcare Support | 18 (5.5%) | 307 (94.5%) |
| Security & Protection | 67 (57.8%) | 49 (42.2%) |
| Firefighting & Prevention | 67 (80.7%) | 16 (19.3%) |
| Law Enforcement | 0 (0.0%) | 33 (100.0%) |
| Food Preparation & Serving | 515 (67.9%) | 243 (32.1%) |
| Cleaning & Maintenance | 227 (70.1%) | 97 (29.9%) |
| Personal Care & Service | 7 (3.4%) | 201 (96.6%) |
| Total (Category) | 834 (48.2%) | 897 (51.8%) |
| Total (Overall) | 3,365 (49.7%) | 3,404 (50.3%) |
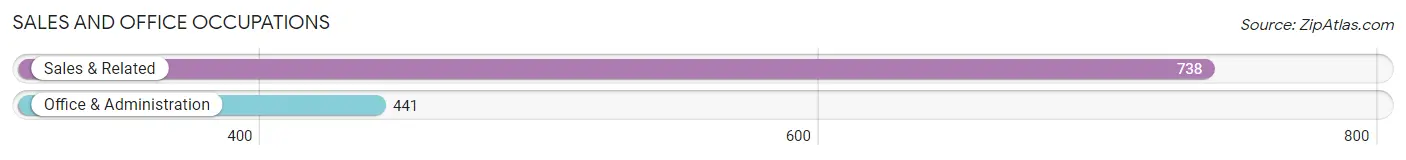
Sales and Office Occupations
The most common Sales and Office occupations in Hendersonville are Sales & Related (738 | 10.9%), and Office & Administration (441 | 6.5%).
Sales and Office Occupations by Sex
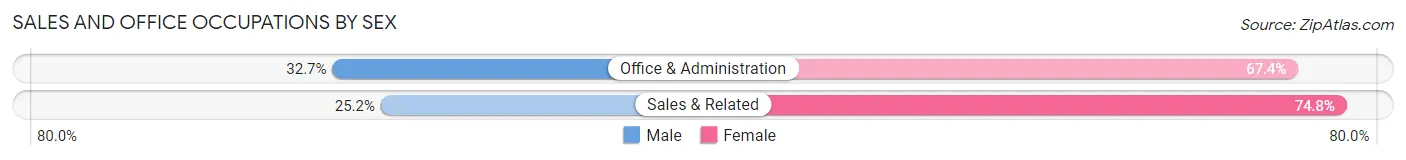
| Occupation | Male | Female |
| Sales & Related | 186 (25.2%) | 552 (74.8%) |
| Office & Administration | 144 (32.7%) | 297 (67.3%) |
| Total (Category) | 330 (28.0%) | 849 (72.0%) |
| Total (Overall) | 3,365 (49.7%) | 3,404 (50.3%) |
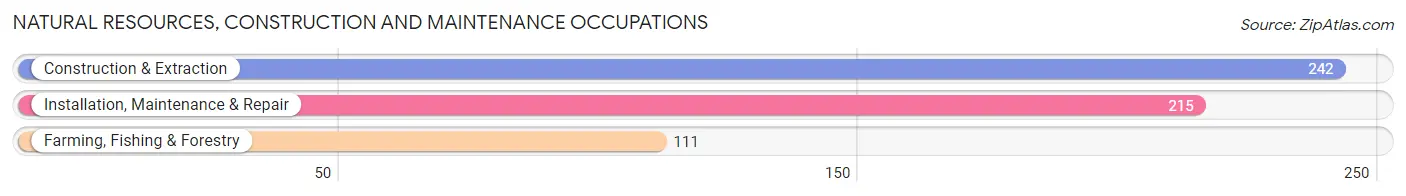
Natural Resources, Construction and Maintenance Occupations
The most common Natural Resources, Construction and Maintenance occupations in Hendersonville are Construction & Extraction (242 | 3.6%), Installation, Maintenance & Repair (215 | 3.2%), and Farming, Fishing & Forestry (111 | 1.6%).
Natural Resources, Construction and Maintenance Occupations by Sex
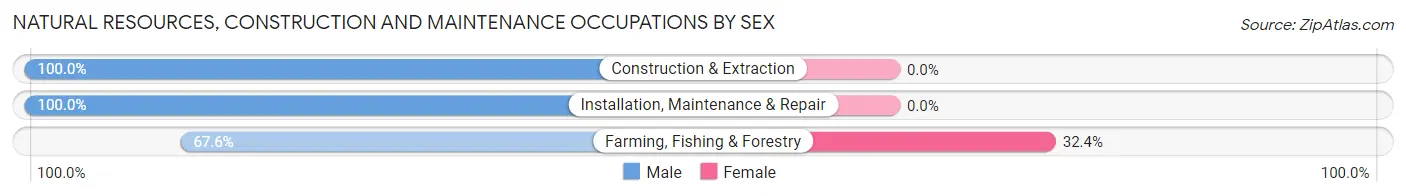
| Occupation | Male | Female |
| Farming, Fishing & Forestry | 75 (67.6%) | 36 (32.4%) |
| Construction & Extraction | 242 (100.0%) | 0 (0.0%) |
| Installation, Maintenance & Repair | 215 (100.0%) | 0 (0.0%) |
| Total (Category) | 532 (93.7%) | 36 (6.3%) |
| Total (Overall) | 3,365 (49.7%) | 3,404 (50.3%) |
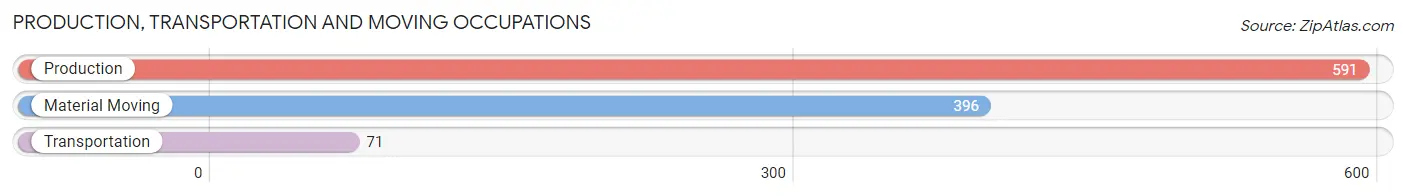
Production, Transportation and Moving Occupations
The most common Production, Transportation and Moving occupations in Hendersonville are Production (591 | 8.7%), Material Moving (396 | 5.9%), and Transportation (71 | 1.1%).
Production, Transportation and Moving Occupations by Sex
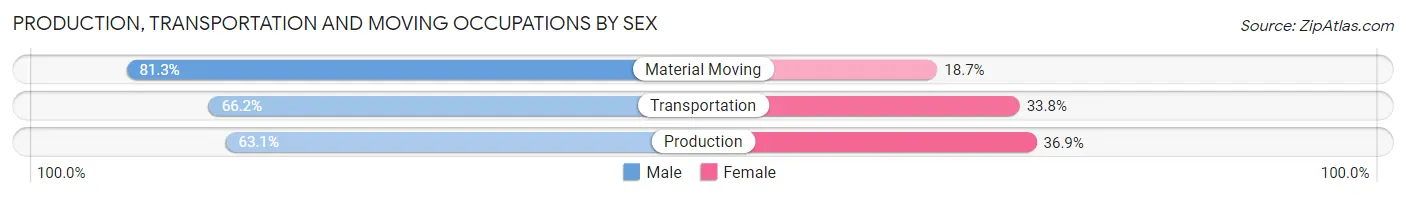
| Occupation | Male | Female |
| Production | 373 (63.1%) | 218 (36.9%) |
| Transportation | 47 (66.2%) | 24 (33.8%) |
| Material Moving | 322 (81.3%) | 74 (18.7%) |
| Total (Category) | 742 (70.1%) | 316 (29.9%) |
| Total (Overall) | 3,365 (49.7%) | 3,404 (50.3%) |
Employment Industries by Sex in Hendersonville
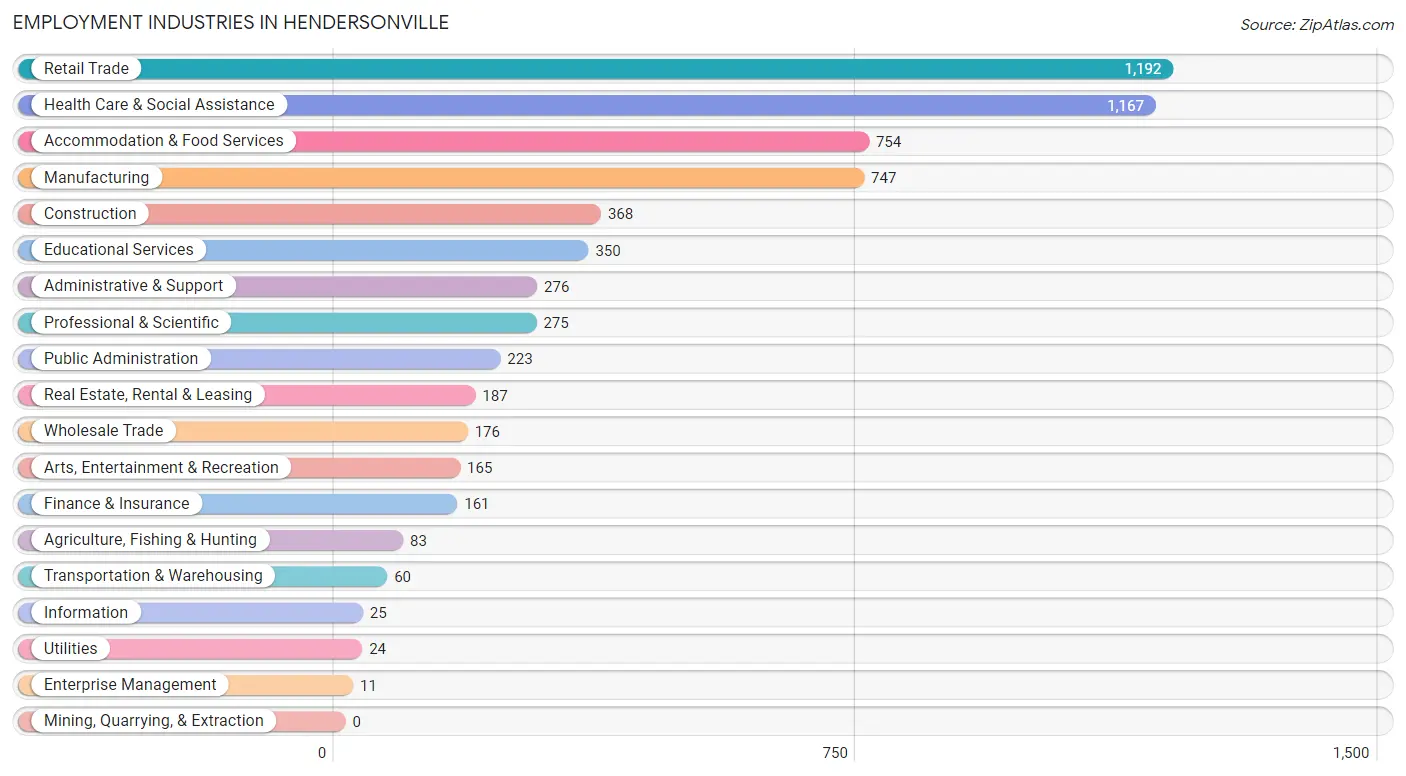
Employment Industries in Hendersonville
The major employment industries in Hendersonville include Retail Trade (1,192 | 17.6%), Health Care & Social Assistance (1,167 | 17.2%), Accommodation & Food Services (754 | 11.1%), Manufacturing (747 | 11.0%), and Construction (368 | 5.4%).
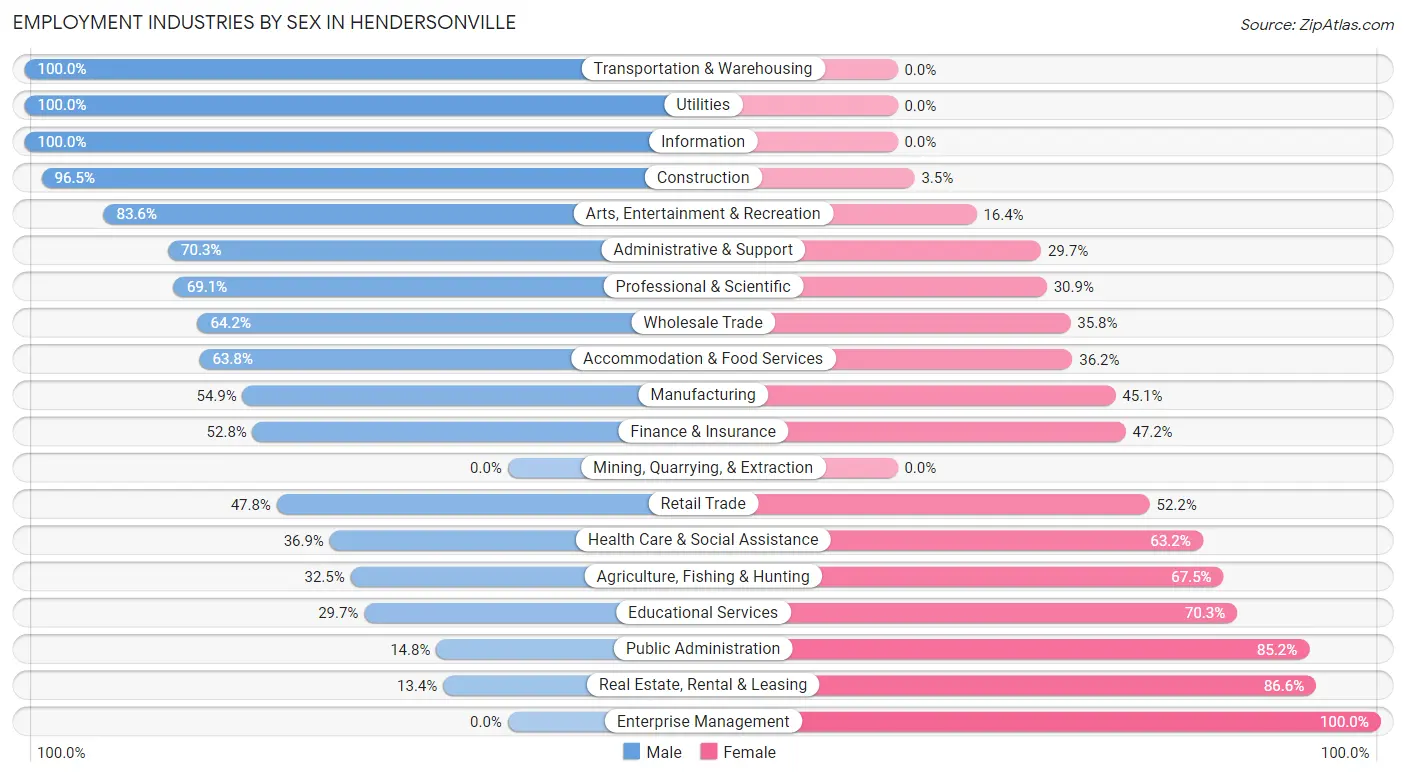
Employment Industries by Sex in Hendersonville
The Hendersonville industries that see more men than women are Transportation & Warehousing (100.0%), Utilities (100.0%), and Information (100.0%), whereas the industries that tend to have a higher number of women are Enterprise Management (100.0%), Real Estate, Rental & Leasing (86.6%), and Public Administration (85.2%).
| Industry | Male | Female |
| Agriculture, Fishing & Hunting | 27 (32.5%) | 56 (67.5%) |
| Mining, Quarrying, & Extraction | 0 (0.0%) | 0 (0.0%) |
| Construction | 355 (96.5%) | 13 (3.5%) |
| Manufacturing | 410 (54.9%) | 337 (45.1%) |
| Wholesale Trade | 113 (64.2%) | 63 (35.8%) |
| Retail Trade | 570 (47.8%) | 622 (52.2%) |
| Transportation & Warehousing | 60 (100.0%) | 0 (0.0%) |
| Utilities | 24 (100.0%) | 0 (0.0%) |
| Information | 25 (100.0%) | 0 (0.0%) |
| Finance & Insurance | 85 (52.8%) | 76 (47.2%) |
| Real Estate, Rental & Leasing | 25 (13.4%) | 162 (86.6%) |
| Professional & Scientific | 190 (69.1%) | 85 (30.9%) |
| Enterprise Management | 0 (0.0%) | 11 (100.0%) |
| Administrative & Support | 194 (70.3%) | 82 (29.7%) |
| Educational Services | 104 (29.7%) | 246 (70.3%) |
| Health Care & Social Assistance | 430 (36.8%) | 737 (63.1%) |
| Arts, Entertainment & Recreation | 138 (83.6%) | 27 (16.4%) |
| Accommodation & Food Services | 481 (63.8%) | 273 (36.2%) |
| Public Administration | 33 (14.8%) | 190 (85.2%) |
| Total | 3,365 (49.7%) | 3,404 (50.3%) |
Education in Hendersonville
School Enrollment in Hendersonville
The most common levels of schooling among the 2,489 students in Hendersonville are high school (665 | 26.7%), elementary school (595 | 23.9%), and college / undergraduate (459 | 18.4%).
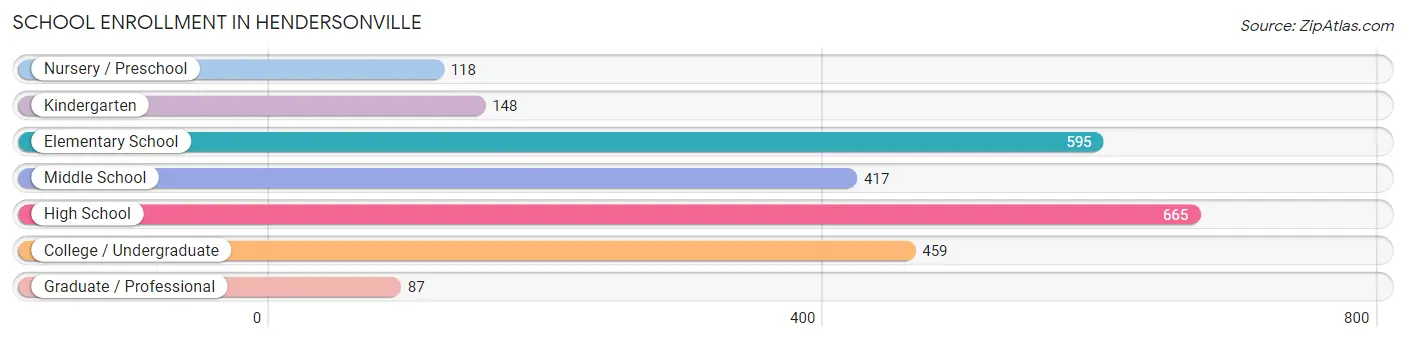
| School Level | # Students | % Students |
| Nursery / Preschool | 118 | 4.7% |
| Kindergarten | 148 | 5.9% |
| Elementary School | 595 | 23.9% |
| Middle School | 417 | 16.8% |
| High School | 665 | 26.7% |
| College / Undergraduate | 459 | 18.4% |
| Graduate / Professional | 87 | 3.5% |
| Total | 2,489 | 100.0% |
School Enrollment by Age by Funding Source in Hendersonville
Out of a total of 2,489 students who are enrolled in schools in Hendersonville, 483 (19.4%) attend a private institution, while the remaining 2,006 (80.6%) are enrolled in public schools. The age group of 3 to 4 year olds has the highest likelihood of being enrolled in private schools, with 95 (100.0% in the age bracket) enrolled. Conversely, the age group of 35 years and over has the lowest likelihood of being enrolled in a private school, with 58 (100.0% in the age bracket) attending a public institution.
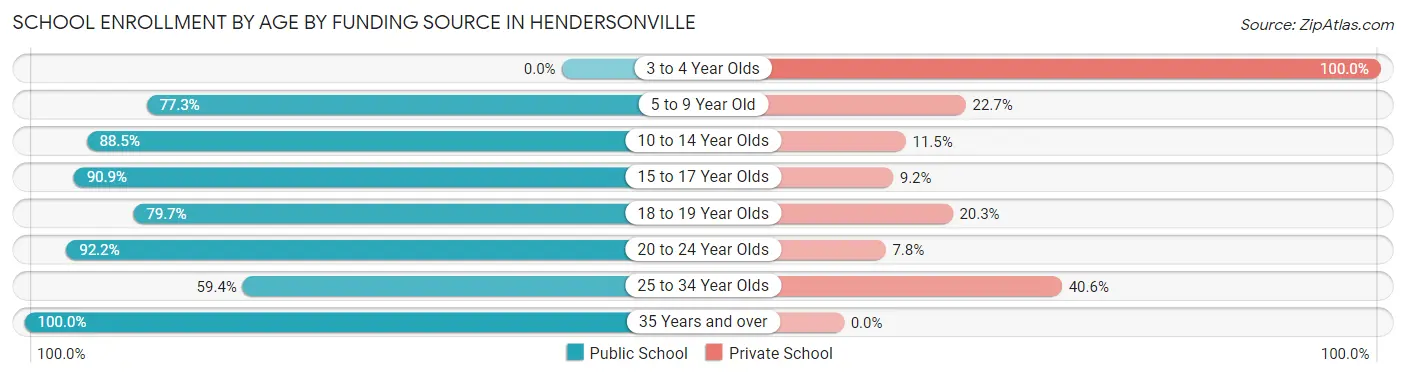
| Age Bracket | Public School | Private School |
| 3 to 4 Year Olds | 0 (0.0%) | 95 (100.0%) |
| 5 to 9 Year Old | 538 (77.3%) | 158 (22.7%) |
| 10 to 14 Year Olds | 560 (88.5%) | 73 (11.5%) |
| 15 to 17 Year Olds | 397 (90.8%) | 40 (9.1%) |
| 18 to 19 Year Olds | 122 (79.7%) | 31 (20.3%) |
| 20 to 24 Year Olds | 237 (92.2%) | 20 (7.8%) |
| 25 to 34 Year Olds | 95 (59.4%) | 65 (40.6%) |
| 35 Years and over | 58 (100.0%) | 0 (0.0%) |
| Total | 2,006 (80.6%) | 483 (19.4%) |
Educational Attainment by Field of Study in Hendersonville
Business (855 | 18.0%), education (662 | 14.0%), science & technology (435 | 9.2%), engineering (353 | 7.4%), and literature & languages (352 | 7.4%) are the most common fields of study among 4,737 individuals in Hendersonville who have obtained a bachelor's degree or higher.
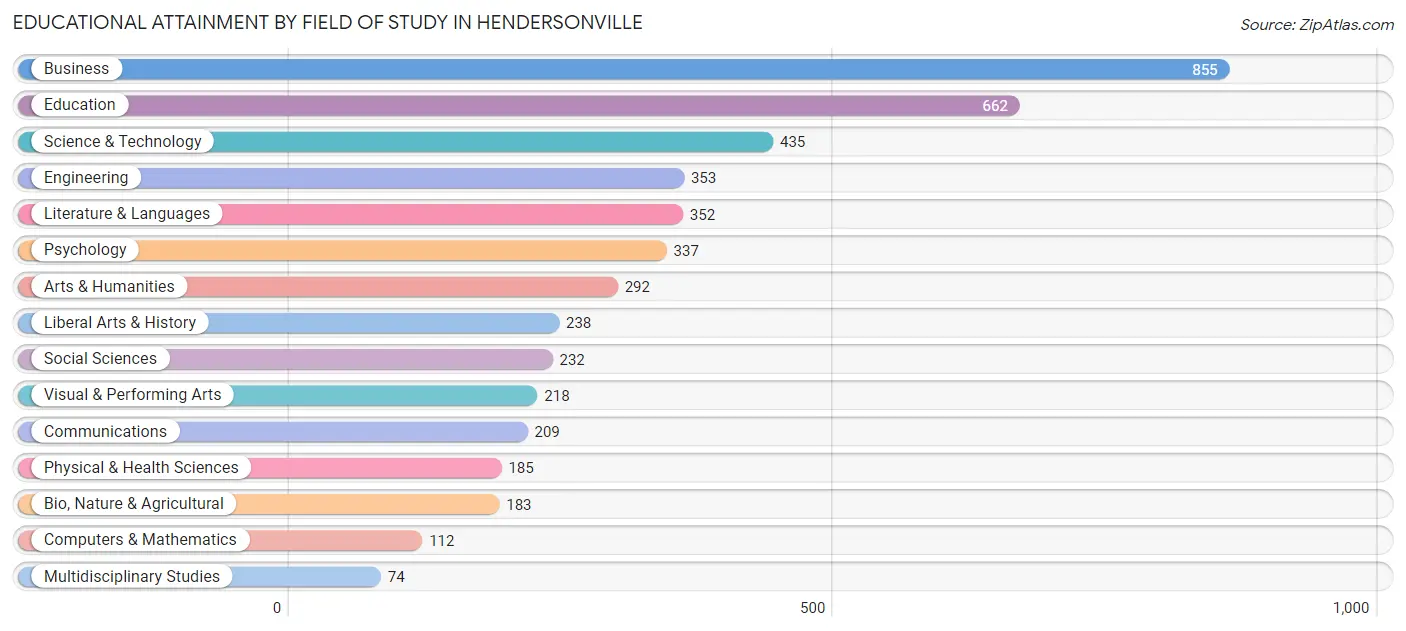
| Field of Study | # Graduates | % Graduates |
| Computers & Mathematics | 112 | 2.4% |
| Bio, Nature & Agricultural | 183 | 3.9% |
| Physical & Health Sciences | 185 | 3.9% |
| Psychology | 337 | 7.1% |
| Social Sciences | 232 | 4.9% |
| Engineering | 353 | 7.4% |
| Multidisciplinary Studies | 74 | 1.6% |
| Science & Technology | 435 | 9.2% |
| Business | 855 | 18.0% |
| Education | 662 | 14.0% |
| Literature & Languages | 352 | 7.4% |
| Liberal Arts & History | 238 | 5.0% |
| Visual & Performing Arts | 218 | 4.6% |
| Communications | 209 | 4.4% |
| Arts & Humanities | 292 | 6.2% |
| Total | 4,737 | 100.0% |
Transportation & Commute in Hendersonville
Vehicle Availability by Sex in Hendersonville
The most prevalent vehicle ownership categories in Hendersonville are males with 2 vehicles (1,688, accounting for 50.3%) and females with 2 vehicles (1,493, making up 51.2%).
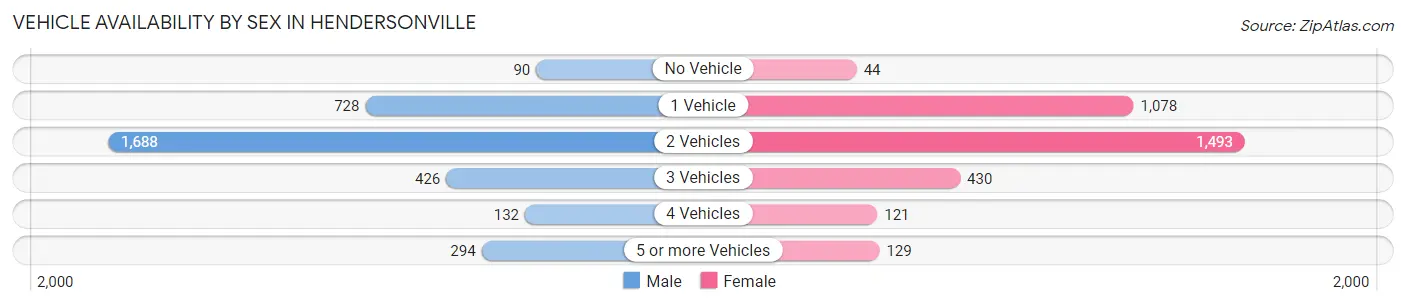
| Vehicles Available | Male | Female |
| No Vehicle | 90 (2.7%) | 44 (1.3%) |
| 1 Vehicle | 728 (21.7%) | 1,078 (32.7%) |
| 2 Vehicles | 1,688 (50.3%) | 1,493 (45.3%) |
| 3 Vehicles | 426 (12.7%) | 430 (13.1%) |
| 4 Vehicles | 132 (3.9%) | 121 (3.7%) |
| 5 or more Vehicles | 294 (8.8%) | 129 (3.9%) |
| Total | 3,358 (100.0%) | 3,295 (100.0%) |
Commute Time in Hendersonville
The most frequently occuring commute durations in Hendersonville are 15 to 19 minutes (1,212 commuters, 19.7%), 5 to 9 minutes (1,188 commuters, 19.3%), and 10 to 14 minutes (937 commuters, 15.2%).
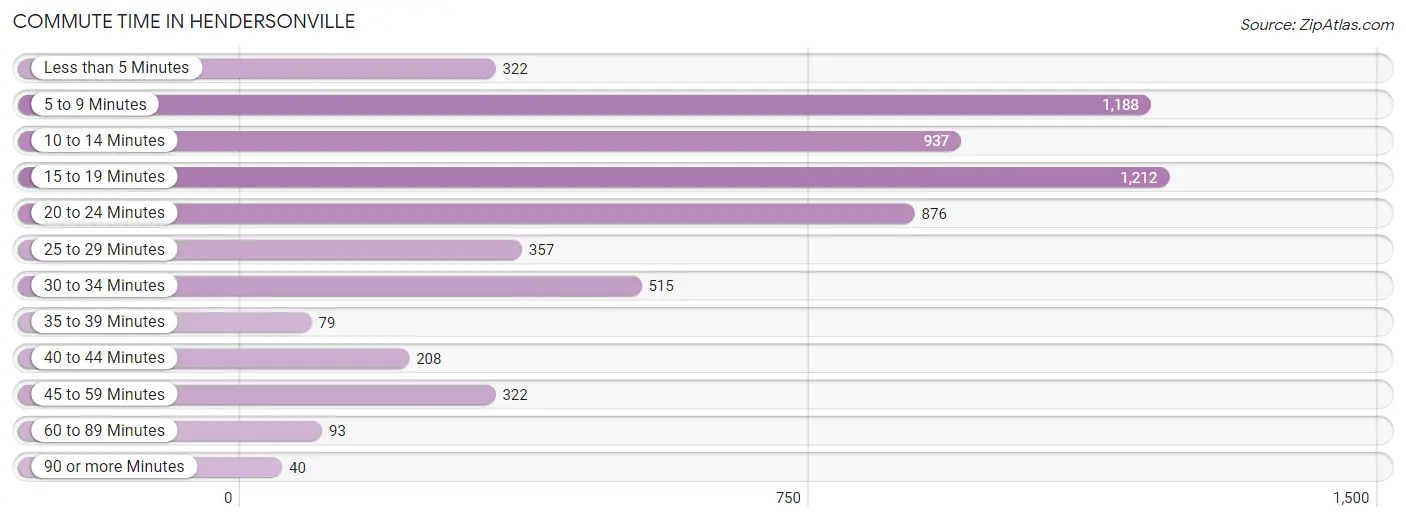
| Commute Time | # Commuters | % Commuters |
| Less than 5 Minutes | 322 | 5.2% |
| 5 to 9 Minutes | 1,188 | 19.3% |
| 10 to 14 Minutes | 937 | 15.2% |
| 15 to 19 Minutes | 1,212 | 19.7% |
| 20 to 24 Minutes | 876 | 14.2% |
| 25 to 29 Minutes | 357 | 5.8% |
| 30 to 34 Minutes | 515 | 8.4% |
| 35 to 39 Minutes | 79 | 1.3% |
| 40 to 44 Minutes | 208 | 3.4% |
| 45 to 59 Minutes | 322 | 5.2% |
| 60 to 89 Minutes | 93 | 1.5% |
| 90 or more Minutes | 40 | 0.6% |
Commute Time by Sex in Hendersonville
The most common commute times in Hendersonville are 15 to 19 minutes (660 commuters, 21.3%) for males and 5 to 9 minutes (611 commuters, 20.0%) for females.
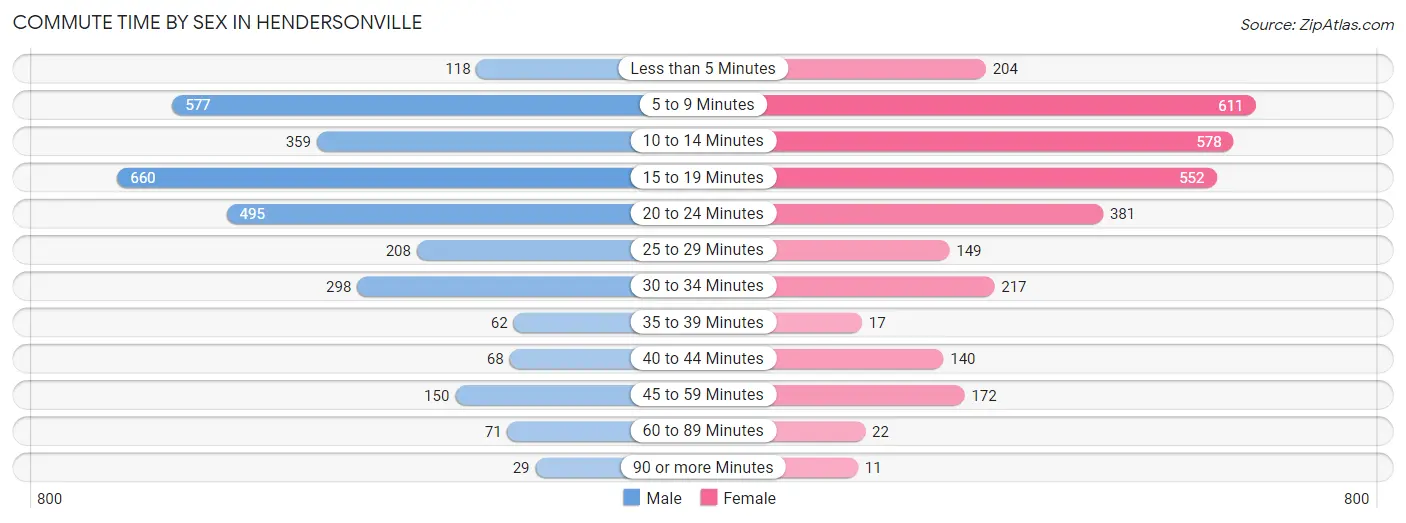
| Commute Time | Male | Female |
| Less than 5 Minutes | 118 (3.8%) | 204 (6.7%) |
| 5 to 9 Minutes | 577 (18.6%) | 611 (20.0%) |
| 10 to 14 Minutes | 359 (11.6%) | 578 (18.9%) |
| 15 to 19 Minutes | 660 (21.3%) | 552 (18.1%) |
| 20 to 24 Minutes | 495 (16.0%) | 381 (12.5%) |
| 25 to 29 Minutes | 208 (6.7%) | 149 (4.9%) |
| 30 to 34 Minutes | 298 (9.6%) | 217 (7.1%) |
| 35 to 39 Minutes | 62 (2.0%) | 17 (0.6%) |
| 40 to 44 Minutes | 68 (2.2%) | 140 (4.6%) |
| 45 to 59 Minutes | 150 (4.9%) | 172 (5.6%) |
| 60 to 89 Minutes | 71 (2.3%) | 22 (0.7%) |
| 90 or more Minutes | 29 (0.9%) | 11 (0.4%) |
Time of Departure to Work by Sex in Hendersonville
The most frequent times of departure to work in Hendersonville are 4:00 PM to 11:59 PM (545, 17.6%) for males and 7:30 AM to 7:59 AM (530, 17.3%) for females.
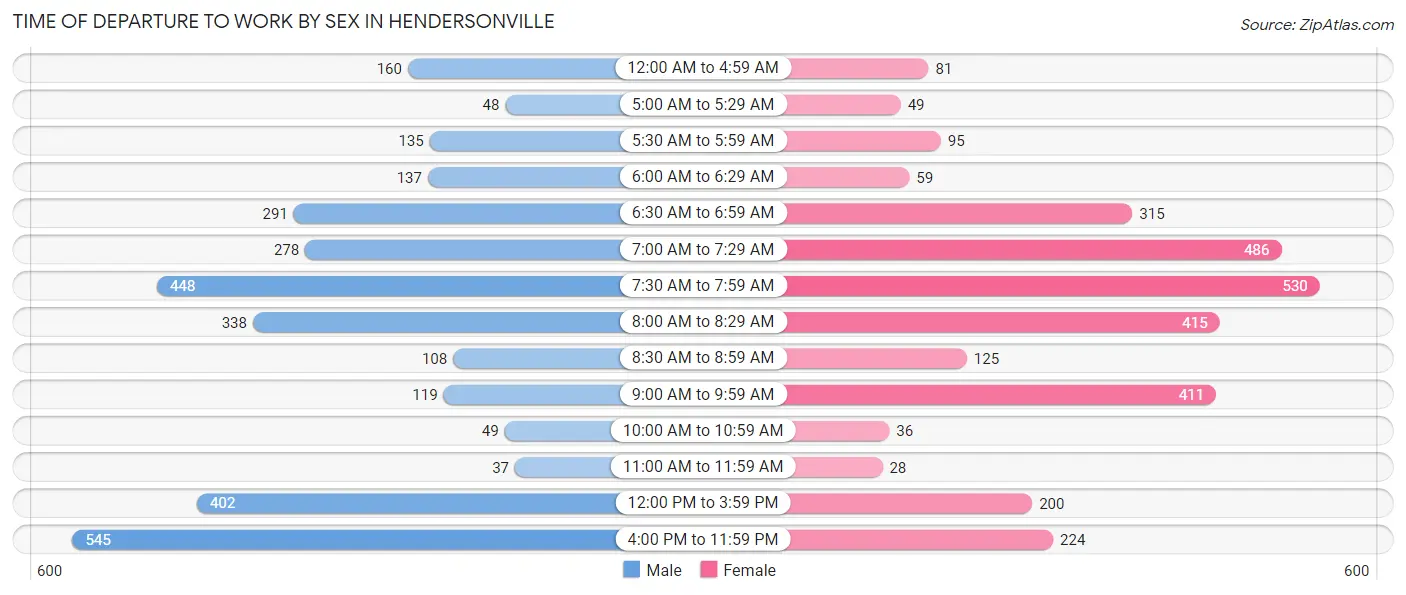
| Time of Departure | Male | Female |
| 12:00 AM to 4:59 AM | 160 (5.2%) | 81 (2.6%) |
| 5:00 AM to 5:29 AM | 48 (1.5%) | 49 (1.6%) |
| 5:30 AM to 5:59 AM | 135 (4.4%) | 95 (3.1%) |
| 6:00 AM to 6:29 AM | 137 (4.4%) | 59 (1.9%) |
| 6:30 AM to 6:59 AM | 291 (9.4%) | 315 (10.3%) |
| 7:00 AM to 7:29 AM | 278 (9.0%) | 486 (15.9%) |
| 7:30 AM to 7:59 AM | 448 (14.5%) | 530 (17.3%) |
| 8:00 AM to 8:29 AM | 338 (10.9%) | 415 (13.6%) |
| 8:30 AM to 8:59 AM | 108 (3.5%) | 125 (4.1%) |
| 9:00 AM to 9:59 AM | 119 (3.8%) | 411 (13.5%) |
| 10:00 AM to 10:59 AM | 49 (1.6%) | 36 (1.2%) |
| 11:00 AM to 11:59 AM | 37 (1.2%) | 28 (0.9%) |
| 12:00 PM to 3:59 PM | 402 (13.0%) | 200 (6.6%) |
| 4:00 PM to 11:59 PM | 545 (17.6%) | 224 (7.3%) |
| Total | 3,095 (100.0%) | 3,054 (100.0%) |
Housing Occupancy in Hendersonville
Occupancy by Ownership in Hendersonville
Of the total 7,651 dwellings in Hendersonville, owner-occupied units account for 3,637 (47.5%), while renter-occupied units make up 4,014 (52.5%).
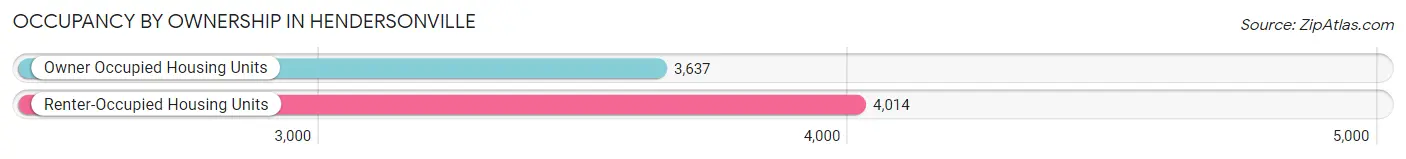
| Occupancy | # Housing Units | % Housing Units |
| Owner Occupied Housing Units | 3,637 | 47.5% |
| Renter-Occupied Housing Units | 4,014 | 52.5% |
| Total Occupied Housing Units | 7,651 | 100.0% |
Occupancy by Household Size in Hendersonville
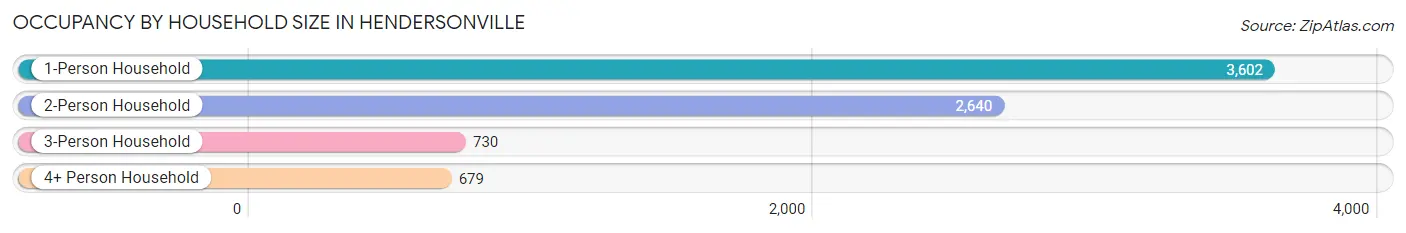
| Household Size | # Housing Units | % Housing Units |
| 1-Person Household | 3,602 | 47.1% |
| 2-Person Household | 2,640 | 34.5% |
| 3-Person Household | 730 | 9.5% |
| 4+ Person Household | 679 | 8.9% |
| Total Housing Units | 7,651 | 100.0% |
Occupancy by Ownership by Household Size in Hendersonville
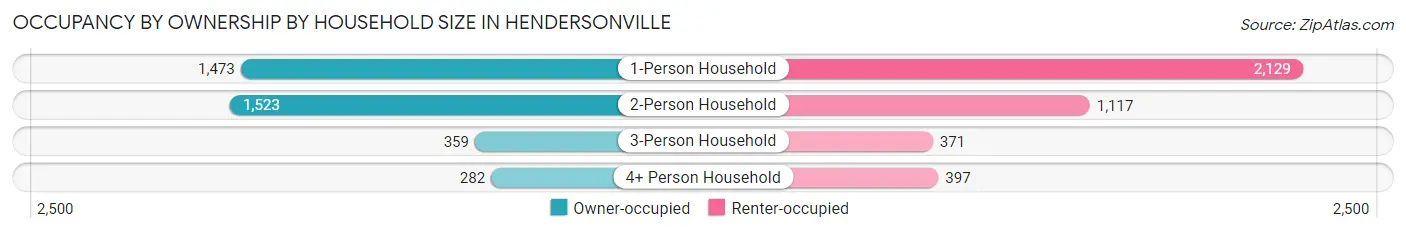
| Household Size | Owner-occupied | Renter-occupied |
| 1-Person Household | 1,473 (40.9%) | 2,129 (59.1%) |
| 2-Person Household | 1,523 (57.7%) | 1,117 (42.3%) |
| 3-Person Household | 359 (49.2%) | 371 (50.8%) |
| 4+ Person Household | 282 (41.5%) | 397 (58.5%) |
| Total Housing Units | 3,637 (47.5%) | 4,014 (52.5%) |
Occupancy by Educational Attainment in Hendersonville
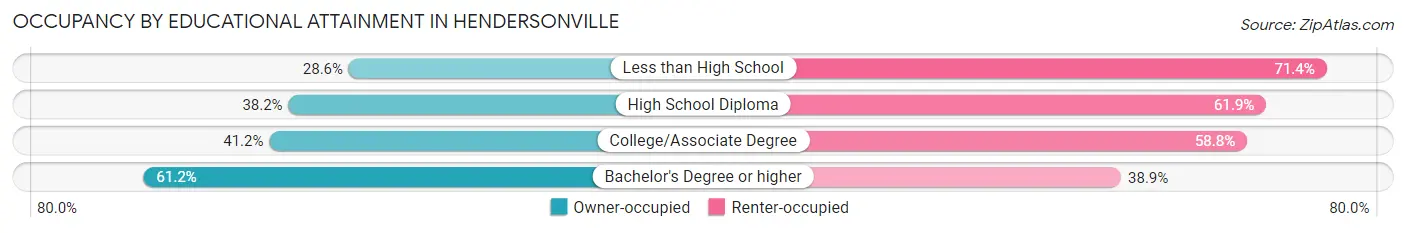
| Household Size | Owner-occupied | Renter-occupied |
| Less than High School | 166 (28.6%) | 415 (71.4%) |
| High School Diploma | 544 (38.2%) | 882 (61.9%) |
| College/Associate Degree | 1,082 (41.2%) | 1,545 (58.8%) |
| Bachelor's Degree or higher | 1,845 (61.2%) | 1,172 (38.9%) |
Occupancy by Age of Householder in Hendersonville
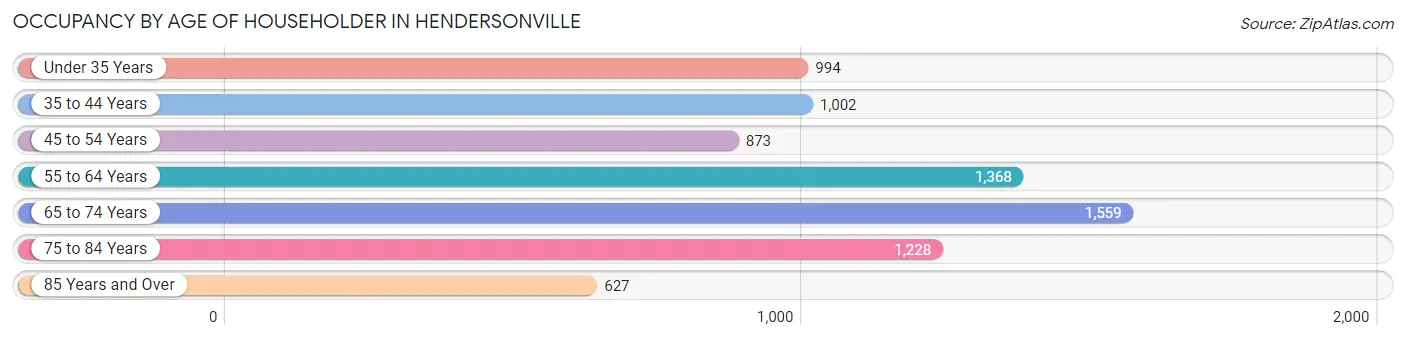
| Age Bracket | # Households | % Households |
| Under 35 Years | 994 | 13.0% |
| 35 to 44 Years | 1,002 | 13.1% |
| 45 to 54 Years | 873 | 11.4% |
| 55 to 64 Years | 1,368 | 17.9% |
| 65 to 74 Years | 1,559 | 20.4% |
| 75 to 84 Years | 1,228 | 16.1% |
| 85 Years and Over | 627 | 8.2% |
| Total | 7,651 | 100.0% |
Housing Finances in Hendersonville
Median Income by Occupancy in Hendersonville
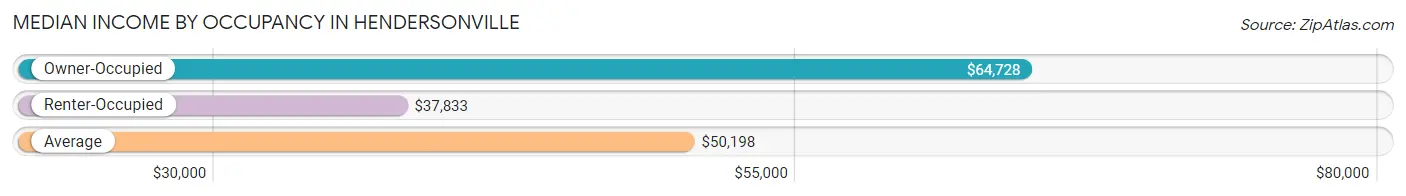
| Occupancy Type | # Households | Median Income |
| Owner-Occupied | 3,637 (47.5%) | $64,728 |
| Renter-Occupied | 4,014 (52.5%) | $37,833 |
| Average | 7,651 (100.0%) | $50,198 |
Occupancy by Householder Income Bracket in Hendersonville
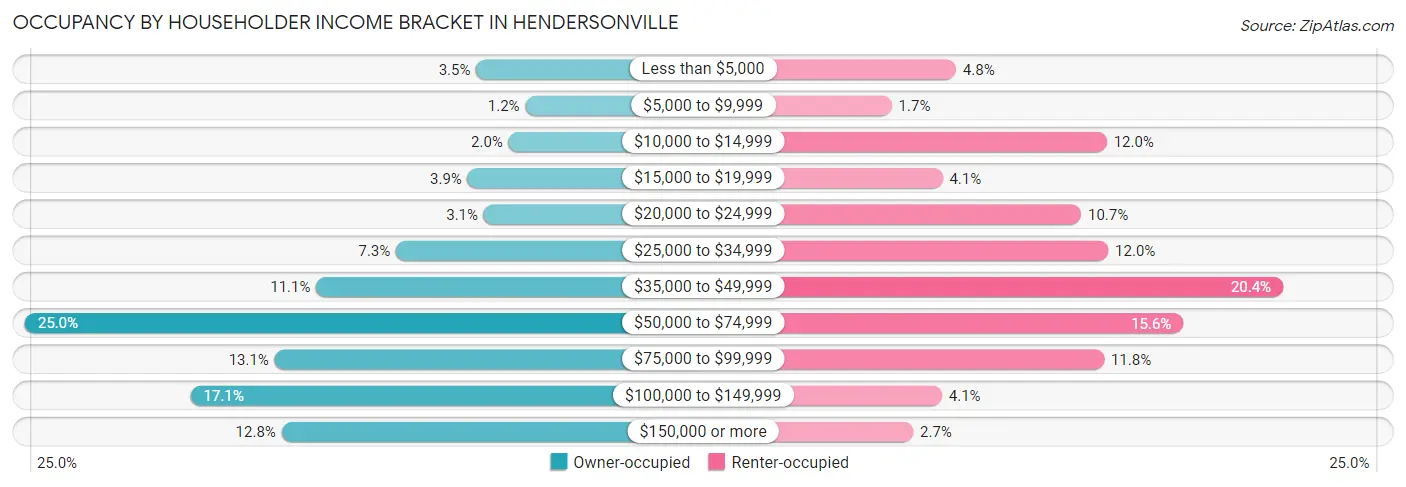
| Income Bracket | Owner-occupied | Renter-occupied |
| Less than $5,000 | 127 (3.5%) | 192 (4.8%) |
| $5,000 to $9,999 | 42 (1.1%) | 69 (1.7%) |
| $10,000 to $14,999 | 71 (1.9%) | 480 (12.0%) |
| $15,000 to $19,999 | 142 (3.9%) | 166 (4.1%) |
| $20,000 to $24,999 | 114 (3.1%) | 431 (10.7%) |
| $25,000 to $34,999 | 266 (7.3%) | 483 (12.0%) |
| $35,000 to $49,999 | 404 (11.1%) | 817 (20.3%) |
| $50,000 to $74,999 | 909 (25.0%) | 626 (15.6%) |
| $75,000 to $99,999 | 476 (13.1%) | 475 (11.8%) |
| $100,000 to $149,999 | 622 (17.1%) | 165 (4.1%) |
| $150,000 or more | 464 (12.8%) | 110 (2.7%) |
| Total | 3,637 (100.0%) | 4,014 (100.0%) |
Monthly Housing Cost Tiers in Hendersonville
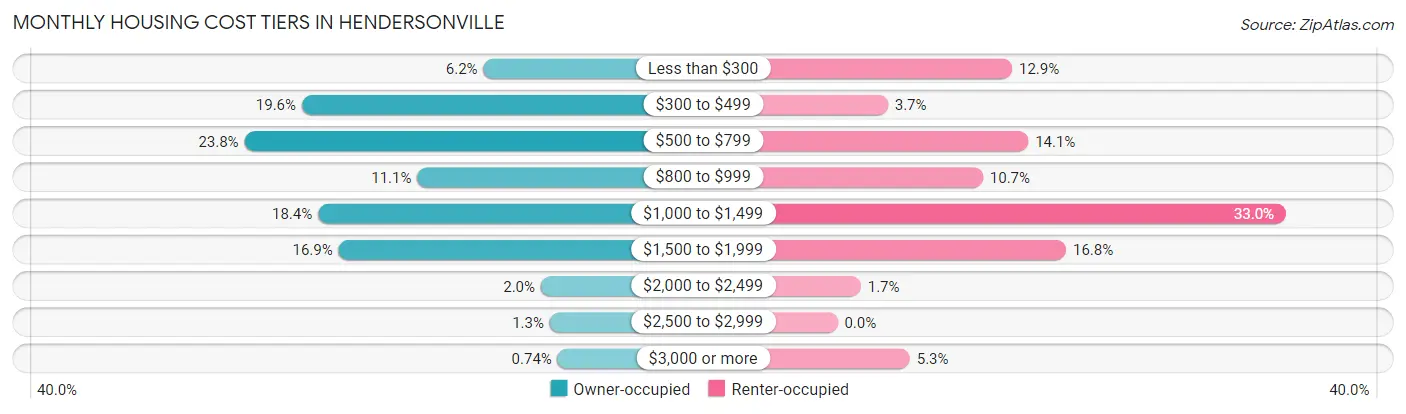
| Monthly Cost | Owner-occupied | Renter-occupied |
| Less than $300 | 226 (6.2%) | 516 (12.9%) |
| $300 to $499 | 712 (19.6%) | 149 (3.7%) |
| $500 to $799 | 866 (23.8%) | 564 (14.1%) |
| $800 to $999 | 403 (11.1%) | 430 (10.7%) |
| $1,000 to $1,499 | 669 (18.4%) | 1,326 (33.0%) |
| $1,500 to $1,999 | 614 (16.9%) | 676 (16.8%) |
| $2,000 to $2,499 | 72 (2.0%) | 69 (1.7%) |
| $2,500 to $2,999 | 48 (1.3%) | 0 (0.0%) |
| $3,000 or more | 27 (0.7%) | 214 (5.3%) |
| Total | 3,637 (100.0%) | 4,014 (100.0%) |
Physical Housing Characteristics in Hendersonville
Housing Structures in Hendersonville
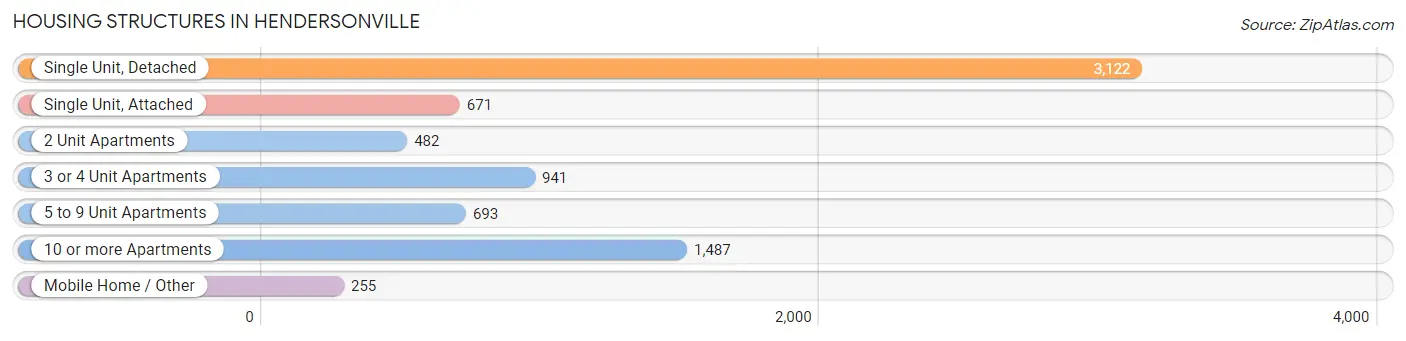
| Structure Type | # Housing Units | % Housing Units |
| Single Unit, Detached | 3,122 | 40.8% |
| Single Unit, Attached | 671 | 8.8% |
| 2 Unit Apartments | 482 | 6.3% |
| 3 or 4 Unit Apartments | 941 | 12.3% |
| 5 to 9 Unit Apartments | 693 | 9.1% |
| 10 or more Apartments | 1,487 | 19.4% |
| Mobile Home / Other | 255 | 3.3% |
| Total | 7,651 | 100.0% |
Housing Structures by Occupancy in Hendersonville
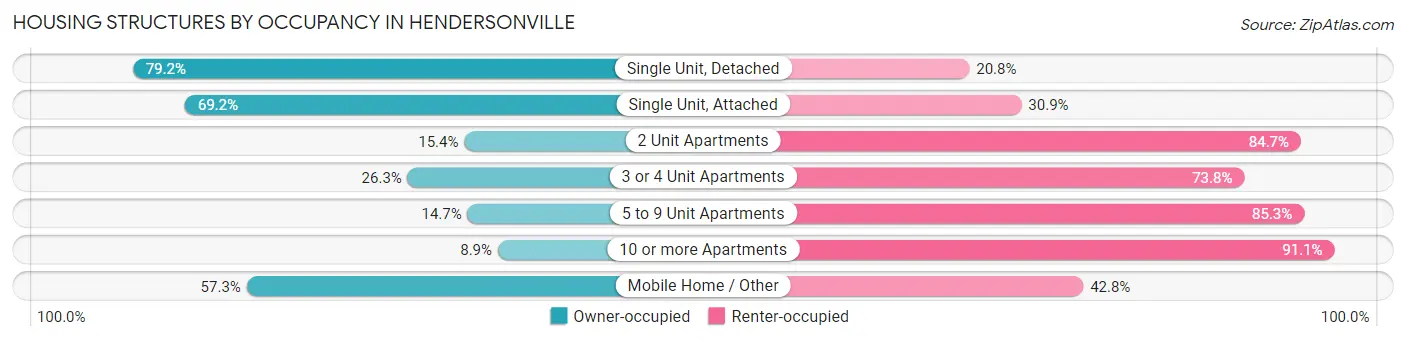
| Structure Type | Owner-occupied | Renter-occupied |
| Single Unit, Detached | 2,472 (79.2%) | 650 (20.8%) |
| Single Unit, Attached | 464 (69.2%) | 207 (30.8%) |
| 2 Unit Apartments | 74 (15.3%) | 408 (84.7%) |
| 3 or 4 Unit Apartments | 247 (26.3%) | 694 (73.8%) |
| 5 to 9 Unit Apartments | 102 (14.7%) | 591 (85.3%) |
| 10 or more Apartments | 132 (8.9%) | 1,355 (91.1%) |
| Mobile Home / Other | 146 (57.3%) | 109 (42.7%) |
| Total | 3,637 (47.5%) | 4,014 (52.5%) |
Housing Structures by Number of Rooms in Hendersonville
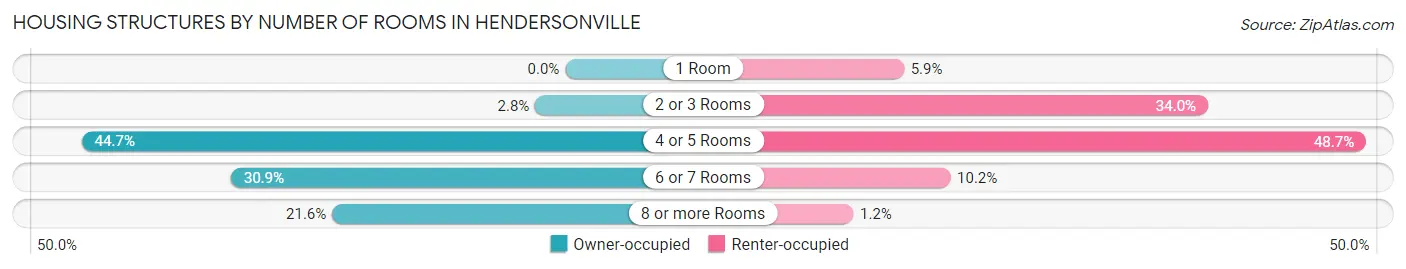
| Number of Rooms | Owner-occupied | Renter-occupied |
| 1 Room | 0 (0.0%) | 237 (5.9%) |
| 2 or 3 Rooms | 101 (2.8%) | 1,366 (34.0%) |
| 4 or 5 Rooms | 1,627 (44.7%) | 1,953 (48.6%) |
| 6 or 7 Rooms | 1,125 (30.9%) | 409 (10.2%) |
| 8 or more Rooms | 784 (21.6%) | 49 (1.2%) |
| Total | 3,637 (100.0%) | 4,014 (100.0%) |
Housing Structure by Heating Type in Hendersonville
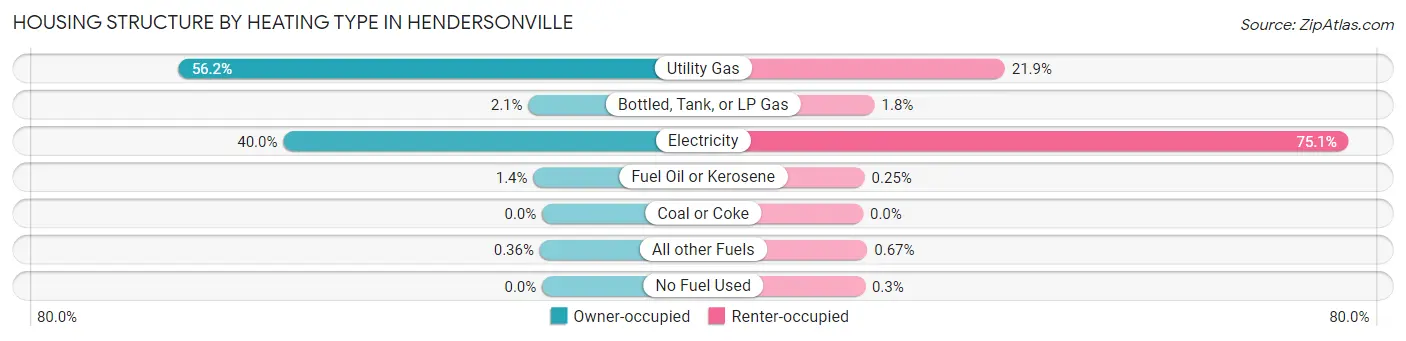
| Heating Type | Owner-occupied | Renter-occupied |
| Utility Gas | 2,043 (56.2%) | 880 (21.9%) |
| Bottled, Tank, or LP Gas | 77 (2.1%) | 72 (1.8%) |
| Electricity | 1,455 (40.0%) | 3,013 (75.1%) |
| Fuel Oil or Kerosene | 49 (1.3%) | 10 (0.3%) |
| Coal or Coke | 0 (0.0%) | 0 (0.0%) |
| All other Fuels | 13 (0.4%) | 27 (0.7%) |
| No Fuel Used | 0 (0.0%) | 12 (0.3%) |
| Total | 3,637 (100.0%) | 4,014 (100.0%) |
Household Vehicle Usage in Hendersonville
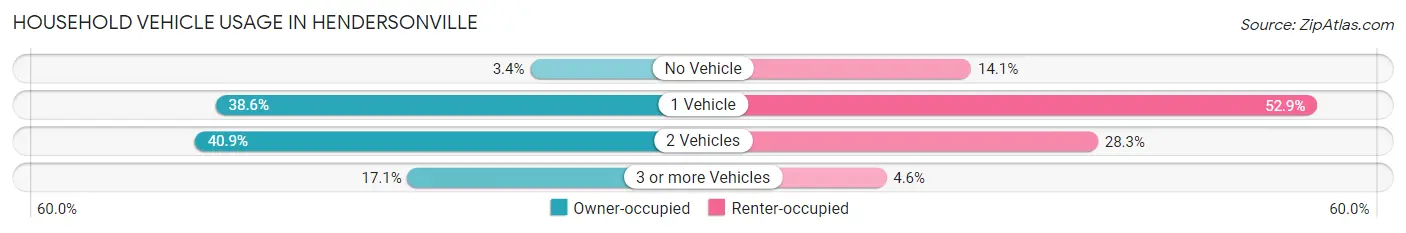
| Vehicles per Household | Owner-occupied | Renter-occupied |
| No Vehicle | 122 (3.4%) | 567 (14.1%) |
| 1 Vehicle | 1,404 (38.6%) | 2,124 (52.9%) |
| 2 Vehicles | 1,489 (40.9%) | 1,137 (28.3%) |
| 3 or more Vehicles | 622 (17.1%) | 186 (4.6%) |
| Total | 3,637 (100.0%) | 4,014 (100.0%) |
Real Estate & Mortgages in Hendersonville
Real Estate and Mortgage Overview in Hendersonville
| Characteristic | Without Mortgage | With Mortgage |
| Housing Units | 1,867 | 1,770 |
| Median Property Value | $244,700 | $261,900 |
| Median Household Income | $50,851 | $292 |
| Monthly Housing Costs | $502 | $27 |
| Real Estate Taxes | $2,036 | $0 |
Property Value by Mortgage Status in Hendersonville
| Property Value | Without Mortgage | With Mortgage |
| Less than $50,000 | 100 (5.4%) | 0 (0.0%) |
| $50,000 to $99,999 | 46 (2.5%) | 43 (2.4%) |
| $100,000 to $299,999 | 1,031 (55.2%) | 1,081 (61.1%) |
| $300,000 to $499,999 | 534 (28.6%) | 556 (31.4%) |
| $500,000 to $749,999 | 133 (7.1%) | 42 (2.4%) |
| $750,000 to $999,999 | 13 (0.7%) | 47 (2.7%) |
| $1,000,000 or more | 10 (0.5%) | 1 (0.1%) |
| Total | 1,867 (100.0%) | 1,770 (100.0%) |
Household Income by Mortgage Status in Hendersonville
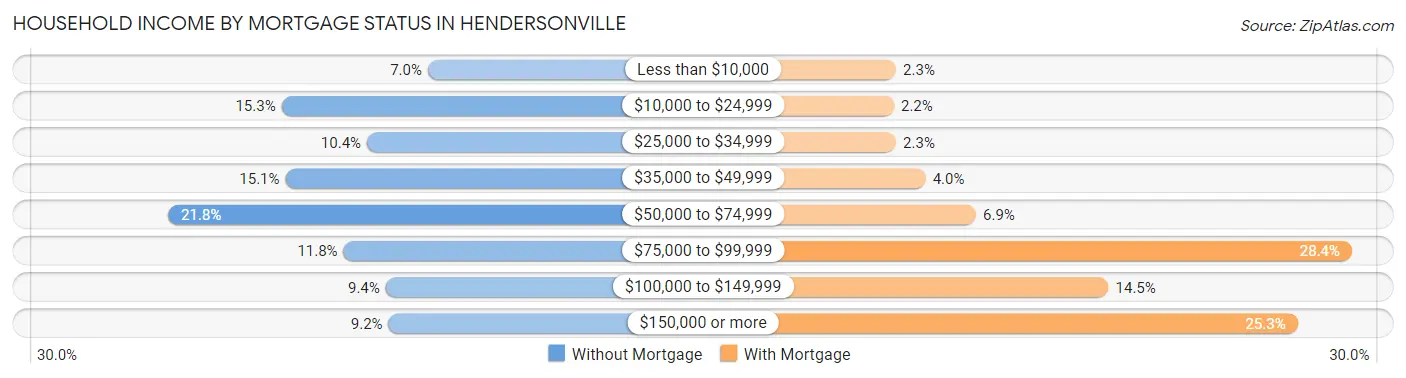
| Household Income | Without Mortgage | With Mortgage |
| Less than $10,000 | 130 (7.0%) | 41 (2.3%) |
| $10,000 to $24,999 | 286 (15.3%) | 39 (2.2%) |
| $25,000 to $34,999 | 195 (10.4%) | 41 (2.3%) |
| $35,000 to $49,999 | 282 (15.1%) | 71 (4.0%) |
| $50,000 to $74,999 | 407 (21.8%) | 122 (6.9%) |
| $75,000 to $99,999 | 220 (11.8%) | 502 (28.4%) |
| $100,000 to $149,999 | 175 (9.4%) | 256 (14.5%) |
| $150,000 or more | 172 (9.2%) | 447 (25.3%) |
| Total | 1,867 (100.0%) | 1,770 (100.0%) |
Property Value to Household Income Ratio in Hendersonville
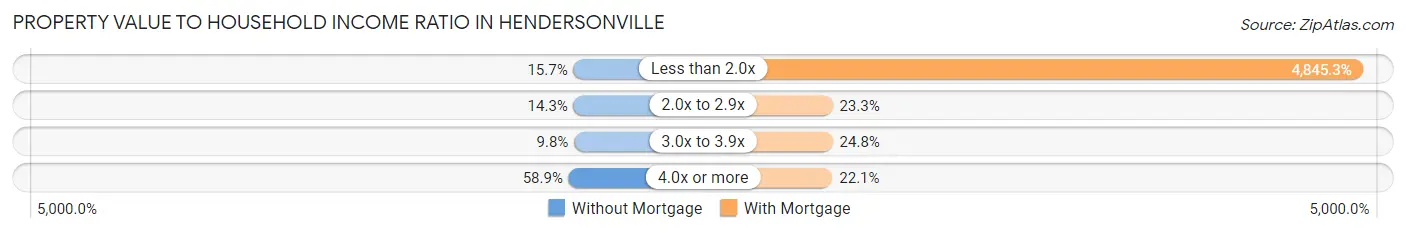
| Value-to-Income Ratio | Without Mortgage | With Mortgage |
| Less than 2.0x | 293 (15.7%) | 85,761 (4,845.3%) |
| 2.0x to 2.9x | 266 (14.2%) | 412 (23.3%) |
| 3.0x to 3.9x | 182 (9.8%) | 439 (24.8%) |
| 4.0x or more | 1,100 (58.9%) | 391 (22.1%) |
| Total | 1,867 (100.0%) | 1,770 (100.0%) |
Real Estate Taxes by Mortgage Status in Hendersonville
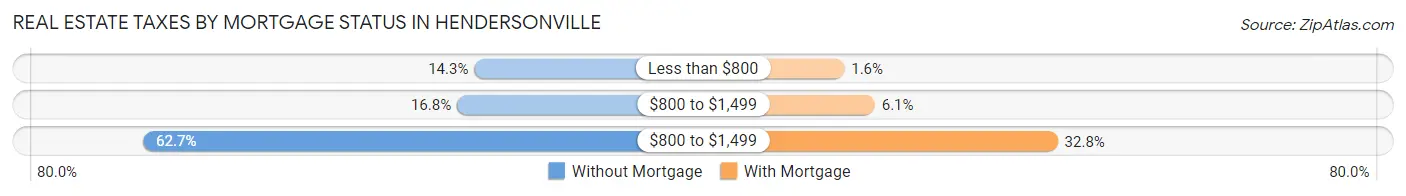
| Property Taxes | Without Mortgage | With Mortgage |
| Less than $800 | 267 (14.3%) | 29 (1.6%) |
| $800 to $1,499 | 314 (16.8%) | 108 (6.1%) |
| $800 to $1,499 | 1,170 (62.7%) | 581 (32.8%) |
| Total | 1,867 (100.0%) | 1,770 (100.0%) |
Health & Disability in Hendersonville
Health Insurance Coverage by Age in Hendersonville
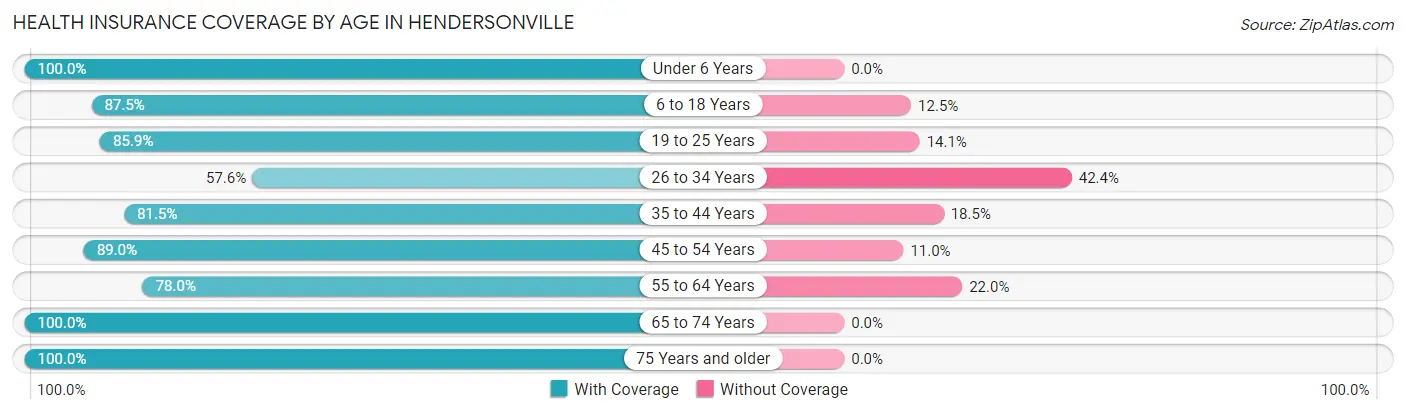
| Age Bracket | With Coverage | Without Coverage |
| Under 6 Years | 884 (100.0%) | 0 (0.0%) |
| 6 to 18 Years | 1,587 (87.5%) | 226 (12.5%) |
| 19 to 25 Years | 813 (85.9%) | 133 (14.1%) |
| 26 to 34 Years | 855 (57.6%) | 630 (42.4%) |
| 35 to 44 Years | 1,204 (81.5%) | 274 (18.5%) |
| 45 to 54 Years | 1,274 (89.0%) | 158 (11.0%) |
| 55 to 64 Years | 1,749 (78.0%) | 493 (22.0%) |
| 65 to 74 Years | 2,008 (100.0%) | 0 (0.0%) |
| 75 Years and older | 2,429 (100.0%) | 0 (0.0%) |
| Total | 12,803 (87.0%) | 1,914 (13.0%) |
Health Insurance Coverage by Citizenship Status in Hendersonville
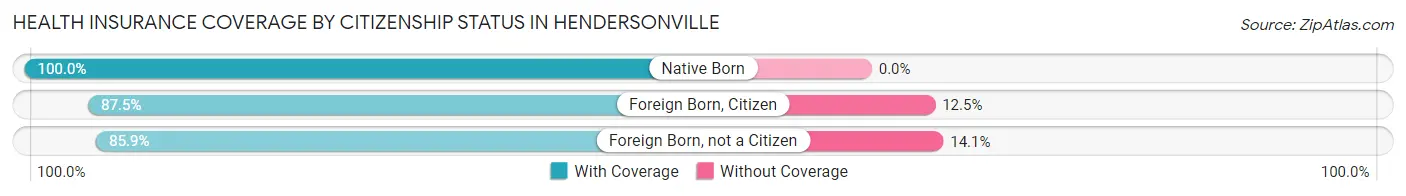
| Citizenship Status | With Coverage | Without Coverage |
| Native Born | 884 (100.0%) | 0 (0.0%) |
| Foreign Born, Citizen | 1,587 (87.5%) | 226 (12.5%) |
| Foreign Born, not a Citizen | 813 (85.9%) | 133 (14.1%) |
Health Insurance Coverage by Household Income in Hendersonville
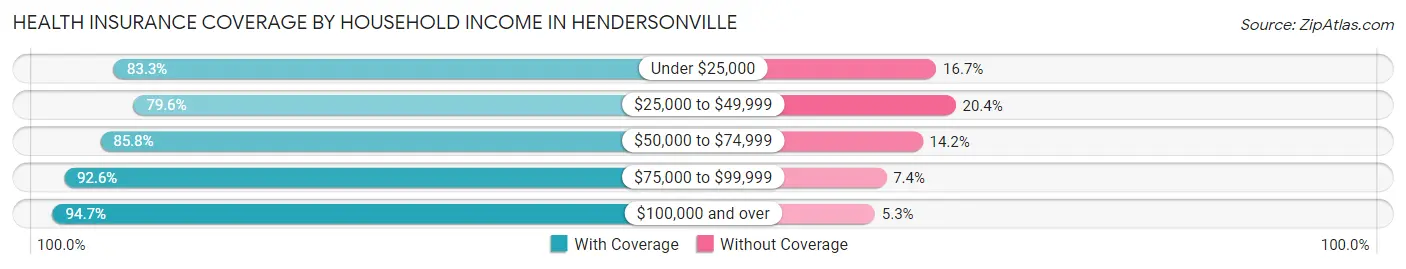
| Household Income | With Coverage | Without Coverage |
| Under $25,000 | 2,328 (83.3%) | 468 (16.7%) |
| $25,000 to $49,999 | 2,645 (79.6%) | 677 (20.4%) |
| $50,000 to $74,999 | 2,352 (85.8%) | 389 (14.2%) |
| $75,000 to $99,999 | 2,134 (92.6%) | 170 (7.4%) |
| $100,000 and over | 3,297 (94.7%) | 183 (5.3%) |
Public vs Private Health Insurance Coverage by Age in Hendersonville
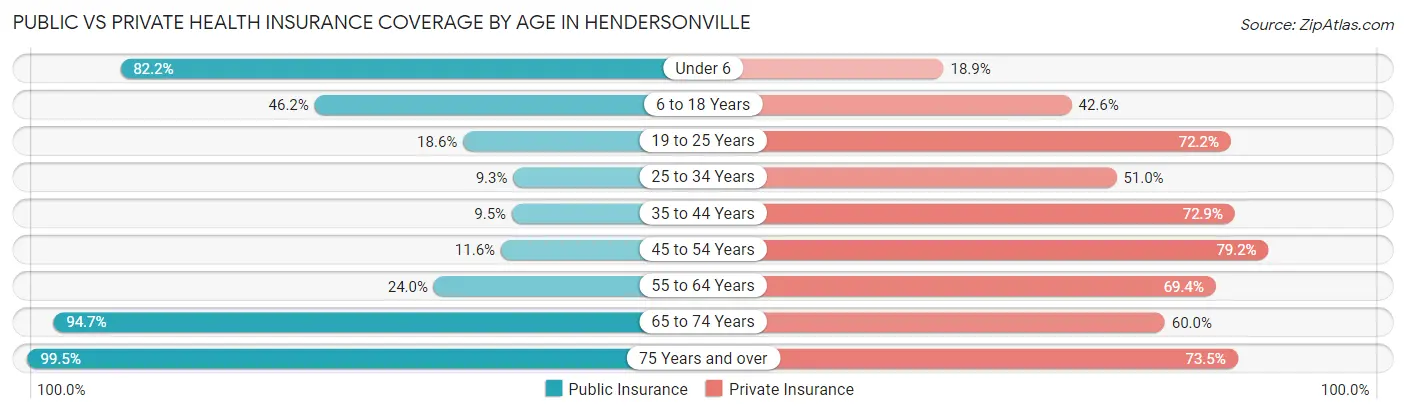
| Age Bracket | Public Insurance | Private Insurance |
| Under 6 | 727 (82.2%) | 167 (18.9%) |
| 6 to 18 Years | 837 (46.2%) | 773 (42.6%) |
| 19 to 25 Years | 176 (18.6%) | 683 (72.2%) |
| 25 to 34 Years | 138 (9.3%) | 757 (51.0%) |
| 35 to 44 Years | 141 (9.5%) | 1,078 (72.9%) |
| 45 to 54 Years | 166 (11.6%) | 1,134 (79.2%) |
| 55 to 64 Years | 539 (24.0%) | 1,556 (69.4%) |
| 65 to 74 Years | 1,901 (94.7%) | 1,204 (60.0%) |
| 75 Years and over | 2,416 (99.5%) | 1,784 (73.5%) |
| Total | 7,041 (47.8%) | 9,136 (62.1%) |
Disability Status by Sex by Age in Hendersonville
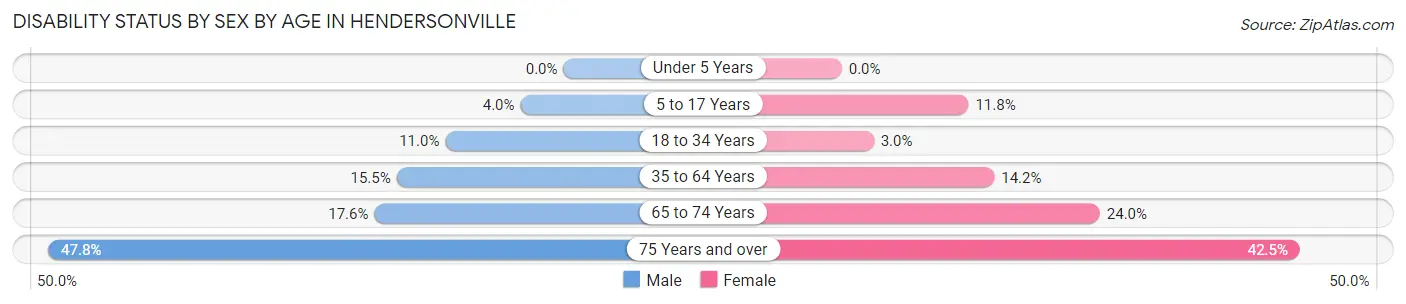
| Age Bracket | Male | Female |
| Under 5 Years | 0 (0.0%) | 0 (0.0%) |
| 5 to 17 Years | 46 (4.0%) | 81 (11.8%) |
| 18 to 34 Years | 150 (11.0%) | 36 (3.0%) |
| 35 to 64 Years | 361 (15.5%) | 399 (14.1%) |
| 65 to 74 Years | 126 (17.5%) | 309 (23.9%) |
| 75 Years and over | 447 (47.8%) | 635 (42.5%) |
Disability Class by Sex by Age in Hendersonville
Disability Class: Hearing Difficulty
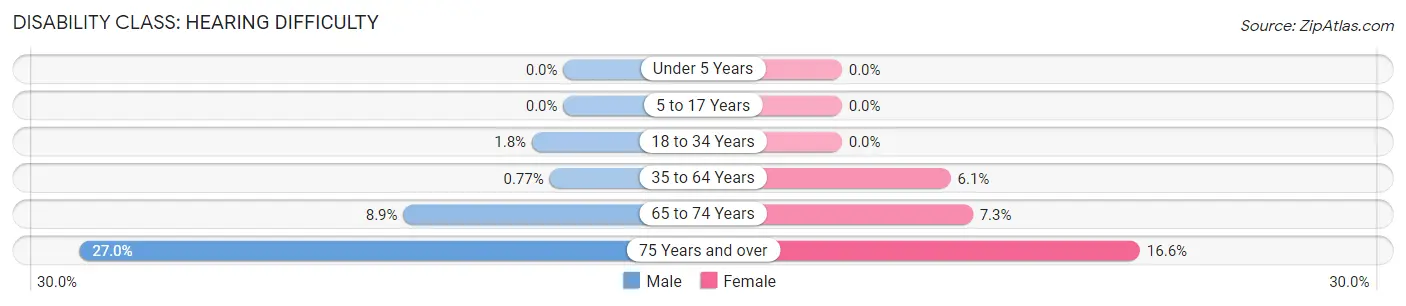
| Age Bracket | Male | Female |
| Under 5 Years | 0 (0.0%) | 0 (0.0%) |
| 5 to 17 Years | 0 (0.0%) | 0 (0.0%) |
| 18 to 34 Years | 24 (1.8%) | 0 (0.0%) |
| 35 to 64 Years | 18 (0.8%) | 171 (6.1%) |
| 65 to 74 Years | 64 (8.9%) | 94 (7.3%) |
| 75 Years and over | 252 (27.0%) | 248 (16.6%) |
Disability Class: Vision Difficulty
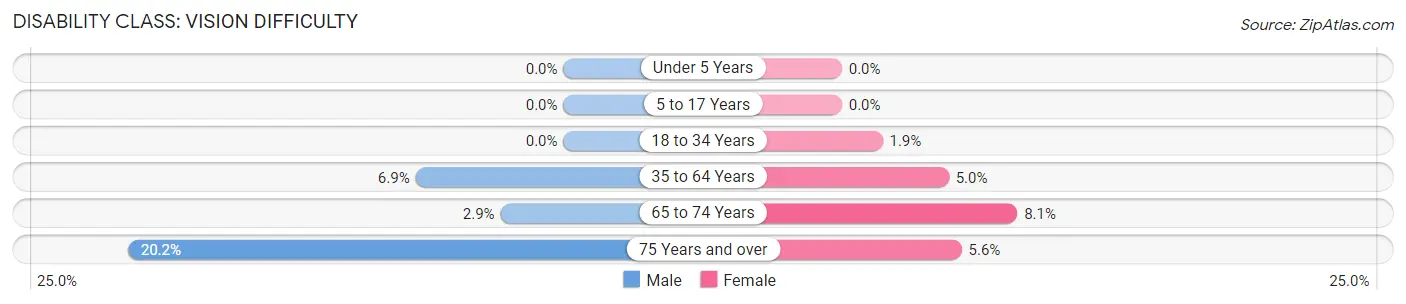
| Age Bracket | Male | Female |
| Under 5 Years | 0 (0.0%) | 0 (0.0%) |
| 5 to 17 Years | 0 (0.0%) | 0 (0.0%) |
| 18 to 34 Years | 0 (0.0%) | 23 (1.9%) |
| 35 to 64 Years | 160 (6.9%) | 140 (5.0%) |
| 65 to 74 Years | 21 (2.9%) | 105 (8.1%) |
| 75 Years and over | 189 (20.2%) | 83 (5.6%) |
Disability Class: Cognitive Difficulty
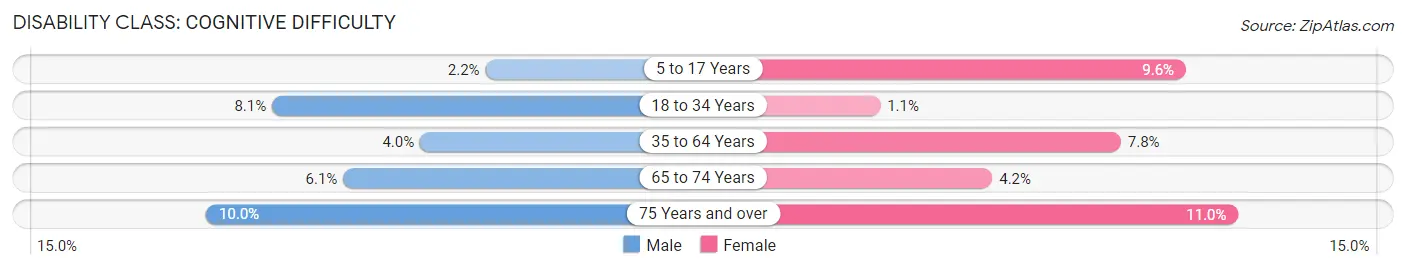
| Age Bracket | Male | Female |
| 5 to 17 Years | 25 (2.2%) | 66 (9.6%) |
| 18 to 34 Years | 111 (8.1%) | 13 (1.1%) |
| 35 to 64 Years | 93 (4.0%) | 219 (7.8%) |
| 65 to 74 Years | 44 (6.1%) | 54 (4.2%) |
| 75 Years and over | 93 (10.0%) | 165 (11.0%) |
Disability Class: Ambulatory Difficulty
| Age Bracket | Male | Female |
| 5 to 17 Years | 21 (1.8%) | 0 (0.0%) |
| 18 to 34 Years | 69 (5.0%) | 0 (0.0%) |
| 35 to 64 Years | 133 (5.7%) | 232 (8.2%) |
| 65 to 74 Years | 37 (5.1%) | 144 (11.2%) |
| 75 Years and over | 201 (21.5%) | 396 (26.5%) |
Disability Class: Self-Care Difficulty
| Age Bracket | Male | Female |
| 5 to 17 Years | 0 (0.0%) | 26 (3.8%) |
| 18 to 34 Years | 39 (2.9%) | 0 (0.0%) |
| 35 to 64 Years | 67 (2.9%) | 50 (1.8%) |
| 65 to 74 Years | 21 (2.9%) | 33 (2.6%) |
| 75 Years and over | 104 (11.1%) | 127 (8.5%) |
Technology Access in Hendersonville
Computing Device Access in Hendersonville
| Device Type | # Households | % Households |
| Desktop or Laptop | 5,773 | 75.4% |
| Smartphone | 6,375 | 83.3% |
| Tablet | 4,604 | 60.2% |
| No Computing Device | 599 | 7.8% |
| Total | 7,651 | 100.0% |
Internet Access in Hendersonville
| Internet Type | # Households | % Households |
| Dial-Up Internet | 9 | 0.1% |
| Broadband Home | 5,509 | 72.0% |
| Cellular Data Only | 761 | 10.0% |
| Satellite Internet | 500 | 6.5% |
| No Internet | 1,165 | 15.2% |
| Total | 7,651 | 100.0% |
Hendersonville Summary
Hendersonville, North Carolina is a city located in Henderson County in the western part of the state. It is the county seat and the largest city in the county. The city is situated in the Blue Ridge Mountains and is part of the Asheville Metropolitan Statistical Area. The city has a population of 13,137 as of the 2010 census.
History
Hendersonville was founded in 1838 and named after North Carolina Supreme Court Chief Justice Leonard Henderson. The city was originally a small farming community, but it began to grow in the late 19th century when the railroad was built through the area. The railroad brought tourists to the area, and the city became a popular summer resort. The city was incorporated in 1877 and has since grown to become the largest city in Henderson County.
Geography
Hendersonville is located in the Blue Ridge Mountains of western North Carolina. The city is situated at an elevation of 2,000 feet and is surrounded by the Pisgah National Forest. The city is located at the intersection of U.S. Route 64 and U.S. Route 176. The city is approximately 25 miles south of Asheville and 25 miles north of Greenville, South Carolina.
Economy
Hendersonville’s economy is largely based on tourism and manufacturing. The city is home to several large manufacturing companies, including General Electric, Eaton Corporation, and Whirlpool Corporation. The city is also home to several tourist attractions, including the Flat Rock Playhouse, the Carl Sandburg Home National Historic Site, and the Hendersonville Historic Courthouse.
Demographics
As of the 2010 census, Hendersonville had a population of 13,137. The racial makeup of the city was 87.3% White, 8.2% African American, 0.4% Native American, 1.2% Asian, 0.1% Pacific Islander, 1.2% from other races, and 1.6% from two or more races. Hispanic or Latino of any race were 3.2% of the population.
The median income for a household in the city was $37,845, and the median income for a family was $45,945. The per capita income for the city was $21,945. About 11.2% of families and 14.3% of the population were below the poverty line, including 19.2% of those under age 18 and 8.7% of those age 65 or over.
Hendersonville is a vibrant city with a rich history and a diverse economy. The city is home to a variety of businesses and attractions, and it is a popular destination for tourists and residents alike. The city is also home to a diverse population, with a variety of racial and ethnic backgrounds.
Common Questions
What is Per Capita Income in Hendersonville?
Per Capita income in Hendersonville is $38,318.
What is the Median Family Income in Hendersonville?
Median Family Income in Hendersonville is $80,417.
What is the Median Household income in Hendersonville?
Median Household Income in Hendersonville is $50,198.
What is Income or Wage Gap in Hendersonville?
Income or Wage Gap in Hendersonville is 16.4%.
Women in Hendersonville earn 83.6 cents for every dollar earned by a man.
What is Inequality or Gini Index in Hendersonville?
Inequality or Gini Index in Hendersonville is 0.50.
What is the Total Population of Hendersonville?
Total Population of Hendersonville is 15,102.
What is the Total Male Population of Hendersonville?
Total Male Population of Hendersonville is 6,945.
What is the Total Female Population of Hendersonville?
Total Female Population of Hendersonville is 8,157.
What is the Ratio of Males per 100 Females in Hendersonville?
There are 85.14 Males per 100 Females in Hendersonville.
What is the Ratio of Females per 100 Males in Hendersonville?
There are 117.45 Females per 100 Males in Hendersonville.
What is the Median Population Age in Hendersonville?
Median Population Age in Hendersonville is 52.2 Years.
What is the Average Family Size in Hendersonville
Average Family Size in Hendersonville is 2.7 People.
What is the Average Household Size in Hendersonville
Average Household Size in Hendersonville is 1.9 People.
How Large is the Labor Force in Hendersonville?
There are 6,915 People in the Labor Forcein in Hendersonville.
What is the Percentage of People in the Labor Force in Hendersonville?
53.8% of People are in the Labor Force in Hendersonville.
What is the Unemployment Rate in Hendersonville?
Unemployment Rate in Hendersonville is 2.2%.