Burlington, NC Map & Demographics
Burlington Map
Burlington Overview
$31,497
PER CAPITA INCOME
$65,796
AVG FAMILY INCOME
$52,963
AVG HOUSEHOLD INCOME
16.4%
WAGE / INCOME GAP [ % ]
83.6¢/ $1
WAGE / INCOME GAP [ $ ]
$8,858
FAMILY INCOME DEFICIT
0.46
INEQUALITY / GINI INDEX
56,951
TOTAL POPULATION
27,462
MALE POPULATION
29,489
FEMALE POPULATION
93.13
MALES / 100 FEMALES
107.38
FEMALES / 100 MALES
39.9
MEDIAN AGE
3.1
AVG FAMILY SIZE
2.4
AVG HOUSEHOLD SIZE
28,651
LABOR FORCE [ PEOPLE ]
63.8%
PERCENT IN LABOR FORCE
5.7%
UNEMPLOYMENT RATE
Burlington Area Codes
Income in Burlington
Income Overview in Burlington
Per Capita Income in Burlington is $31,497, while median incomes of families and households are $65,796 and $52,963 respectively.
| Characteristic | Number | Measure |
| Per Capita Income | 56,951 | $31,497 |
| Median Family Income | 13,984 | $65,796 |
| Mean Family Income | 13,984 | $88,725 |
| Median Household Income | 23,883 | $52,963 |
| Mean Household Income | 23,883 | $72,862 |
| Income Deficit | 13,984 | $8,858 |
| Wage / Income Gap (%) | 56,951 | 16.44% |
| Wage / Income Gap ($) | 56,951 | 83.56¢ per $1 |
| Gini / Inequality Index | 56,951 | 0.46 |
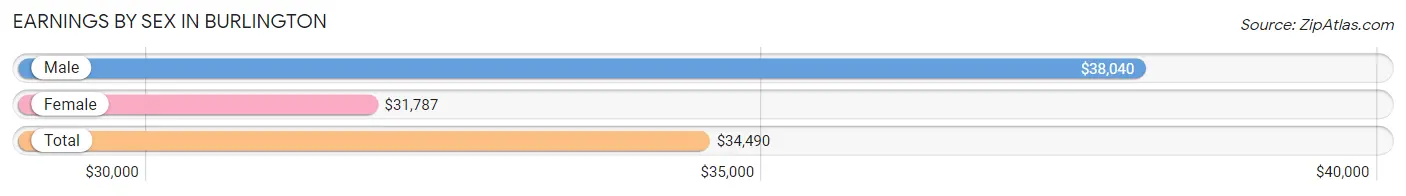
Earnings by Sex in Burlington
Average Earnings in Burlington are $34,490, $38,040 for men and $31,787 for women, a difference of 16.4%.
| Sex | Number | Average Earnings |
| Male | 13,763 (47.8%) | $38,040 |
| Female | 15,056 (52.2%) | $31,787 |
| Total | 28,819 (100.0%) | $34,490 |
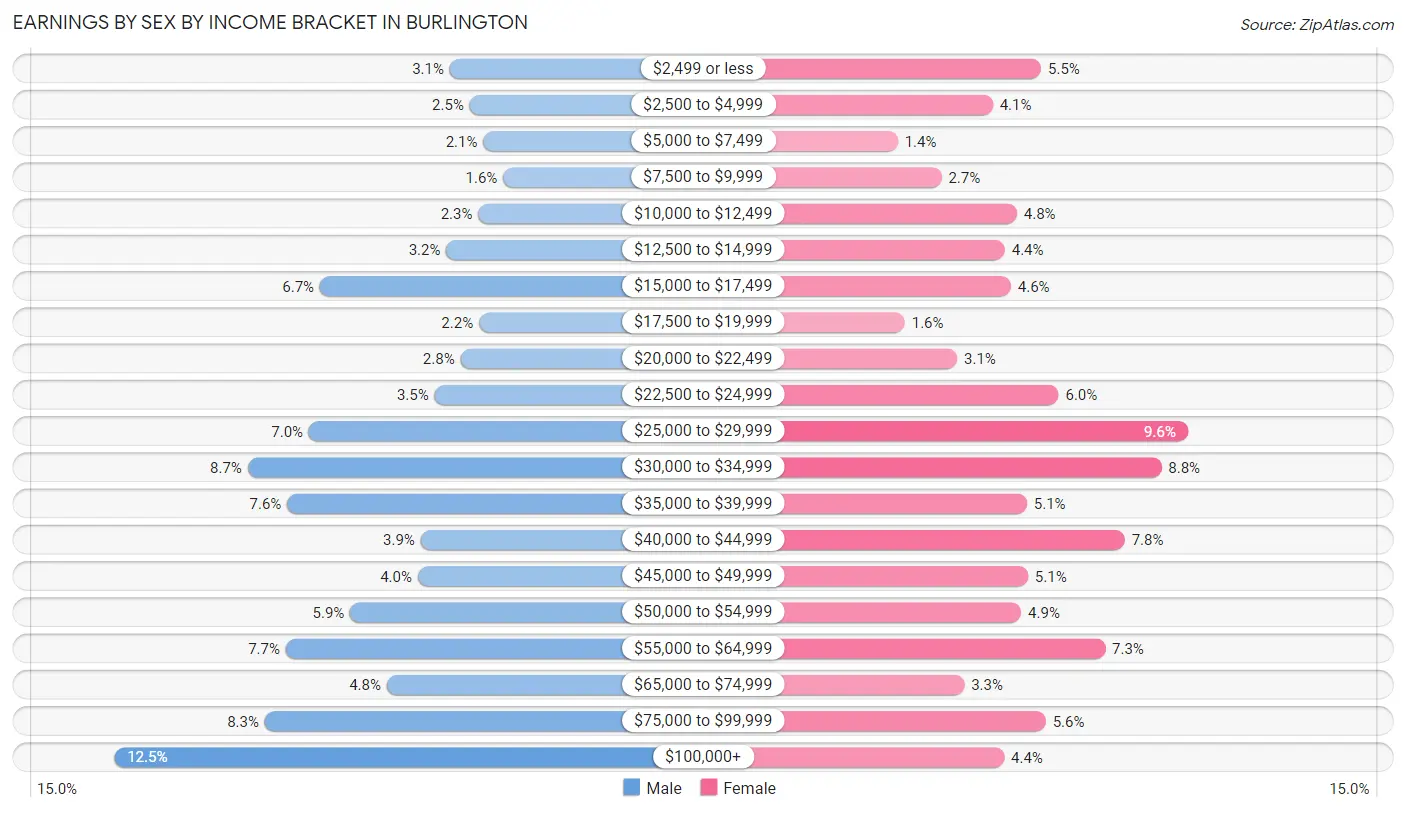
Earnings by Sex by Income Bracket in Burlington
The most common earnings brackets in Burlington are $100,000+ for men (1,718 | 12.5%) and $25,000 to $29,999 for women (1,443 | 9.6%).
| Income | Male | Female |
| $2,499 or less | 420 (3.0%) | 822 (5.5%) |
| $2,500 to $4,999 | 343 (2.5%) | 618 (4.1%) |
| $5,000 to $7,499 | 290 (2.1%) | 215 (1.4%) |
| $7,500 to $9,999 | 214 (1.5%) | 400 (2.7%) |
| $10,000 to $12,499 | 309 (2.2%) | 720 (4.8%) |
| $12,500 to $14,999 | 434 (3.2%) | 668 (4.4%) |
| $15,000 to $17,499 | 922 (6.7%) | 694 (4.6%) |
| $17,500 to $19,999 | 307 (2.2%) | 245 (1.6%) |
| $20,000 to $22,499 | 379 (2.8%) | 466 (3.1%) |
| $22,500 to $24,999 | 479 (3.5%) | 896 (5.9%) |
| $25,000 to $29,999 | 965 (7.0%) | 1,443 (9.6%) |
| $30,000 to $34,999 | 1,201 (8.7%) | 1,331 (8.8%) |
| $35,000 to $39,999 | 1,049 (7.6%) | 762 (5.1%) |
| $40,000 to $44,999 | 532 (3.9%) | 1,176 (7.8%) |
| $45,000 to $49,999 | 543 (4.0%) | 766 (5.1%) |
| $50,000 to $54,999 | 805 (5.9%) | 737 (4.9%) |
| $55,000 to $64,999 | 1,054 (7.7%) | 1,093 (7.3%) |
| $65,000 to $74,999 | 664 (4.8%) | 497 (3.3%) |
| $75,000 to $99,999 | 1,135 (8.3%) | 842 (5.6%) |
| $100,000+ | 1,718 (12.5%) | 665 (4.4%) |
| Total | 13,763 (100.0%) | 15,056 (100.0%) |
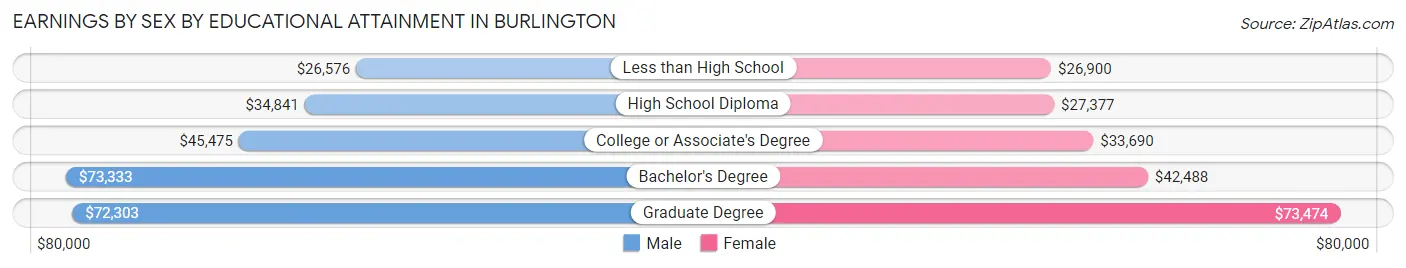
Earnings by Sex by Educational Attainment in Burlington
Average earnings in Burlington are $43,783 for men and $34,162 for women, a difference of 22.0%. Men with an educational attainment of bachelor's degree enjoy the highest average annual earnings of $73,333, while those with less than high school education earn the least with $26,576. Women with an educational attainment of graduate degree earn the most with the average annual earnings of $73,474, while those with less than high school education have the smallest earnings of $26,900.
| Educational Attainment | Male Income | Female Income |
| Less than High School | $26,576 | $26,900 |
| High School Diploma | $34,841 | $27,377 |
| College or Associate's Degree | $45,475 | $33,690 |
| Bachelor's Degree | $73,333 | $42,488 |
| Graduate Degree | $72,303 | $73,474 |
| Total | $43,783 | $34,162 |
Family Income in Burlington
Family Income Brackets in Burlington
According to the Burlington family income data, there are 2,433 families falling into the $100,000 to $149,999 income range, which is the most common income bracket and makes up 17.4% of all families. Conversely, the $10,000 to $14,999 income bracket is the least frequent group with only 475 families (3.4%) belonging to this category.
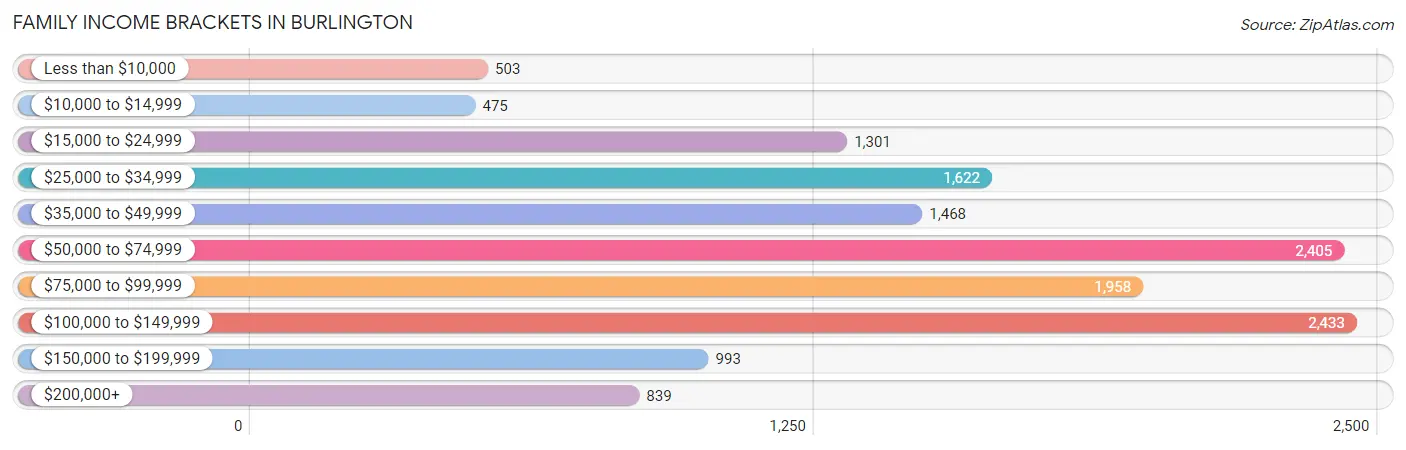
| Income Bracket | # Families | % Families |
| Less than $10,000 | 503 | 3.6% |
| $10,000 to $14,999 | 475 | 3.4% |
| $15,000 to $24,999 | 1,301 | 9.3% |
| $25,000 to $34,999 | 1,622 | 11.6% |
| $35,000 to $49,999 | 1,468 | 10.5% |
| $50,000 to $74,999 | 2,405 | 17.2% |
| $75,000 to $99,999 | 1,958 | 14.0% |
| $100,000 to $149,999 | 2,433 | 17.4% |
| $150,000 to $199,999 | 993 | 7.1% |
| $200,000+ | 839 | 6.0% |
Family Income by Famaliy Size in Burlington
5-person families (613 | 4.4%) account for the highest median family income in Burlington with $71,307 per family, while 2-person families (7,036 | 50.3%) have the highest median income of $31,764 per family member.
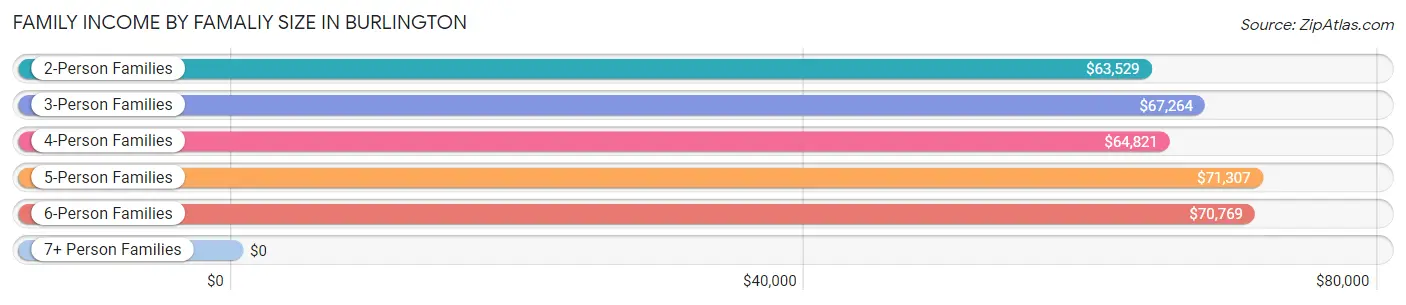
| Income Bracket | # Families | Median Income |
| 2-Person Families | 7,036 (50.3%) | $63,529 |
| 3-Person Families | 3,498 (25.0%) | $67,264 |
| 4-Person Families | 2,264 (16.2%) | $64,821 |
| 5-Person Families | 613 (4.4%) | $71,307 |
| 6-Person Families | 460 (3.3%) | $70,769 |
| 7+ Person Families | 113 (0.8%) | $0 |
| Total | 13,984 (100.0%) | $65,796 |
Family Income by Number of Earners in Burlington
The median family income in Burlington is $65,796, with families comprising 3+ earners (992) having the highest median family income of $105,769, while families with no earners (2,408) have the lowest median family income of $35,844, accounting for 7.1% and 17.2% of families, respectively.
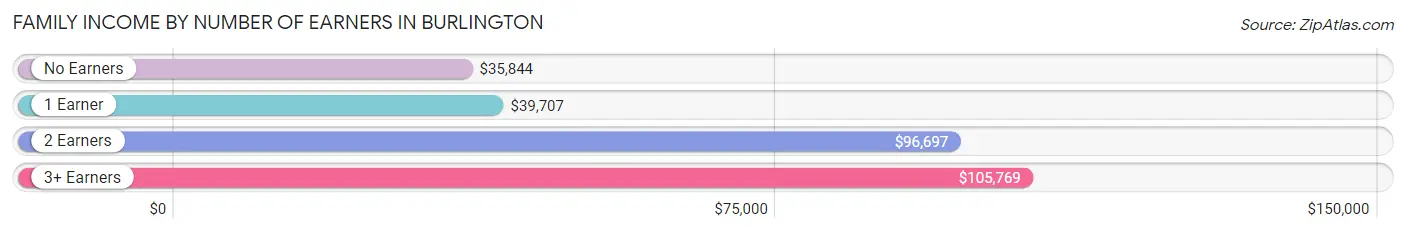
| Number of Earners | # Families | Median Income |
| No Earners | 2,408 (17.2%) | $35,844 |
| 1 Earner | 5,023 (35.9%) | $39,707 |
| 2 Earners | 5,561 (39.8%) | $96,697 |
| 3+ Earners | 992 (7.1%) | $105,769 |
| Total | 13,984 (100.0%) | $65,796 |
Household Income in Burlington
Household Income Brackets in Burlington
With 4,394 households falling in the category, the $50,000 to $74,999 income range is the most frequent in Burlington, accounting for 18.4% of all households. In contrast, only 884 households (3.7%) fall into the $200,000+ income bracket, making it the least populous group.
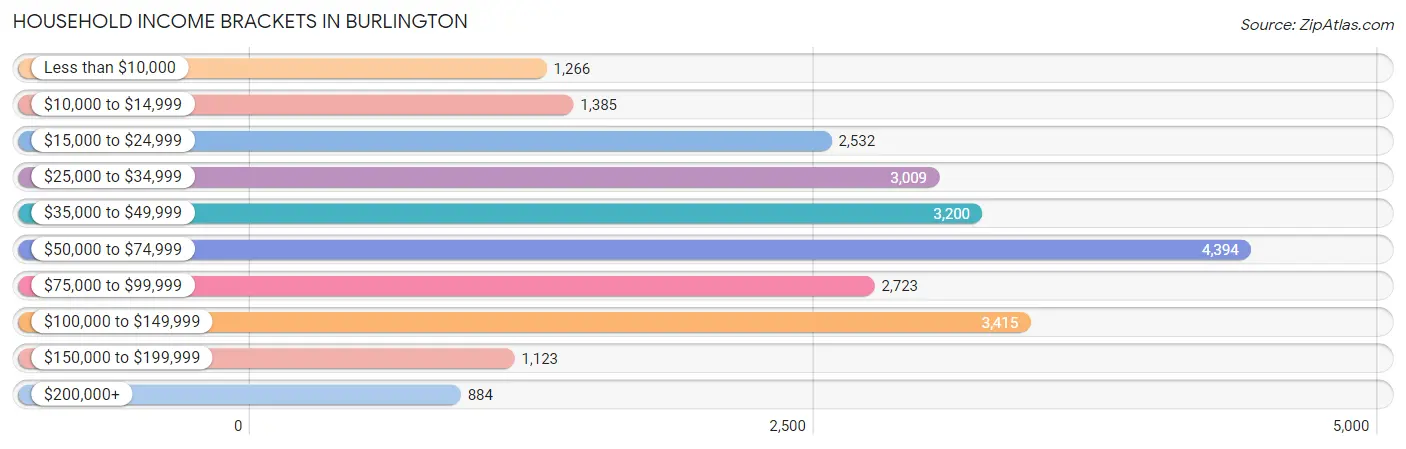
| Income Bracket | # Households | % Households |
| Less than $10,000 | 1,266 | 5.3% |
| $10,000 to $14,999 | 1,385 | 5.8% |
| $15,000 to $24,999 | 2,532 | 10.6% |
| $25,000 to $34,999 | 3,009 | 12.6% |
| $35,000 to $49,999 | 3,200 | 13.4% |
| $50,000 to $74,999 | 4,394 | 18.4% |
| $75,000 to $99,999 | 2,723 | 11.4% |
| $100,000 to $149,999 | 3,415 | 14.3% |
| $150,000 to $199,999 | 1,123 | 4.7% |
| $200,000+ | 884 | 3.7% |
Household Income by Householder Age in Burlington
The median household income in Burlington is $52,963, with the highest median household income of $60,541 found in the 45 to 64 years age bracket for the primary householder. A total of 8,744 households (36.6%) fall into this category. Meanwhile, the 15 to 24 years age bracket for the primary householder has the lowest median household income of $39,405, with 948 households (4.0%) in this group.
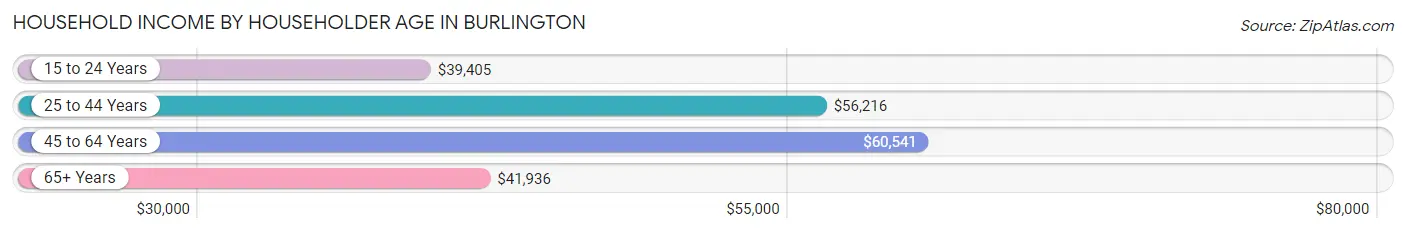
| Income Bracket | # Households | Median Income |
| 15 to 24 Years | 948 (4.0%) | $39,405 |
| 25 to 44 Years | 7,621 (31.9%) | $56,216 |
| 45 to 64 Years | 8,744 (36.6%) | $60,541 |
| 65+ Years | 6,570 (27.5%) | $41,936 |
| Total | 23,883 (100.0%) | $52,963 |
Poverty in Burlington
Income Below Poverty by Sex and Age in Burlington
With 17.0% poverty level for males and 20.3% for females among the residents of Burlington, 12 to 14 year old males and 6 to 11 year old females are the most vulnerable to poverty, with 439 males (28.5%) and 783 females (42.1%) in their respective age groups living below the poverty level.
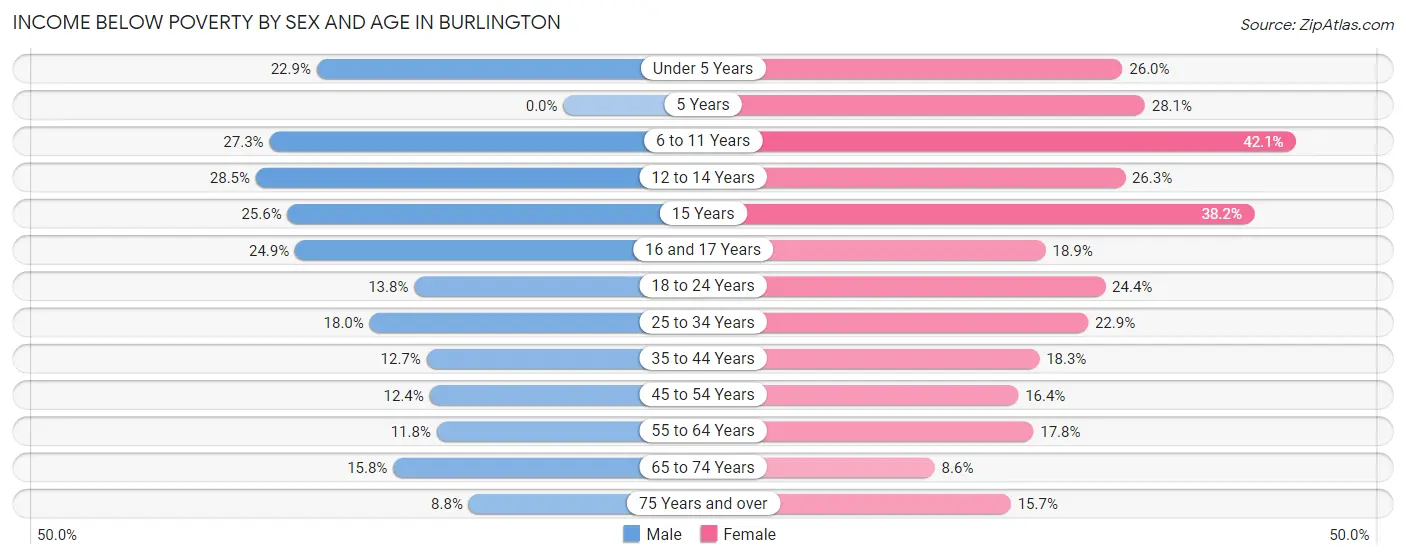
| Age Bracket | Male | Female |
| Under 5 Years | 387 (22.9%) | 412 (26.0%) |
| 5 Years | 0 (0.0%) | 88 (28.1%) |
| 6 to 11 Years | 822 (27.3%) | 783 (42.1%) |
| 12 to 14 Years | 439 (28.5%) | 312 (26.3%) |
| 15 Years | 75 (25.6%) | 125 (38.2%) |
| 16 and 17 Years | 196 (24.9%) | 80 (18.9%) |
| 18 to 24 Years | 324 (13.8%) | 558 (24.4%) |
| 25 to 34 Years | 690 (18.0%) | 860 (22.9%) |
| 35 to 44 Years | 417 (12.7%) | 622 (18.3%) |
| 45 to 54 Years | 421 (12.4%) | 650 (16.4%) |
| 55 to 64 Years | 358 (11.7%) | 733 (17.8%) |
| 65 to 74 Years | 372 (15.8%) | 277 (8.6%) |
| 75 Years and over | 135 (8.8%) | 424 (15.7%) |
| Total | 4,636 (17.0%) | 5,924 (20.3%) |
Income Above Poverty by Sex and Age in Burlington
According to the poverty statistics in Burlington, males aged 5 years and females aged 65 to 74 years are the age groups that are most secure financially, with 100.0% of males and 91.4% of females in these age groups living above the poverty line.
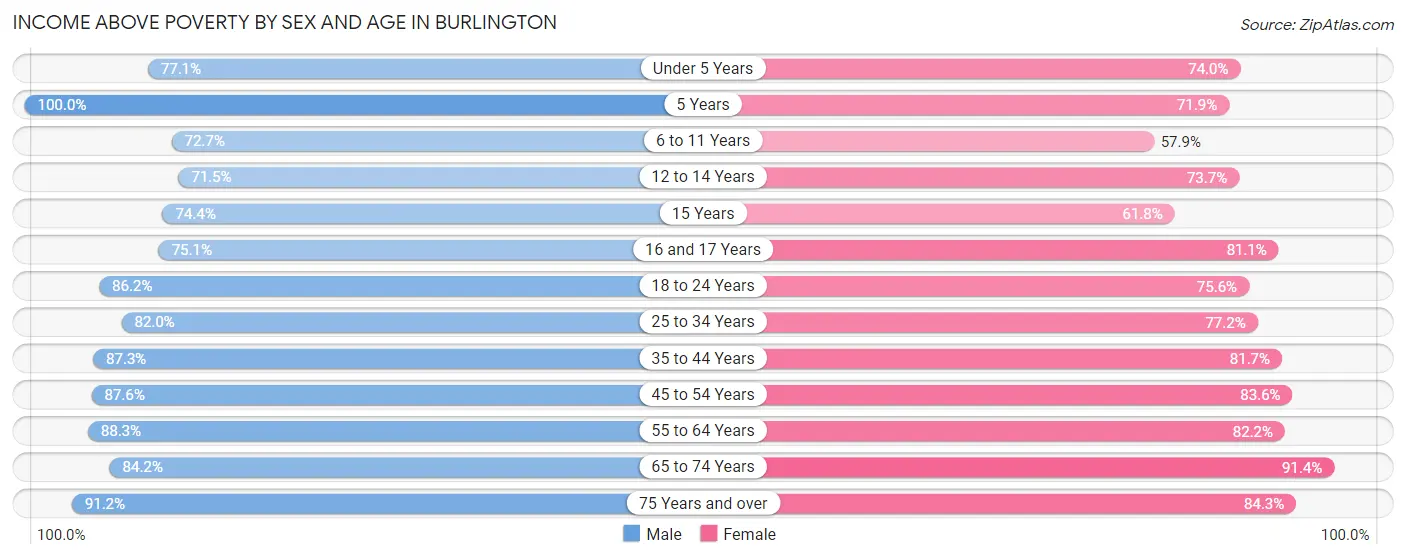
| Age Bracket | Male | Female |
| Under 5 Years | 1,304 (77.1%) | 1,170 (74.0%) |
| 5 Years | 163 (100.0%) | 225 (71.9%) |
| 6 to 11 Years | 2,191 (72.7%) | 1,077 (57.9%) |
| 12 to 14 Years | 1,099 (71.5%) | 875 (73.7%) |
| 15 Years | 218 (74.4%) | 202 (61.8%) |
| 16 and 17 Years | 591 (75.1%) | 343 (81.1%) |
| 18 to 24 Years | 2,017 (86.2%) | 1,725 (75.6%) |
| 25 to 34 Years | 3,148 (82.0%) | 2,904 (77.1%) |
| 35 to 44 Years | 2,868 (87.3%) | 2,774 (81.7%) |
| 45 to 54 Years | 2,968 (87.6%) | 3,320 (83.6%) |
| 55 to 64 Years | 2,689 (88.2%) | 3,393 (82.2%) |
| 65 to 74 Years | 1,984 (84.2%) | 2,938 (91.4%) |
| 75 Years and over | 1,402 (91.2%) | 2,280 (84.3%) |
| Total | 22,642 (83.0%) | 23,226 (79.7%) |
Income Below Poverty Among Married-Couple Families in Burlington
The poverty statistics for married-couple families in Burlington show that 7.4% or 645 of the total 8,672 families live below the poverty line. Families with 5 or more children have the highest poverty rate of 100.0%, comprising of 10 families. On the other hand, families with no children have the lowest poverty rate of 5.9%, which includes 325 families.
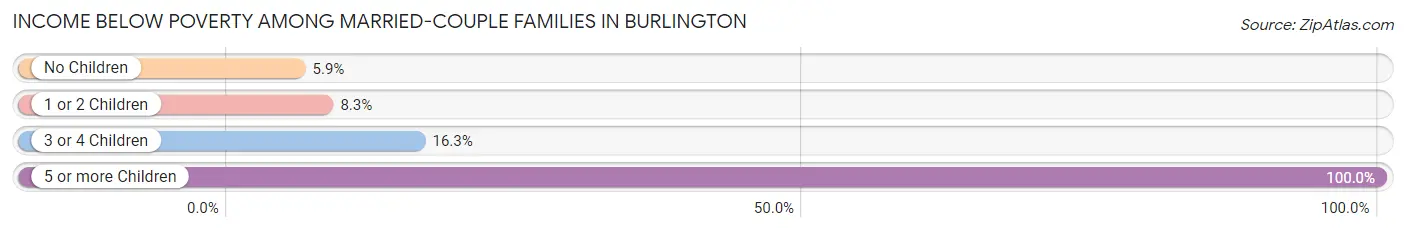
| Children | Above Poverty | Below Poverty |
| No Children | 5,204 (94.1%) | 325 (5.9%) |
| 1 or 2 Children | 2,305 (91.7%) | 209 (8.3%) |
| 3 or 4 Children | 518 (83.7%) | 101 (16.3%) |
| 5 or more Children | 0 (0.0%) | 10 (100.0%) |
| Total | 8,027 (92.6%) | 645 (7.4%) |
Income Below Poverty Among Single-Parent Households in Burlington
According to the poverty data in Burlington, 13.5% or 172 single-father households and 35.3% or 1,425 single-mother households are living below the poverty line. Among single-father households, those with 5 or more children have the highest poverty rate, with 35 households (42.2%) experiencing poverty. Likewise, among single-mother households, those with 3 or 4 children have the highest poverty rate, with 461 households (82.0%) falling below the poverty line.
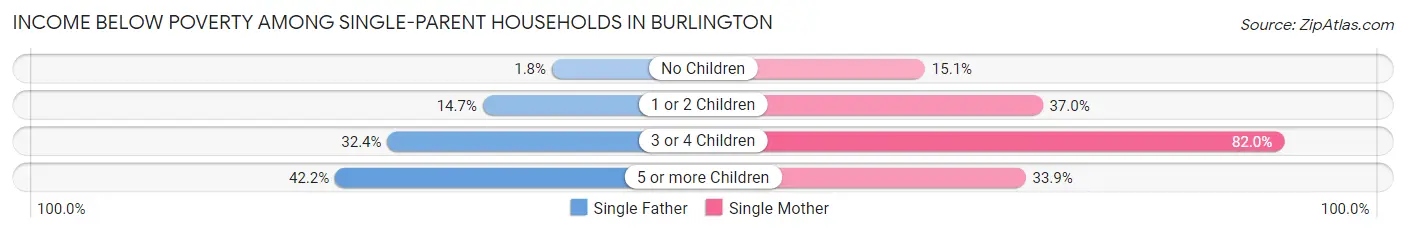
| Children | Single Father | Single Mother |
| No Children | 8 (1.8%) | 222 (15.1%) |
| 1 or 2 Children | 93 (14.7%) | 721 (37.0%) |
| 3 or 4 Children | 36 (32.4%) | 461 (82.0%) |
| 5 or more Children | 35 (42.2%) | 21 (33.9%) |
| Total | 172 (13.5%) | 1,425 (35.3%) |
Income Below Poverty Among Married-Couple vs Single-Parent Households in Burlington
The poverty data for Burlington shows that 645 of the married-couple family households (7.4%) and 1,597 of the single-parent households (30.1%) are living below the poverty level. Within the married-couple family households, those with 5 or more children have the highest poverty rate, with 10 households (100.0%) falling below the poverty line. Among the single-parent households, those with 3 or 4 children have the highest poverty rate, with 497 household (73.9%) living below poverty.
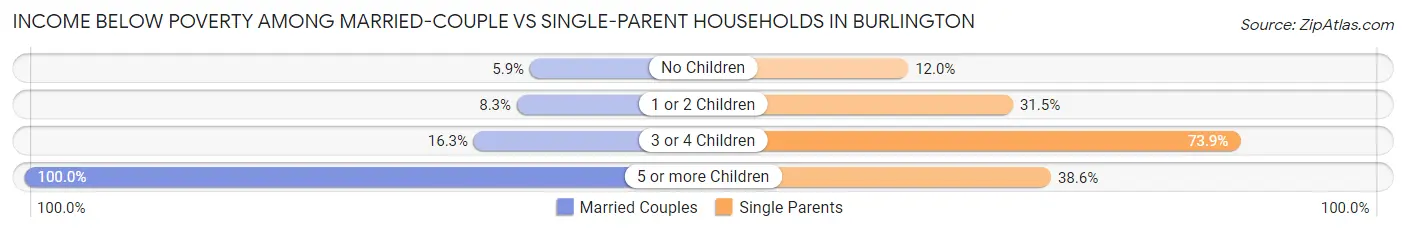
| Children | Married-Couple Families | Single-Parent Households |
| No Children | 325 (5.9%) | 230 (12.0%) |
| 1 or 2 Children | 209 (8.3%) | 814 (31.5%) |
| 3 or 4 Children | 101 (16.3%) | 497 (73.9%) |
| 5 or more Children | 10 (100.0%) | 56 (38.6%) |
| Total | 645 (7.4%) | 1,597 (30.1%) |
Race in Burlington
The most populous races in Burlington are White / Caucasian (30,394 | 53.4%), Black / African American (16,292 | 28.6%), and Hispanic or Latino (9,989 | 17.5%).
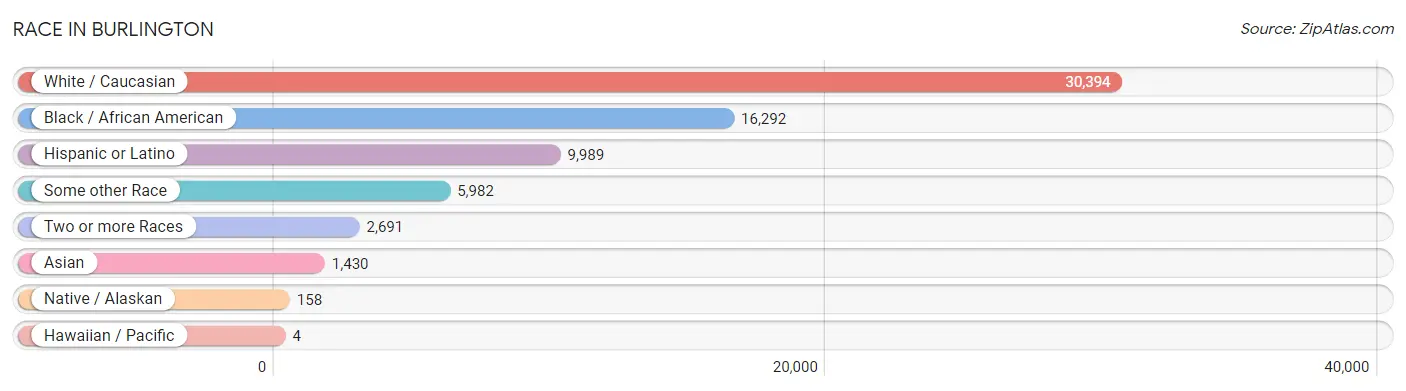
| Race | # Population | % Population |
| Asian | 1,430 | 2.5% |
| Black / African American | 16,292 | 28.6% |
| Hawaiian / Pacific | 4 | 0.0% |
| Hispanic or Latino | 9,989 | 17.5% |
| Native / Alaskan | 158 | 0.3% |
| White / Caucasian | 30,394 | 53.4% |
| Two or more Races | 2,691 | 4.7% |
| Some other Race | 5,982 | 10.5% |
| Total | 56,951 | 100.0% |
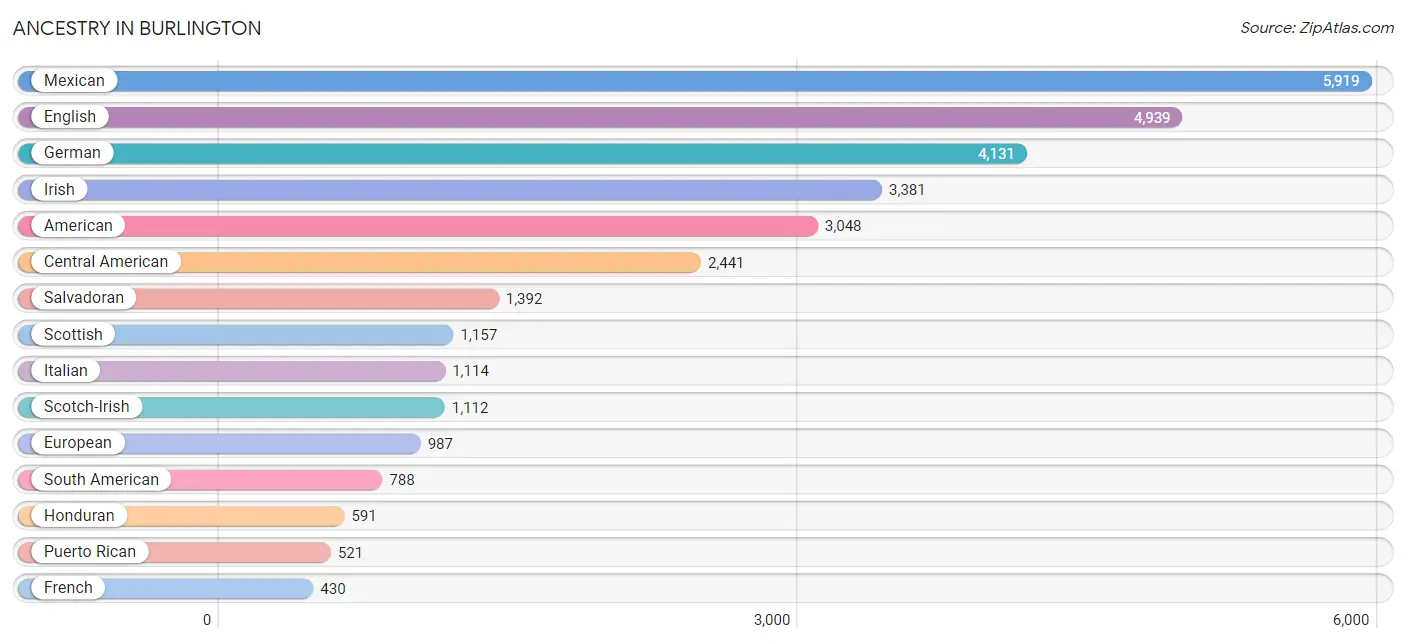
Ancestry in Burlington
The most populous ancestries reported in Burlington are Mexican (5,919 | 10.4%), English (4,939 | 8.7%), German (4,131 | 7.2%), Irish (3,381 | 5.9%), and American (3,048 | 5.3%), together accounting for 37.6% of all Burlington residents.
| Ancestry | # Population | % Population |
| Afghan | 29 | 0.1% |
| African | 249 | 0.4% |
| Alaska Native | 6 | 0.0% |
| Albanian | 25 | 0.0% |
| American | 3,048 | 5.3% |
| Arab | 64 | 0.1% |
| Argentinean | 23 | 0.0% |
| Austrian | 41 | 0.1% |
| Barbadian | 17 | 0.0% |
| Bhutanese | 51 | 0.1% |
| Blackfeet | 10 | 0.0% |
| Bolivian | 28 | 0.1% |
| Brazilian | 17 | 0.0% |
| British | 328 | 0.6% |
| Burmese | 72 | 0.1% |
| Cape Verdean | 41 | 0.1% |
| Celtic | 25 | 0.0% |
| Central American | 2,441 | 4.3% |
| Central American Indian | 56 | 0.1% |
| Cherokee | 73 | 0.1% |
| Chilean | 13 | 0.0% |
| Choctaw | 12 | 0.0% |
| Colombian | 137 | 0.2% |
| Comanche | 12 | 0.0% |
| Costa Rican | 50 | 0.1% |
| Croatian | 9 | 0.0% |
| Cuban | 21 | 0.0% |
| Czech | 67 | 0.1% |
| Czechoslovakian | 15 | 0.0% |
| Danish | 19 | 0.0% |
| Dominican | 150 | 0.3% |
| Dutch | 371 | 0.6% |
| Eastern European | 66 | 0.1% |
| Ecuadorian | 405 | 0.7% |
| Egyptian | 16 | 0.0% |
| English | 4,939 | 8.7% |
| European | 987 | 1.7% |
| Filipino | 28 | 0.1% |
| Finnish | 11 | 0.0% |
| French | 430 | 0.8% |
| French Canadian | 299 | 0.5% |
| German | 4,131 | 7.2% |
| Greek | 43 | 0.1% |
| Guatemalan | 85 | 0.2% |
| Honduran | 591 | 1.0% |
| Hungarian | 21 | 0.0% |
| Indian (Asian) | 174 | 0.3% |
| Indonesian | 13 | 0.0% |
| Iranian | 47 | 0.1% |
| Irish | 3,381 | 5.9% |
| Iroquois | 7 | 0.0% |
| Italian | 1,114 | 2.0% |
| Jamaican | 104 | 0.2% |
| Korean | 117 | 0.2% |
| Laotian | 25 | 0.0% |
| Lebanese | 31 | 0.1% |
| Lithuanian | 21 | 0.0% |
| Lumbee | 102 | 0.2% |
| Malaysian | 6 | 0.0% |
| Mexican | 5,919 | 10.4% |
| Mexican American Indian | 153 | 0.3% |
| Moroccan | 9 | 0.0% |
| Native Hawaiian | 14 | 0.0% |
| Nicaraguan | 323 | 0.6% |
| Nigerian | 89 | 0.2% |
| Northern European | 31 | 0.1% |
| Norwegian | 44 | 0.1% |
| Pakistani | 102 | 0.2% |
| Palestinian | 8 | 0.0% |
| Pennsylvania German | 7 | 0.0% |
| Peruvian | 47 | 0.1% |
| Polish | 388 | 0.7% |
| Portuguese | 17 | 0.0% |
| Pueblo | 20 | 0.0% |
| Puerto Rican | 521 | 0.9% |
| Russian | 101 | 0.2% |
| Salvadoran | 1,392 | 2.4% |
| Samoan | 4 | 0.0% |
| Scandinavian | 107 | 0.2% |
| Scotch-Irish | 1,112 | 1.9% |
| Scottish | 1,157 | 2.0% |
| Sioux | 20 | 0.0% |
| Slovak | 28 | 0.1% |
| South American | 788 | 1.4% |
| Sri Lankan | 380 | 0.7% |
| Subsaharan African | 379 | 0.7% |
| Swedish | 82 | 0.1% |
| Swiss | 190 | 0.3% |
| Thai | 302 | 0.5% |
| Tongan | 6 | 0.0% |
| Trinidadian and Tobagonian | 65 | 0.1% |
| Ukrainian | 207 | 0.4% |
| Venezuelan | 135 | 0.2% |
| Welsh | 391 | 0.7% |
| West Indian | 56 | 0.1% |
| Yaqui | 24 | 0.0% | View All 96 Rows |
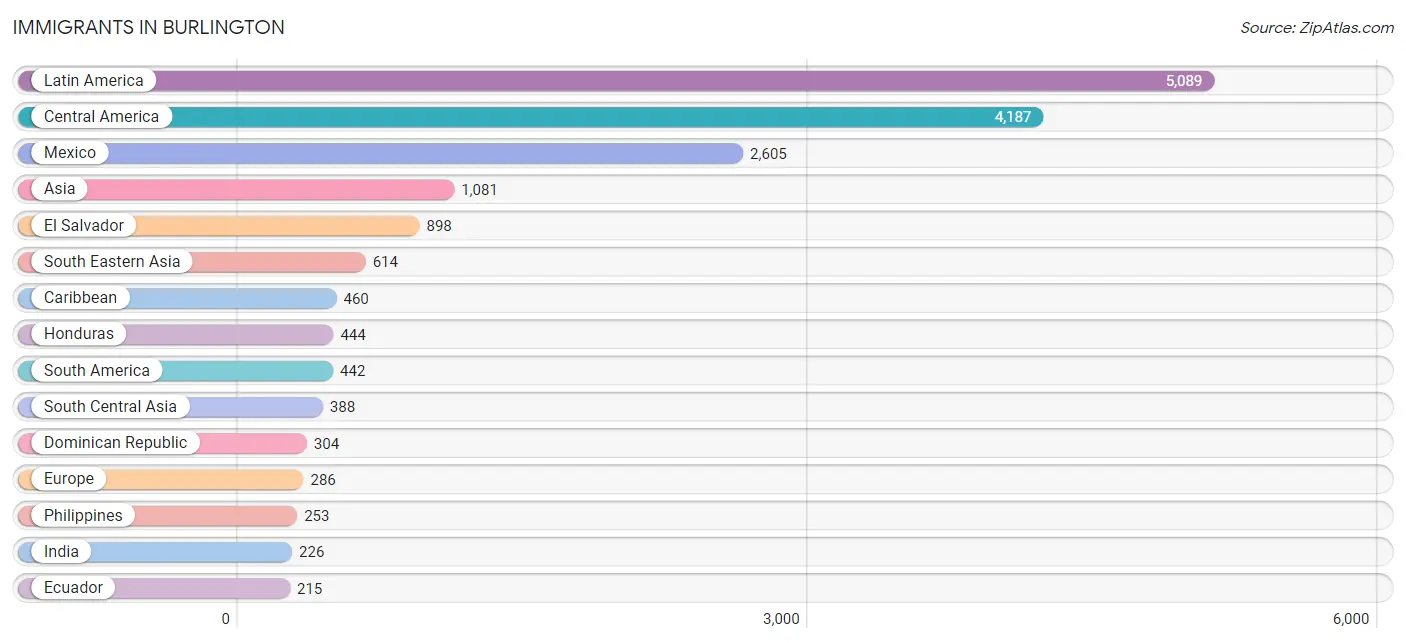
Immigrants in Burlington
The most numerous immigrant groups reported in Burlington came from Latin America (5,089 | 8.9%), Central America (4,187 | 7.3%), Mexico (2,605 | 4.6%), Asia (1,081 | 1.9%), and El Salvador (898 | 1.6%), together accounting for 24.3% of all Burlington residents.
| Immigration Origin | # Population | % Population |
| Afghanistan | 29 | 0.1% |
| Africa | 130 | 0.2% |
| Albania | 25 | 0.0% |
| Argentina | 23 | 0.0% |
| Asia | 1,081 | 1.9% |
| Bolivia | 28 | 0.1% |
| Brazil | 15 | 0.0% |
| Canada | 98 | 0.2% |
| Caribbean | 460 | 0.8% |
| Central America | 4,187 | 7.3% |
| Chile | 5 | 0.0% |
| China | 24 | 0.0% |
| Colombia | 137 | 0.2% |
| Costa Rica | 50 | 0.1% |
| Cuba | 49 | 0.1% |
| Czechoslovakia | 31 | 0.1% |
| Dominican Republic | 304 | 0.5% |
| Eastern Africa | 4 | 0.0% |
| Eastern Asia | 79 | 0.1% |
| Eastern Europe | 139 | 0.2% |
| Ecuador | 215 | 0.4% |
| Egypt | 16 | 0.0% |
| El Salvador | 898 | 1.6% |
| England | 21 | 0.0% |
| Europe | 286 | 0.5% |
| France | 1 | 0.0% |
| Germany | 93 | 0.2% |
| Guatemala | 24 | 0.0% |
| Honduras | 444 | 0.8% |
| India | 226 | 0.4% |
| Iran | 16 | 0.0% |
| Ireland | 9 | 0.0% |
| Korea | 55 | 0.1% |
| Latin America | 5,089 | 8.9% |
| Mexico | 2,605 | 4.6% |
| Nicaragua | 166 | 0.3% |
| Nigeria | 102 | 0.2% |
| Northern Africa | 16 | 0.0% |
| Northern Europe | 53 | 0.1% |
| Pakistan | 117 | 0.2% |
| Peru | 19 | 0.0% |
| Philippines | 253 | 0.4% |
| Russia | 16 | 0.0% |
| Serbia | 12 | 0.0% |
| South Africa | 8 | 0.0% |
| South America | 442 | 0.8% |
| South Central Asia | 388 | 0.7% |
| South Eastern Asia | 614 | 1.1% |
| Thailand | 139 | 0.2% |
| Trinidad and Tobago | 83 | 0.2% |
| Uganda | 4 | 0.0% |
| Ukraine | 55 | 0.1% |
| Vietnam | 209 | 0.4% |
| Western Africa | 102 | 0.2% |
| Western Europe | 94 | 0.2% | View All 55 Rows |
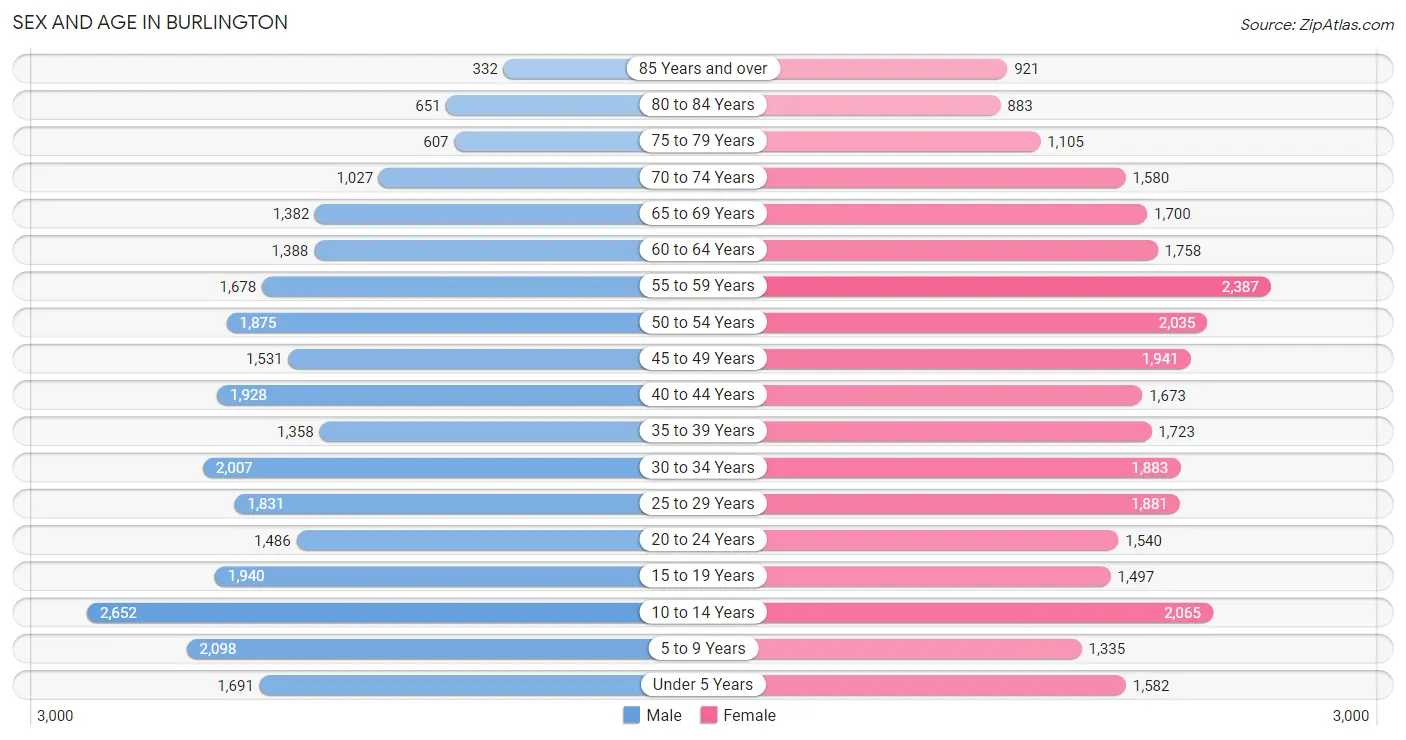
Sex and Age in Burlington
Sex and Age in Burlington
The most populous age groups in Burlington are 10 to 14 Years (2,652 | 9.7%) for men and 55 to 59 Years (2,387 | 8.1%) for women.
| Age Bracket | Male | Female |
| Under 5 Years | 1,691 (6.2%) | 1,582 (5.4%) |
| 5 to 9 Years | 2,098 (7.6%) | 1,335 (4.5%) |
| 10 to 14 Years | 2,652 (9.7%) | 2,065 (7.0%) |
| 15 to 19 Years | 1,940 (7.1%) | 1,497 (5.1%) |
| 20 to 24 Years | 1,486 (5.4%) | 1,540 (5.2%) |
| 25 to 29 Years | 1,831 (6.7%) | 1,881 (6.4%) |
| 30 to 34 Years | 2,007 (7.3%) | 1,883 (6.4%) |
| 35 to 39 Years | 1,358 (5.0%) | 1,723 (5.8%) |
| 40 to 44 Years | 1,928 (7.0%) | 1,673 (5.7%) |
| 45 to 49 Years | 1,531 (5.6%) | 1,941 (6.6%) |
| 50 to 54 Years | 1,875 (6.8%) | 2,035 (6.9%) |
| 55 to 59 Years | 1,678 (6.1%) | 2,387 (8.1%) |
| 60 to 64 Years | 1,388 (5.1%) | 1,758 (6.0%) |
| 65 to 69 Years | 1,382 (5.0%) | 1,700 (5.8%) |
| 70 to 74 Years | 1,027 (3.7%) | 1,580 (5.4%) |
| 75 to 79 Years | 607 (2.2%) | 1,105 (3.7%) |
| 80 to 84 Years | 651 (2.4%) | 883 (3.0%) |
| 85 Years and over | 332 (1.2%) | 921 (3.1%) |
| Total | 27,462 (100.0%) | 29,489 (100.0%) |
Families and Households in Burlington
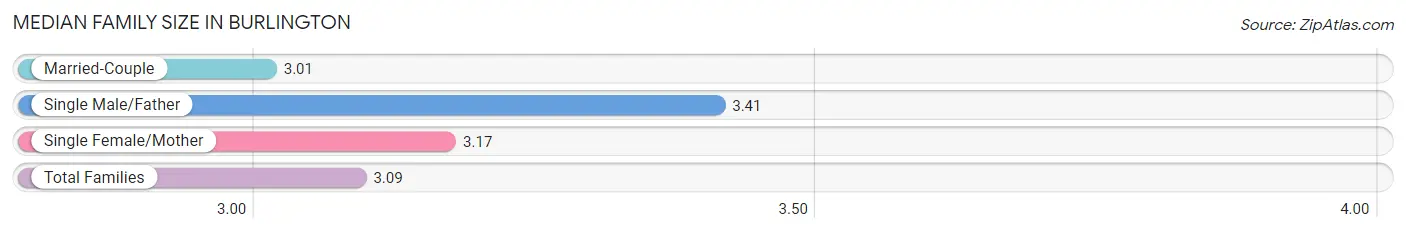
Median Family Size in Burlington
The median family size in Burlington is 3.09 persons per family, with single male/father families (1,274 | 9.1%) accounting for the largest median family size of 3.41 persons per family. On the other hand, married-couple families (8,672 | 62.0%) represent the smallest median family size with 3.01 persons per family.
| Family Type | # Families | Family Size |
| Married-Couple | 8,672 (62.0%) | 3.01 |
| Single Male/Father | 1,274 (9.1%) | 3.41 |
| Single Female/Mother | 4,038 (28.9%) | 3.17 |
| Total Families | 13,984 (100.0%) | 3.09 |
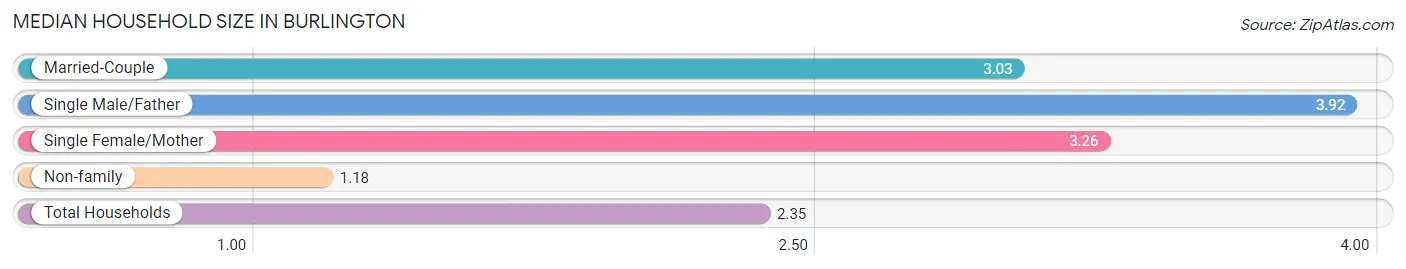
Median Household Size in Burlington
The median household size in Burlington is 2.35 persons per household, with single male/father households (1,274 | 5.3%) accounting for the largest median household size of 3.92 persons per household. non-family households (9,899 | 41.4%) represent the smallest median household size with 1.18 persons per household.
| Household Type | # Households | Household Size |
| Married-Couple | 8,672 (36.3%) | 3.03 |
| Single Male/Father | 1,274 (5.3%) | 3.92 |
| Single Female/Mother | 4,038 (16.9%) | 3.26 |
| Non-family | 9,899 (41.4%) | 1.18 |
| Total Households | 23,883 (100.0%) | 2.35 |
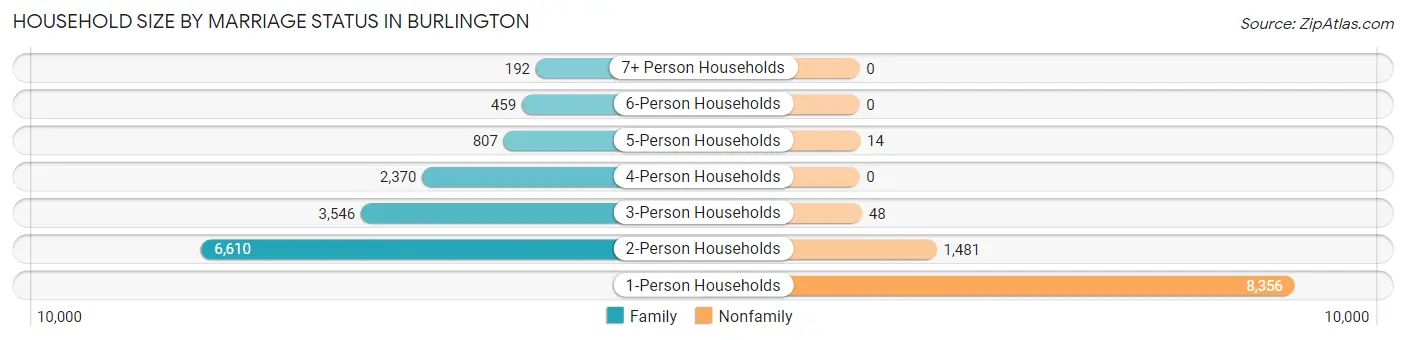
Household Size by Marriage Status in Burlington
Out of a total of 23,883 households in Burlington, 13,984 (58.6%) are family households, while 9,899 (41.4%) are nonfamily households. The most numerous type of family households are 2-person households, comprising 6,610, and the most common type of nonfamily households are 1-person households, comprising 8,356.
| Household Size | Family Households | Nonfamily Households |
| 1-Person Households | - | 8,356 (35.0%) |
| 2-Person Households | 6,610 (27.7%) | 1,481 (6.2%) |
| 3-Person Households | 3,546 (14.8%) | 48 (0.2%) |
| 4-Person Households | 2,370 (9.9%) | 0 (0.0%) |
| 5-Person Households | 807 (3.4%) | 14 (0.1%) |
| 6-Person Households | 459 (1.9%) | 0 (0.0%) |
| 7+ Person Households | 192 (0.8%) | 0 (0.0%) |
| Total | 13,984 (58.6%) | 9,899 (41.4%) |
Female Fertility in Burlington
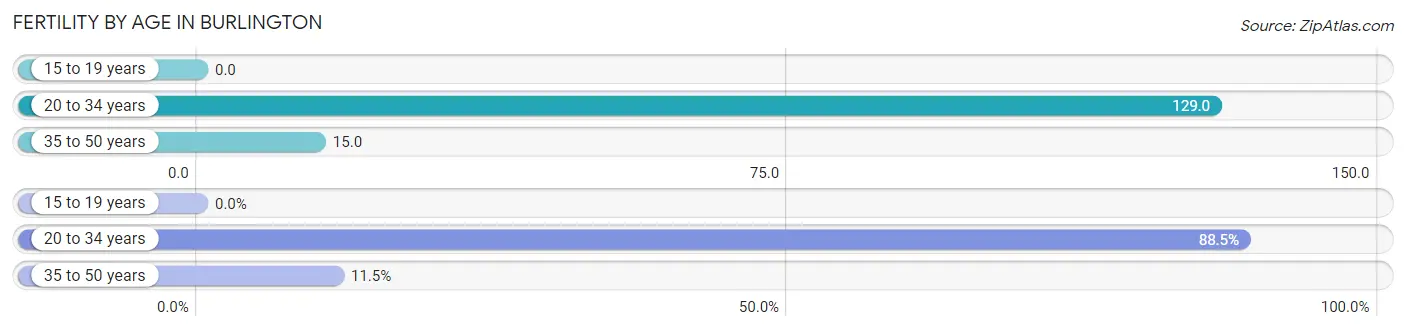
Fertility by Age in Burlington
Average fertility rate in Burlington is 60.0 births per 1,000 women. Women in the age bracket of 20 to 34 years have the highest fertility rate with 129.0 births per 1,000 women. Women in the age bracket of 20 to 34 years acount for 88.5% of all women with births.
| Age Bracket | Women with Births | Births / 1,000 Women |
| 15 to 19 years | 0 (0.0%) | 0.0 |
| 20 to 34 years | 682 (88.5%) | 129.0 |
| 35 to 50 years | 89 (11.5%) | 15.0 |
| Total | 771 (100.0%) | 60.0 |
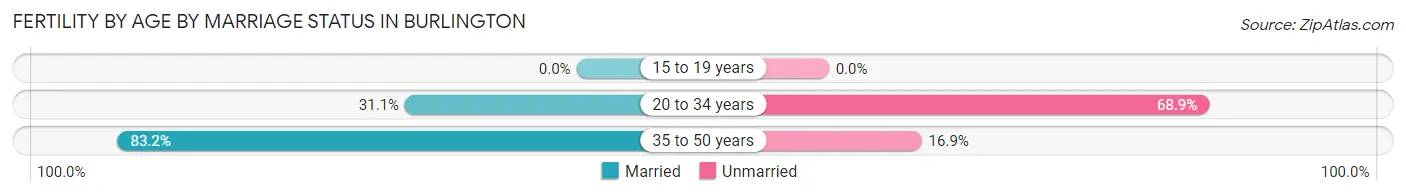
Fertility by Age by Marriage Status in Burlington
37.1% of women with births (771) in Burlington are married. The highest percentage of unmarried women with births falls into 20 to 34 years age bracket with 68.9% of them unmarried at the time of birth, while the lowest percentage of unmarried women with births belong to 35 to 50 years age bracket with 16.8% of them unmarried.
| Age Bracket | Married | Unmarried |
| 15 to 19 years | 0 (0.0%) | 0 (0.0%) |
| 20 to 34 years | 212 (31.1%) | 470 (68.9%) |
| 35 to 50 years | 74 (83.2%) | 15 (16.9%) |
| Total | 286 (37.1%) | 485 (62.9%) |
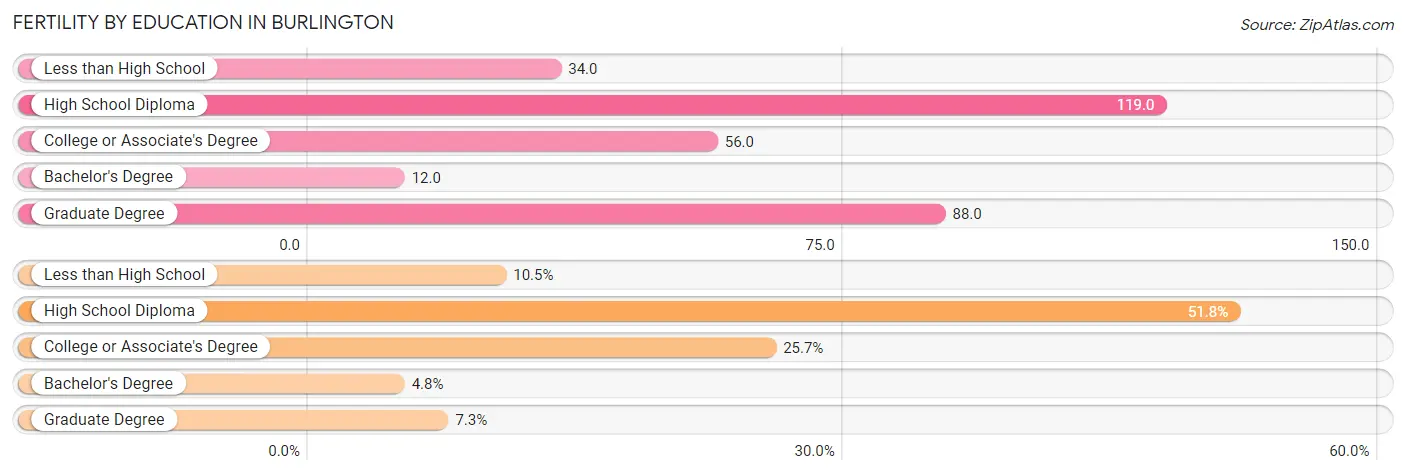
Fertility by Education in Burlington
Average fertility rate in Burlington is 60.0 births per 1,000 women. Women with the education attainment of high school diploma have the highest fertility rate of 119.0 births per 1,000 women, while women with the education attainment of bachelor's degree have the lowest fertility at 12.0 births per 1,000 women. Women with the education attainment of high school diploma represent 51.7% of all women with births.
| Educational Attainment | Women with Births | Births / 1,000 Women |
| Less than High School | 81 (10.5%) | 34.0 |
| High School Diploma | 399 (51.7%) | 119.0 |
| College or Associate's Degree | 198 (25.7%) | 56.0 |
| Bachelor's Degree | 37 (4.8%) | 12.0 |
| Graduate Degree | 56 (7.3%) | 88.0 |
| Total | 771 (100.0%) | 60.0 |
Fertility by Education by Marriage Status in Burlington
62.9% of women with births in Burlington are unmarried. Women with the educational attainment of graduate degree are most likely to be married with 100.0% of them married at childbirth, while women with the educational attainment of high school diploma are least likely to be married with 76.4% of them unmarried at childbirth.
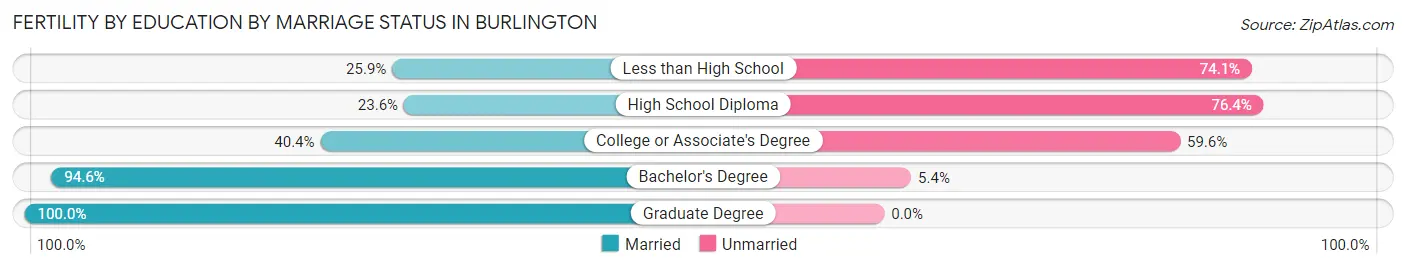
| Educational Attainment | Married | Unmarried |
| Less than High School | 21 (25.9%) | 60 (74.1%) |
| High School Diploma | 94 (23.6%) | 305 (76.4%) |
| College or Associate's Degree | 80 (40.4%) | 118 (59.6%) |
| Bachelor's Degree | 35 (94.6%) | 2 (5.4%) |
| Graduate Degree | 56 (100.0%) | 0 (0.0%) |
| Total | 286 (37.1%) | 485 (62.9%) |
Employment Characteristics in Burlington
Employment by Class of Employer in Burlington
Among the 26,450 employed individuals in Burlington, private company employees (19,409 | 73.4%), local government employees (1,912 | 7.2%), and not-for-profit organizations (1,572 | 5.9%) make up the most common classes of employment.
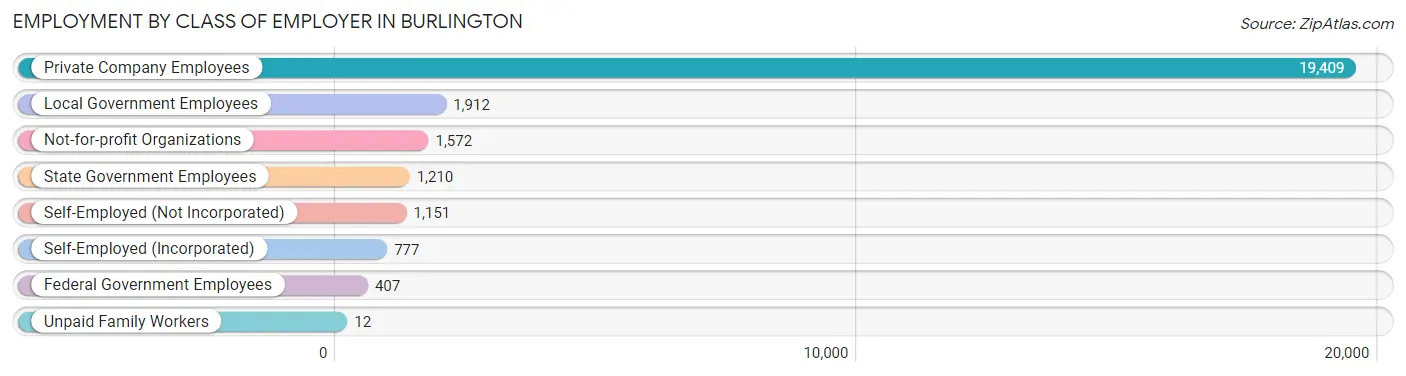
| Employer Class | # Employees | % Employees |
| Private Company Employees | 19,409 | 73.4% |
| Self-Employed (Incorporated) | 777 | 2.9% |
| Self-Employed (Not Incorporated) | 1,151 | 4.3% |
| Not-for-profit Organizations | 1,572 | 5.9% |
| Local Government Employees | 1,912 | 7.2% |
| State Government Employees | 1,210 | 4.6% |
| Federal Government Employees | 407 | 1.5% |
| Unpaid Family Workers | 12 | 0.1% |
| Total | 26,450 | 100.0% |
Employment Status by Age in Burlington
According to the labor force statistics for Burlington, out of the total population over 16 years of age (44,907), 63.8% or 28,651 individuals are in the labor force, with 5.7% or 1,633 of them unemployed. The age group with the highest labor force participation rate is 30 to 34 years, with 90.5% or 3,520 individuals in the labor force. Within the labor force, the 16 to 19 years age range has the highest percentage of unemployed individuals, with 19.0% or 253 of them being unemployed.
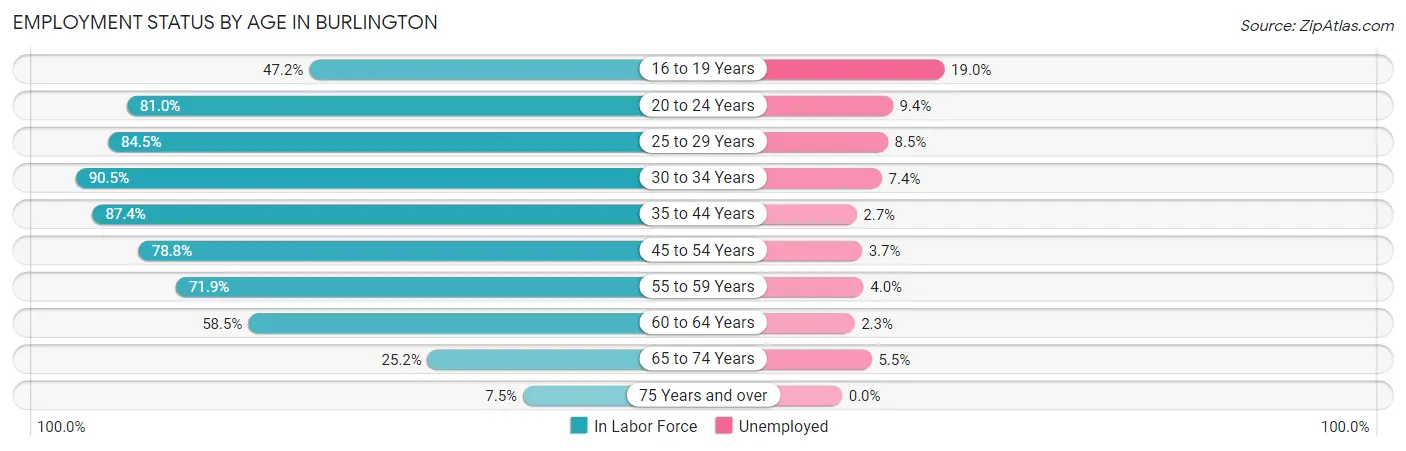
| Age Bracket | In Labor Force | Unemployed |
| 16 to 19 Years | 1,329 (47.2%) | 253 (19.0%) |
| 20 to 24 Years | 2,451 (81.0%) | 230 (9.4%) |
| 25 to 29 Years | 3,137 (84.5%) | 267 (8.5%) |
| 30 to 34 Years | 3,520 (90.5%) | 260 (7.4%) |
| 35 to 44 Years | 5,840 (87.4%) | 158 (2.7%) |
| 45 to 54 Years | 5,817 (78.8%) | 215 (3.7%) |
| 55 to 59 Years | 2,923 (71.9%) | 117 (4.0%) |
| 60 to 64 Years | 1,840 (58.5%) | 42 (2.3%) |
| 65 to 74 Years | 1,434 (25.2%) | 79 (5.5%) |
| 75 Years and over | 337 (7.5%) | 0 (0.0%) |
| Total | 28,651 (63.8%) | 1,633 (5.7%) |
Employment Status by Educational Attainment in Burlington
According to labor force statistics for Burlington, 79.9% of individuals (23,073) out of the total population between 25 and 64 years of age (28,877) are in the labor force, with 4.6% or 1,061 of them being unemployed. The group with the highest labor force participation rate are those with the educational attainment of bachelor's degree or higher, with 90.0% or 7,808 individuals in the labor force. Within the labor force, individuals with less than high school education have the highest percentage of unemployment, with 7.6% or 196 of them being unemployed.
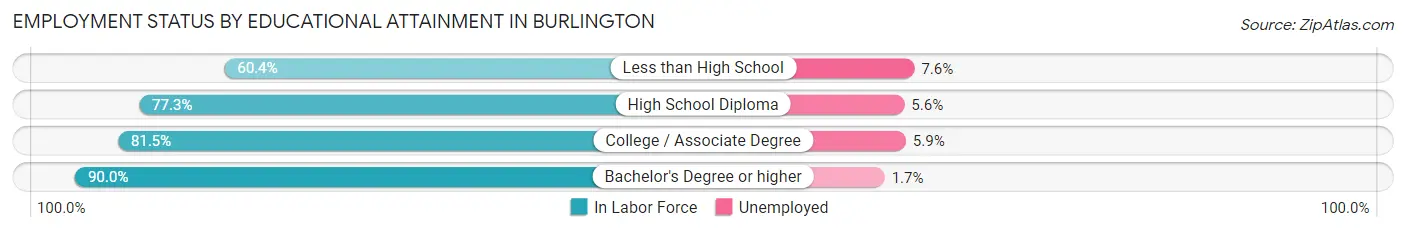
| Educational Attainment | In Labor Force | Unemployed |
| Less than High School | 2,585 (60.4%) | 325 (7.6%) |
| High School Diploma | 5,309 (77.3%) | 385 (5.6%) |
| College / Associate Degree | 7,380 (81.5%) | 534 (5.9%) |
| Bachelor's Degree or higher | 7,808 (90.0%) | 147 (1.7%) |
| Total | 23,073 (79.9%) | 1,328 (4.6%) |
Employment Occupations by Sex in Burlington
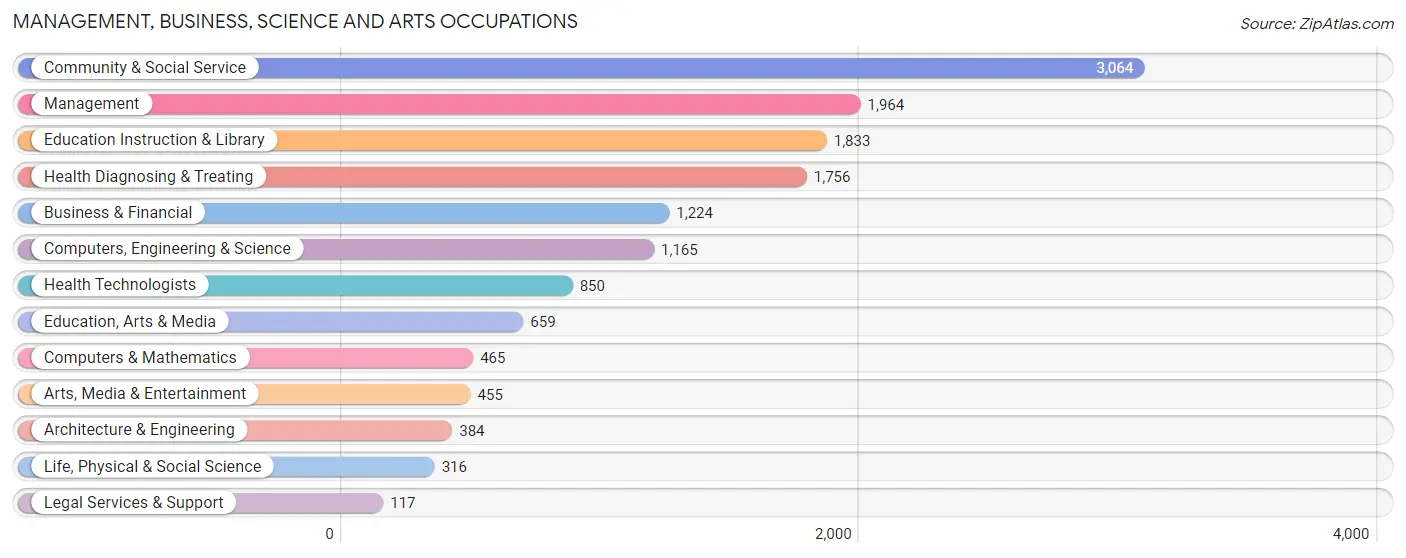
Management, Business, Science and Arts Occupations
The most common Management, Business, Science and Arts occupations in Burlington are Community & Social Service (3,064 | 11.4%), Management (1,964 | 7.3%), Education Instruction & Library (1,833 | 6.8%), Health Diagnosing & Treating (1,756 | 6.5%), and Business & Financial (1,224 | 4.5%).
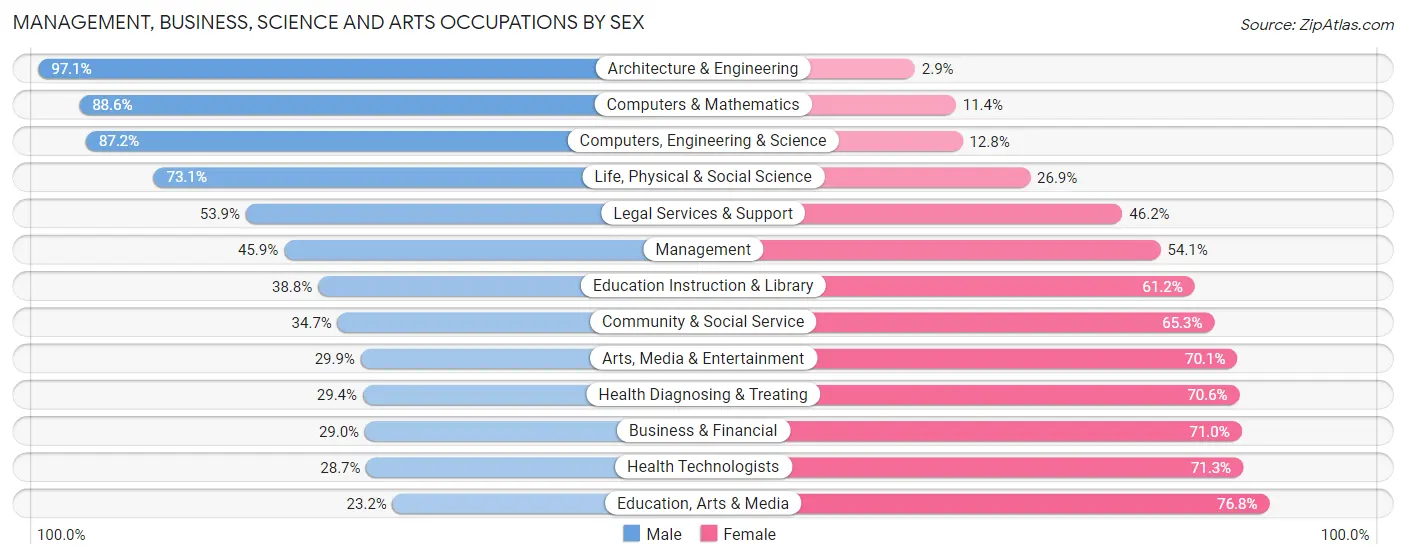
Management, Business, Science and Arts Occupations by Sex
Within the Management, Business, Science and Arts occupations in Burlington, the most male-oriented occupations are Architecture & Engineering (97.1%), Computers & Mathematics (88.6%), and Computers, Engineering & Science (87.2%), while the most female-oriented occupations are Education, Arts & Media (76.8%), Health Technologists (71.3%), and Business & Financial (71.0%).
| Occupation | Male | Female |
| Management | 901 (45.9%) | 1,063 (54.1%) |
| Business & Financial | 355 (29.0%) | 869 (71.0%) |
| Computers, Engineering & Science | 1,016 (87.2%) | 149 (12.8%) |
| Computers & Mathematics | 412 (88.6%) | 53 (11.4%) |
| Architecture & Engineering | 373 (97.1%) | 11 (2.9%) |
| Life, Physical & Social Science | 231 (73.1%) | 85 (26.9%) |
| Community & Social Service | 1,063 (34.7%) | 2,001 (65.3%) |
| Education, Arts & Media | 153 (23.2%) | 506 (76.8%) |
| Legal Services & Support | 63 (53.8%) | 54 (46.2%) |
| Education Instruction & Library | 711 (38.8%) | 1,122 (61.2%) |
| Arts, Media & Entertainment | 136 (29.9%) | 319 (70.1%) |
| Health Diagnosing & Treating | 517 (29.4%) | 1,239 (70.6%) |
| Health Technologists | 244 (28.7%) | 606 (71.3%) |
| Total (Category) | 3,852 (42.0%) | 5,321 (58.0%) |
| Total (Overall) | 13,091 (48.5%) | 13,891 (51.5%) |
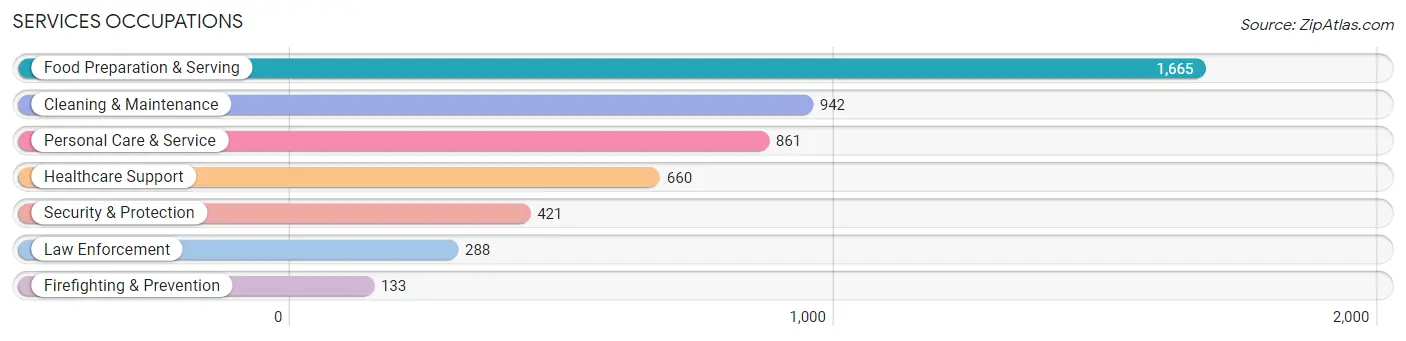
Services Occupations
The most common Services occupations in Burlington are Food Preparation & Serving (1,665 | 6.2%), Cleaning & Maintenance (942 | 3.5%), Personal Care & Service (861 | 3.2%), Healthcare Support (660 | 2.5%), and Security & Protection (421 | 1.6%).
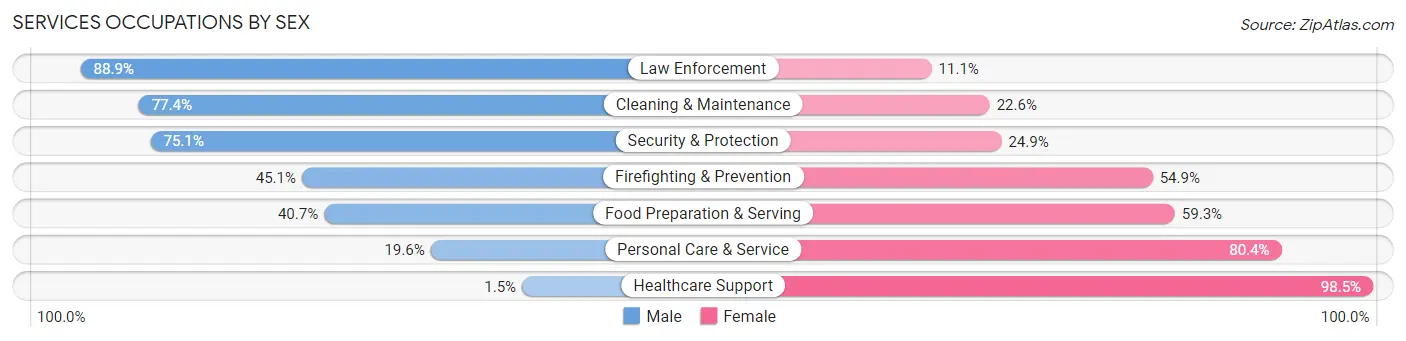
Services Occupations by Sex
Within the Services occupations in Burlington, the most male-oriented occupations are Law Enforcement (88.9%), Cleaning & Maintenance (77.4%), and Security & Protection (75.1%), while the most female-oriented occupations are Healthcare Support (98.5%), Personal Care & Service (80.4%), and Food Preparation & Serving (59.3%).
| Occupation | Male | Female |
| Healthcare Support | 10 (1.5%) | 650 (98.5%) |
| Security & Protection | 316 (75.1%) | 105 (24.9%) |
| Firefighting & Prevention | 60 (45.1%) | 73 (54.9%) |
| Law Enforcement | 256 (88.9%) | 32 (11.1%) |
| Food Preparation & Serving | 678 (40.7%) | 987 (59.3%) |
| Cleaning & Maintenance | 729 (77.4%) | 213 (22.6%) |
| Personal Care & Service | 169 (19.6%) | 692 (80.4%) |
| Total (Category) | 1,902 (41.8%) | 2,647 (58.2%) |
| Total (Overall) | 13,091 (48.5%) | 13,891 (51.5%) |
Sales and Office Occupations
The most common Sales and Office occupations in Burlington are Office & Administration (3,534 | 13.1%), and Sales & Related (3,041 | 11.3%).

Sales and Office Occupations by Sex

| Occupation | Male | Female |
| Sales & Related | 1,076 (35.4%) | 1,965 (64.6%) |
| Office & Administration | 1,023 (28.9%) | 2,511 (71.1%) |
| Total (Category) | 2,099 (31.9%) | 4,476 (68.1%) |
| Total (Overall) | 13,091 (48.5%) | 13,891 (51.5%) |
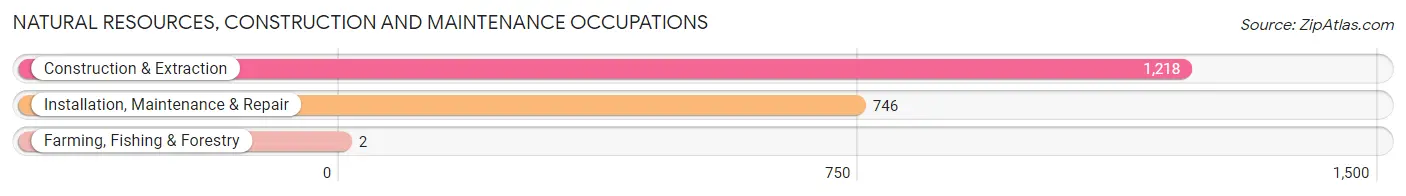
Natural Resources, Construction and Maintenance Occupations
The most common Natural Resources, Construction and Maintenance occupations in Burlington are Construction & Extraction (1,218 | 4.5%), Installation, Maintenance & Repair (746 | 2.8%), and Farming, Fishing & Forestry (2 | 0.0%).
Natural Resources, Construction and Maintenance Occupations by Sex
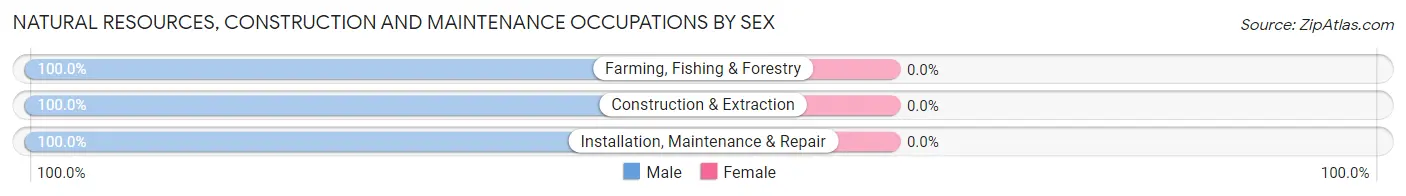
| Occupation | Male | Female |
| Farming, Fishing & Forestry | 2 (100.0%) | 0 (0.0%) |
| Construction & Extraction | 1,218 (100.0%) | 0 (0.0%) |
| Installation, Maintenance & Repair | 746 (100.0%) | 0 (0.0%) |
| Total (Category) | 1,966 (100.0%) | 0 (0.0%) |
| Total (Overall) | 13,091 (48.5%) | 13,891 (51.5%) |
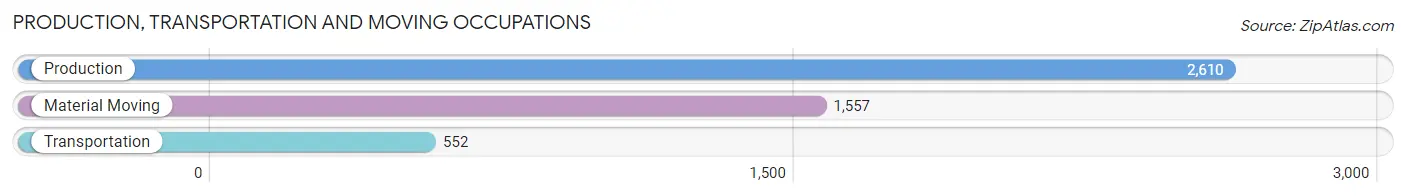
Production, Transportation and Moving Occupations
The most common Production, Transportation and Moving occupations in Burlington are Production (2,610 | 9.7%), Material Moving (1,557 | 5.8%), and Transportation (552 | 2.1%).
Production, Transportation and Moving Occupations by Sex
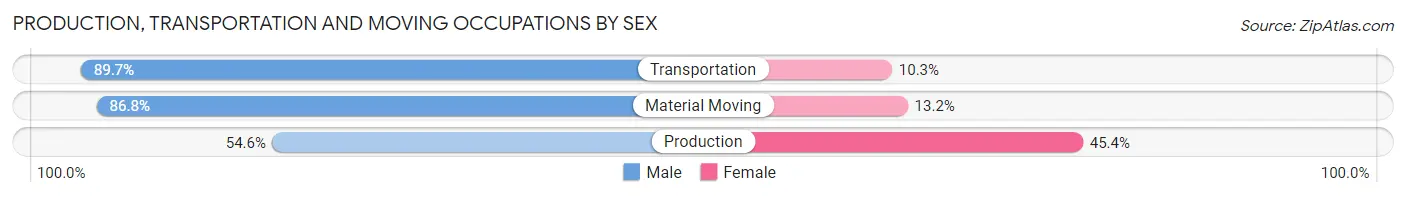
| Occupation | Male | Female |
| Production | 1,426 (54.6%) | 1,184 (45.4%) |
| Transportation | 495 (89.7%) | 57 (10.3%) |
| Material Moving | 1,351 (86.8%) | 206 (13.2%) |
| Total (Category) | 3,272 (69.3%) | 1,447 (30.7%) |
| Total (Overall) | 13,091 (48.5%) | 13,891 (51.5%) |
Employment Industries by Sex in Burlington
Employment Industries in Burlington
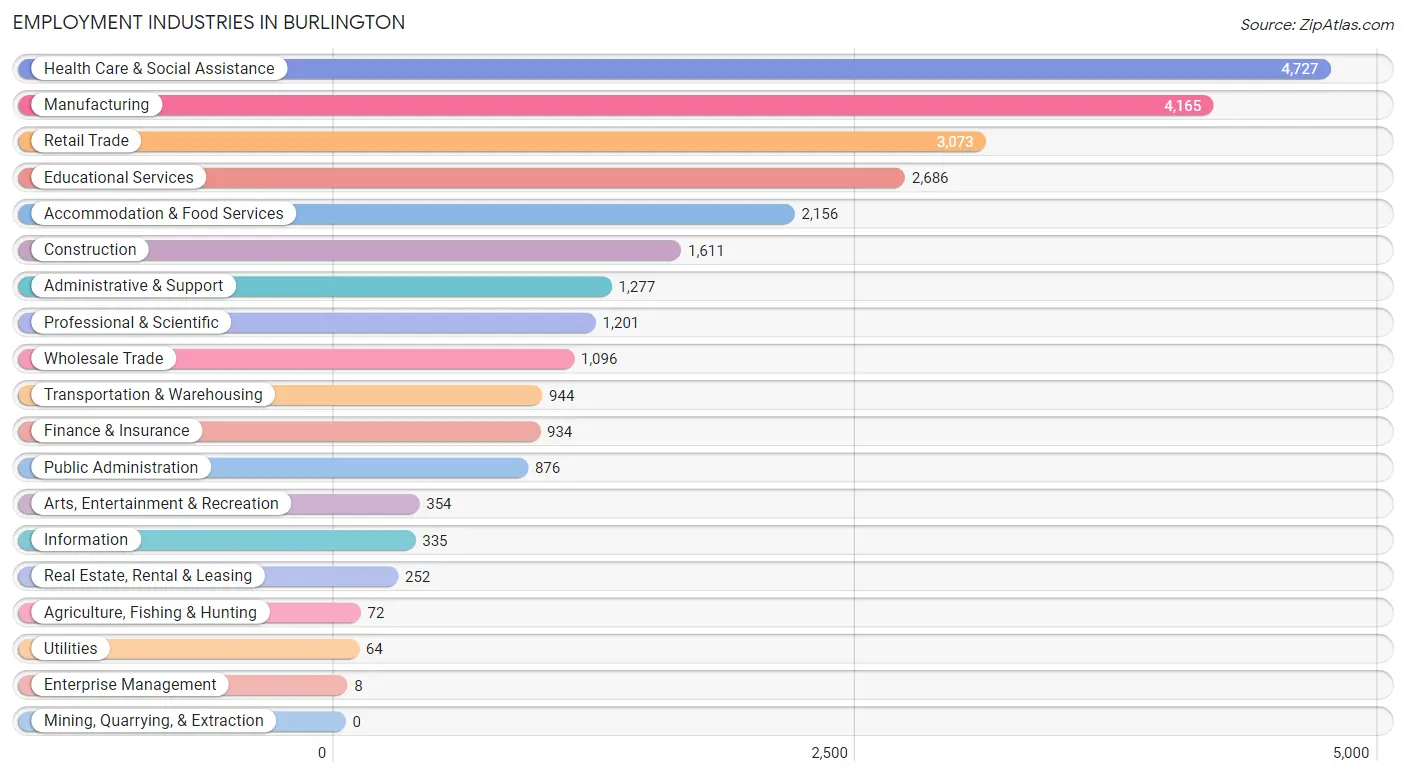
The major employment industries in Burlington include Health Care & Social Assistance (4,727 | 17.5%), Manufacturing (4,165 | 15.4%), Retail Trade (3,073 | 11.4%), Educational Services (2,686 | 10.0%), and Accommodation & Food Services (2,156 | 8.0%).
Employment Industries by Sex in Burlington
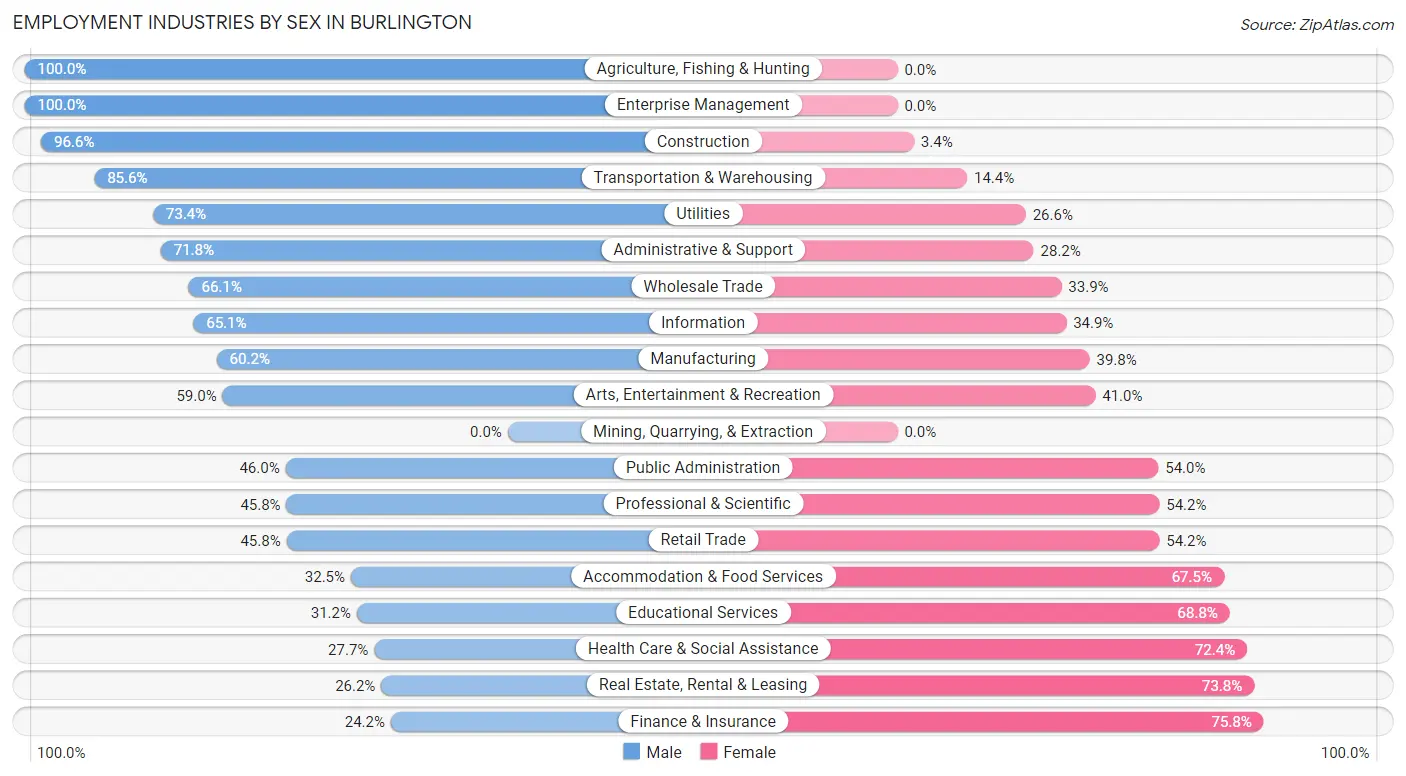
The Burlington industries that see more men than women are Agriculture, Fishing & Hunting (100.0%), Enterprise Management (100.0%), and Construction (96.6%), whereas the industries that tend to have a higher number of women are Finance & Insurance (75.8%), Real Estate, Rental & Leasing (73.8%), and Health Care & Social Assistance (72.4%).
| Industry | Male | Female |
| Agriculture, Fishing & Hunting | 72 (100.0%) | 0 (0.0%) |
| Mining, Quarrying, & Extraction | 0 (0.0%) | 0 (0.0%) |
| Construction | 1,556 (96.6%) | 55 (3.4%) |
| Manufacturing | 2,509 (60.2%) | 1,656 (39.8%) |
| Wholesale Trade | 724 (66.1%) | 372 (33.9%) |
| Retail Trade | 1,407 (45.8%) | 1,666 (54.2%) |
| Transportation & Warehousing | 808 (85.6%) | 136 (14.4%) |
| Utilities | 47 (73.4%) | 17 (26.6%) |
| Information | 218 (65.1%) | 117 (34.9%) |
| Finance & Insurance | 226 (24.2%) | 708 (75.8%) |
| Real Estate, Rental & Leasing | 66 (26.2%) | 186 (73.8%) |
| Professional & Scientific | 550 (45.8%) | 651 (54.2%) |
| Enterprise Management | 8 (100.0%) | 0 (0.0%) |
| Administrative & Support | 917 (71.8%) | 360 (28.2%) |
| Educational Services | 839 (31.2%) | 1,847 (68.8%) |
| Health Care & Social Assistance | 1,307 (27.7%) | 3,420 (72.4%) |
| Arts, Entertainment & Recreation | 209 (59.0%) | 145 (41.0%) |
| Accommodation & Food Services | 700 (32.5%) | 1,456 (67.5%) |
| Public Administration | 403 (46.0%) | 473 (54.0%) |
| Total | 13,091 (48.5%) | 13,891 (51.5%) |
Education in Burlington
School Enrollment in Burlington
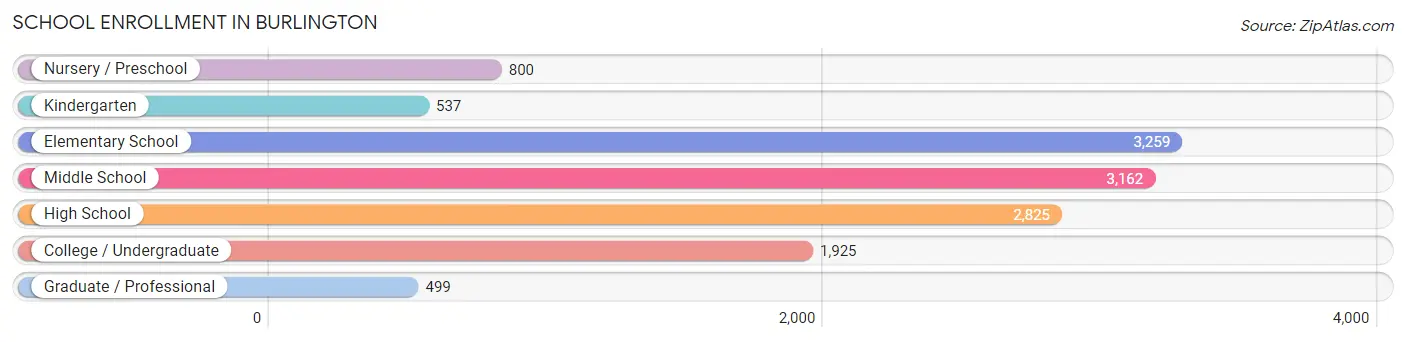
The most common levels of schooling among the 13,007 students in Burlington are elementary school (3,259 | 25.1%), middle school (3,162 | 24.3%), and high school (2,825 | 21.7%).
| School Level | # Students | % Students |
| Nursery / Preschool | 800 | 6.1% |
| Kindergarten | 537 | 4.1% |
| Elementary School | 3,259 | 25.1% |
| Middle School | 3,162 | 24.3% |
| High School | 2,825 | 21.7% |
| College / Undergraduate | 1,925 | 14.8% |
| Graduate / Professional | 499 | 3.8% |
| Total | 13,007 | 100.0% |
School Enrollment by Age by Funding Source in Burlington
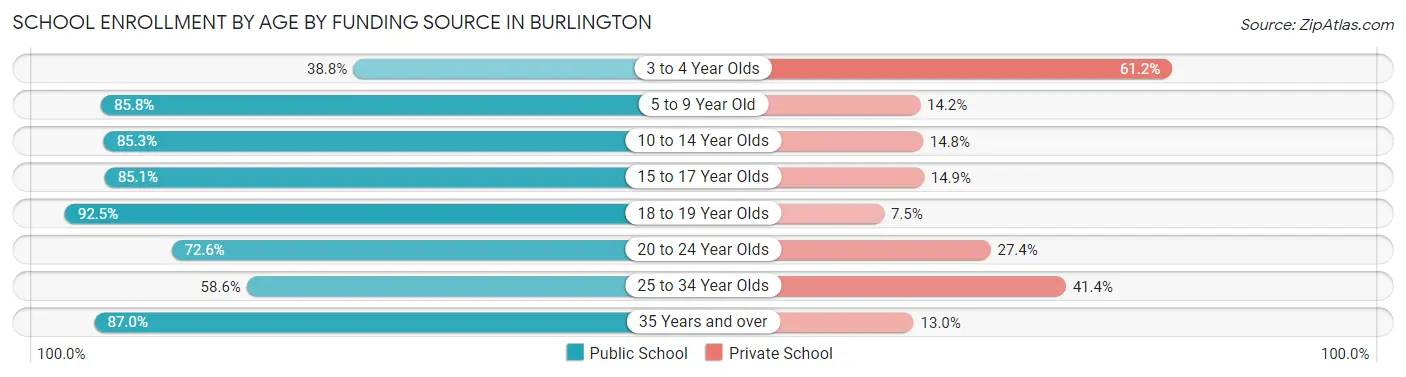
Out of a total of 13,007 students who are enrolled in schools in Burlington, 2,445 (18.8%) attend a private institution, while the remaining 10,562 (81.2%) are enrolled in public schools. The age group of 3 to 4 year olds has the highest likelihood of being enrolled in private schools, with 424 (61.2% in the age bracket) enrolled. Conversely, the age group of 18 to 19 year olds has the lowest likelihood of being enrolled in a private school, with 863 (92.5% in the age bracket) attending a public institution.
| Age Bracket | Public School | Private School |
| 3 to 4 Year Olds | 269 (38.8%) | 424 (61.2%) |
| 5 to 9 Year Old | 2,809 (85.8%) | 466 (14.2%) |
| 10 to 14 Year Olds | 3,631 (85.3%) | 628 (14.7%) |
| 15 to 17 Year Olds | 1,493 (85.1%) | 262 (14.9%) |
| 18 to 19 Year Olds | 863 (92.5%) | 70 (7.5%) |
| 20 to 24 Year Olds | 640 (72.6%) | 241 (27.4%) |
| 25 to 34 Year Olds | 404 (58.6%) | 285 (41.4%) |
| 35 Years and over | 454 (87.0%) | 68 (13.0%) |
| Total | 10,562 (81.2%) | 2,445 (18.8%) |
Educational Attainment by Field of Study in Burlington
Business (2,411 | 19.7%), education (1,403 | 11.5%), science & technology (1,001 | 8.2%), arts & humanities (831 | 6.8%), and liberal arts & history (827 | 6.8%) are the most common fields of study among 12,220 individuals in Burlington who have obtained a bachelor's degree or higher.
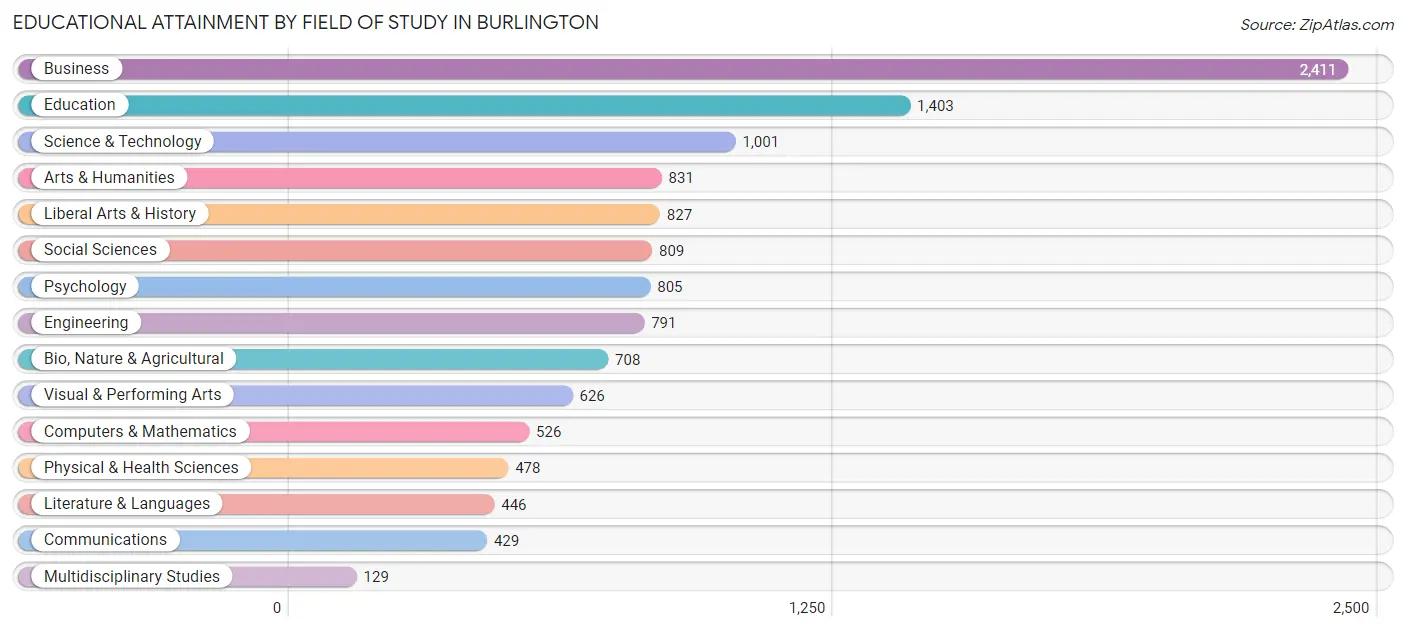
| Field of Study | # Graduates | % Graduates |
| Computers & Mathematics | 526 | 4.3% |
| Bio, Nature & Agricultural | 708 | 5.8% |
| Physical & Health Sciences | 478 | 3.9% |
| Psychology | 805 | 6.6% |
| Social Sciences | 809 | 6.6% |
| Engineering | 791 | 6.5% |
| Multidisciplinary Studies | 129 | 1.1% |
| Science & Technology | 1,001 | 8.2% |
| Business | 2,411 | 19.7% |
| Education | 1,403 | 11.5% |
| Literature & Languages | 446 | 3.6% |
| Liberal Arts & History | 827 | 6.8% |
| Visual & Performing Arts | 626 | 5.1% |
| Communications | 429 | 3.5% |
| Arts & Humanities | 831 | 6.8% |
| Total | 12,220 | 100.0% |
Transportation & Commute in Burlington
Vehicle Availability by Sex in Burlington
The most prevalent vehicle ownership categories in Burlington are males with 2 vehicles (5,309, accounting for 41.2%) and females with 2 vehicles (4,845, making up 39.2%).
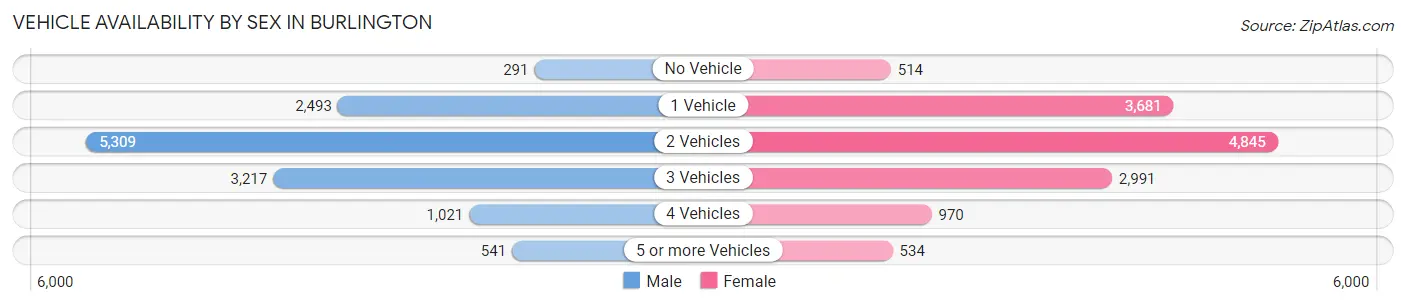
| Vehicles Available | Male | Female |
| No Vehicle | 291 (2.3%) | 514 (3.8%) |
| 1 Vehicle | 2,493 (19.4%) | 3,681 (27.2%) |
| 2 Vehicles | 5,309 (41.2%) | 4,845 (35.8%) |
| 3 Vehicles | 3,217 (25.0%) | 2,991 (22.1%) |
| 4 Vehicles | 1,021 (7.9%) | 970 (7.2%) |
| 5 or more Vehicles | 541 (4.2%) | 534 (4.0%) |
| Total | 12,872 (100.0%) | 13,535 (100.0%) |
Commute Time in Burlington
The most frequently occuring commute durations in Burlington are 15 to 19 minutes (4,836 commuters, 19.7%), 10 to 14 minutes (4,114 commuters, 16.8%), and 20 to 24 minutes (3,441 commuters, 14.0%).
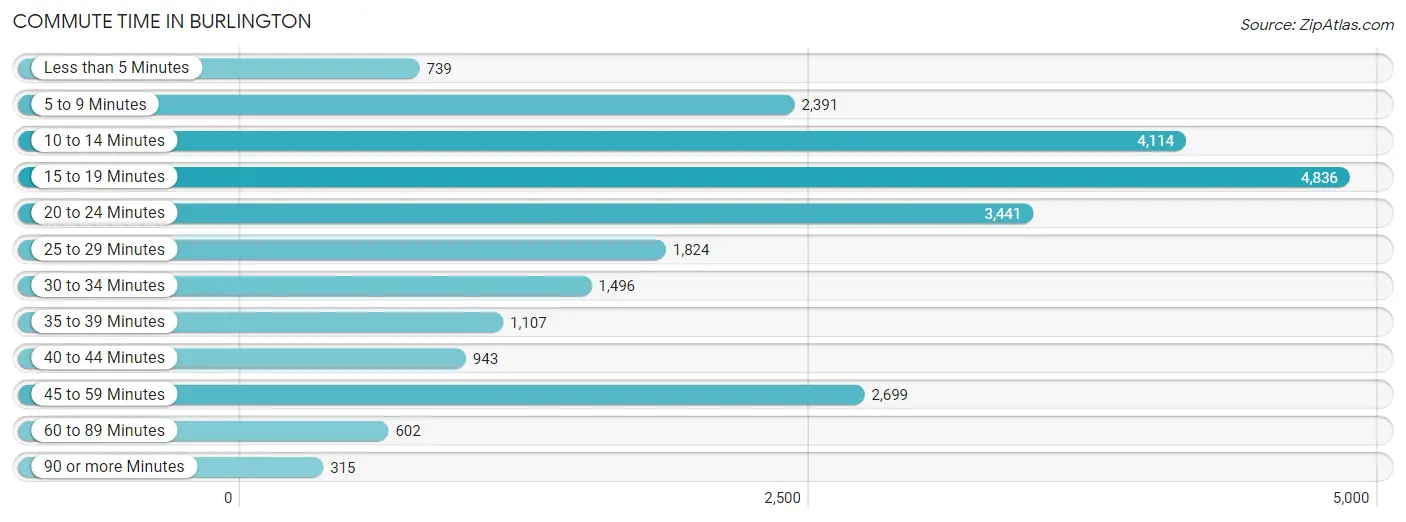
| Commute Time | # Commuters | % Commuters |
| Less than 5 Minutes | 739 | 3.0% |
| 5 to 9 Minutes | 2,391 | 9.8% |
| 10 to 14 Minutes | 4,114 | 16.8% |
| 15 to 19 Minutes | 4,836 | 19.7% |
| 20 to 24 Minutes | 3,441 | 14.0% |
| 25 to 29 Minutes | 1,824 | 7.4% |
| 30 to 34 Minutes | 1,496 | 6.1% |
| 35 to 39 Minutes | 1,107 | 4.5% |
| 40 to 44 Minutes | 943 | 3.8% |
| 45 to 59 Minutes | 2,699 | 11.0% |
| 60 to 89 Minutes | 602 | 2.5% |
| 90 or more Minutes | 315 | 1.3% |
Commute Time by Sex in Burlington
The most common commute times in Burlington are 15 to 19 minutes (2,364 commuters, 19.9%) for males and 15 to 19 minutes (2,472 commuters, 19.6%) for females.
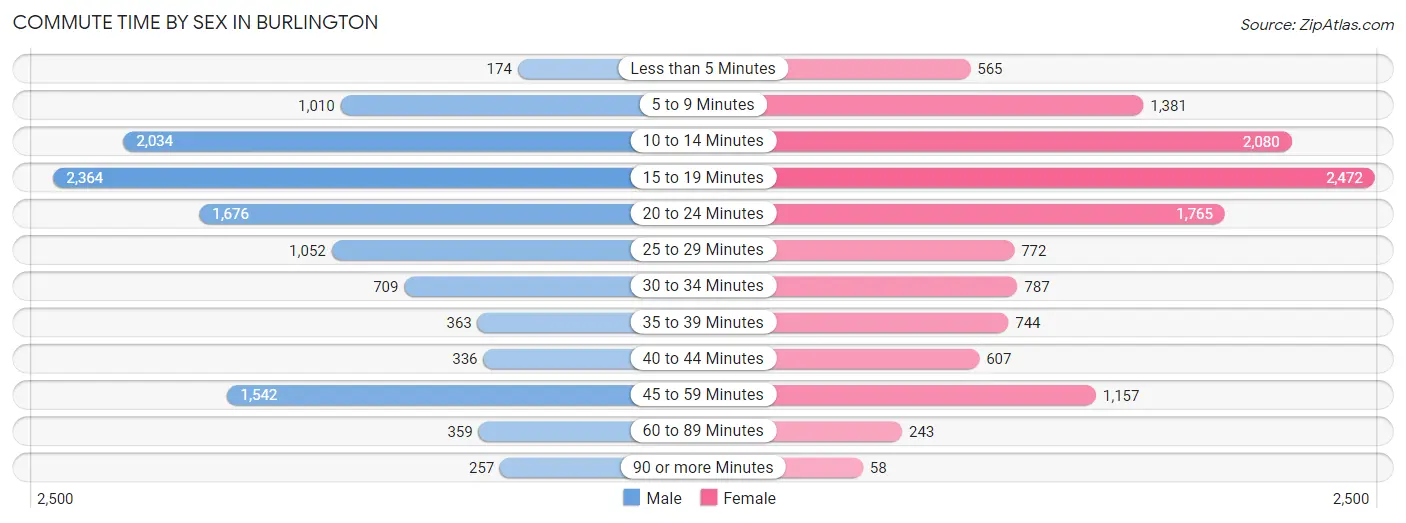
| Commute Time | Male | Female |
| Less than 5 Minutes | 174 (1.5%) | 565 (4.5%) |
| 5 to 9 Minutes | 1,010 (8.5%) | 1,381 (10.9%) |
| 10 to 14 Minutes | 2,034 (17.1%) | 2,080 (16.5%) |
| 15 to 19 Minutes | 2,364 (19.9%) | 2,472 (19.6%) |
| 20 to 24 Minutes | 1,676 (14.1%) | 1,765 (14.0%) |
| 25 to 29 Minutes | 1,052 (8.9%) | 772 (6.1%) |
| 30 to 34 Minutes | 709 (6.0%) | 787 (6.2%) |
| 35 to 39 Minutes | 363 (3.1%) | 744 (5.9%) |
| 40 to 44 Minutes | 336 (2.8%) | 607 (4.8%) |
| 45 to 59 Minutes | 1,542 (13.0%) | 1,157 (9.2%) |
| 60 to 89 Minutes | 359 (3.0%) | 243 (1.9%) |
| 90 or more Minutes | 257 (2.2%) | 58 (0.5%) |
Time of Departure to Work by Sex in Burlington
The most frequent times of departure to work in Burlington are 7:00 AM to 7:29 AM (1,819, 15.3%) for males and 7:30 AM to 7:59 AM (2,111, 16.7%) for females.
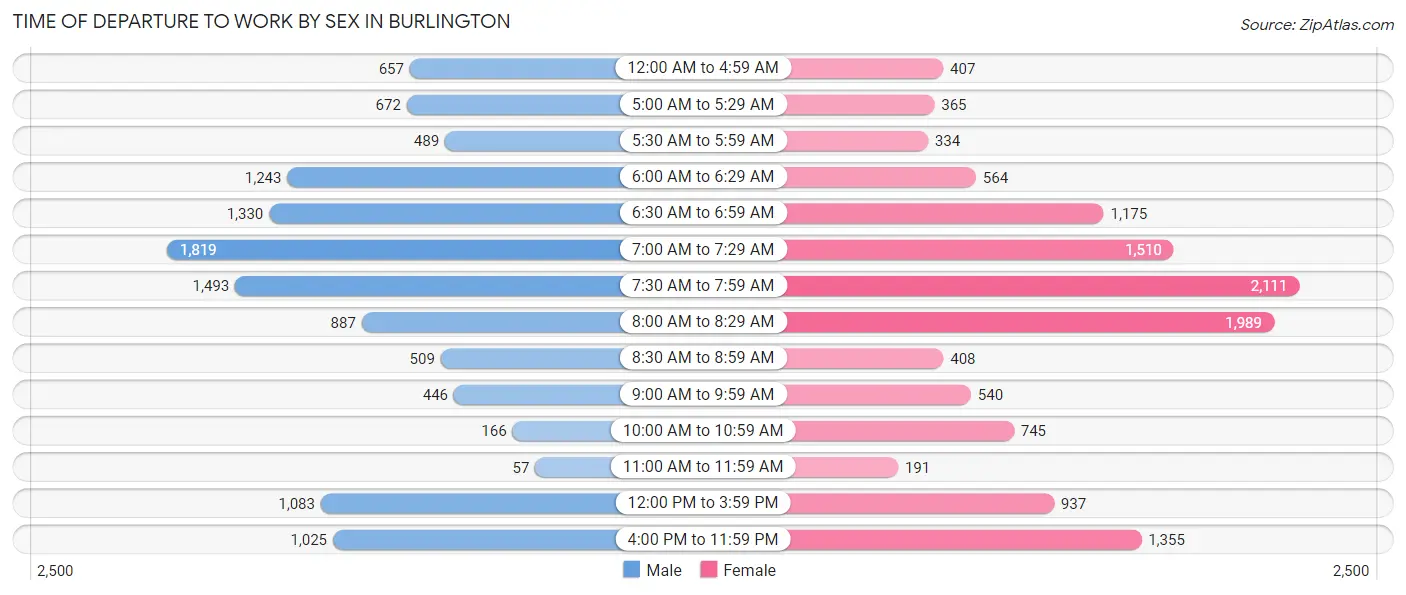
| Time of Departure | Male | Female |
| 12:00 AM to 4:59 AM | 657 (5.5%) | 407 (3.2%) |
| 5:00 AM to 5:29 AM | 672 (5.7%) | 365 (2.9%) |
| 5:30 AM to 5:59 AM | 489 (4.1%) | 334 (2.6%) |
| 6:00 AM to 6:29 AM | 1,243 (10.5%) | 564 (4.5%) |
| 6:30 AM to 6:59 AM | 1,330 (11.2%) | 1,175 (9.3%) |
| 7:00 AM to 7:29 AM | 1,819 (15.3%) | 1,510 (11.9%) |
| 7:30 AM to 7:59 AM | 1,493 (12.6%) | 2,111 (16.7%) |
| 8:00 AM to 8:29 AM | 887 (7.5%) | 1,989 (15.8%) |
| 8:30 AM to 8:59 AM | 509 (4.3%) | 408 (3.2%) |
| 9:00 AM to 9:59 AM | 446 (3.8%) | 540 (4.3%) |
| 10:00 AM to 10:59 AM | 166 (1.4%) | 745 (5.9%) |
| 11:00 AM to 11:59 AM | 57 (0.5%) | 191 (1.5%) |
| 12:00 PM to 3:59 PM | 1,083 (9.1%) | 937 (7.4%) |
| 4:00 PM to 11:59 PM | 1,025 (8.6%) | 1,355 (10.7%) |
| Total | 11,876 (100.0%) | 12,631 (100.0%) |
Housing Occupancy in Burlington
Occupancy by Ownership in Burlington
Of the total 23,883 dwellings in Burlington, owner-occupied units account for 13,254 (55.5%), while renter-occupied units make up 10,629 (44.5%).
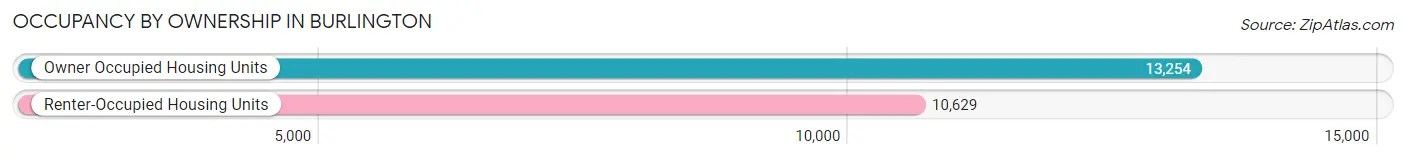
| Occupancy | # Housing Units | % Housing Units |
| Owner Occupied Housing Units | 13,254 | 55.5% |
| Renter-Occupied Housing Units | 10,629 | 44.5% |
| Total Occupied Housing Units | 23,883 | 100.0% |
Occupancy by Household Size in Burlington
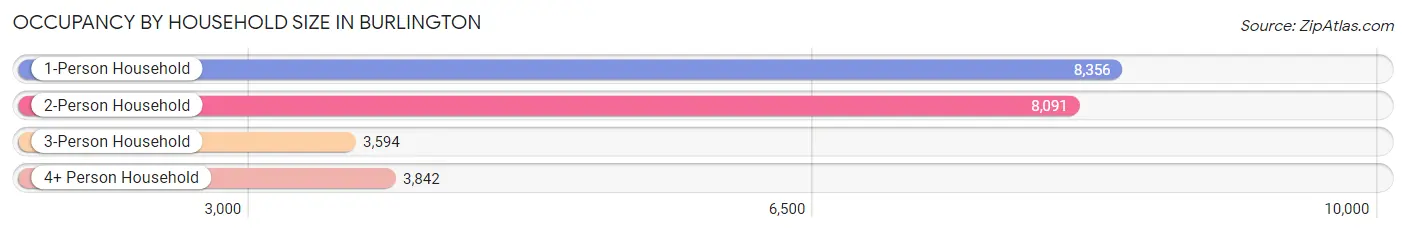
| Household Size | # Housing Units | % Housing Units |
| 1-Person Household | 8,356 | 35.0% |
| 2-Person Household | 8,091 | 33.9% |
| 3-Person Household | 3,594 | 15.0% |
| 4+ Person Household | 3,842 | 16.1% |
| Total Housing Units | 23,883 | 100.0% |
Occupancy by Ownership by Household Size in Burlington
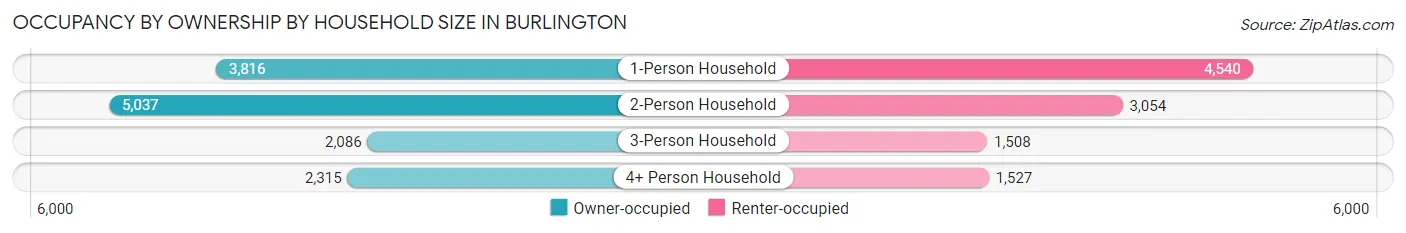
| Household Size | Owner-occupied | Renter-occupied |
| 1-Person Household | 3,816 (45.7%) | 4,540 (54.3%) |
| 2-Person Household | 5,037 (62.3%) | 3,054 (37.8%) |
| 3-Person Household | 2,086 (58.0%) | 1,508 (42.0%) |
| 4+ Person Household | 2,315 (60.3%) | 1,527 (39.7%) |
| Total Housing Units | 13,254 (55.5%) | 10,629 (44.5%) |
Occupancy by Educational Attainment in Burlington
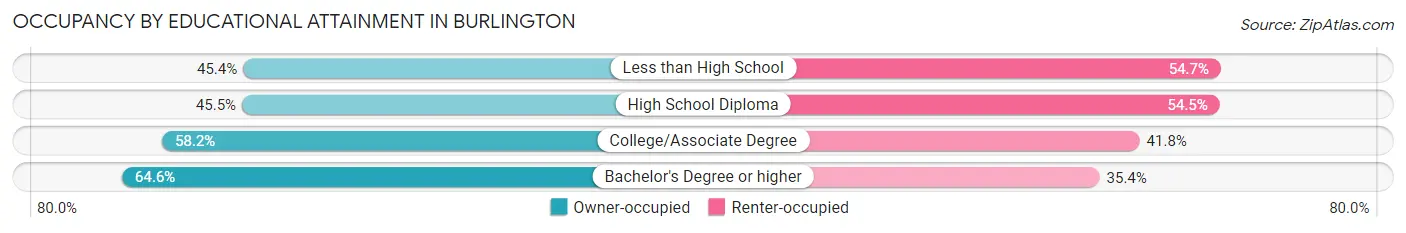
| Household Size | Owner-occupied | Renter-occupied |
| Less than High School | 1,316 (45.4%) | 1,586 (54.6%) |
| High School Diploma | 2,632 (45.5%) | 3,149 (54.5%) |
| College/Associate Degree | 4,651 (58.2%) | 3,339 (41.8%) |
| Bachelor's Degree or higher | 4,655 (64.6%) | 2,555 (35.4%) |
Occupancy by Age of Householder in Burlington
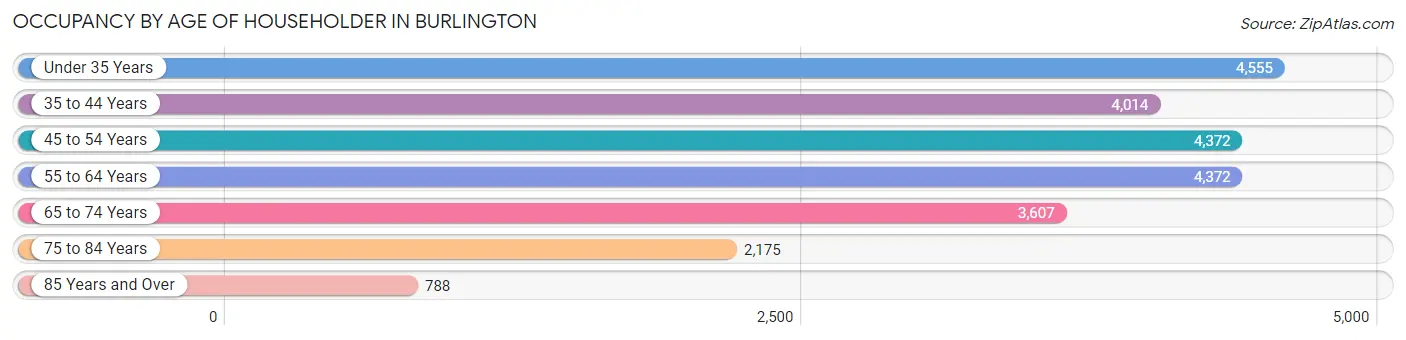
| Age Bracket | # Households | % Households |
| Under 35 Years | 4,555 | 19.1% |
| 35 to 44 Years | 4,014 | 16.8% |
| 45 to 54 Years | 4,372 | 18.3% |
| 55 to 64 Years | 4,372 | 18.3% |
| 65 to 74 Years | 3,607 | 15.1% |
| 75 to 84 Years | 2,175 | 9.1% |
| 85 Years and Over | 788 | 3.3% |
| Total | 23,883 | 100.0% |
Housing Finances in Burlington
Median Income by Occupancy in Burlington
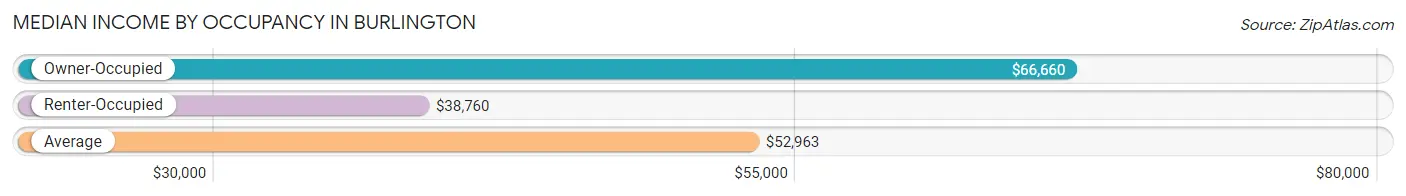
| Occupancy Type | # Households | Median Income |
| Owner-Occupied | 13,254 (55.5%) | $66,660 |
| Renter-Occupied | 10,629 (44.5%) | $38,760 |
| Average | 23,883 (100.0%) | $52,963 |
Occupancy by Householder Income Bracket in Burlington
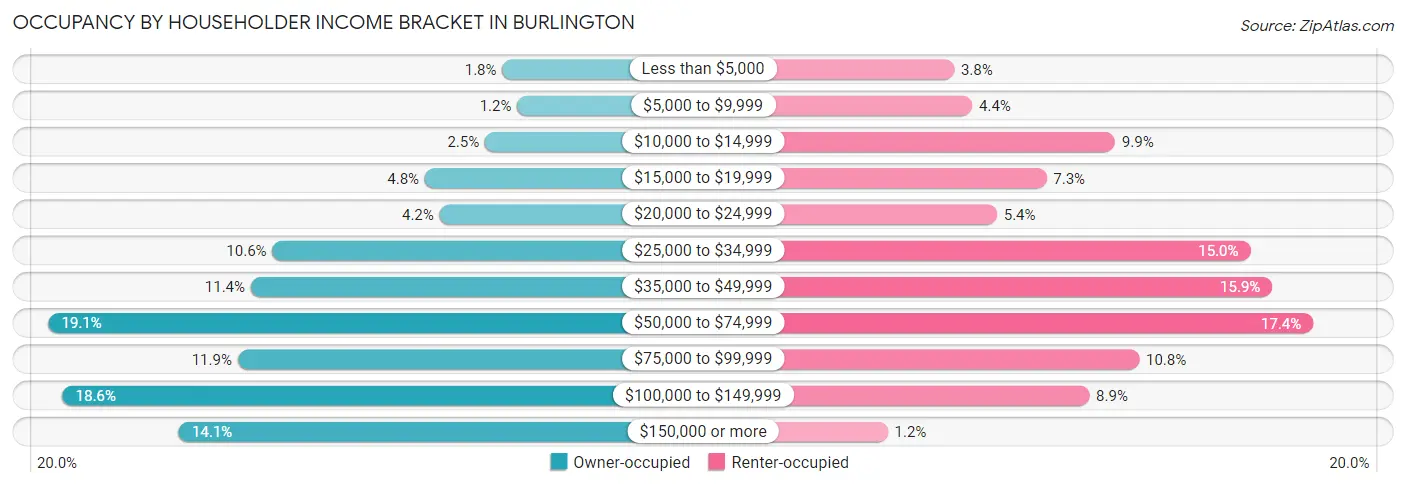
| Income Bracket | Owner-occupied | Renter-occupied |
| Less than $5,000 | 238 (1.8%) | 399 (3.7%) |
| $5,000 to $9,999 | 163 (1.2%) | 472 (4.4%) |
| $10,000 to $14,999 | 326 (2.5%) | 1,050 (9.9%) |
| $15,000 to $19,999 | 630 (4.8%) | 773 (7.3%) |
| $20,000 to $24,999 | 555 (4.2%) | 572 (5.4%) |
| $25,000 to $34,999 | 1,400 (10.6%) | 1,599 (15.0%) |
| $35,000 to $49,999 | 1,508 (11.4%) | 1,687 (15.9%) |
| $50,000 to $74,999 | 2,530 (19.1%) | 1,853 (17.4%) |
| $75,000 to $99,999 | 1,575 (11.9%) | 1,148 (10.8%) |
| $100,000 to $149,999 | 2,458 (18.5%) | 946 (8.9%) |
| $150,000 or more | 1,871 (14.1%) | 130 (1.2%) |
| Total | 13,254 (100.0%) | 10,629 (100.0%) |
Monthly Housing Cost Tiers in Burlington
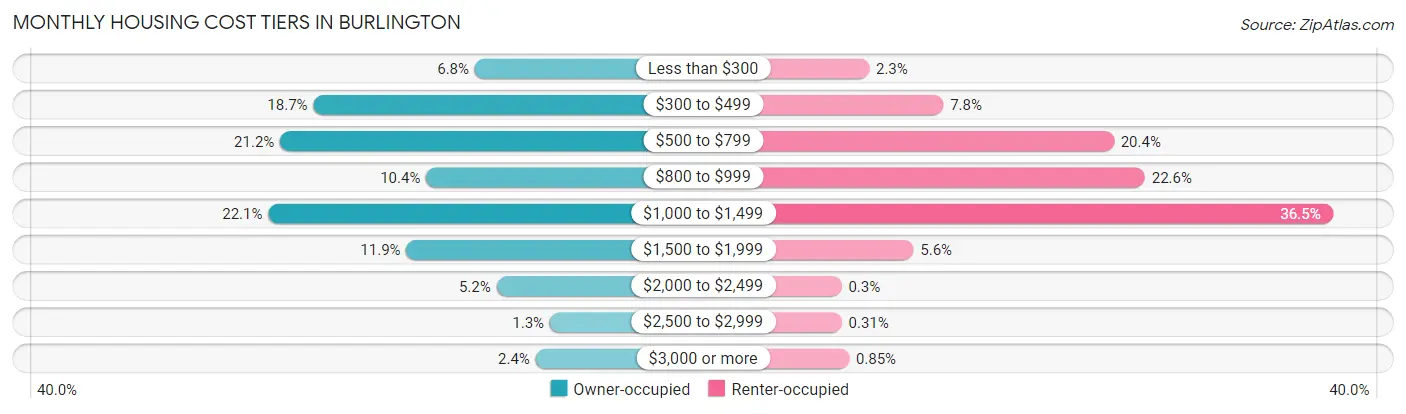
| Monthly Cost | Owner-occupied | Renter-occupied |
| Less than $300 | 907 (6.8%) | 248 (2.3%) |
| $300 to $499 | 2,482 (18.7%) | 828 (7.8%) |
| $500 to $799 | 2,807 (21.2%) | 2,163 (20.3%) |
| $800 to $999 | 1,381 (10.4%) | 2,406 (22.6%) |
| $1,000 to $1,499 | 2,922 (22.1%) | 3,875 (36.5%) |
| $1,500 to $1,999 | 1,574 (11.9%) | 594 (5.6%) |
| $2,000 to $2,499 | 695 (5.2%) | 32 (0.3%) |
| $2,500 to $2,999 | 173 (1.3%) | 33 (0.3%) |
| $3,000 or more | 313 (2.4%) | 90 (0.9%) |
| Total | 13,254 (100.0%) | 10,629 (100.0%) |
Physical Housing Characteristics in Burlington
Housing Structures in Burlington
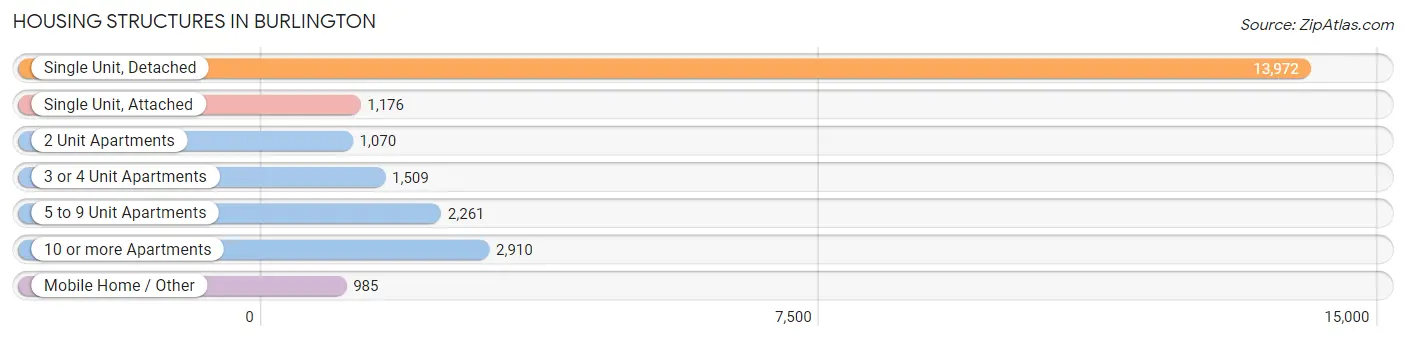
| Structure Type | # Housing Units | % Housing Units |
| Single Unit, Detached | 13,972 | 58.5% |
| Single Unit, Attached | 1,176 | 4.9% |
| 2 Unit Apartments | 1,070 | 4.5% |
| 3 or 4 Unit Apartments | 1,509 | 6.3% |
| 5 to 9 Unit Apartments | 2,261 | 9.5% |
| 10 or more Apartments | 2,910 | 12.2% |
| Mobile Home / Other | 985 | 4.1% |
| Total | 23,883 | 100.0% |
Housing Structures by Occupancy in Burlington
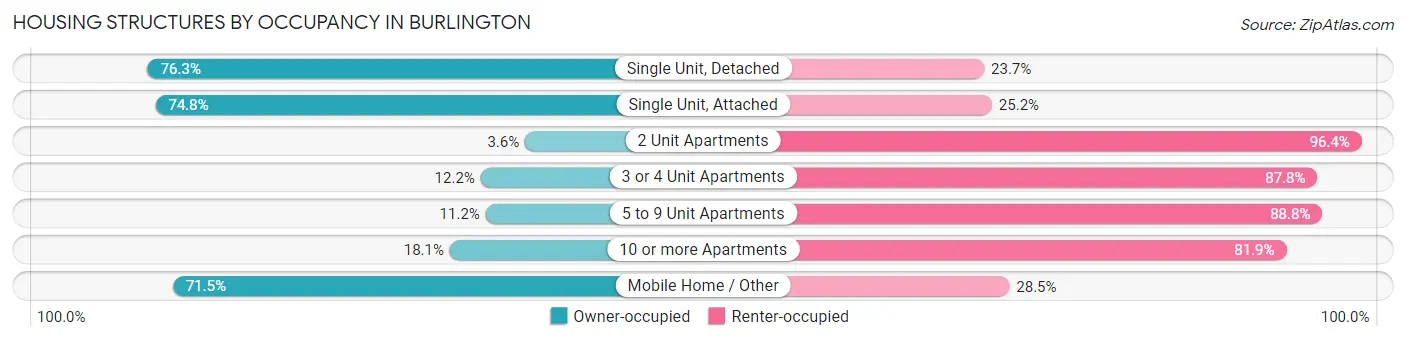
| Structure Type | Owner-occupied | Renter-occupied |
| Single Unit, Detached | 10,665 (76.3%) | 3,307 (23.7%) |
| Single Unit, Attached | 880 (74.8%) | 296 (25.2%) |
| 2 Unit Apartments | 39 (3.6%) | 1,031 (96.4%) |
| 3 or 4 Unit Apartments | 184 (12.2%) | 1,325 (87.8%) |
| 5 to 9 Unit Apartments | 254 (11.2%) | 2,007 (88.8%) |
| 10 or more Apartments | 528 (18.1%) | 2,382 (81.9%) |
| Mobile Home / Other | 704 (71.5%) | 281 (28.5%) |
| Total | 13,254 (55.5%) | 10,629 (44.5%) |
Housing Structures by Number of Rooms in Burlington
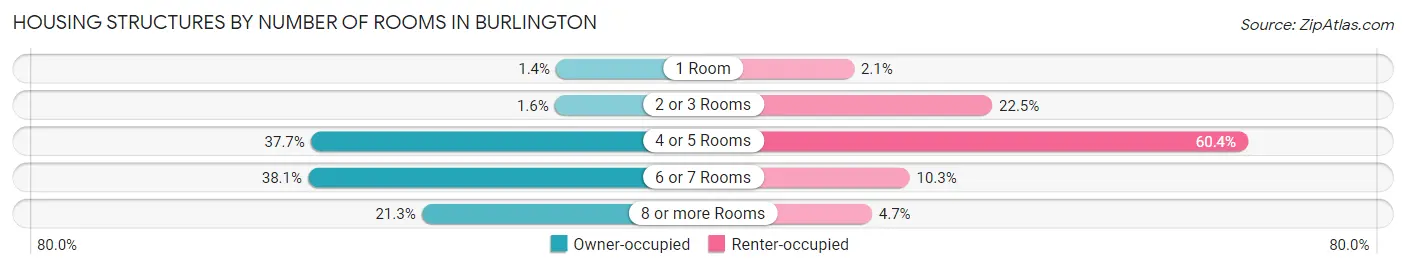
| Number of Rooms | Owner-occupied | Renter-occupied |
| 1 Room | 184 (1.4%) | 221 (2.1%) |
| 2 or 3 Rooms | 209 (1.6%) | 2,394 (22.5%) |
| 4 or 5 Rooms | 4,994 (37.7%) | 6,416 (60.4%) |
| 6 or 7 Rooms | 5,048 (38.1%) | 1,095 (10.3%) |
| 8 or more Rooms | 2,819 (21.3%) | 503 (4.7%) |
| Total | 13,254 (100.0%) | 10,629 (100.0%) |
Housing Structure by Heating Type in Burlington
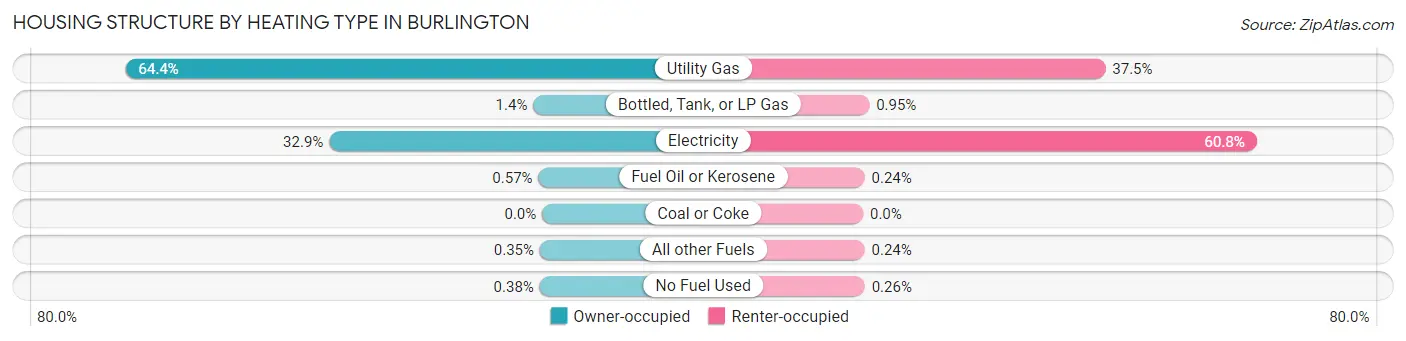
| Heating Type | Owner-occupied | Renter-occupied |
| Utility Gas | 8,537 (64.4%) | 3,982 (37.5%) |
| Bottled, Tank, or LP Gas | 181 (1.4%) | 101 (0.9%) |
| Electricity | 4,363 (32.9%) | 6,467 (60.8%) |
| Fuel Oil or Kerosene | 76 (0.6%) | 26 (0.2%) |
| Coal or Coke | 0 (0.0%) | 0 (0.0%) |
| All other Fuels | 46 (0.4%) | 25 (0.2%) |
| No Fuel Used | 51 (0.4%) | 28 (0.3%) |
| Total | 13,254 (100.0%) | 10,629 (100.0%) |
Household Vehicle Usage in Burlington
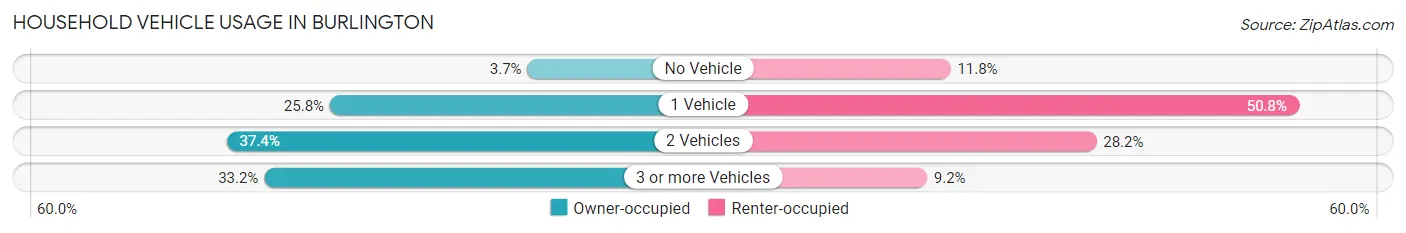
| Vehicles per Household | Owner-occupied | Renter-occupied |
| No Vehicle | 486 (3.7%) | 1,256 (11.8%) |
| 1 Vehicle | 3,420 (25.8%) | 5,404 (50.8%) |
| 2 Vehicles | 4,953 (37.4%) | 2,993 (28.2%) |
| 3 or more Vehicles | 4,395 (33.2%) | 976 (9.2%) |
| Total | 13,254 (100.0%) | 10,629 (100.0%) |
Real Estate & Mortgages in Burlington
Real Estate and Mortgage Overview in Burlington
| Characteristic | Without Mortgage | With Mortgage |
| Housing Units | 5,687 | 7,567 |
| Median Property Value | $148,900 | $186,400 |
| Median Household Income | $50,676 | $1,524 |
| Monthly Housing Costs | $461 | $266 |
| Real Estate Taxes | $1,365 | $190 |
Property Value by Mortgage Status in Burlington
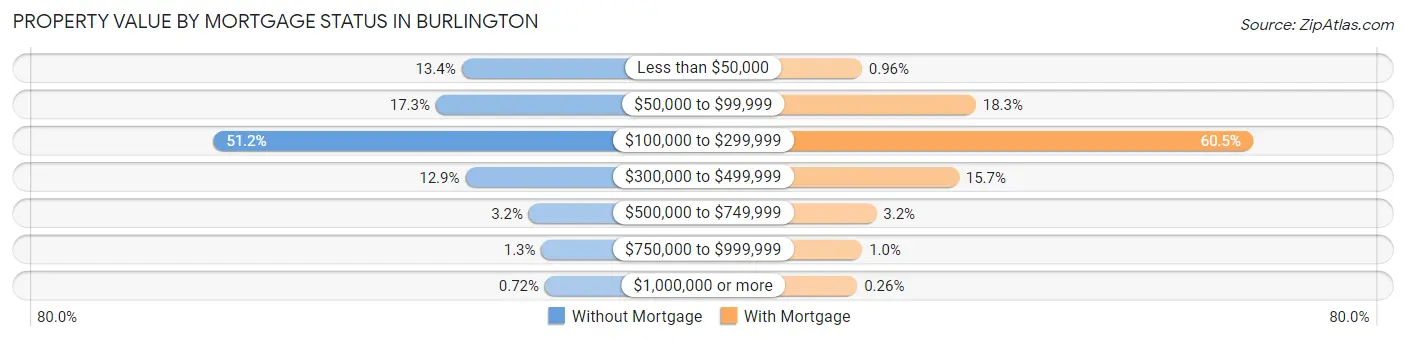
| Property Value | Without Mortgage | With Mortgage |
| Less than $50,000 | 764 (13.4%) | 73 (1.0%) |
| $50,000 to $99,999 | 986 (17.3%) | 1,387 (18.3%) |
| $100,000 to $299,999 | 2,914 (51.2%) | 4,580 (60.5%) |
| $300,000 to $499,999 | 731 (12.9%) | 1,190 (15.7%) |
| $500,000 to $749,999 | 180 (3.2%) | 240 (3.2%) |
| $750,000 to $999,999 | 71 (1.3%) | 77 (1.0%) |
| $1,000,000 or more | 41 (0.7%) | 20 (0.3%) |
| Total | 5,687 (100.0%) | 7,567 (100.0%) |
Household Income by Mortgage Status in Burlington
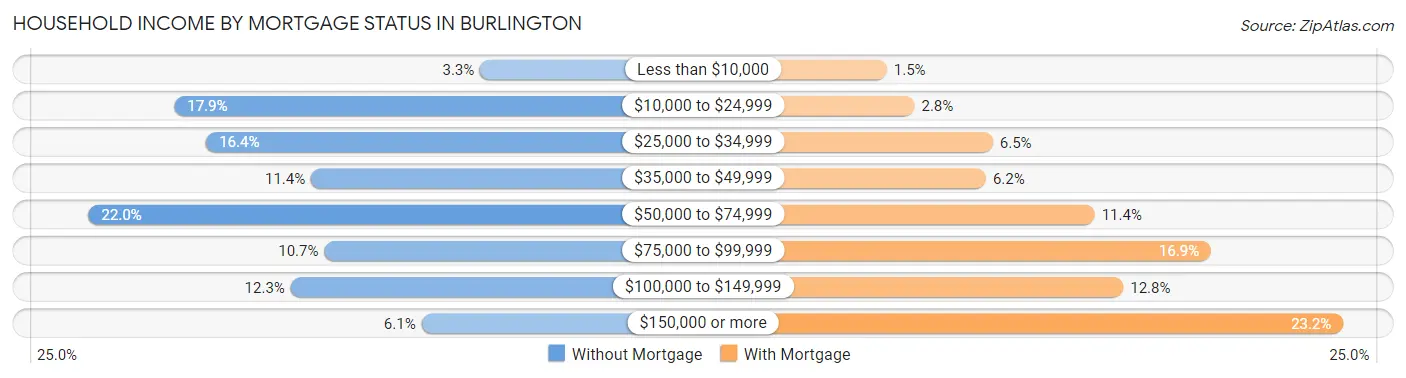
| Household Income | Without Mortgage | With Mortgage |
| Less than $10,000 | 188 (3.3%) | 113 (1.5%) |
| $10,000 to $24,999 | 1,016 (17.9%) | 213 (2.8%) |
| $25,000 to $34,999 | 930 (16.4%) | 495 (6.5%) |
| $35,000 to $49,999 | 646 (11.4%) | 470 (6.2%) |
| $50,000 to $74,999 | 1,249 (22.0%) | 862 (11.4%) |
| $75,000 to $99,999 | 610 (10.7%) | 1,281 (16.9%) |
| $100,000 to $149,999 | 701 (12.3%) | 965 (12.8%) |
| $150,000 or more | 347 (6.1%) | 1,757 (23.2%) |
| Total | 5,687 (100.0%) | 7,567 (100.0%) |
Property Value to Household Income Ratio in Burlington
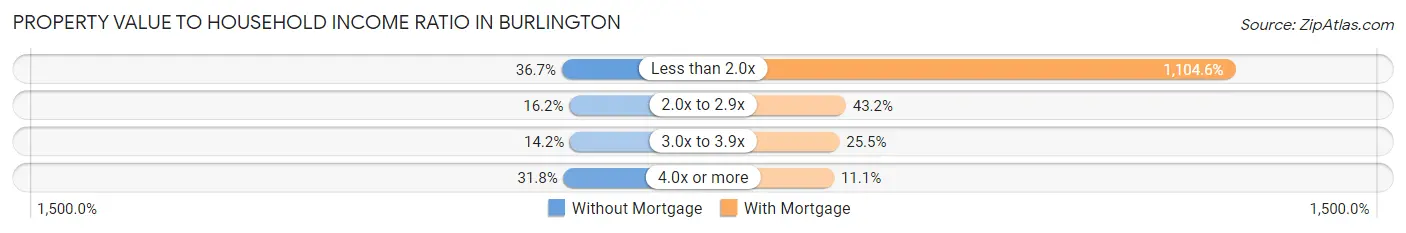
| Value-to-Income Ratio | Without Mortgage | With Mortgage |
| Less than 2.0x | 2,085 (36.7%) | 83,582 (1,104.6%) |
| 2.0x to 2.9x | 921 (16.2%) | 3,267 (43.2%) |
| 3.0x to 3.9x | 807 (14.2%) | 1,927 (25.5%) |
| 4.0x or more | 1,806 (31.8%) | 838 (11.1%) |
| Total | 5,687 (100.0%) | 7,567 (100.0%) |
Real Estate Taxes by Mortgage Status in Burlington
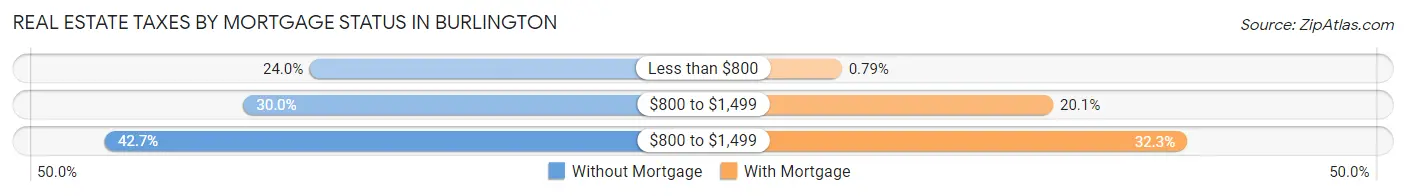
| Property Taxes | Without Mortgage | With Mortgage |
| Less than $800 | 1,366 (24.0%) | 60 (0.8%) |
| $800 to $1,499 | 1,707 (30.0%) | 1,520 (20.1%) |
| $800 to $1,499 | 2,426 (42.7%) | 2,446 (32.3%) |
| Total | 5,687 (100.0%) | 7,567 (100.0%) |
Health & Disability in Burlington
Health Insurance Coverage by Age in Burlington
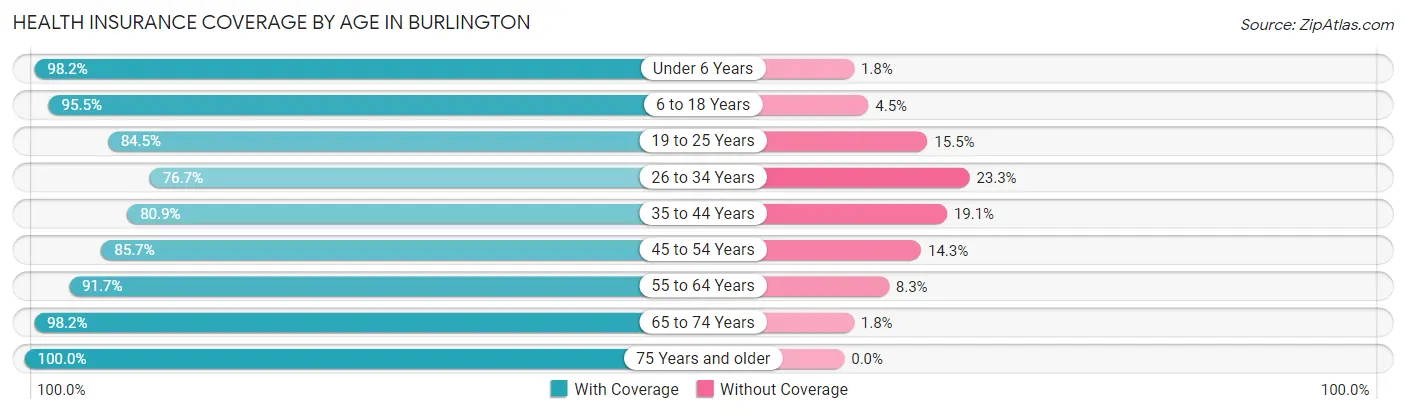
| Age Bracket | With Coverage | Without Coverage |
| Under 6 Years | 3,681 (98.2%) | 68 (1.8%) |
| 6 to 18 Years | 9,981 (95.5%) | 469 (4.5%) |
| 19 to 25 Years | 3,652 (84.5%) | 670 (15.5%) |
| 26 to 34 Years | 5,310 (76.7%) | 1,617 (23.3%) |
| 35 to 44 Years | 5,402 (80.9%) | 1,279 (19.1%) |
| 45 to 54 Years | 6,305 (85.7%) | 1,054 (14.3%) |
| 55 to 64 Years | 6,577 (91.7%) | 596 (8.3%) |
| 65 to 74 Years | 5,472 (98.2%) | 99 (1.8%) |
| 75 Years and older | 4,241 (100.0%) | 0 (0.0%) |
| Total | 50,621 (89.6%) | 5,852 (10.4%) |
Health Insurance Coverage by Citizenship Status in Burlington
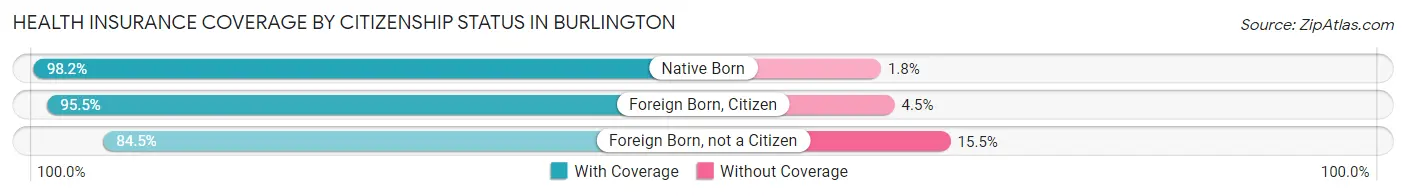
| Citizenship Status | With Coverage | Without Coverage |
| Native Born | 3,681 (98.2%) | 68 (1.8%) |
| Foreign Born, Citizen | 9,981 (95.5%) | 469 (4.5%) |
| Foreign Born, not a Citizen | 3,652 (84.5%) | 670 (15.5%) |
Health Insurance Coverage by Household Income in Burlington
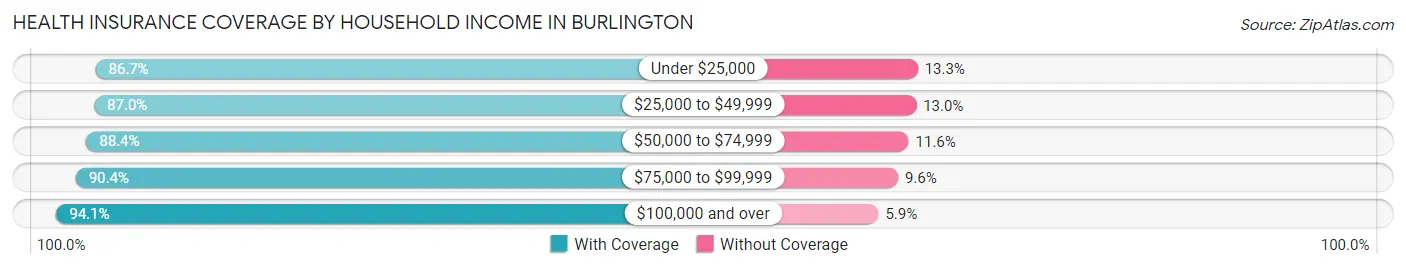
| Household Income | With Coverage | Without Coverage |
| Under $25,000 | 8,410 (86.7%) | 1,288 (13.3%) |
| $25,000 to $49,999 | 11,107 (87.0%) | 1,660 (13.0%) |
| $50,000 to $74,999 | 9,196 (88.4%) | 1,204 (11.6%) |
| $75,000 to $99,999 | 6,029 (90.4%) | 639 (9.6%) |
| $100,000 and over | 15,590 (94.1%) | 984 (5.9%) |
Public vs Private Health Insurance Coverage by Age in Burlington
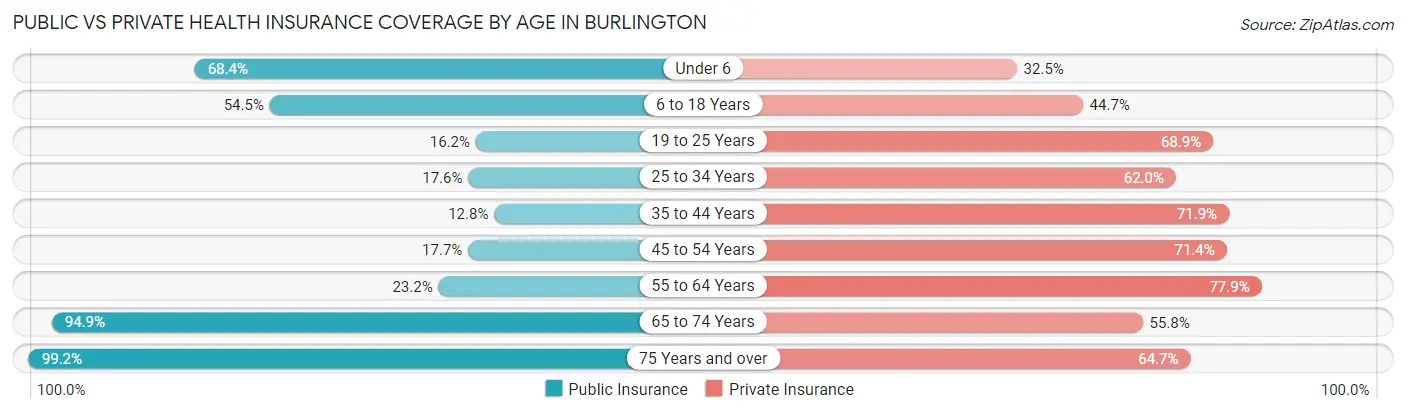
| Age Bracket | Public Insurance | Private Insurance |
| Under 6 | 2,565 (68.4%) | 1,217 (32.5%) |
| 6 to 18 Years | 5,695 (54.5%) | 4,672 (44.7%) |
| 19 to 25 Years | 702 (16.2%) | 2,978 (68.9%) |
| 25 to 34 Years | 1,222 (17.6%) | 4,294 (62.0%) |
| 35 to 44 Years | 857 (12.8%) | 4,800 (71.9%) |
| 45 to 54 Years | 1,300 (17.7%) | 5,255 (71.4%) |
| 55 to 64 Years | 1,663 (23.2%) | 5,587 (77.9%) |
| 65 to 74 Years | 5,289 (94.9%) | 3,110 (55.8%) |
| 75 Years and over | 4,207 (99.2%) | 2,743 (64.7%) |
| Total | 23,500 (41.6%) | 34,656 (61.4%) |
Disability Status by Sex by Age in Burlington
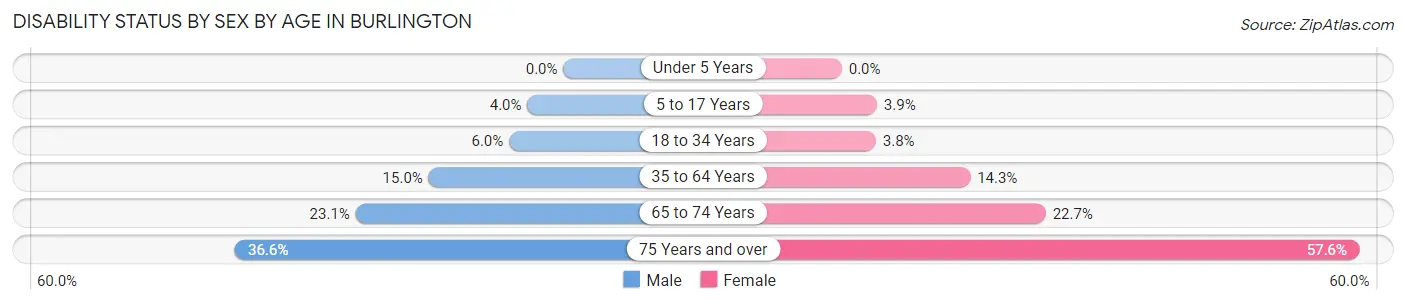
| Age Bracket | Male | Female |
| Under 5 Years | 0 (0.0%) | 0 (0.0%) |
| 5 to 17 Years | 234 (4.0%) | 162 (3.9%) |
| 18 to 34 Years | 372 (6.0%) | 229 (3.8%) |
| 35 to 64 Years | 1,458 (15.0%) | 1,643 (14.3%) |
| 65 to 74 Years | 545 (23.1%) | 730 (22.7%) |
| 75 Years and over | 562 (36.6%) | 1,557 (57.6%) |
Disability Class by Sex by Age in Burlington
Disability Class: Hearing Difficulty
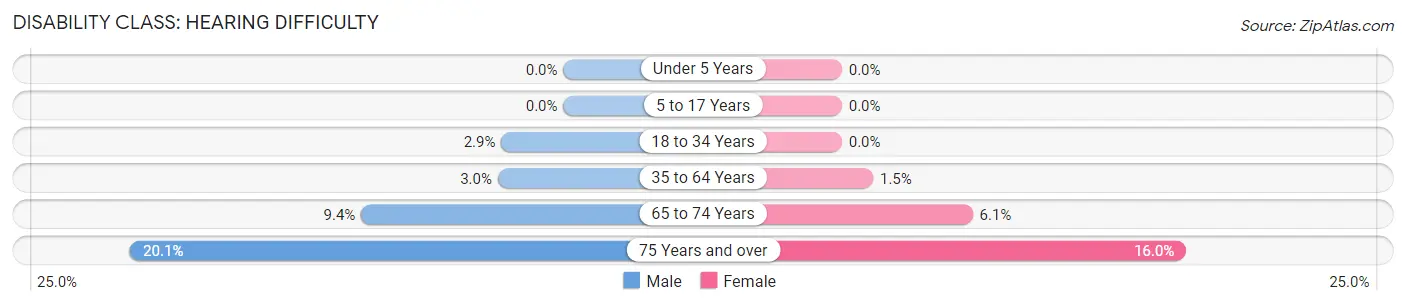
| Age Bracket | Male | Female |
| Under 5 Years | 0 (0.0%) | 0 (0.0%) |
| 5 to 17 Years | 0 (0.0%) | 0 (0.0%) |
| 18 to 34 Years | 177 (2.9%) | 0 (0.0%) |
| 35 to 64 Years | 296 (3.0%) | 167 (1.5%) |
| 65 to 74 Years | 221 (9.4%) | 195 (6.1%) |
| 75 Years and over | 309 (20.1%) | 432 (16.0%) |
Disability Class: Vision Difficulty
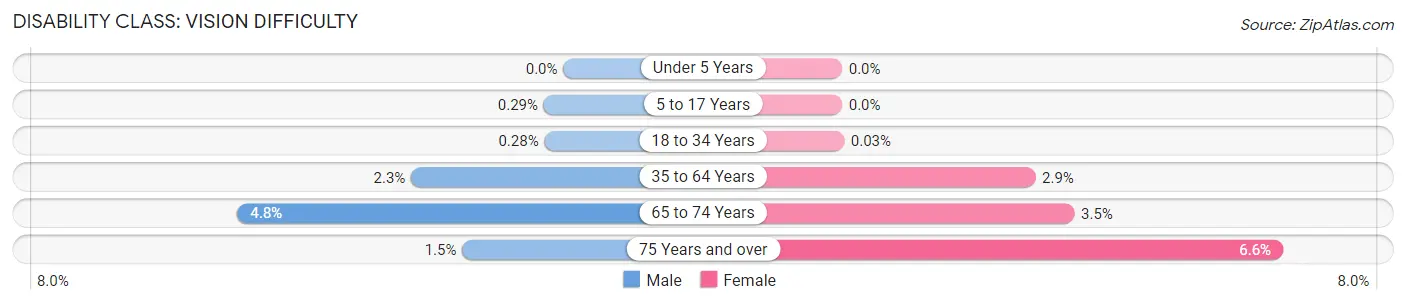
| Age Bracket | Male | Female |
| Under 5 Years | 0 (0.0%) | 0 (0.0%) |
| 5 to 17 Years | 17 (0.3%) | 0 (0.0%) |
| 18 to 34 Years | 17 (0.3%) | 2 (0.0%) |
| 35 to 64 Years | 220 (2.3%) | 330 (2.9%) |
| 65 to 74 Years | 114 (4.8%) | 111 (3.5%) |
| 75 Years and over | 23 (1.5%) | 177 (6.6%) |
Disability Class: Cognitive Difficulty
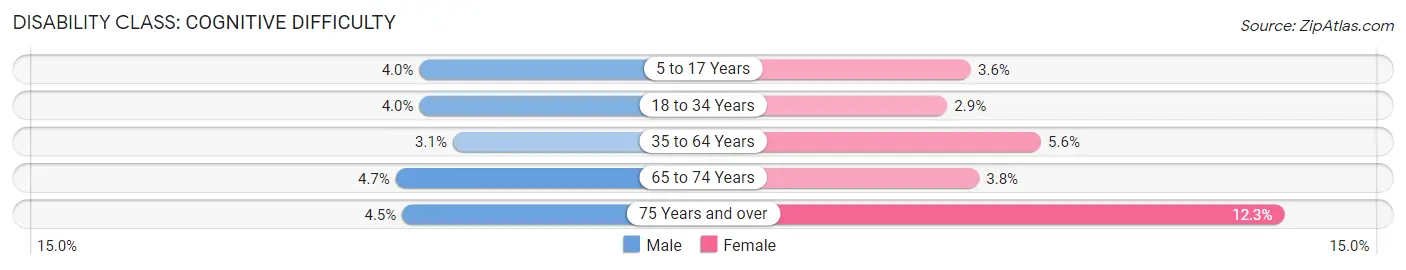
| Age Bracket | Male | Female |
| 5 to 17 Years | 234 (4.0%) | 149 (3.6%) |
| 18 to 34 Years | 247 (4.0%) | 178 (2.9%) |
| 35 to 64 Years | 299 (3.1%) | 638 (5.6%) |
| 65 to 74 Years | 110 (4.7%) | 123 (3.8%) |
| 75 Years and over | 69 (4.5%) | 333 (12.3%) |
Disability Class: Ambulatory Difficulty
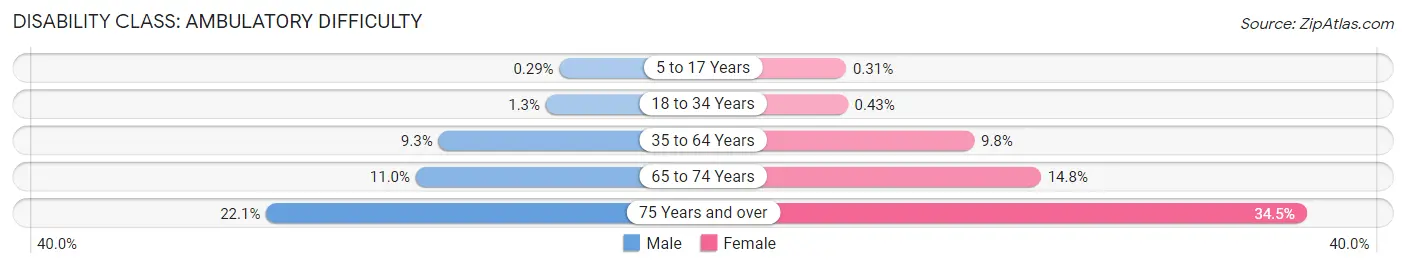
| Age Bracket | Male | Female |
| 5 to 17 Years | 17 (0.3%) | 13 (0.3%) |
| 18 to 34 Years | 80 (1.3%) | 26 (0.4%) |
| 35 to 64 Years | 901 (9.3%) | 1,128 (9.8%) |
| 65 to 74 Years | 258 (11.0%) | 475 (14.8%) |
| 75 Years and over | 339 (22.1%) | 933 (34.5%) |
Disability Class: Self-Care Difficulty
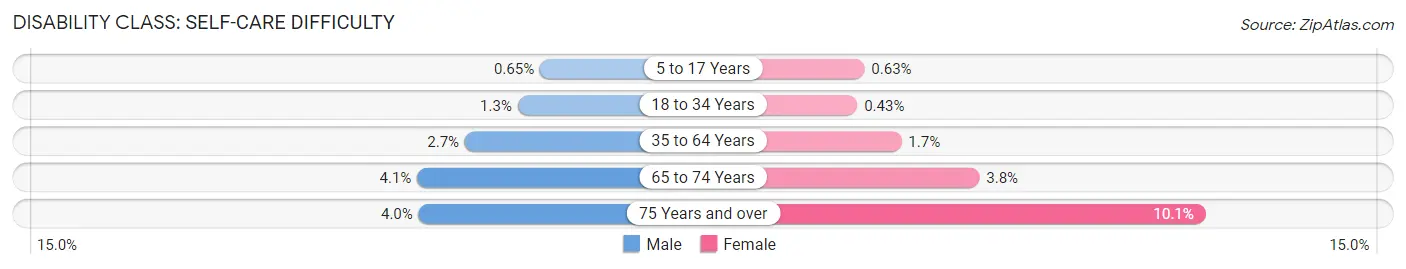
| Age Bracket | Male | Female |
| 5 to 17 Years | 38 (0.6%) | 26 (0.6%) |
| 18 to 34 Years | 78 (1.3%) | 26 (0.4%) |
| 35 to 64 Years | 266 (2.7%) | 191 (1.7%) |
| 65 to 74 Years | 96 (4.1%) | 123 (3.8%) |
| 75 Years and over | 62 (4.0%) | 274 (10.1%) |
Technology Access in Burlington
Computing Device Access in Burlington
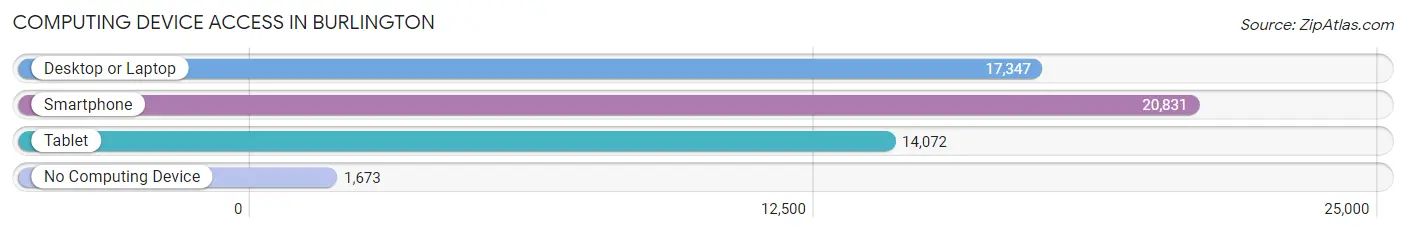
| Device Type | # Households | % Households |
| Desktop or Laptop | 17,347 | 72.6% |
| Smartphone | 20,831 | 87.2% |
| Tablet | 14,072 | 58.9% |
| No Computing Device | 1,673 | 7.0% |
| Total | 23,883 | 100.0% |
Internet Access in Burlington
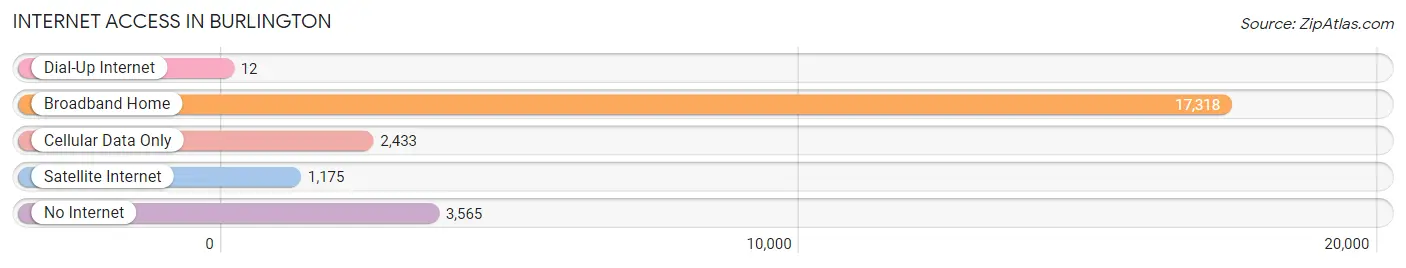
| Internet Type | # Households | % Households |
| Dial-Up Internet | 12 | 0.1% |
| Broadband Home | 17,318 | 72.5% |
| Cellular Data Only | 2,433 | 10.2% |
| Satellite Internet | 1,175 | 4.9% |
| No Internet | 3,565 | 14.9% |
| Total | 23,883 | 100.0% |
Burlington Summary
Burlington, North Carolina is a city located in Alamance County in the state of North Carolina. It is the principal city of the Burlington Metropolitan Statistical Area, which encompasses all of Alamance County. The city is situated in the heart of the Piedmont Triad region of North Carolina, which is composed of the cities of Greensboro, Winston-Salem, and High Point. The city is located approximately 50 miles west of Raleigh, the state capital, and approximately 100 miles east of Charlotte.
History
The area that is now Burlington was first settled in 1740 by William Blacknall, a Quaker from Pennsylvania. The city was officially incorporated in 1866 and was named after the town of Burlington in England. The city was a major center of the textile industry in the late 19th and early 20th centuries, and was home to several large mills. The city was also the site of the first cotton mill in North Carolina, which was built in 1837.
Geography
Burlington is located in the Piedmont region of North Carolina, which is characterized by rolling hills and flat plains. The city is situated at the intersection of Interstate 85 and Interstate 40, and is approximately 50 miles west of Raleigh and 100 miles east of Charlotte. The city is located in the center of Alamance County, and is bordered by the cities of Graham, Mebane, and Elon. The city has a total area of 16.3 square miles, of which 16.2 square miles is land and 0.1 square miles is water.
Economy
Burlington is a major center of the textile industry in North Carolina, and is home to several large mills. The city is also home to several large employers, including LabCorp, Honda Aircraft Company, and the Burlington Industries. The city is also home to several educational institutions, including Elon University, Alamance Community College, and the University of North Carolina at Greensboro.
Demographics
As of the 2010 census, the population of Burlington was 50,042, making it the 17th largest city in North Carolina. The city has a population density of 3,072 people per square mile. The racial makeup of the city is 73.3% White, 17.2% African American, 0.5% Native American, 2.2% Asian, 0.1% Pacific Islander, 4.2% from other races, and 2.5% from two or more races. The median household income in the city is $41,945, and the median family income is $50,945. The per capita income in the city is $21,845. The city has a poverty rate of 17.3%.
Common Questions
What is Per Capita Income in Burlington?
Per Capita income in Burlington is $31,497.
What is the Median Family Income in Burlington?
Median Family Income in Burlington is $65,796.
What is the Median Household income in Burlington?
Median Household Income in Burlington is $52,963.
What is Income or Wage Gap in Burlington?
Income or Wage Gap in Burlington is 16.4%.
Women in Burlington earn 83.6 cents for every dollar earned by a man.
What is Family Income Deficit in Burlington?
Family Income Deficit in Burlington is $8,858.
Families that are below poverty line in Burlington earn $8,858 less on average than the poverty threshold level.
What is Inequality or Gini Index in Burlington?
Inequality or Gini Index in Burlington is 0.46.
What is the Total Population of Burlington?
Total Population of Burlington is 56,951.
What is the Total Male Population of Burlington?
Total Male Population of Burlington is 27,462.
What is the Total Female Population of Burlington?
Total Female Population of Burlington is 29,489.
What is the Ratio of Males per 100 Females in Burlington?
There are 93.13 Males per 100 Females in Burlington.
What is the Ratio of Females per 100 Males in Burlington?
There are 107.38 Females per 100 Males in Burlington.
What is the Median Population Age in Burlington?
Median Population Age in Burlington is 39.9 Years.
What is the Average Family Size in Burlington
Average Family Size in Burlington is 3.1 People.
What is the Average Household Size in Burlington
Average Household Size in Burlington is 2.4 People.
How Large is the Labor Force in Burlington?
There are 28,651 People in the Labor Forcein in Burlington.
What is the Percentage of People in the Labor Force in Burlington?
63.8% of People are in the Labor Force in Burlington.
What is the Unemployment Rate in Burlington?
Unemployment Rate in Burlington is 5.7%.