Etowah, NC Map & Demographics
Etowah Map
Etowah Overview
$38,815
PER CAPITA INCOME
$88,397
AVG FAMILY INCOME
$76,071
AVG HOUSEHOLD INCOME
20.6%
WAGE / INCOME GAP [ % ]
79.4¢/ $1
WAGE / INCOME GAP [ $ ]
0.42
INEQUALITY / GINI INDEX
7,689
TOTAL POPULATION
4,002
MALE POPULATION
3,687
FEMALE POPULATION
108.54
MALES / 100 FEMALES
92.13
FEMALES / 100 MALES
48.3
MEDIAN AGE
2.6
AVG FAMILY SIZE
2.4
AVG HOUSEHOLD SIZE
3,623
LABOR FORCE [ PEOPLE ]
55.3%
PERCENT IN LABOR FORCE
1.0%
UNEMPLOYMENT RATE
Etowah Zip Codes
Etowah Area Codes
Income in Etowah
Income Overview in Etowah
Per Capita Income in Etowah is $38,815, while median incomes of families and households are $88,397 and $76,071 respectively.
| Characteristic | Number | Measure |
| Per Capita Income | 7,689 | $38,815 |
| Median Family Income | 2,410 | $88,397 |
| Mean Family Income | 2,410 | $102,695 |
| Median Household Income | 3,220 | $76,071 |
| Mean Household Income | 3,220 | $94,354 |
| Income Deficit | 2,410 | $0 |
| Wage / Income Gap (%) | 7,689 | 20.62% |
| Wage / Income Gap ($) | 7,689 | 79.38¢ per $1 |
| Gini / Inequality Index | 7,689 | 0.42 |
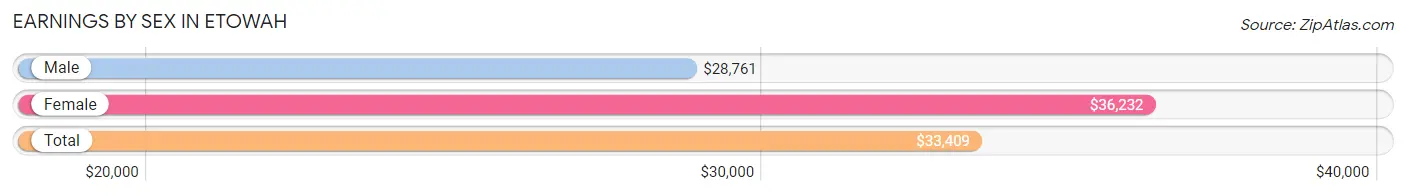
Earnings by Sex in Etowah
Average Earnings in Etowah are $33,409, $28,761 for men and $36,232 for women, a difference of 20.6%.
| Sex | Number | Average Earnings |
| Male | 2,056 (52.5%) | $28,761 |
| Female | 1,860 (47.5%) | $36,232 |
| Total | 3,916 (100.0%) | $33,409 |
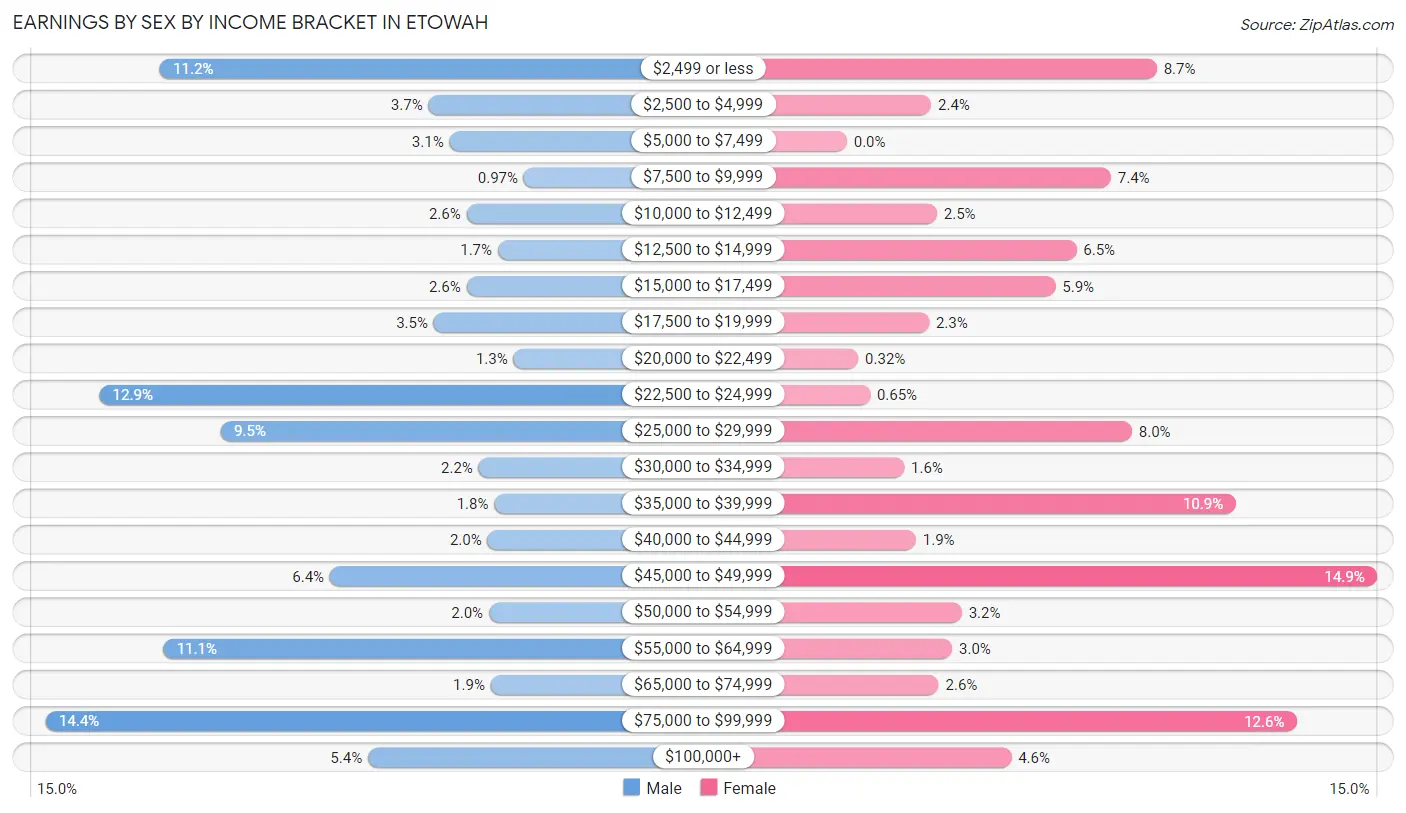
Earnings by Sex by Income Bracket in Etowah
The most common earnings brackets in Etowah are $75,000 to $99,999 for men (296 | 14.4%) and $45,000 to $49,999 for women (277 | 14.9%).
| Income | Male | Female |
| $2,499 or less | 230 (11.2%) | 162 (8.7%) |
| $2,500 to $4,999 | 75 (3.6%) | 44 (2.4%) |
| $5,000 to $7,499 | 63 (3.1%) | 0 (0.0%) |
| $7,500 to $9,999 | 20 (1.0%) | 138 (7.4%) |
| $10,000 to $12,499 | 53 (2.6%) | 47 (2.5%) |
| $12,500 to $14,999 | 35 (1.7%) | 120 (6.5%) |
| $15,000 to $17,499 | 53 (2.6%) | 109 (5.9%) |
| $17,500 to $19,999 | 72 (3.5%) | 43 (2.3%) |
| $20,000 to $22,499 | 26 (1.3%) | 6 (0.3%) |
| $22,500 to $24,999 | 265 (12.9%) | 12 (0.6%) |
| $25,000 to $29,999 | 195 (9.5%) | 149 (8.0%) |
| $30,000 to $34,999 | 46 (2.2%) | 30 (1.6%) |
| $35,000 to $39,999 | 37 (1.8%) | 203 (10.9%) |
| $40,000 to $44,999 | 41 (2.0%) | 36 (1.9%) |
| $45,000 to $49,999 | 132 (6.4%) | 277 (14.9%) |
| $50,000 to $54,999 | 40 (1.9%) | 60 (3.2%) |
| $55,000 to $64,999 | 228 (11.1%) | 55 (3.0%) |
| $65,000 to $74,999 | 39 (1.9%) | 48 (2.6%) |
| $75,000 to $99,999 | 296 (14.4%) | 235 (12.6%) |
| $100,000+ | 110 (5.3%) | 86 (4.6%) |
| Total | 2,056 (100.0%) | 1,860 (100.0%) |
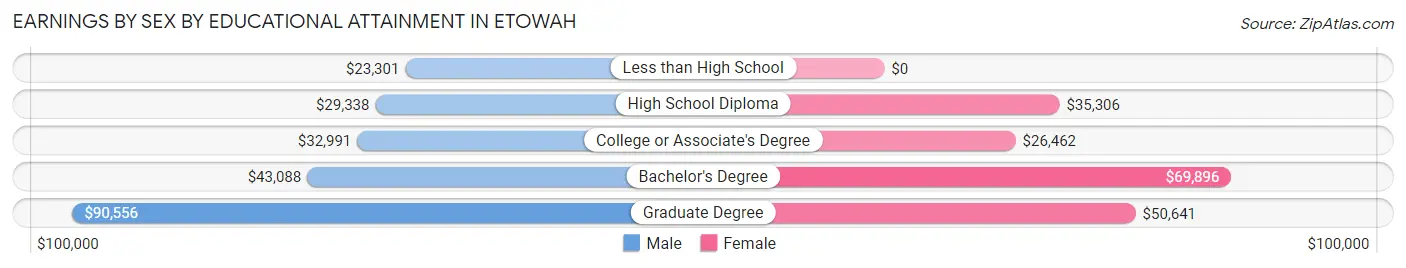
Earnings by Sex by Educational Attainment in Etowah
Average earnings in Etowah are $31,389 for men and $38,012 for women, a difference of 17.4%. Men with an educational attainment of graduate degree enjoy the highest average annual earnings of $90,556, while those with less than high school education earn the least with $23,301. Women with an educational attainment of bachelor's degree earn the most with the average annual earnings of $69,896, while those with college or associate's degree education have the smallest earnings of $26,462.
| Educational Attainment | Male Income | Female Income |
| Less than High School | $23,301 | $0 |
| High School Diploma | $29,338 | $35,306 |
| College or Associate's Degree | $32,991 | $26,462 |
| Bachelor's Degree | $43,088 | $69,896 |
| Graduate Degree | $90,556 | $50,641 |
| Total | $31,389 | $38,012 |
Family Income in Etowah
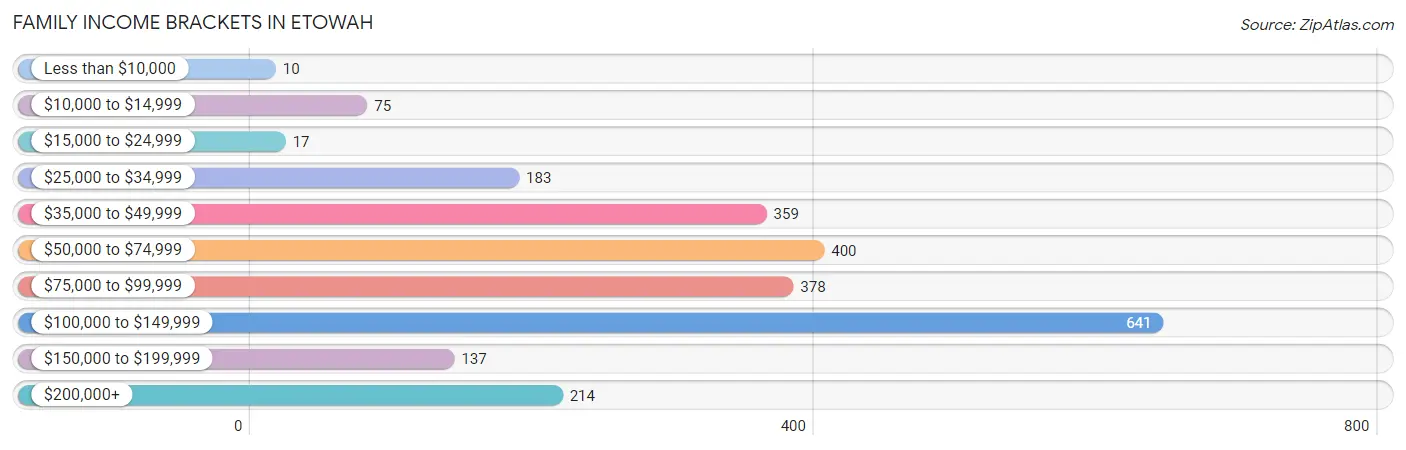
Family Income Brackets in Etowah
According to the Etowah family income data, there are 641 families falling into the $100,000 to $149,999 income range, which is the most common income bracket and makes up 26.6% of all families. Conversely, the less than $10,000 income bracket is the least frequent group with only 10 families (0.4%) belonging to this category.
| Income Bracket | # Families | % Families |
| Less than $10,000 | 10 | 0.4% |
| $10,000 to $14,999 | 75 | 3.1% |
| $15,000 to $24,999 | 17 | 0.7% |
| $25,000 to $34,999 | 183 | 7.6% |
| $35,000 to $49,999 | 359 | 14.9% |
| $50,000 to $74,999 | 400 | 16.6% |
| $75,000 to $99,999 | 378 | 15.7% |
| $100,000 to $149,999 | 641 | 26.6% |
| $150,000 to $199,999 | 137 | 5.7% |
| $200,000+ | 214 | 8.9% |
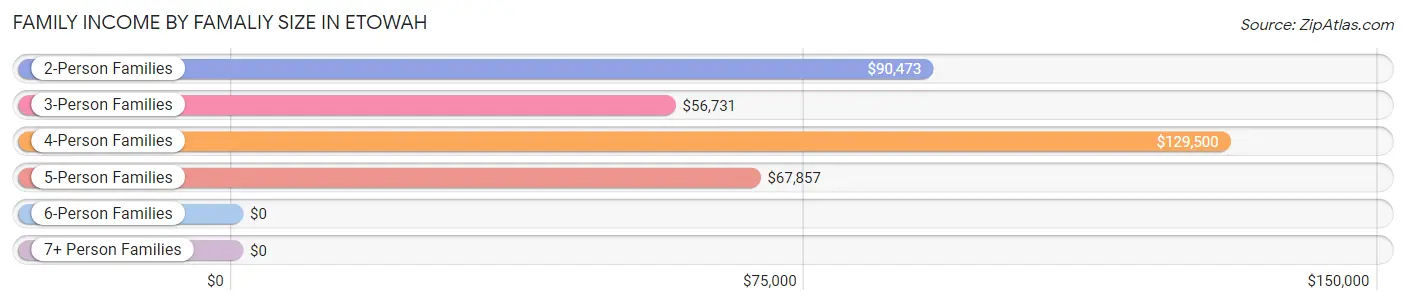
Family Income by Famaliy Size in Etowah
4-person families (466 | 19.3%) account for the highest median family income in Etowah with $129,500 per family, while 2-person families (1,619 | 67.2%) have the highest median income of $45,236 per family member.
| Income Bracket | # Families | Median Income |
| 2-Person Families | 1,619 (67.2%) | $90,473 |
| 3-Person Families | 196 (8.1%) | $56,731 |
| 4-Person Families | 466 (19.3%) | $129,500 |
| 5-Person Families | 98 (4.1%) | $67,857 |
| 6-Person Families | 31 (1.3%) | $0 |
| 7+ Person Families | 0 (0.0%) | $0 |
| Total | 2,410 (100.0%) | $88,397 |
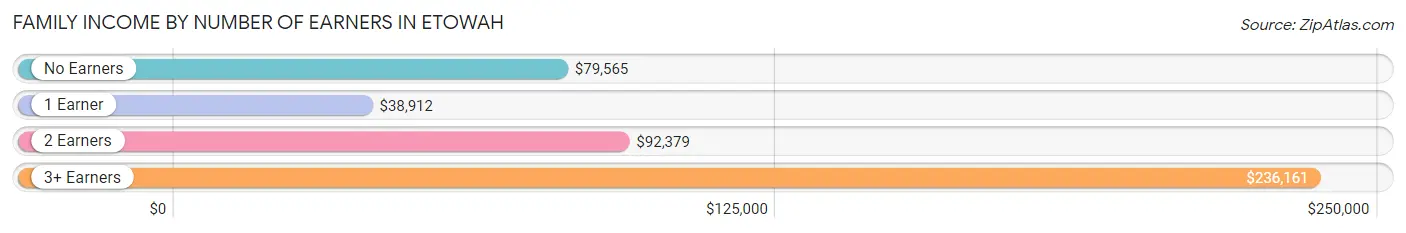
Family Income by Number of Earners in Etowah
The median family income in Etowah is $88,397, with families comprising 3+ earners (170) having the highest median family income of $236,161, while families with 1 earner (663) have the lowest median family income of $38,912, accounting for 7.0% and 27.5% of families, respectively.
| Number of Earners | # Families | Median Income |
| No Earners | 616 (25.6%) | $79,565 |
| 1 Earner | 663 (27.5%) | $38,912 |
| 2 Earners | 961 (39.9%) | $92,379 |
| 3+ Earners | 170 (7.0%) | $236,161 |
| Total | 2,410 (100.0%) | $88,397 |
Household Income in Etowah
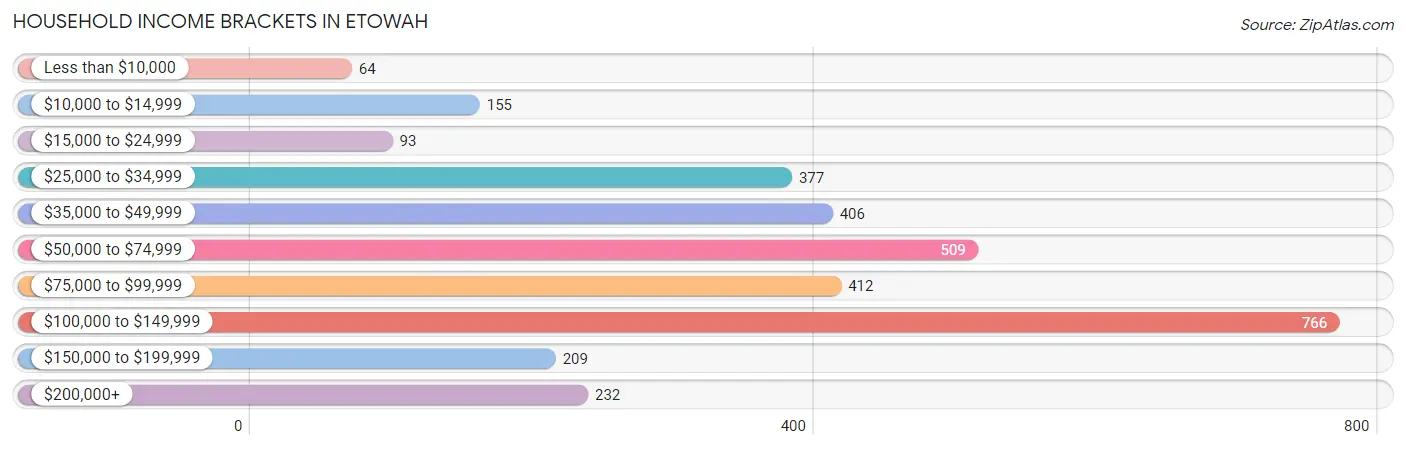
Household Income Brackets in Etowah
With 766 households falling in the category, the $100,000 to $149,999 income range is the most frequent in Etowah, accounting for 23.8% of all households. In contrast, only 64 households (2.0%) fall into the less than $10,000 income bracket, making it the least populous group.
| Income Bracket | # Households | % Households |
| Less than $10,000 | 64 | 2.0% |
| $10,000 to $14,999 | 155 | 4.8% |
| $15,000 to $24,999 | 93 | 2.9% |
| $25,000 to $34,999 | 377 | 11.7% |
| $35,000 to $49,999 | 406 | 12.6% |
| $50,000 to $74,999 | 509 | 15.8% |
| $75,000 to $99,999 | 412 | 12.8% |
| $100,000 to $149,999 | 766 | 23.8% |
| $150,000 to $199,999 | 209 | 6.5% |
| $200,000+ | 232 | 7.2% |
Household Income by Householder Age in Etowah
The median household income in Etowah is $76,071, with the highest median household income of $89,808 found in the 65+ years age bracket for the primary householder. A total of 1,442 households (44.8%) fall into this category. Meanwhile, the 15 to 24 years age bracket for the primary householder has the lowest median household income of $53,393, with 55 households (1.7%) in this group.
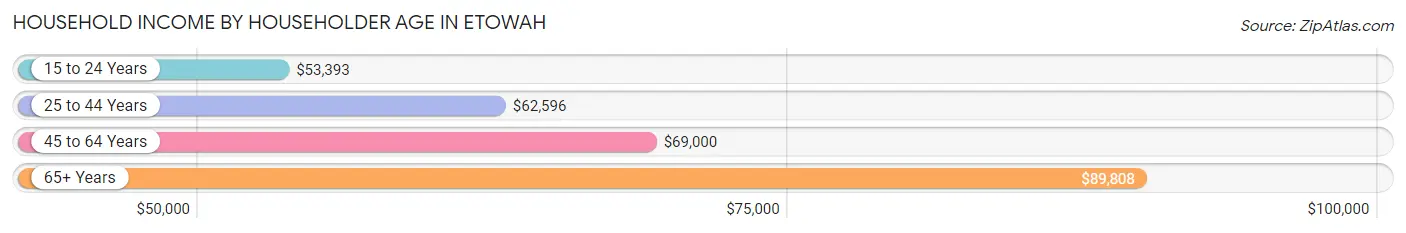
| Income Bracket | # Households | Median Income |
| 15 to 24 Years | 55 (1.7%) | $53,393 |
| 25 to 44 Years | 781 (24.2%) | $62,596 |
| 45 to 64 Years | 942 (29.2%) | $69,000 |
| 65+ Years | 1,442 (44.8%) | $89,808 |
| Total | 3,220 (100.0%) | $76,071 |
Poverty in Etowah
Income Below Poverty by Sex and Age in Etowah
With 11.2% poverty level for males and 6.3% for females among the residents of Etowah, 5 year old males and 45 to 54 year old females are the most vulnerable to poverty, with 9 males (100.0%) and 75 females (22.1%) in their respective age groups living below the poverty level.
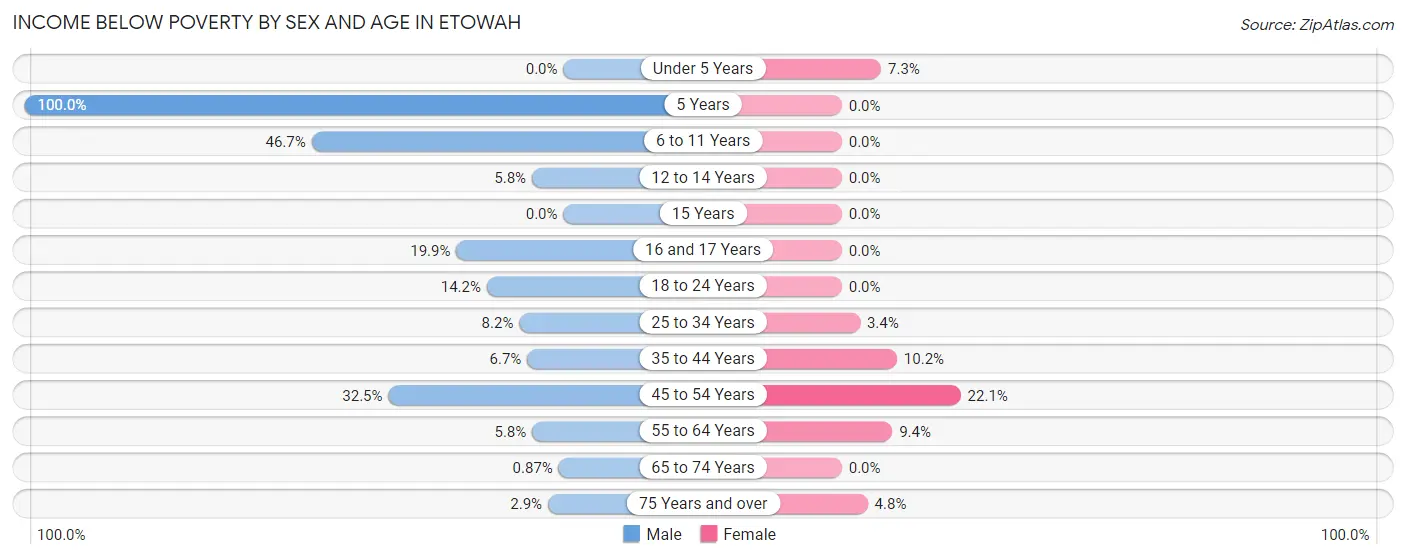
| Age Bracket | Male | Female |
| Under 5 Years | 0 (0.0%) | 20 (7.3%) |
| 5 Years | 9 (100.0%) | 0 (0.0%) |
| 6 to 11 Years | 100 (46.7%) | 0 (0.0%) |
| 12 to 14 Years | 9 (5.8%) | 0 (0.0%) |
| 15 Years | 0 (0.0%) | 0 (0.0%) |
| 16 and 17 Years | 31 (19.9%) | 0 (0.0%) |
| 18 to 24 Years | 27 (14.2%) | 0 (0.0%) |
| 25 to 34 Years | 38 (8.2%) | 17 (3.4%) |
| 35 to 44 Years | 33 (6.7%) | 35 (10.2%) |
| 45 to 54 Years | 153 (32.5%) | 75 (22.1%) |
| 55 to 64 Years | 29 (5.8%) | 67 (9.4%) |
| 65 to 74 Years | 6 (0.9%) | 0 (0.0%) |
| 75 Years and over | 13 (2.9%) | 19 (4.8%) |
| Total | 448 (11.2%) | 233 (6.3%) |
Income Above Poverty by Sex and Age in Etowah
According to the poverty statistics in Etowah, males aged under 5 years and females aged 5 years are the age groups that are most secure financially, with 100.0% of males and 100.0% of females in these age groups living above the poverty line.
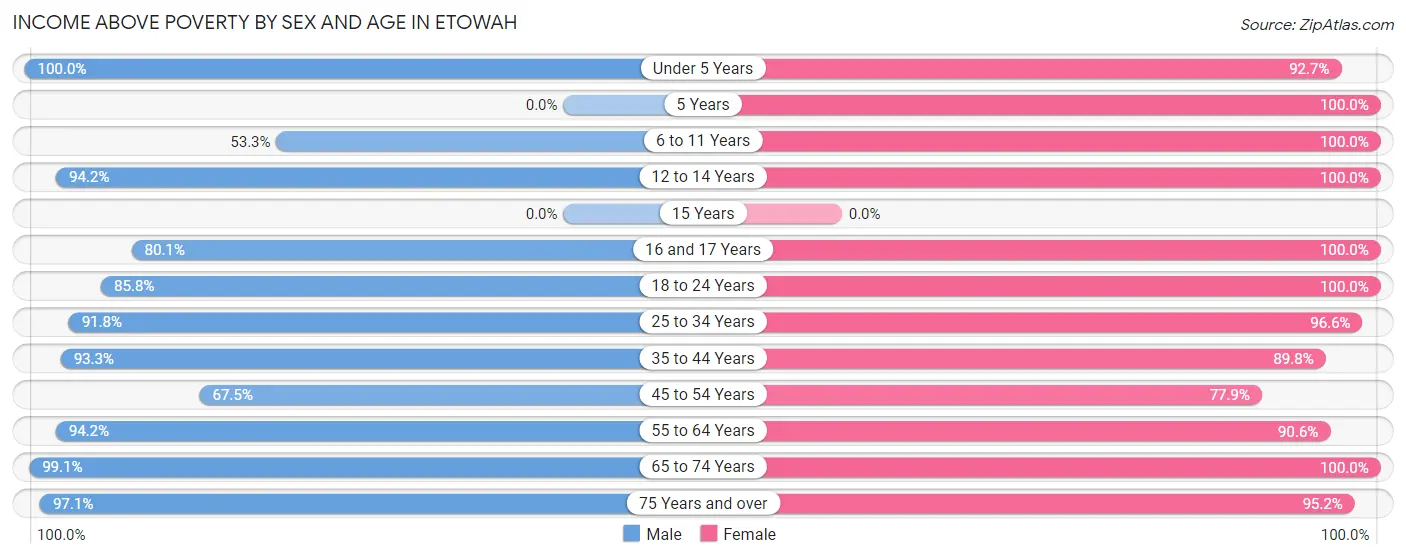
| Age Bracket | Male | Female |
| Under 5 Years | 210 (100.0%) | 254 (92.7%) |
| 5 Years | 0 (0.0%) | 73 (100.0%) |
| 6 to 11 Years | 114 (53.3%) | 97 (100.0%) |
| 12 to 14 Years | 145 (94.2%) | 106 (100.0%) |
| 15 Years | 0 (0.0%) | 0 (0.0%) |
| 16 and 17 Years | 125 (80.1%) | 7 (100.0%) |
| 18 to 24 Years | 163 (85.8%) | 228 (100.0%) |
| 25 to 34 Years | 426 (91.8%) | 487 (96.6%) |
| 35 to 44 Years | 459 (93.3%) | 307 (89.8%) |
| 45 to 54 Years | 318 (67.5%) | 265 (77.9%) |
| 55 to 64 Years | 471 (94.2%) | 649 (90.6%) |
| 65 to 74 Years | 682 (99.1%) | 604 (100.0%) |
| 75 Years and over | 441 (97.1%) | 377 (95.2%) |
| Total | 3,554 (88.8%) | 3,454 (93.7%) |
Income Below Poverty Among Married-Couple Families in Etowah
The poverty statistics for married-couple families in Etowah show that 2.5% or 50 of the total 2,044 families live below the poverty line. Families with 3 or 4 children have the highest poverty rate of 36.3%, comprising of 33 families. On the other hand, families with no children have the lowest poverty rate of 0.5%, which includes 8 families.
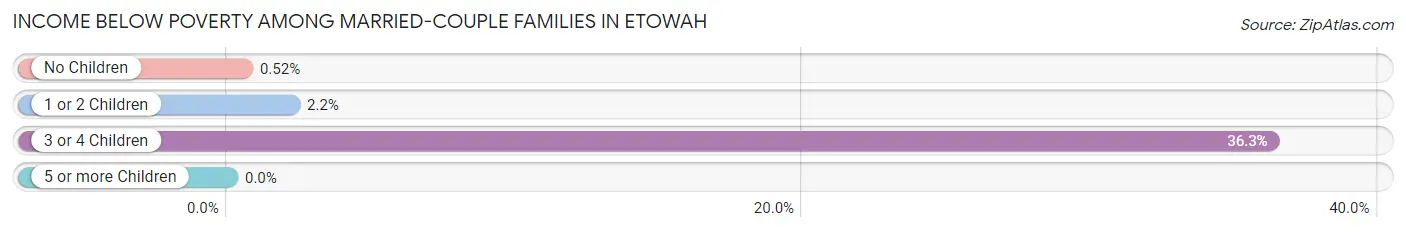
| Children | Above Poverty | Below Poverty |
| No Children | 1,529 (99.5%) | 8 (0.5%) |
| 1 or 2 Children | 407 (97.8%) | 9 (2.2%) |
| 3 or 4 Children | 58 (63.7%) | 33 (36.3%) |
| 5 or more Children | 0 (0.0%) | 0 (0.0%) |
| Total | 1,994 (97.6%) | 50 (2.5%) |
Income Below Poverty Among Single-Parent Households in Etowah
According to the poverty data in Etowah, 5.2% or 8 single-father households and 19.3% or 41 single-mother households are living below the poverty line. Among single-father households, those with 1 or 2 children have the highest poverty rate, with 8 households (100.0%) experiencing poverty. Likewise, among single-mother households, those with 1 or 2 children have the highest poverty rate, with 41 households (24.0%) falling below the poverty line.
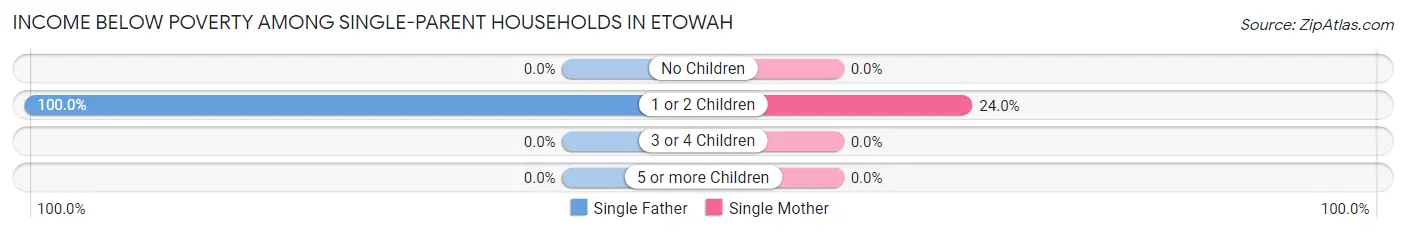
| Children | Single Father | Single Mother |
| No Children | 0 (0.0%) | 0 (0.0%) |
| 1 or 2 Children | 8 (100.0%) | 41 (24.0%) |
| 3 or 4 Children | 0 (0.0%) | 0 (0.0%) |
| 5 or more Children | 0 (0.0%) | 0 (0.0%) |
| Total | 8 (5.2%) | 41 (19.3%) |
Income Below Poverty Among Married-Couple vs Single-Parent Households in Etowah
The poverty data for Etowah shows that 50 of the married-couple family households (2.5%) and 49 of the single-parent households (13.4%) are living below the poverty level. Within the married-couple family households, those with 3 or 4 children have the highest poverty rate, with 33 households (36.3%) falling below the poverty line. Among the single-parent households, those with 1 or 2 children have the highest poverty rate, with 49 household (27.4%) living below poverty.
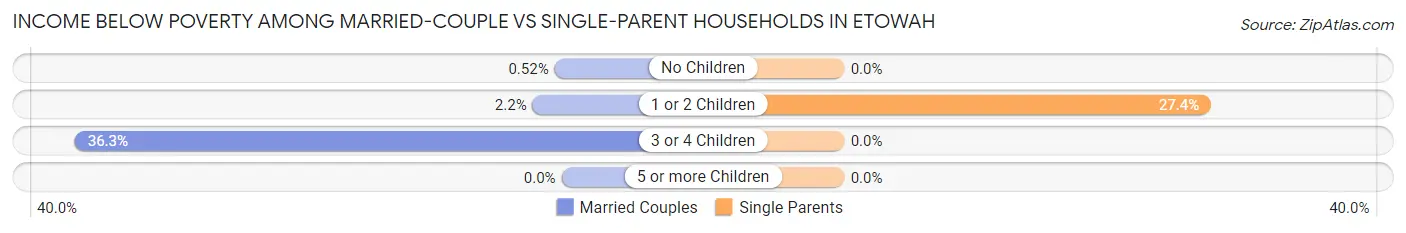
| Children | Married-Couple Families | Single-Parent Households |
| No Children | 8 (0.5%) | 0 (0.0%) |
| 1 or 2 Children | 9 (2.2%) | 49 (27.4%) |
| 3 or 4 Children | 33 (36.3%) | 0 (0.0%) |
| 5 or more Children | 0 (0.0%) | 0 (0.0%) |
| Total | 50 (2.5%) | 49 (13.4%) |
Race in Etowah
The most populous races in Etowah are White / Caucasian (6,699 | 87.1%), Hispanic or Latino (465 | 6.0%), and Two or more Races (335 | 4.4%).
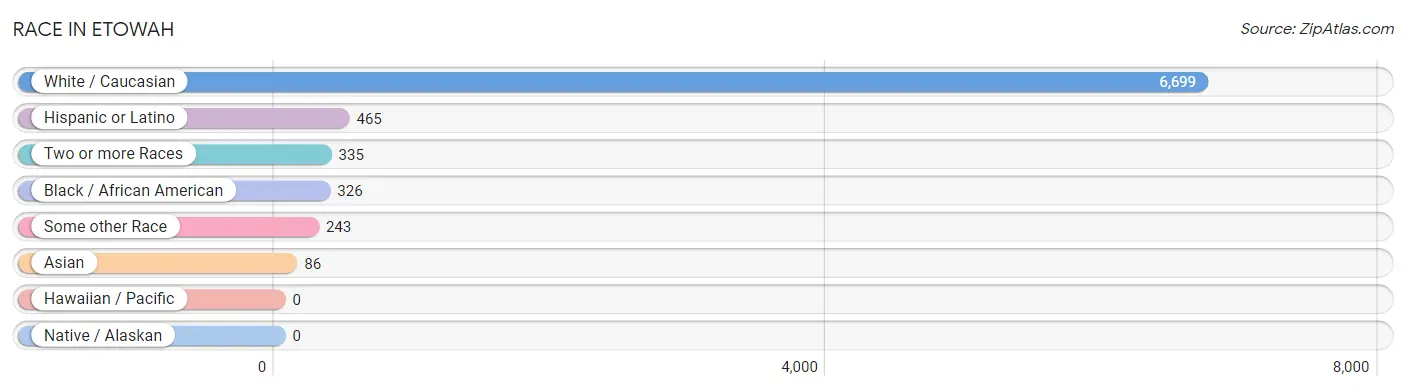
| Race | # Population | % Population |
| Asian | 86 | 1.1% |
| Black / African American | 326 | 4.2% |
| Hawaiian / Pacific | 0 | 0.0% |
| Hispanic or Latino | 465 | 6.0% |
| Native / Alaskan | 0 | 0.0% |
| White / Caucasian | 6,699 | 87.1% |
| Two or more Races | 335 | 4.4% |
| Some other Race | 243 | 3.2% |
| Total | 7,689 | 100.0% |
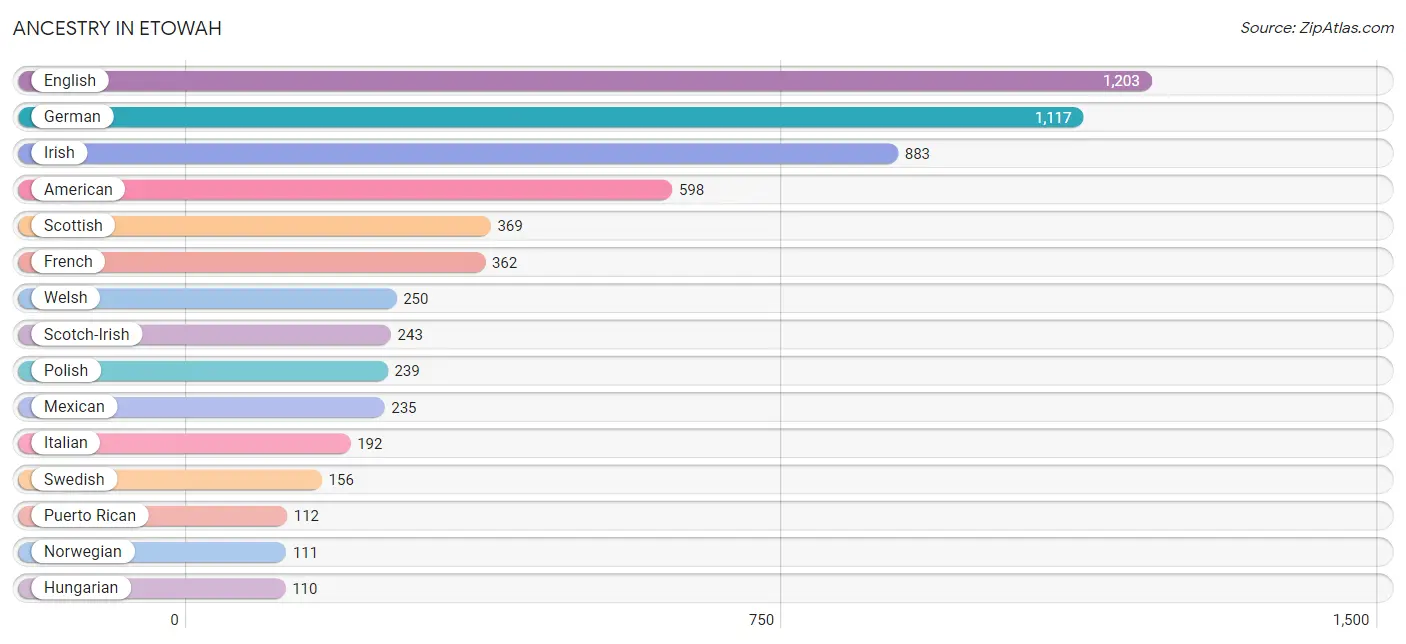
Ancestry in Etowah
The most populous ancestries reported in Etowah are English (1,203 | 15.7%), German (1,117 | 14.5%), Irish (883 | 11.5%), American (598 | 7.8%), and Scottish (369 | 4.8%), together accounting for 54.2% of all Etowah residents.
| Ancestry | # Population | % Population |
| African | 23 | 0.3% |
| Alsatian | 8 | 0.1% |
| American | 598 | 7.8% |
| Bhutanese | 2 | 0.0% |
| British | 44 | 0.6% |
| Central American | 14 | 0.2% |
| Cherokee | 105 | 1.4% |
| Chilean | 51 | 0.7% |
| Costa Rican | 14 | 0.2% |
| Cuban | 53 | 0.7% |
| Czech | 33 | 0.4% |
| Danish | 35 | 0.5% |
| Dutch | 24 | 0.3% |
| English | 1,203 | 15.7% |
| European | 105 | 1.4% |
| Finnish | 37 | 0.5% |
| French | 362 | 4.7% |
| French Canadian | 20 | 0.3% |
| German | 1,117 | 14.5% |
| Hungarian | 110 | 1.4% |
| Indian (Asian) | 62 | 0.8% |
| Iranian | 12 | 0.2% |
| Irish | 883 | 11.5% |
| Italian | 192 | 2.5% |
| Japanese | 22 | 0.3% |
| Luxembourger | 2 | 0.0% |
| Mexican | 235 | 3.1% |
| Northern European | 13 | 0.2% |
| Norwegian | 111 | 1.4% |
| Polish | 239 | 3.1% |
| Portuguese | 8 | 0.1% |
| Puerto Rican | 112 | 1.5% |
| Russian | 24 | 0.3% |
| Scandinavian | 8 | 0.1% |
| Scotch-Irish | 243 | 3.2% |
| Scottish | 369 | 4.8% |
| Slovak | 9 | 0.1% |
| South American | 51 | 0.7% |
| Subsaharan African | 23 | 0.3% |
| Swedish | 156 | 2.0% |
| Swiss | 25 | 0.3% |
| Ukrainian | 9 | 0.1% |
| Welsh | 250 | 3.3% | View All 43 Rows |
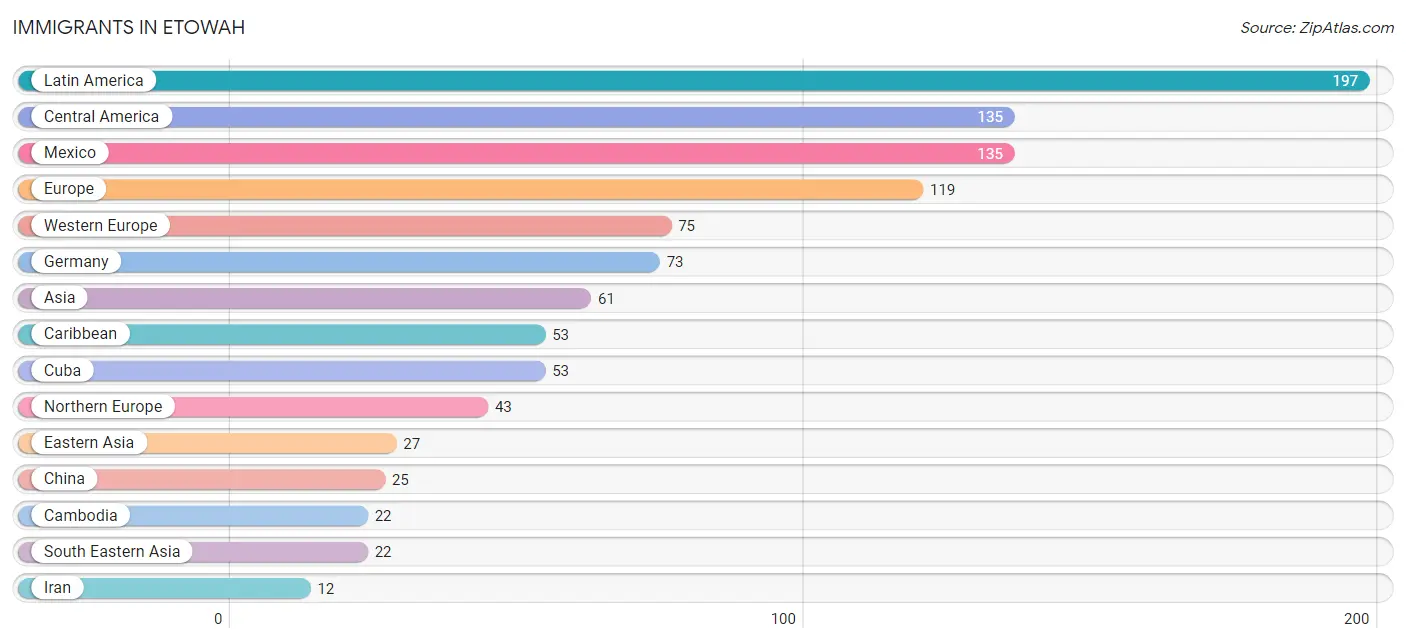
Immigrants in Etowah
The most numerous immigrant groups reported in Etowah came from Latin America (197 | 2.6%), Central America (135 | 1.8%), Mexico (135 | 1.8%), Europe (119 | 1.5%), and Western Europe (75 | 1.0%), together accounting for 8.6% of all Etowah residents.
| Immigration Origin | # Population | % Population |
| Argentina | 9 | 0.1% |
| Asia | 61 | 0.8% |
| Cambodia | 22 | 0.3% |
| Caribbean | 53 | 0.7% |
| Central America | 135 | 1.8% |
| China | 25 | 0.3% |
| Cuba | 53 | 0.7% |
| Eastern Asia | 27 | 0.4% |
| England | 8 | 0.1% |
| Europe | 119 | 1.5% |
| Germany | 73 | 0.9% |
| Iran | 12 | 0.2% |
| Korea | 2 | 0.0% |
| Latin America | 197 | 2.6% |
| Mexico | 135 | 1.8% |
| Northern Europe | 43 | 0.6% |
| South America | 9 | 0.1% |
| South Central Asia | 12 | 0.2% |
| South Eastern Asia | 22 | 0.3% |
| Southern Europe | 1 | 0.0% |
| Spain | 1 | 0.0% |
| Western Europe | 75 | 1.0% | View All 22 Rows |
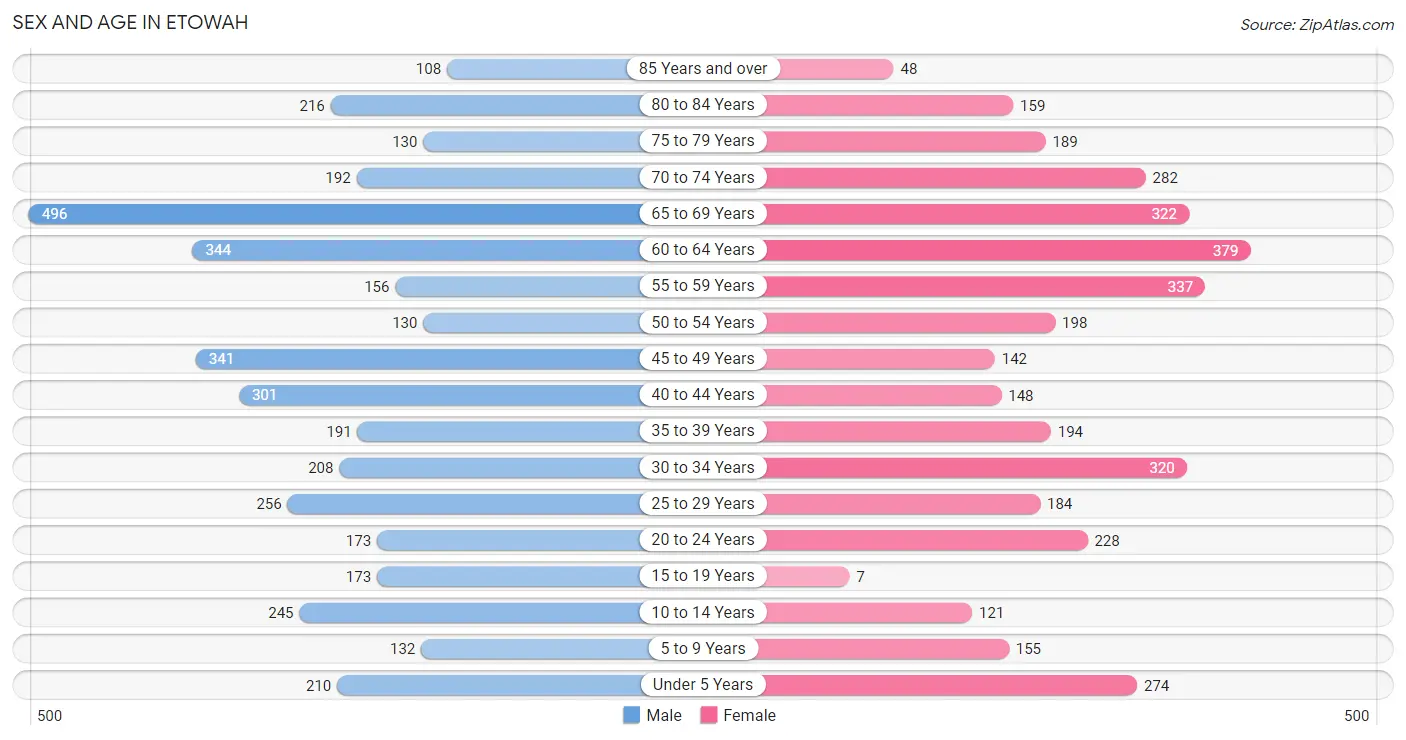
Sex and Age in Etowah
Sex and Age in Etowah
The most populous age groups in Etowah are 65 to 69 Years (496 | 12.4%) for men and 60 to 64 Years (379 | 10.3%) for women.
| Age Bracket | Male | Female |
| Under 5 Years | 210 (5.2%) | 274 (7.4%) |
| 5 to 9 Years | 132 (3.3%) | 155 (4.2%) |
| 10 to 14 Years | 245 (6.1%) | 121 (3.3%) |
| 15 to 19 Years | 173 (4.3%) | 7 (0.2%) |
| 20 to 24 Years | 173 (4.3%) | 228 (6.2%) |
| 25 to 29 Years | 256 (6.4%) | 184 (5.0%) |
| 30 to 34 Years | 208 (5.2%) | 320 (8.7%) |
| 35 to 39 Years | 191 (4.8%) | 194 (5.3%) |
| 40 to 44 Years | 301 (7.5%) | 148 (4.0%) |
| 45 to 49 Years | 341 (8.5%) | 142 (3.8%) |
| 50 to 54 Years | 130 (3.3%) | 198 (5.4%) |
| 55 to 59 Years | 156 (3.9%) | 337 (9.1%) |
| 60 to 64 Years | 344 (8.6%) | 379 (10.3%) |
| 65 to 69 Years | 496 (12.4%) | 322 (8.7%) |
| 70 to 74 Years | 192 (4.8%) | 282 (7.6%) |
| 75 to 79 Years | 130 (3.3%) | 189 (5.1%) |
| 80 to 84 Years | 216 (5.4%) | 159 (4.3%) |
| 85 Years and over | 108 (2.7%) | 48 (1.3%) |
| Total | 4,002 (100.0%) | 3,687 (100.0%) |
Families and Households in Etowah
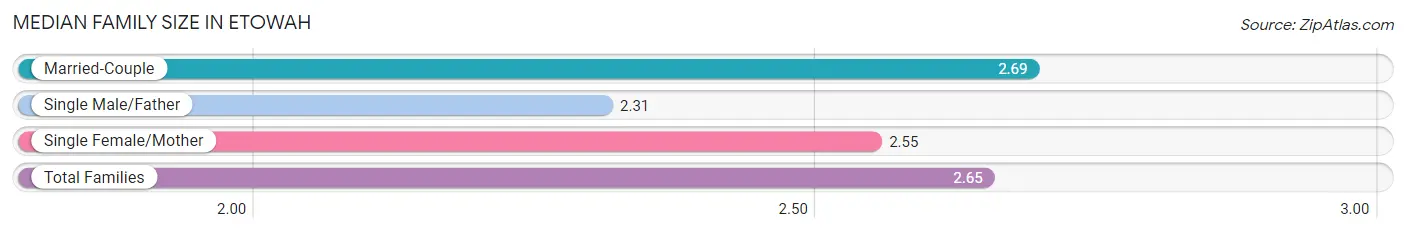
Median Family Size in Etowah
The median family size in Etowah is 2.65 persons per family, with married-couple families (2,044 | 84.8%) accounting for the largest median family size of 2.69 persons per family. On the other hand, single male/father families (153 | 6.4%) represent the smallest median family size with 2.31 persons per family.
| Family Type | # Families | Family Size |
| Married-Couple | 2,044 (84.8%) | 2.69 |
| Single Male/Father | 153 (6.4%) | 2.31 |
| Single Female/Mother | 213 (8.8%) | 2.55 |
| Total Families | 2,410 (100.0%) | 2.65 |
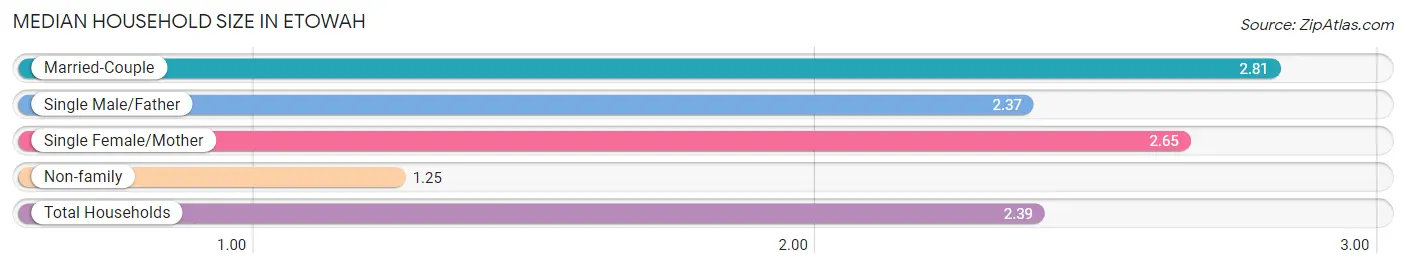
Median Household Size in Etowah
The median household size in Etowah is 2.39 persons per household, with married-couple households (2,044 | 63.5%) accounting for the largest median household size of 2.81 persons per household. non-family households (810 | 25.2%) represent the smallest median household size with 1.25 persons per household.
| Household Type | # Households | Household Size |
| Married-Couple | 2,044 (63.5%) | 2.81 |
| Single Male/Father | 153 (4.8%) | 2.37 |
| Single Female/Mother | 213 (6.6%) | 2.65 |
| Non-family | 810 (25.2%) | 1.25 |
| Total Households | 3,220 (100.0%) | 2.39 |
Household Size by Marriage Status in Etowah
Out of a total of 3,220 households in Etowah, 2,410 (74.8%) are family households, while 810 (25.2%) are nonfamily households. The most numerous type of family households are 2-person households, comprising 1,534, and the most common type of nonfamily households are 1-person households, comprising 656.
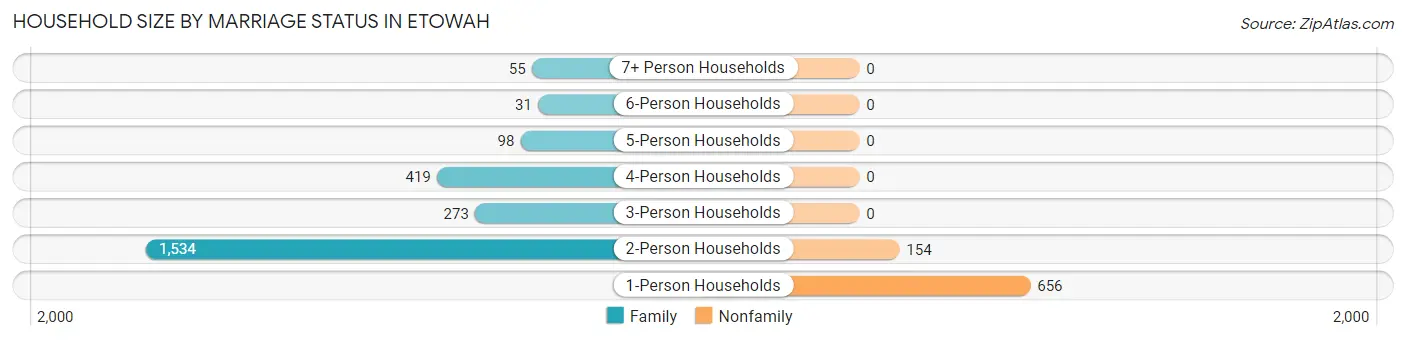
| Household Size | Family Households | Nonfamily Households |
| 1-Person Households | - | 656 (20.4%) |
| 2-Person Households | 1,534 (47.6%) | 154 (4.8%) |
| 3-Person Households | 273 (8.5%) | 0 (0.0%) |
| 4-Person Households | 419 (13.0%) | 0 (0.0%) |
| 5-Person Households | 98 (3.0%) | 0 (0.0%) |
| 6-Person Households | 31 (1.0%) | 0 (0.0%) |
| 7+ Person Households | 55 (1.7%) | 0 (0.0%) |
| Total | 2,410 (74.8%) | 810 (25.2%) |
Female Fertility in Etowah
Fertility by Age in Etowah
Average fertility rate in Etowah is 76.0 births per 1,000 women. Women in the age bracket of 15 to 19 years have the highest fertility rate with 1,000.0 births per 1,000 women. Women in the age bracket of 20 to 34 years acount for 84.0% of all women with births.
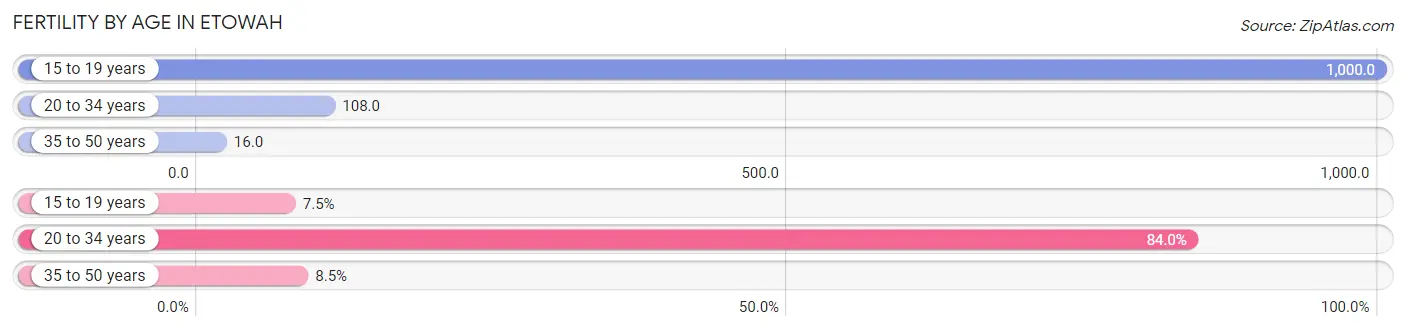
| Age Bracket | Women with Births | Births / 1,000 Women |
| 15 to 19 years | 7 (7.4%) | 1,000.0 |
| 20 to 34 years | 79 (84.0%) | 108.0 |
| 35 to 50 years | 8 (8.5%) | 16.0 |
| Total | 94 (100.0%) | 76.0 |
Fertility by Age by Marriage Status in Etowah
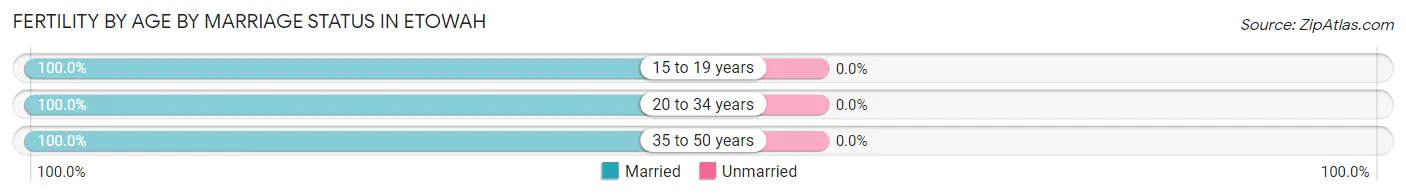
| Age Bracket | Married | Unmarried |
| 15 to 19 years | 7 (100.0%) | 0 (0.0%) |
| 20 to 34 years | 79 (100.0%) | 0 (0.0%) |
| 35 to 50 years | 8 (100.0%) | 0 (0.0%) |
| Total | 94 (100.0%) | 0 (0.0%) |
Fertility by Education in Etowah
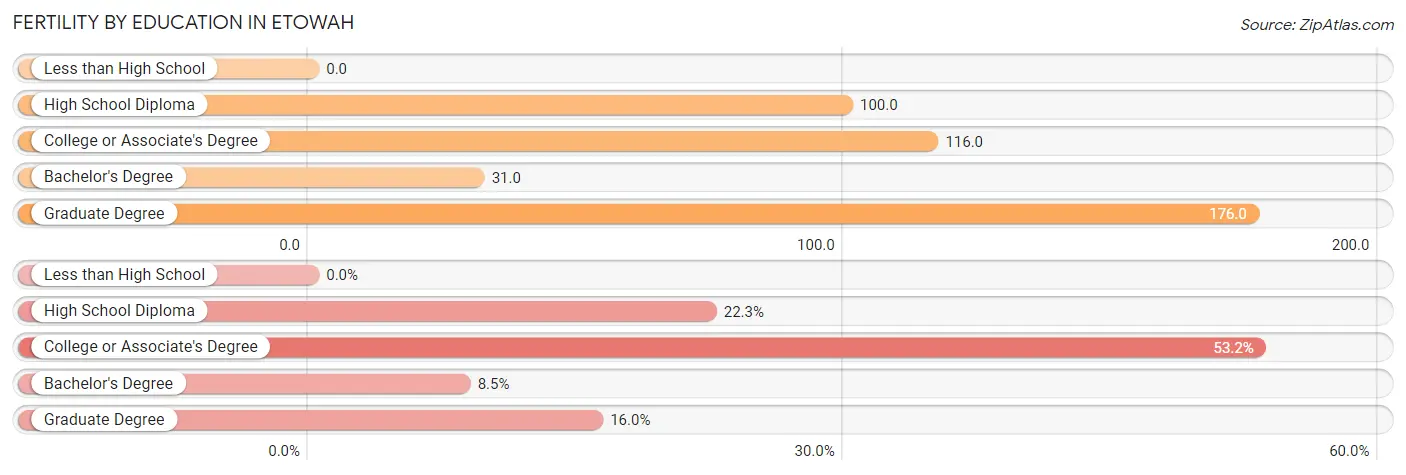
| Educational Attainment | Women with Births | Births / 1,000 Women |
| Less than High School | 0 (0.0%) | 0.0 |
| High School Diploma | 21 (22.3%) | 100.0 |
| College or Associate's Degree | 50 (53.2%) | 116.0 |
| Bachelor's Degree | 8 (8.5%) | 31.0 |
| Graduate Degree | 15 (16.0%) | 176.0 |
| Total | 94 (100.0%) | 76.0 |
Fertility by Education by Marriage Status in Etowah
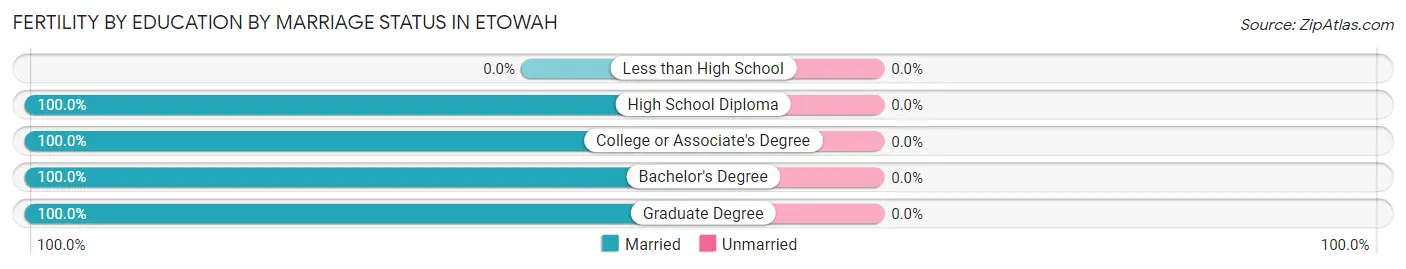
| Educational Attainment | Married | Unmarried |
| Less than High School | 0 (0.0%) | 0 (0.0%) |
| High School Diploma | 21 (100.0%) | 0 (0.0%) |
| College or Associate's Degree | 50 (100.0%) | 0 (0.0%) |
| Bachelor's Degree | 8 (100.0%) | 0 (0.0%) |
| Graduate Degree | 15 (100.0%) | 0 (0.0%) |
| Total | 94 (100.0%) | 0 (0.0%) |
Employment Characteristics in Etowah
Employment by Class of Employer in Etowah
Among the 3,483 employed individuals in Etowah, private company employees (2,115 | 60.7%), not-for-profit organizations (439 | 12.6%), and local government employees (248 | 7.1%) make up the most common classes of employment.
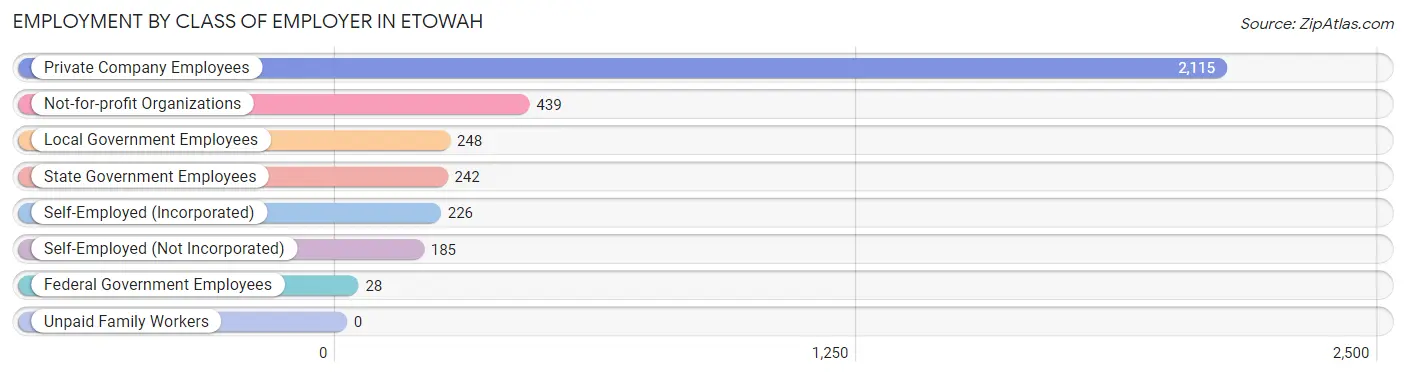
| Employer Class | # Employees | % Employees |
| Private Company Employees | 2,115 | 60.7% |
| Self-Employed (Incorporated) | 226 | 6.5% |
| Self-Employed (Not Incorporated) | 185 | 5.3% |
| Not-for-profit Organizations | 439 | 12.6% |
| Local Government Employees | 248 | 7.1% |
| State Government Employees | 242 | 7.0% |
| Federal Government Employees | 28 | 0.8% |
| Unpaid Family Workers | 0 | 0.0% |
| Total | 3,483 | 100.0% |
Employment Status by Age in Etowah
According to the labor force statistics for Etowah, out of the total population over 16 years of age (6,552), 55.3% or 3,623 individuals are in the labor force, with 1.0% or 36 of them unemployed. The age group with the highest labor force participation rate is 35 to 44 years, with 83.7% or 698 individuals in the labor force. Within the labor force, the 35 to 44 years age range has the highest percentage of unemployed individuals, with 4.0% or 28 of them being unemployed.
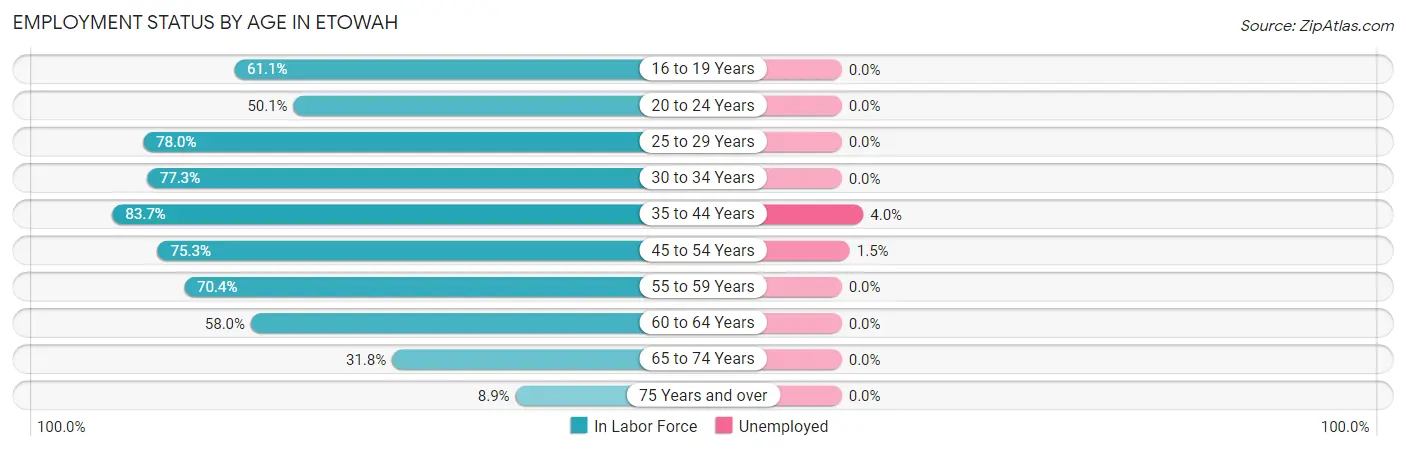
| Age Bracket | In Labor Force | Unemployed |
| 16 to 19 Years | 110 (61.1%) | 0 (0.0%) |
| 20 to 24 Years | 201 (50.1%) | 0 (0.0%) |
| 25 to 29 Years | 343 (78.0%) | 0 (0.0%) |
| 30 to 34 Years | 408 (77.3%) | 0 (0.0%) |
| 35 to 44 Years | 698 (83.7%) | 28 (4.0%) |
| 45 to 54 Years | 611 (75.3%) | 9 (1.5%) |
| 55 to 59 Years | 347 (70.4%) | 0 (0.0%) |
| 60 to 64 Years | 419 (58.0%) | 0 (0.0%) |
| 65 to 74 Years | 411 (31.8%) | 0 (0.0%) |
| 75 Years and over | 76 (8.9%) | 0 (0.0%) |
| Total | 3,623 (55.3%) | 36 (1.0%) |
Employment Status by Educational Attainment in Etowah
According to labor force statistics for Etowah, 73.8% of individuals (2,826) out of the total population between 25 and 64 years of age (3,829) are in the labor force, with 1.3% or 37 of them being unemployed. The group with the highest labor force participation rate are those with the educational attainment of bachelor's degree or higher, with 82.6% or 972 individuals in the labor force. Within the labor force, individuals with college / associate degree education have the highest percentage of unemployment, with 4.0% or 37 of them being unemployed.
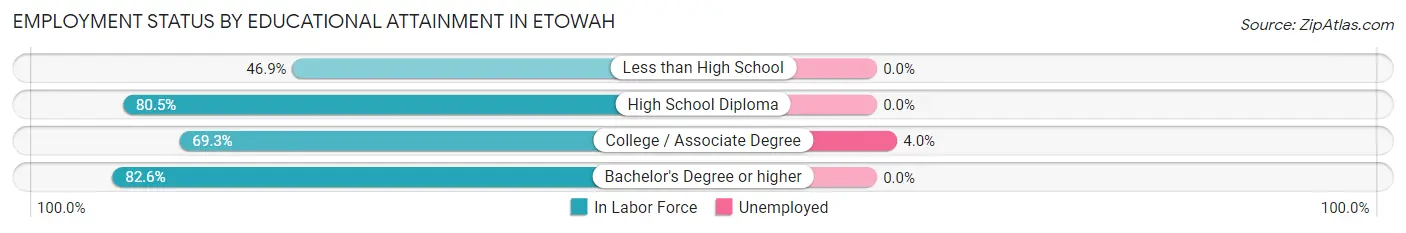
| Educational Attainment | In Labor Force | Unemployed |
| Less than High School | 183 (46.9%) | 0 (0.0%) |
| High School Diploma | 747 (80.5%) | 0 (0.0%) |
| College / Associate Degree | 924 (69.3%) | 53 (4.0%) |
| Bachelor's Degree or higher | 972 (82.6%) | 0 (0.0%) |
| Total | 2,826 (73.8%) | 50 (1.3%) |
Employment Occupations by Sex in Etowah
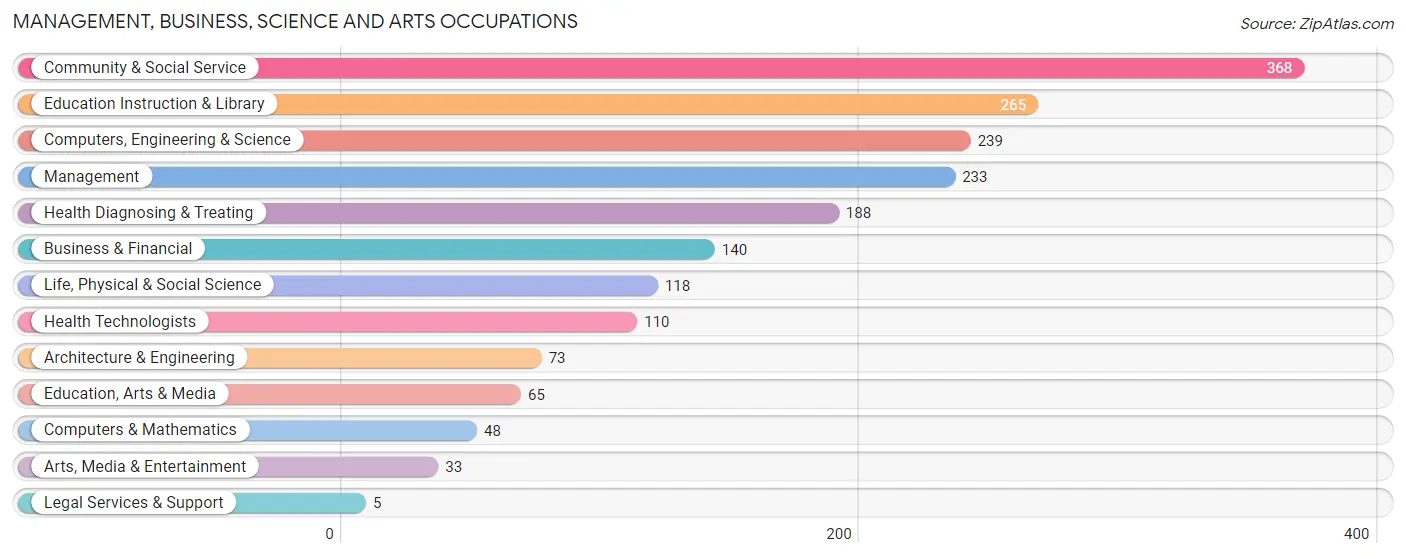
Management, Business, Science and Arts Occupations
The most common Management, Business, Science and Arts occupations in Etowah are Community & Social Service (368 | 10.3%), Education Instruction & Library (265 | 7.4%), Computers, Engineering & Science (239 | 6.7%), Management (233 | 6.5%), and Health Diagnosing & Treating (188 | 5.2%).
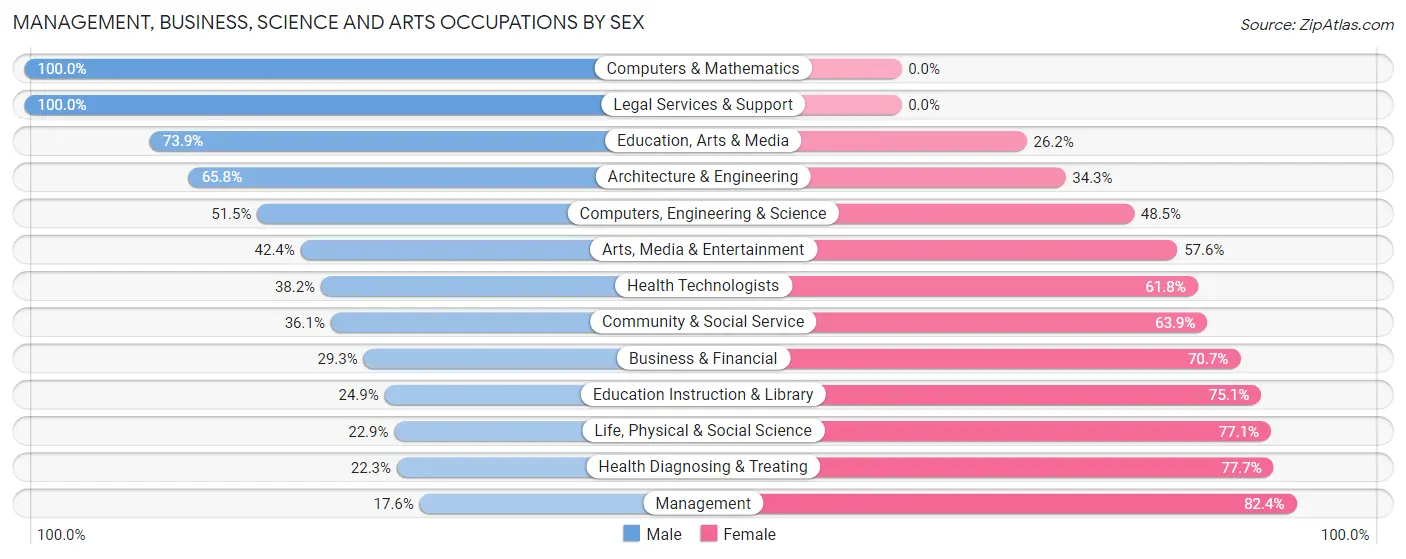
Management, Business, Science and Arts Occupations by Sex
Within the Management, Business, Science and Arts occupations in Etowah, the most male-oriented occupations are Computers & Mathematics (100.0%), Legal Services & Support (100.0%), and Education, Arts & Media (73.9%), while the most female-oriented occupations are Management (82.4%), Health Diagnosing & Treating (77.7%), and Life, Physical & Social Science (77.1%).
| Occupation | Male | Female |
| Management | 41 (17.6%) | 192 (82.4%) |
| Business & Financial | 41 (29.3%) | 99 (70.7%) |
| Computers, Engineering & Science | 123 (51.5%) | 116 (48.5%) |
| Computers & Mathematics | 48 (100.0%) | 0 (0.0%) |
| Architecture & Engineering | 48 (65.7%) | 25 (34.3%) |
| Life, Physical & Social Science | 27 (22.9%) | 91 (77.1%) |
| Community & Social Service | 133 (36.1%) | 235 (63.9%) |
| Education, Arts & Media | 48 (73.9%) | 17 (26.2%) |
| Legal Services & Support | 5 (100.0%) | 0 (0.0%) |
| Education Instruction & Library | 66 (24.9%) | 199 (75.1%) |
| Arts, Media & Entertainment | 14 (42.4%) | 19 (57.6%) |
| Health Diagnosing & Treating | 42 (22.3%) | 146 (77.7%) |
| Health Technologists | 42 (38.2%) | 68 (61.8%) |
| Total (Category) | 380 (32.5%) | 788 (67.5%) |
| Total (Overall) | 1,910 (53.2%) | 1,677 (46.8%) |
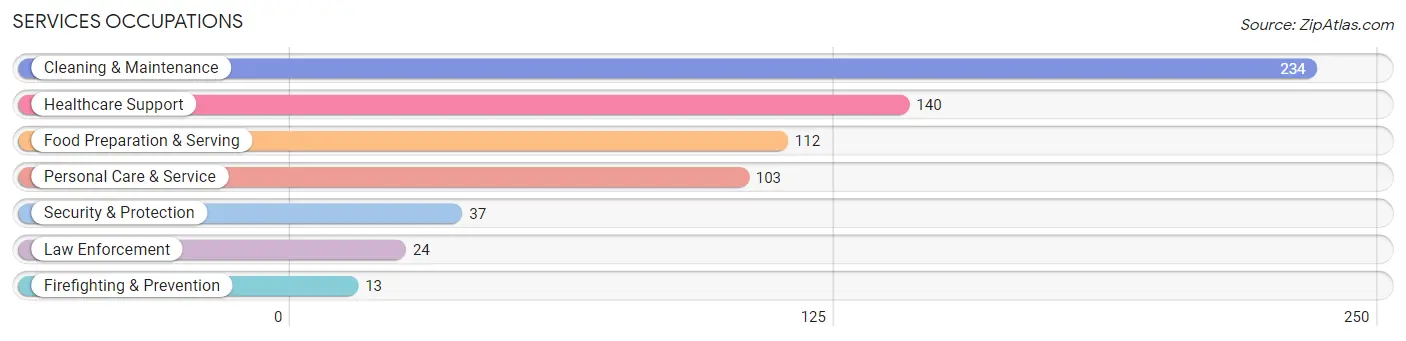
Services Occupations
The most common Services occupations in Etowah are Cleaning & Maintenance (234 | 6.5%), Healthcare Support (140 | 3.9%), Food Preparation & Serving (112 | 3.1%), Personal Care & Service (103 | 2.9%), and Security & Protection (37 | 1.0%).
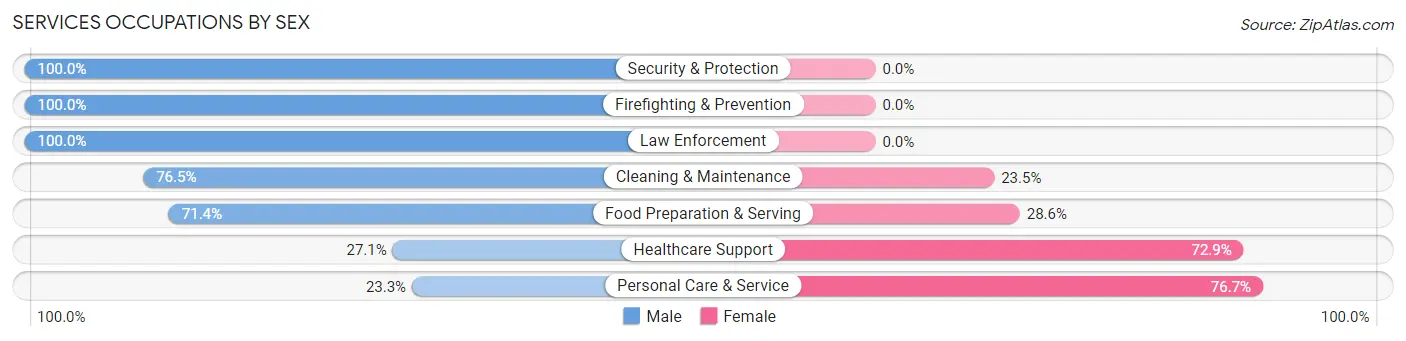
Services Occupations by Sex
Within the Services occupations in Etowah, the most male-oriented occupations are Security & Protection (100.0%), Firefighting & Prevention (100.0%), and Law Enforcement (100.0%), while the most female-oriented occupations are Personal Care & Service (76.7%), Healthcare Support (72.9%), and Food Preparation & Serving (28.6%).
| Occupation | Male | Female |
| Healthcare Support | 38 (27.1%) | 102 (72.9%) |
| Security & Protection | 37 (100.0%) | 0 (0.0%) |
| Firefighting & Prevention | 13 (100.0%) | 0 (0.0%) |
| Law Enforcement | 24 (100.0%) | 0 (0.0%) |
| Food Preparation & Serving | 80 (71.4%) | 32 (28.6%) |
| Cleaning & Maintenance | 179 (76.5%) | 55 (23.5%) |
| Personal Care & Service | 24 (23.3%) | 79 (76.7%) |
| Total (Category) | 358 (57.2%) | 268 (42.8%) |
| Total (Overall) | 1,910 (53.2%) | 1,677 (46.8%) |
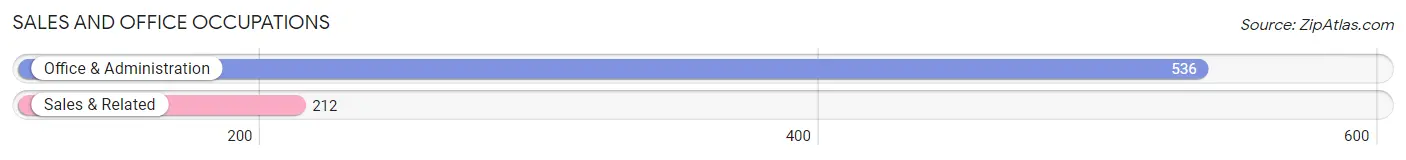
Sales and Office Occupations
The most common Sales and Office occupations in Etowah are Office & Administration (536 | 14.9%), and Sales & Related (212 | 5.9%).
Sales and Office Occupations by Sex
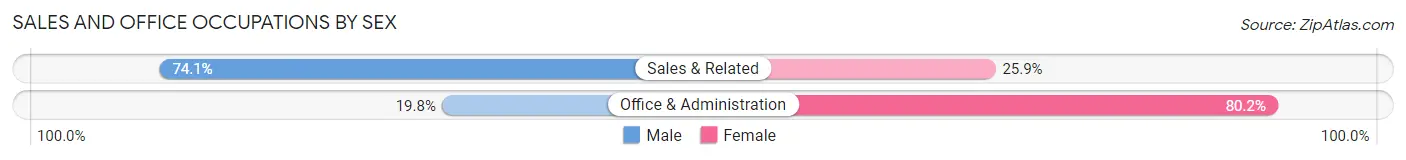
| Occupation | Male | Female |
| Sales & Related | 157 (74.1%) | 55 (25.9%) |
| Office & Administration | 106 (19.8%) | 430 (80.2%) |
| Total (Category) | 263 (35.2%) | 485 (64.8%) |
| Total (Overall) | 1,910 (53.2%) | 1,677 (46.8%) |
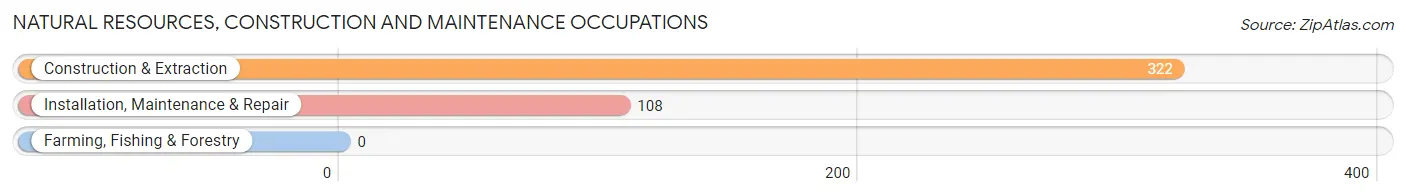
Natural Resources, Construction and Maintenance Occupations
The most common Natural Resources, Construction and Maintenance occupations in Etowah are Construction & Extraction (322 | 9.0%), and Installation, Maintenance & Repair (108 | 3.0%).
Natural Resources, Construction and Maintenance Occupations by Sex
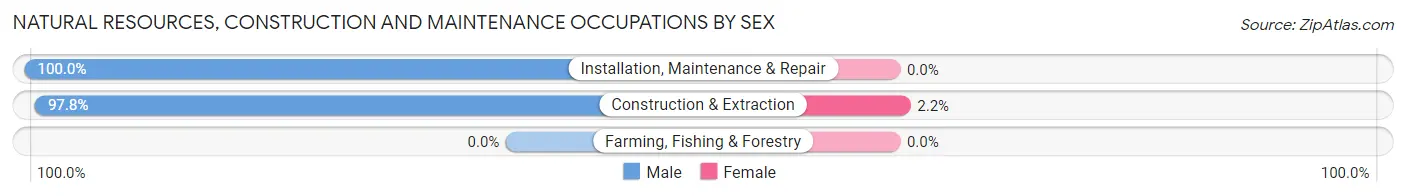
| Occupation | Male | Female |
| Farming, Fishing & Forestry | 0 (0.0%) | 0 (0.0%) |
| Construction & Extraction | 315 (97.8%) | 7 (2.2%) |
| Installation, Maintenance & Repair | 108 (100.0%) | 0 (0.0%) |
| Total (Category) | 423 (98.4%) | 7 (1.6%) |
| Total (Overall) | 1,910 (53.2%) | 1,677 (46.8%) |
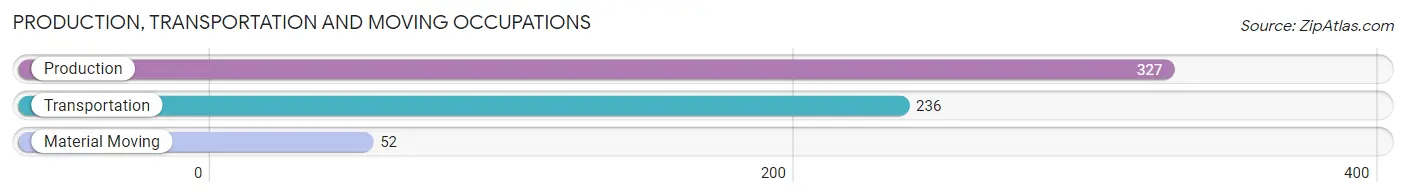
Production, Transportation and Moving Occupations
The most common Production, Transportation and Moving occupations in Etowah are Production (327 | 9.1%), Transportation (236 | 6.6%), and Material Moving (52 | 1.5%).
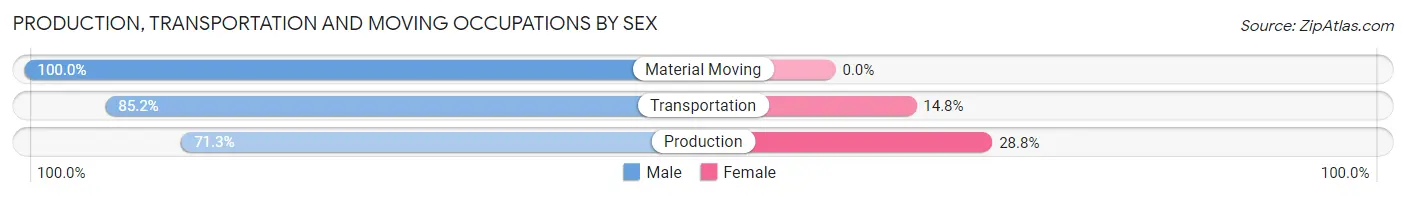
Production, Transportation and Moving Occupations by Sex
| Occupation | Male | Female |
| Production | 233 (71.3%) | 94 (28.7%) |
| Transportation | 201 (85.2%) | 35 (14.8%) |
| Material Moving | 52 (100.0%) | 0 (0.0%) |
| Total (Category) | 486 (79.0%) | 129 (21.0%) |
| Total (Overall) | 1,910 (53.2%) | 1,677 (46.8%) |
Employment Industries by Sex in Etowah
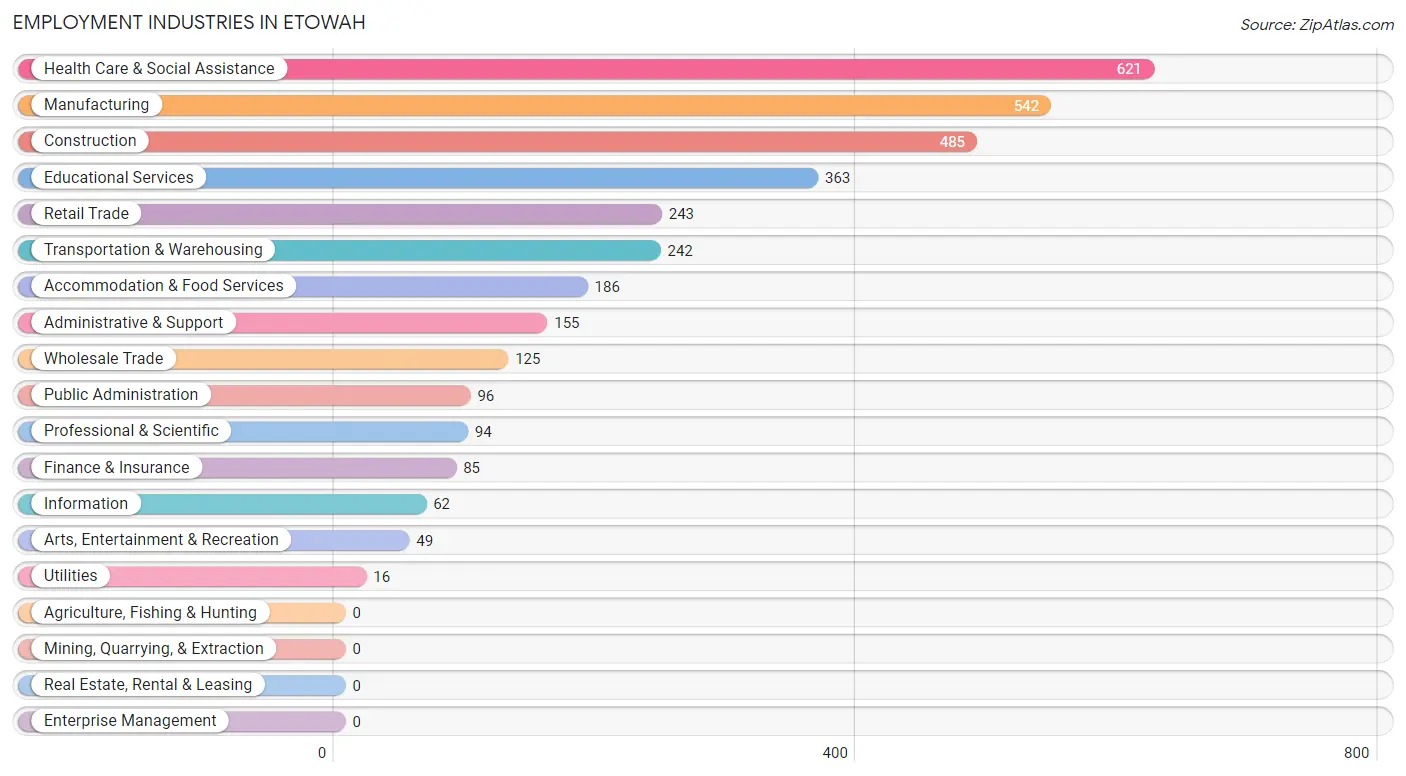
Employment Industries in Etowah
The major employment industries in Etowah include Health Care & Social Assistance (621 | 17.3%), Manufacturing (542 | 15.1%), Construction (485 | 13.5%), Educational Services (363 | 10.1%), and Retail Trade (243 | 6.8%).
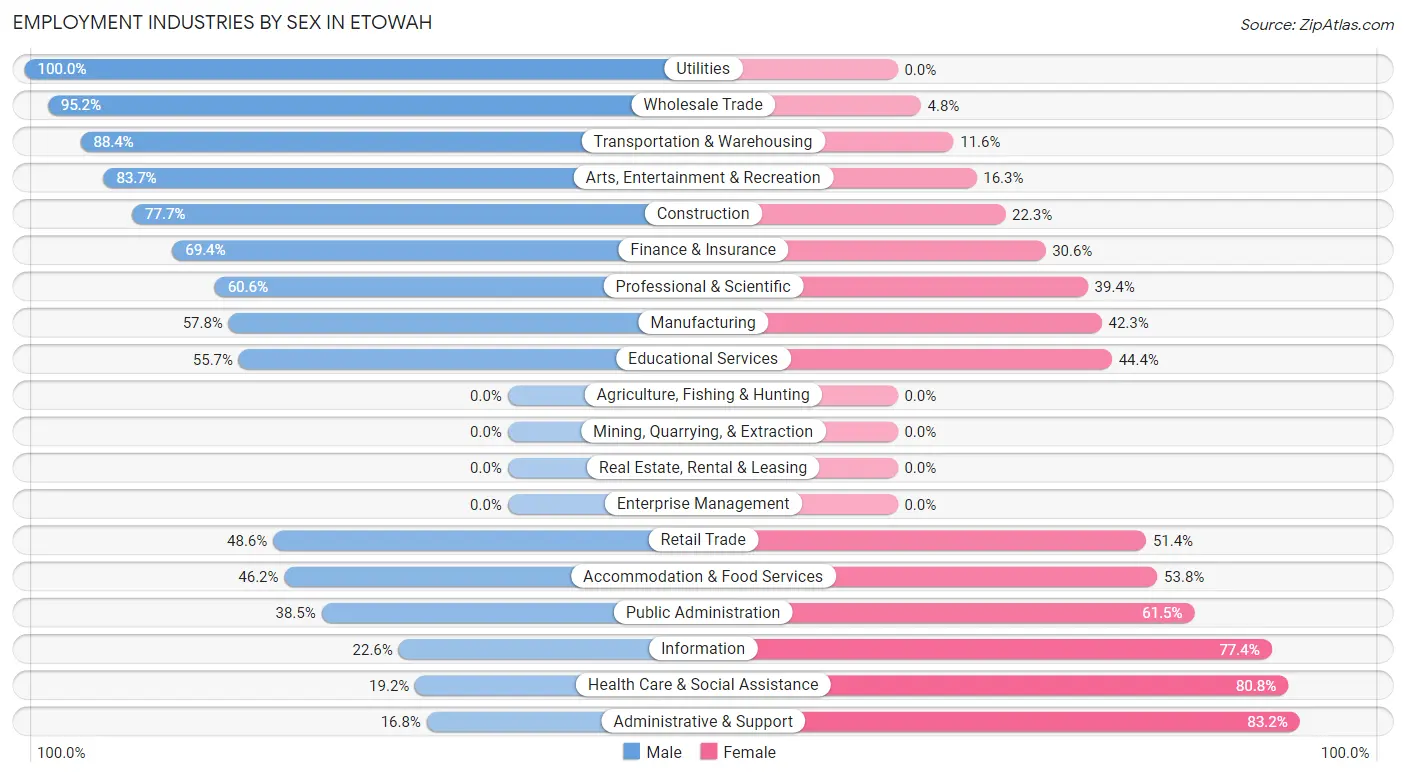
Employment Industries by Sex in Etowah
The Etowah industries that see more men than women are Utilities (100.0%), Wholesale Trade (95.2%), and Transportation & Warehousing (88.4%), whereas the industries that tend to have a higher number of women are Administrative & Support (83.2%), Health Care & Social Assistance (80.8%), and Information (77.4%).
| Industry | Male | Female |
| Agriculture, Fishing & Hunting | 0 (0.0%) | 0 (0.0%) |
| Mining, Quarrying, & Extraction | 0 (0.0%) | 0 (0.0%) |
| Construction | 377 (77.7%) | 108 (22.3%) |
| Manufacturing | 313 (57.8%) | 229 (42.2%) |
| Wholesale Trade | 119 (95.2%) | 6 (4.8%) |
| Retail Trade | 118 (48.6%) | 125 (51.4%) |
| Transportation & Warehousing | 214 (88.4%) | 28 (11.6%) |
| Utilities | 16 (100.0%) | 0 (0.0%) |
| Information | 14 (22.6%) | 48 (77.4%) |
| Finance & Insurance | 59 (69.4%) | 26 (30.6%) |
| Real Estate, Rental & Leasing | 0 (0.0%) | 0 (0.0%) |
| Professional & Scientific | 57 (60.6%) | 37 (39.4%) |
| Enterprise Management | 0 (0.0%) | 0 (0.0%) |
| Administrative & Support | 26 (16.8%) | 129 (83.2%) |
| Educational Services | 202 (55.6%) | 161 (44.4%) |
| Health Care & Social Assistance | 119 (19.2%) | 502 (80.8%) |
| Arts, Entertainment & Recreation | 41 (83.7%) | 8 (16.3%) |
| Accommodation & Food Services | 86 (46.2%) | 100 (53.8%) |
| Public Administration | 37 (38.5%) | 59 (61.5%) |
| Total | 1,910 (53.2%) | 1,677 (46.8%) |
Education in Etowah
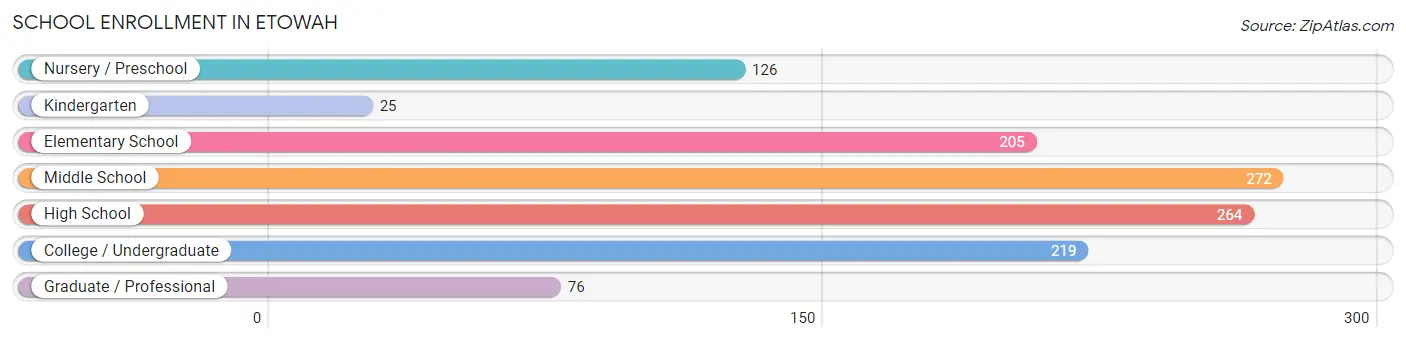
School Enrollment in Etowah
The most common levels of schooling among the 1,187 students in Etowah are middle school (272 | 22.9%), high school (264 | 22.2%), and college / undergraduate (219 | 18.4%).
| School Level | # Students | % Students |
| Nursery / Preschool | 126 | 10.6% |
| Kindergarten | 25 | 2.1% |
| Elementary School | 205 | 17.3% |
| Middle School | 272 | 22.9% |
| High School | 264 | 22.2% |
| College / Undergraduate | 219 | 18.4% |
| Graduate / Professional | 76 | 6.4% |
| Total | 1,187 | 100.0% |
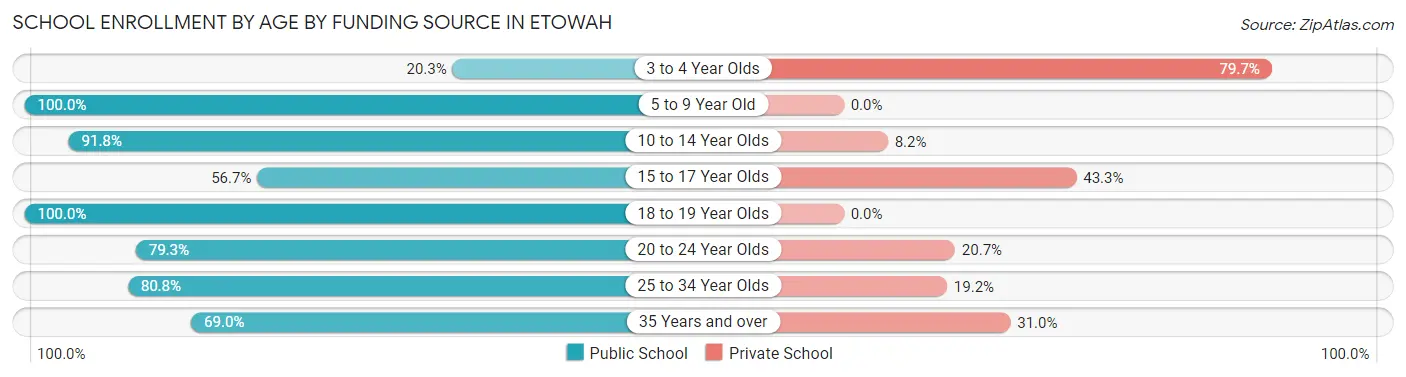
School Enrollment by Age by Funding Source in Etowah
Out of a total of 1,187 students who are enrolled in schools in Etowah, 199 (16.8%) attend a private institution, while the remaining 988 (83.2%) are enrolled in public schools. The age group of 3 to 4 year olds has the highest likelihood of being enrolled in private schools, with 55 (79.7% in the age bracket) enrolled. Conversely, the age group of 5 to 9 year old has the lowest likelihood of being enrolled in a private school, with 287 (100.0% in the age bracket) attending a public institution.
| Age Bracket | Public School | Private School |
| 3 to 4 Year Olds | 14 (20.3%) | 55 (79.7%) |
| 5 to 9 Year Old | 287 (100.0%) | 0 (0.0%) |
| 10 to 14 Year Olds | 336 (91.8%) | 30 (8.2%) |
| 15 to 17 Year Olds | 51 (56.7%) | 39 (43.3%) |
| 18 to 19 Year Olds | 17 (100.0%) | 0 (0.0%) |
| 20 to 24 Year Olds | 199 (79.3%) | 52 (20.7%) |
| 25 to 34 Year Olds | 63 (80.8%) | 15 (19.2%) |
| 35 Years and over | 20 (69.0%) | 9 (31.0%) |
| Total | 988 (83.2%) | 199 (16.8%) |
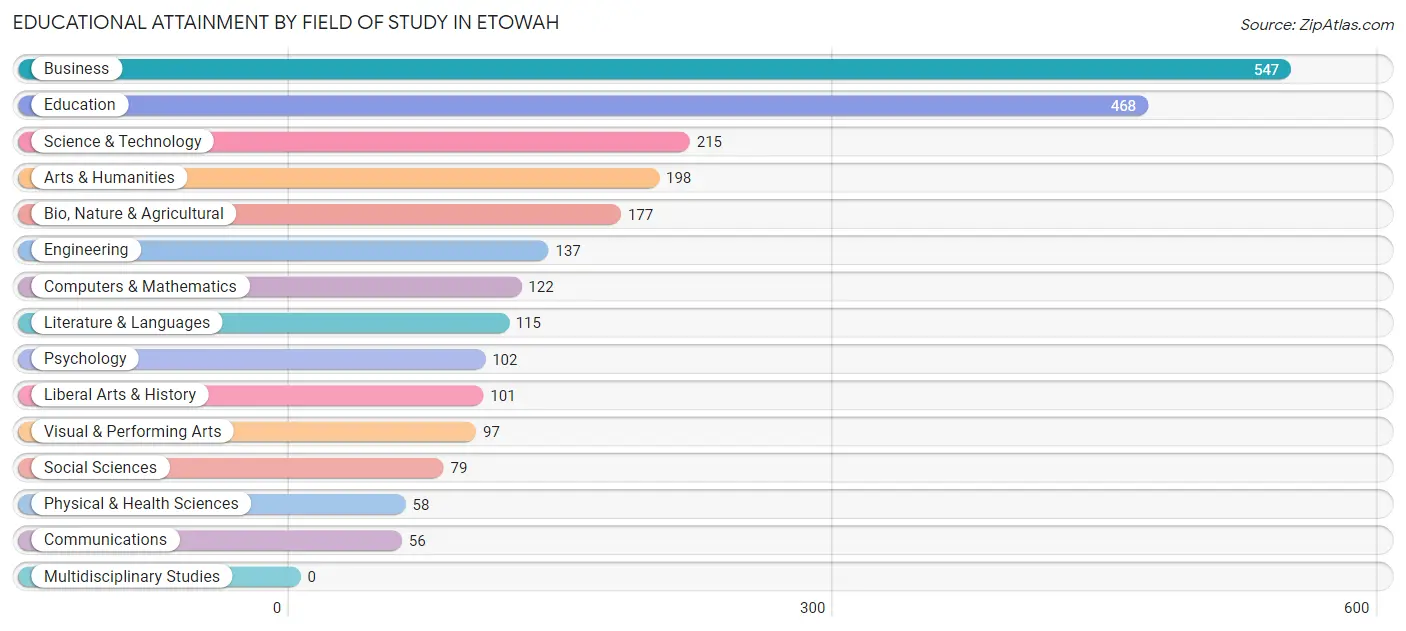
Educational Attainment by Field of Study in Etowah
Business (547 | 22.1%), education (468 | 18.9%), science & technology (215 | 8.7%), arts & humanities (198 | 8.0%), and bio, nature & agricultural (177 | 7.2%) are the most common fields of study among 2,472 individuals in Etowah who have obtained a bachelor's degree or higher.
| Field of Study | # Graduates | % Graduates |
| Computers & Mathematics | 122 | 4.9% |
| Bio, Nature & Agricultural | 177 | 7.2% |
| Physical & Health Sciences | 58 | 2.4% |
| Psychology | 102 | 4.1% |
| Social Sciences | 79 | 3.2% |
| Engineering | 137 | 5.5% |
| Multidisciplinary Studies | 0 | 0.0% |
| Science & Technology | 215 | 8.7% |
| Business | 547 | 22.1% |
| Education | 468 | 18.9% |
| Literature & Languages | 115 | 4.6% |
| Liberal Arts & History | 101 | 4.1% |
| Visual & Performing Arts | 97 | 3.9% |
| Communications | 56 | 2.3% |
| Arts & Humanities | 198 | 8.0% |
| Total | 2,472 | 100.0% |
Transportation & Commute in Etowah
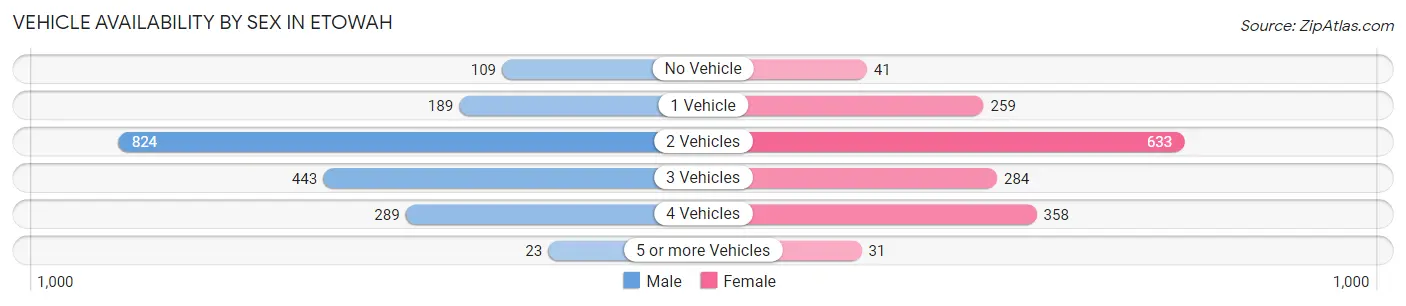
Vehicle Availability by Sex in Etowah
The most prevalent vehicle ownership categories in Etowah are males with 2 vehicles (824, accounting for 43.9%) and females with 2 vehicles (633, making up 51.3%).
| Vehicles Available | Male | Female |
| No Vehicle | 109 (5.8%) | 41 (2.5%) |
| 1 Vehicle | 189 (10.1%) | 259 (16.1%) |
| 2 Vehicles | 824 (43.9%) | 633 (39.4%) |
| 3 Vehicles | 443 (23.6%) | 284 (17.7%) |
| 4 Vehicles | 289 (15.4%) | 358 (22.3%) |
| 5 or more Vehicles | 23 (1.2%) | 31 (1.9%) |
| Total | 1,877 (100.0%) | 1,606 (100.0%) |
Commute Time in Etowah
The most frequently occuring commute durations in Etowah are 20 to 24 minutes (653 commuters, 19.8%), 30 to 34 minutes (514 commuters, 15.6%), and 25 to 29 minutes (346 commuters, 10.5%).
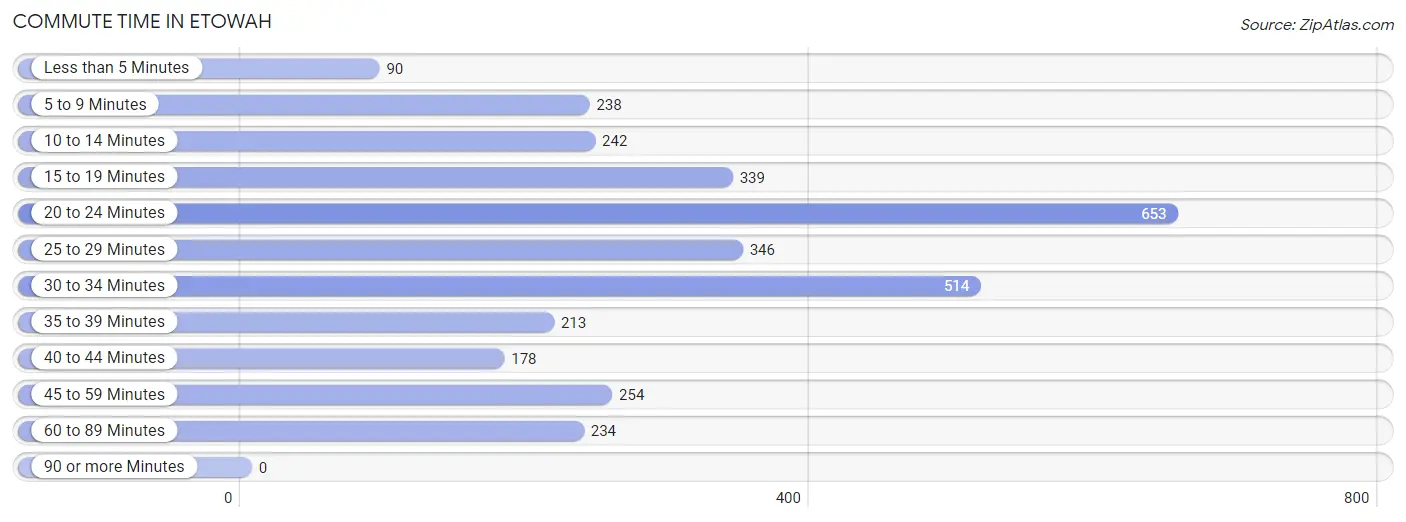
| Commute Time | # Commuters | % Commuters |
| Less than 5 Minutes | 90 | 2.7% |
| 5 to 9 Minutes | 238 | 7.2% |
| 10 to 14 Minutes | 242 | 7.3% |
| 15 to 19 Minutes | 339 | 10.3% |
| 20 to 24 Minutes | 653 | 19.8% |
| 25 to 29 Minutes | 346 | 10.5% |
| 30 to 34 Minutes | 514 | 15.6% |
| 35 to 39 Minutes | 213 | 6.5% |
| 40 to 44 Minutes | 178 | 5.4% |
| 45 to 59 Minutes | 254 | 7.7% |
| 60 to 89 Minutes | 234 | 7.1% |
| 90 or more Minutes | 0 | 0.0% |
Commute Time by Sex in Etowah
The most common commute times in Etowah are 15 to 19 minutes (263 commuters, 14.6%) for males and 20 to 24 minutes (465 commuters, 31.0%) for females.
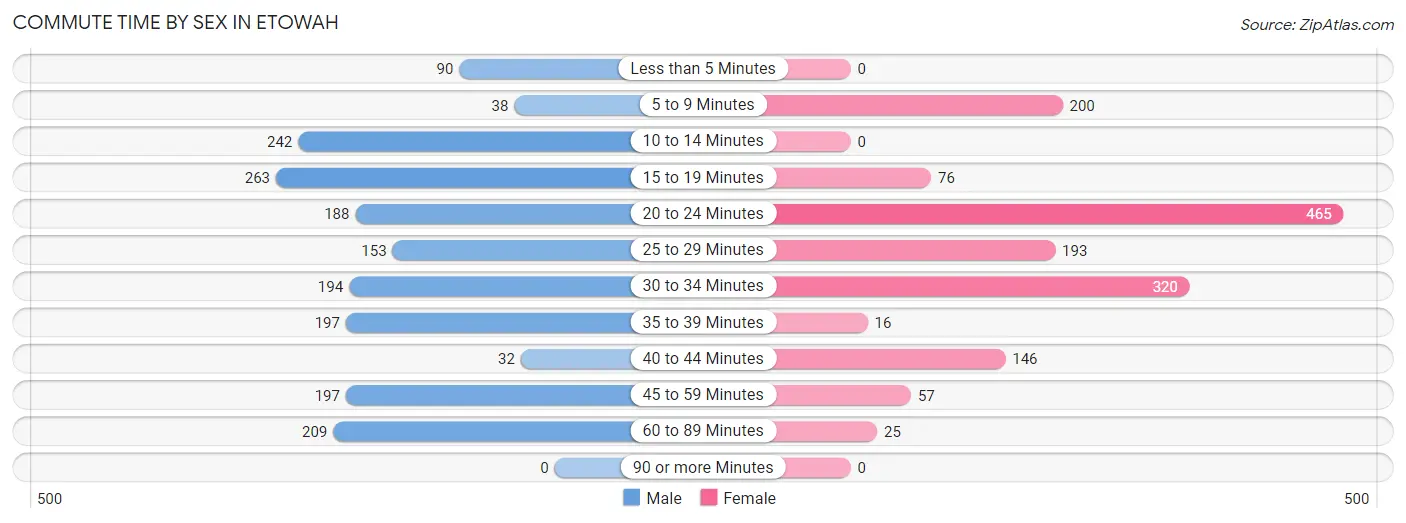
| Commute Time | Male | Female |
| Less than 5 Minutes | 90 (5.0%) | 0 (0.0%) |
| 5 to 9 Minutes | 38 (2.1%) | 200 (13.4%) |
| 10 to 14 Minutes | 242 (13.4%) | 0 (0.0%) |
| 15 to 19 Minutes | 263 (14.6%) | 76 (5.1%) |
| 20 to 24 Minutes | 188 (10.4%) | 465 (31.0%) |
| 25 to 29 Minutes | 153 (8.5%) | 193 (12.9%) |
| 30 to 34 Minutes | 194 (10.8%) | 320 (21.4%) |
| 35 to 39 Minutes | 197 (10.9%) | 16 (1.1%) |
| 40 to 44 Minutes | 32 (1.8%) | 146 (9.8%) |
| 45 to 59 Minutes | 197 (10.9%) | 57 (3.8%) |
| 60 to 89 Minutes | 209 (11.6%) | 25 (1.7%) |
| 90 or more Minutes | 0 (0.0%) | 0 (0.0%) |
Time of Departure to Work by Sex in Etowah
The most frequent times of departure to work in Etowah are 8:00 AM to 8:29 AM (268, 14.9%) for males and 7:00 AM to 7:29 AM (360, 24.0%) for females.
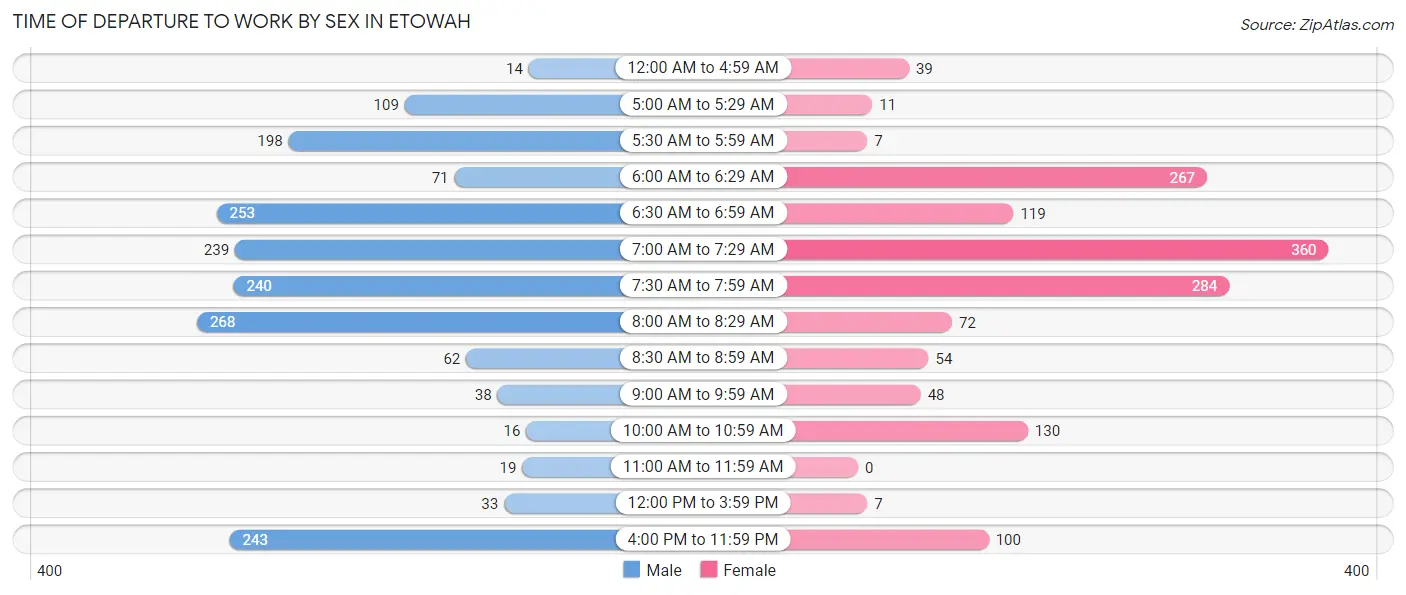
| Time of Departure | Male | Female |
| 12:00 AM to 4:59 AM | 14 (0.8%) | 39 (2.6%) |
| 5:00 AM to 5:29 AM | 109 (6.0%) | 11 (0.7%) |
| 5:30 AM to 5:59 AM | 198 (11.0%) | 7 (0.5%) |
| 6:00 AM to 6:29 AM | 71 (3.9%) | 267 (17.8%) |
| 6:30 AM to 6:59 AM | 253 (14.0%) | 119 (7.9%) |
| 7:00 AM to 7:29 AM | 239 (13.3%) | 360 (24.0%) |
| 7:30 AM to 7:59 AM | 240 (13.3%) | 284 (19.0%) |
| 8:00 AM to 8:29 AM | 268 (14.9%) | 72 (4.8%) |
| 8:30 AM to 8:59 AM | 62 (3.4%) | 54 (3.6%) |
| 9:00 AM to 9:59 AM | 38 (2.1%) | 48 (3.2%) |
| 10:00 AM to 10:59 AM | 16 (0.9%) | 130 (8.7%) |
| 11:00 AM to 11:59 AM | 19 (1.1%) | 0 (0.0%) |
| 12:00 PM to 3:59 PM | 33 (1.8%) | 7 (0.5%) |
| 4:00 PM to 11:59 PM | 243 (13.5%) | 100 (6.7%) |
| Total | 1,803 (100.0%) | 1,498 (100.0%) |
Housing Occupancy in Etowah
Occupancy by Ownership in Etowah
Of the total 3,220 dwellings in Etowah, owner-occupied units account for 2,691 (83.6%), while renter-occupied units make up 529 (16.4%).
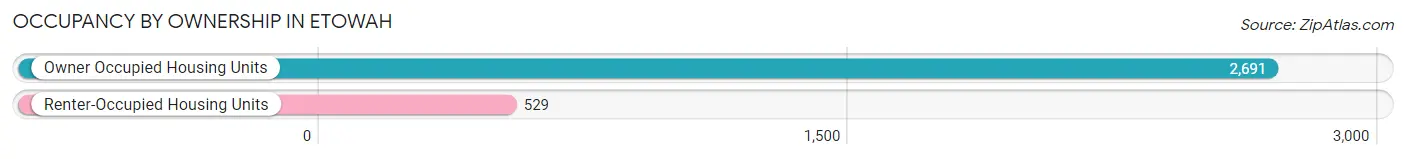
| Occupancy | # Housing Units | % Housing Units |
| Owner Occupied Housing Units | 2,691 | 83.6% |
| Renter-Occupied Housing Units | 529 | 16.4% |
| Total Occupied Housing Units | 3,220 | 100.0% |
Occupancy by Household Size in Etowah
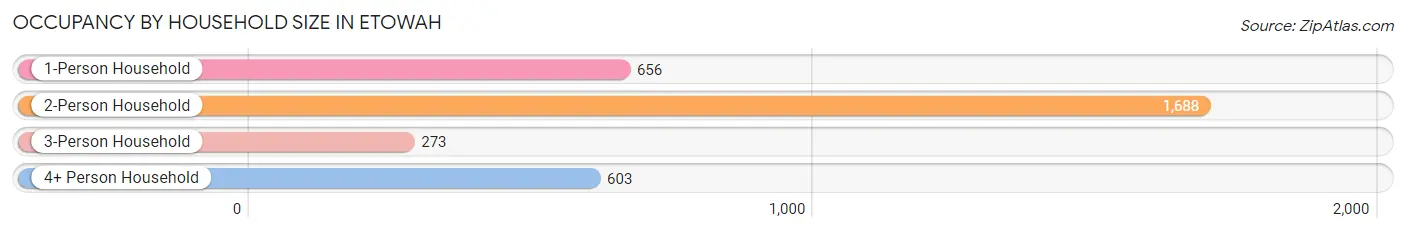
| Household Size | # Housing Units | % Housing Units |
| 1-Person Household | 656 | 20.4% |
| 2-Person Household | 1,688 | 52.4% |
| 3-Person Household | 273 | 8.5% |
| 4+ Person Household | 603 | 18.7% |
| Total Housing Units | 3,220 | 100.0% |
Occupancy by Ownership by Household Size in Etowah
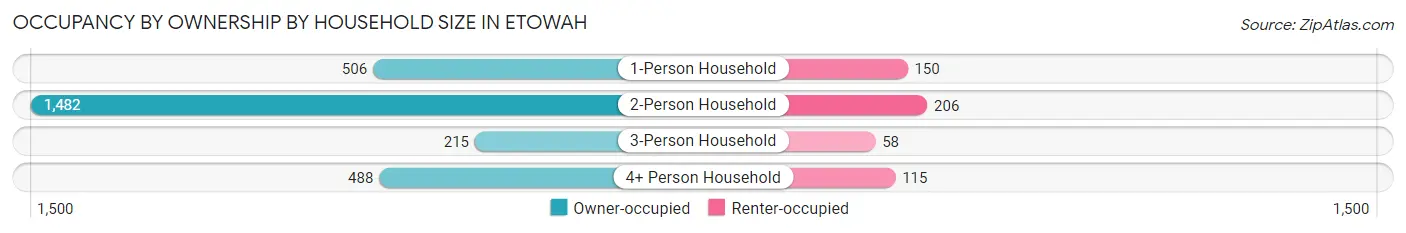
| Household Size | Owner-occupied | Renter-occupied |
| 1-Person Household | 506 (77.1%) | 150 (22.9%) |
| 2-Person Household | 1,482 (87.8%) | 206 (12.2%) |
| 3-Person Household | 215 (78.7%) | 58 (21.2%) |
| 4+ Person Household | 488 (80.9%) | 115 (19.1%) |
| Total Housing Units | 2,691 (83.6%) | 529 (16.4%) |
Occupancy by Educational Attainment in Etowah
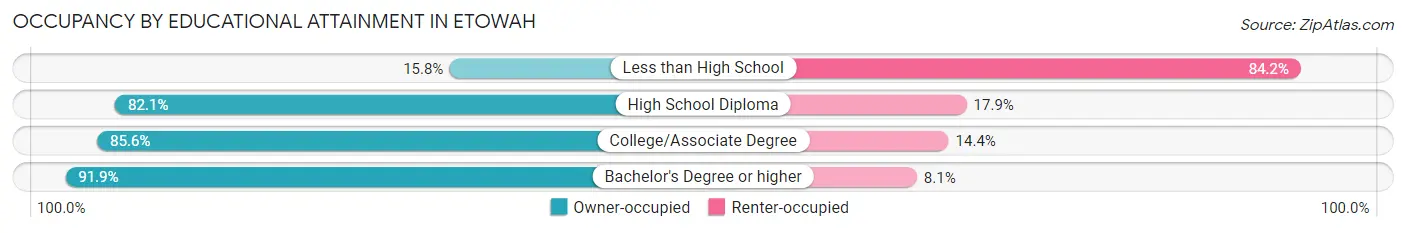
| Household Size | Owner-occupied | Renter-occupied |
| Less than High School | 25 (15.8%) | 133 (84.2%) |
| High School Diploma | 636 (82.1%) | 139 (17.9%) |
| College/Associate Degree | 983 (85.6%) | 165 (14.4%) |
| Bachelor's Degree or higher | 1,047 (91.9%) | 92 (8.1%) |
Occupancy by Age of Householder in Etowah
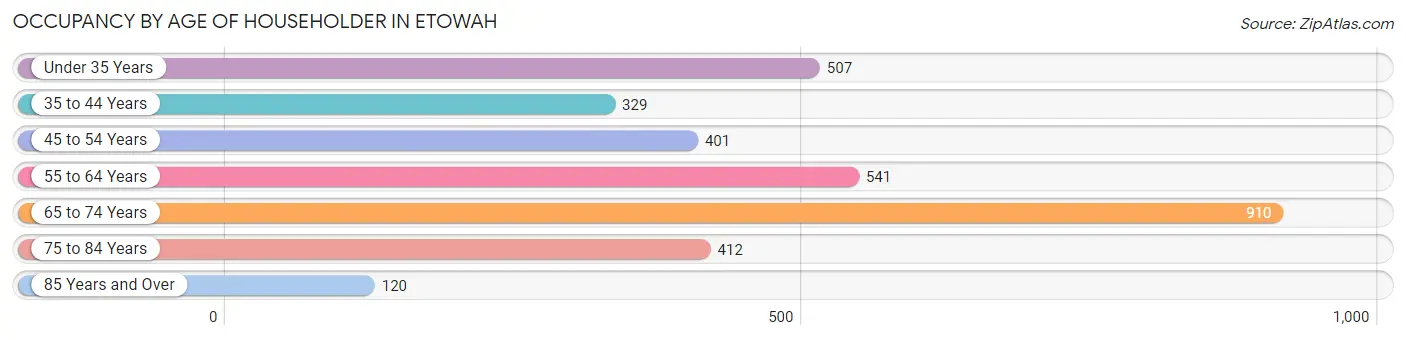
| Age Bracket | # Households | % Households |
| Under 35 Years | 507 | 15.8% |
| 35 to 44 Years | 329 | 10.2% |
| 45 to 54 Years | 401 | 12.4% |
| 55 to 64 Years | 541 | 16.8% |
| 65 to 74 Years | 910 | 28.3% |
| 75 to 84 Years | 412 | 12.8% |
| 85 Years and Over | 120 | 3.7% |
| Total | 3,220 | 100.0% |
Housing Finances in Etowah
Median Income by Occupancy in Etowah
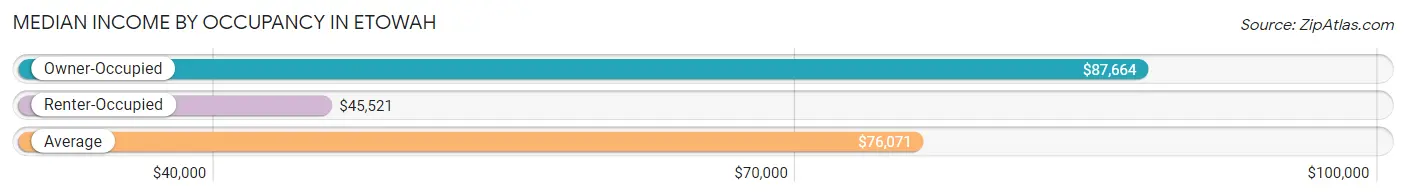
| Occupancy Type | # Households | Median Income |
| Owner-Occupied | 2,691 (83.6%) | $87,664 |
| Renter-Occupied | 529 (16.4%) | $45,521 |
| Average | 3,220 (100.0%) | $76,071 |
Occupancy by Householder Income Bracket in Etowah
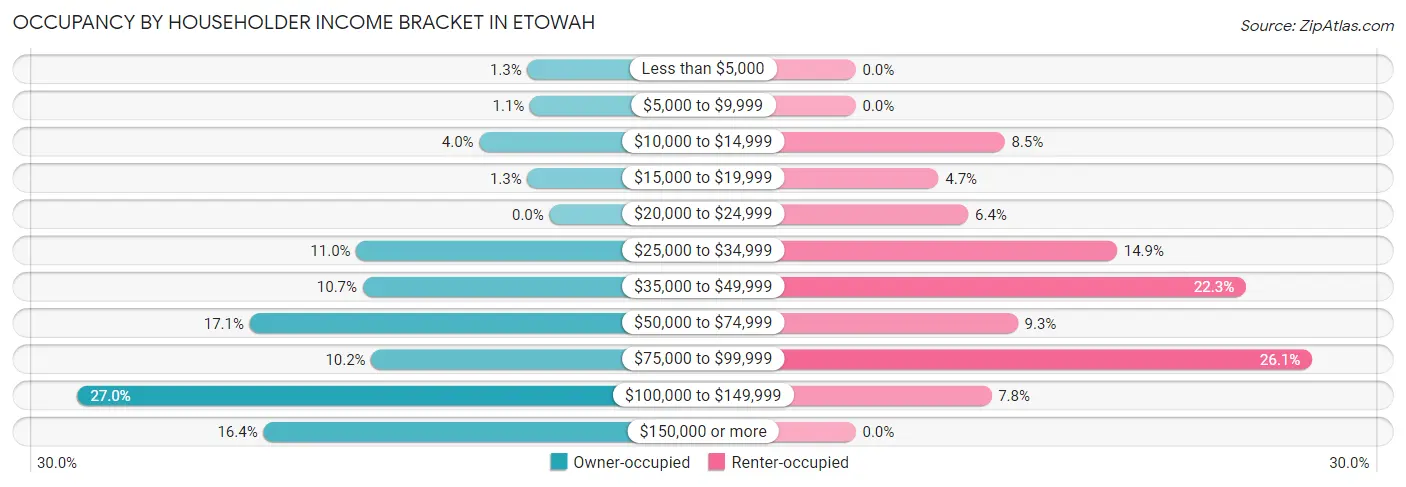
| Income Bracket | Owner-occupied | Renter-occupied |
| Less than $5,000 | 34 (1.3%) | 0 (0.0%) |
| $5,000 to $9,999 | 30 (1.1%) | 0 (0.0%) |
| $10,000 to $14,999 | 108 (4.0%) | 45 (8.5%) |
| $15,000 to $19,999 | 34 (1.3%) | 25 (4.7%) |
| $20,000 to $24,999 | 0 (0.0%) | 34 (6.4%) |
| $25,000 to $34,999 | 297 (11.0%) | 79 (14.9%) |
| $35,000 to $49,999 | 287 (10.7%) | 118 (22.3%) |
| $50,000 to $74,999 | 461 (17.1%) | 49 (9.3%) |
| $75,000 to $99,999 | 274 (10.2%) | 138 (26.1%) |
| $100,000 to $149,999 | 726 (27.0%) | 41 (7.7%) |
| $150,000 or more | 440 (16.4%) | 0 (0.0%) |
| Total | 2,691 (100.0%) | 529 (100.0%) |
Monthly Housing Cost Tiers in Etowah
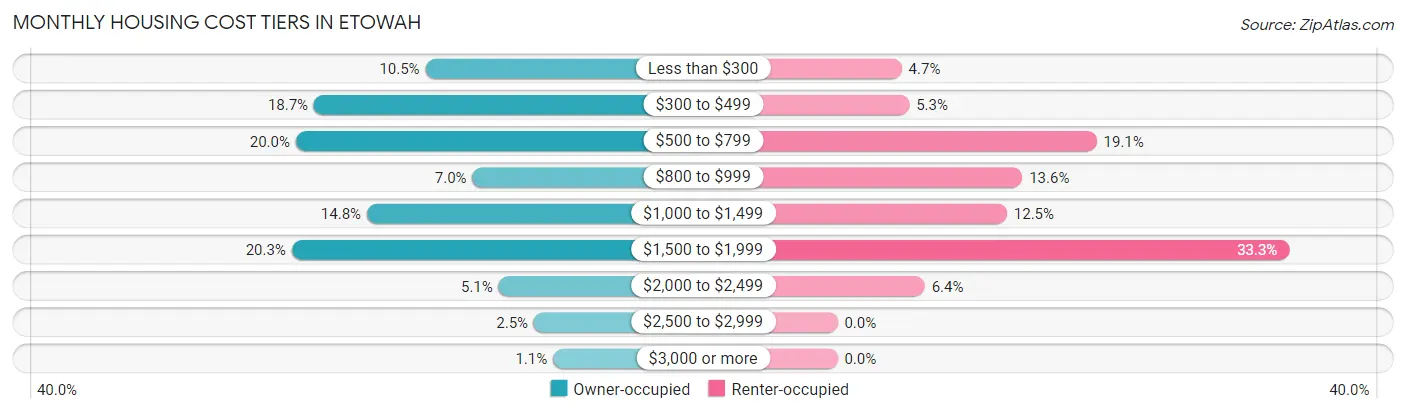
| Monthly Cost | Owner-occupied | Renter-occupied |
| Less than $300 | 282 (10.5%) | 25 (4.7%) |
| $300 to $499 | 503 (18.7%) | 28 (5.3%) |
| $500 to $799 | 539 (20.0%) | 101 (19.1%) |
| $800 to $999 | 189 (7.0%) | 72 (13.6%) |
| $1,000 to $1,499 | 398 (14.8%) | 66 (12.5%) |
| $1,500 to $1,999 | 547 (20.3%) | 176 (33.3%) |
| $2,000 to $2,499 | 137 (5.1%) | 34 (6.4%) |
| $2,500 to $2,999 | 67 (2.5%) | 0 (0.0%) |
| $3,000 or more | 29 (1.1%) | 0 (0.0%) |
| Total | 2,691 (100.0%) | 529 (100.0%) |
Physical Housing Characteristics in Etowah
Housing Structures in Etowah
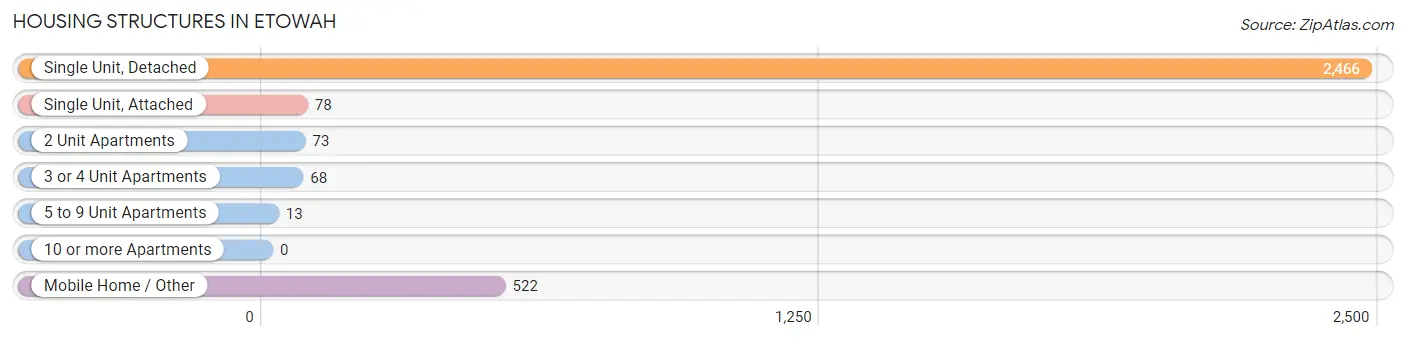
| Structure Type | # Housing Units | % Housing Units |
| Single Unit, Detached | 2,466 | 76.6% |
| Single Unit, Attached | 78 | 2.4% |
| 2 Unit Apartments | 73 | 2.3% |
| 3 or 4 Unit Apartments | 68 | 2.1% |
| 5 to 9 Unit Apartments | 13 | 0.4% |
| 10 or more Apartments | 0 | 0.0% |
| Mobile Home / Other | 522 | 16.2% |
| Total | 3,220 | 100.0% |
Housing Structures by Occupancy in Etowah
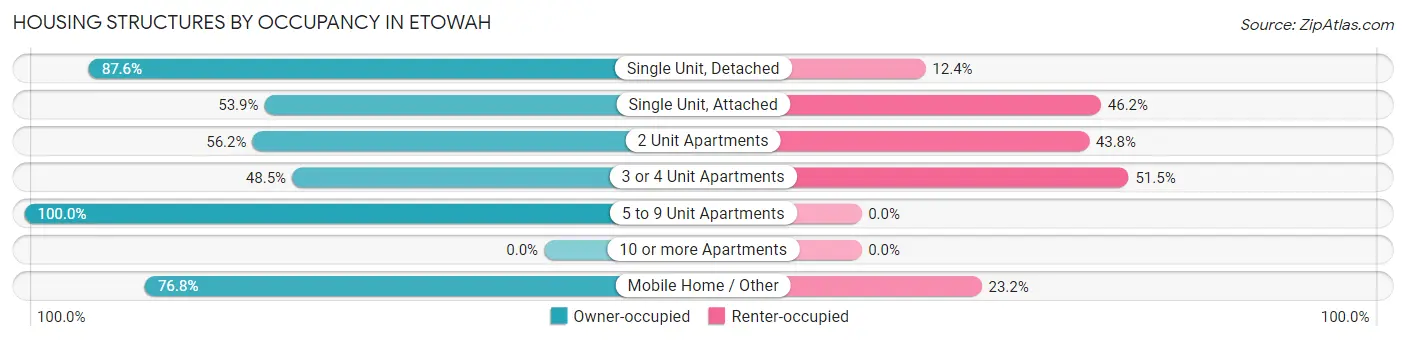
| Structure Type | Owner-occupied | Renter-occupied |
| Single Unit, Detached | 2,161 (87.6%) | 305 (12.4%) |
| Single Unit, Attached | 42 (53.8%) | 36 (46.2%) |
| 2 Unit Apartments | 41 (56.2%) | 32 (43.8%) |
| 3 or 4 Unit Apartments | 33 (48.5%) | 35 (51.5%) |
| 5 to 9 Unit Apartments | 13 (100.0%) | 0 (0.0%) |
| 10 or more Apartments | 0 (0.0%) | 0 (0.0%) |
| Mobile Home / Other | 401 (76.8%) | 121 (23.2%) |
| Total | 2,691 (83.6%) | 529 (16.4%) |
Housing Structures by Number of Rooms in Etowah
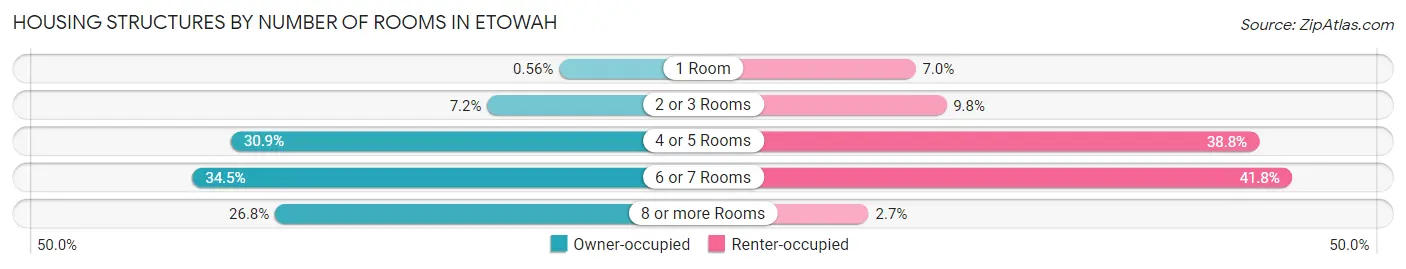
| Number of Rooms | Owner-occupied | Renter-occupied |
| 1 Room | 15 (0.6%) | 37 (7.0%) |
| 2 or 3 Rooms | 194 (7.2%) | 52 (9.8%) |
| 4 or 5 Rooms | 832 (30.9%) | 205 (38.8%) |
| 6 or 7 Rooms | 928 (34.5%) | 221 (41.8%) |
| 8 or more Rooms | 722 (26.8%) | 14 (2.6%) |
| Total | 2,691 (100.0%) | 529 (100.0%) |
Housing Structure by Heating Type in Etowah
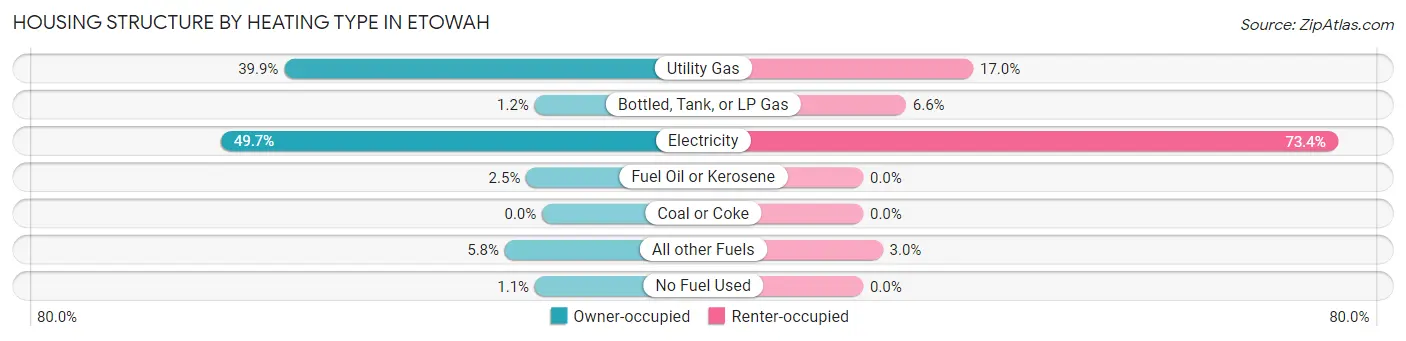
| Heating Type | Owner-occupied | Renter-occupied |
| Utility Gas | 1,073 (39.9%) | 90 (17.0%) |
| Bottled, Tank, or LP Gas | 31 (1.1%) | 35 (6.6%) |
| Electricity | 1,336 (49.6%) | 388 (73.4%) |
| Fuel Oil or Kerosene | 66 (2.5%) | 0 (0.0%) |
| Coal or Coke | 0 (0.0%) | 0 (0.0%) |
| All other Fuels | 155 (5.8%) | 16 (3.0%) |
| No Fuel Used | 30 (1.1%) | 0 (0.0%) |
| Total | 2,691 (100.0%) | 529 (100.0%) |
Household Vehicle Usage in Etowah
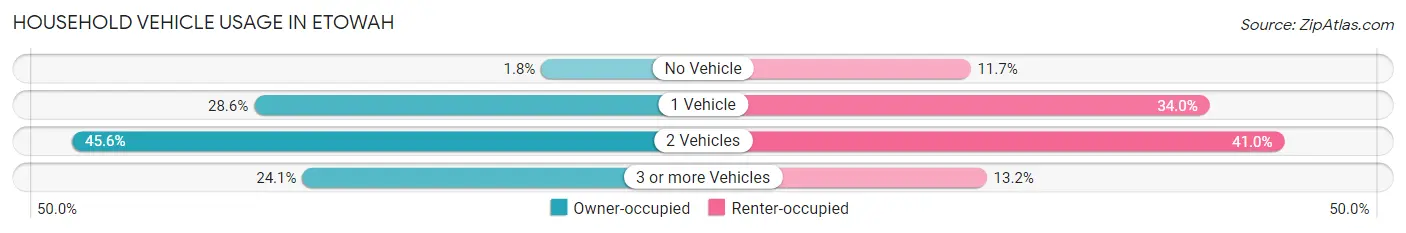
| Vehicles per Household | Owner-occupied | Renter-occupied |
| No Vehicle | 48 (1.8%) | 62 (11.7%) |
| 1 Vehicle | 769 (28.6%) | 180 (34.0%) |
| 2 Vehicles | 1,226 (45.6%) | 217 (41.0%) |
| 3 or more Vehicles | 648 (24.1%) | 70 (13.2%) |
| Total | 2,691 (100.0%) | 529 (100.0%) |
Real Estate & Mortgages in Etowah
Real Estate and Mortgage Overview in Etowah
| Characteristic | Without Mortgage | With Mortgage |
| Housing Units | 1,235 | 1,456 |
| Median Property Value | $311,300 | $297,000 |
| Median Household Income | $58,542 | $160 |
| Monthly Housing Costs | $434 | $29 |
| Real Estate Taxes | $1,630 | $74 |
Property Value by Mortgage Status in Etowah
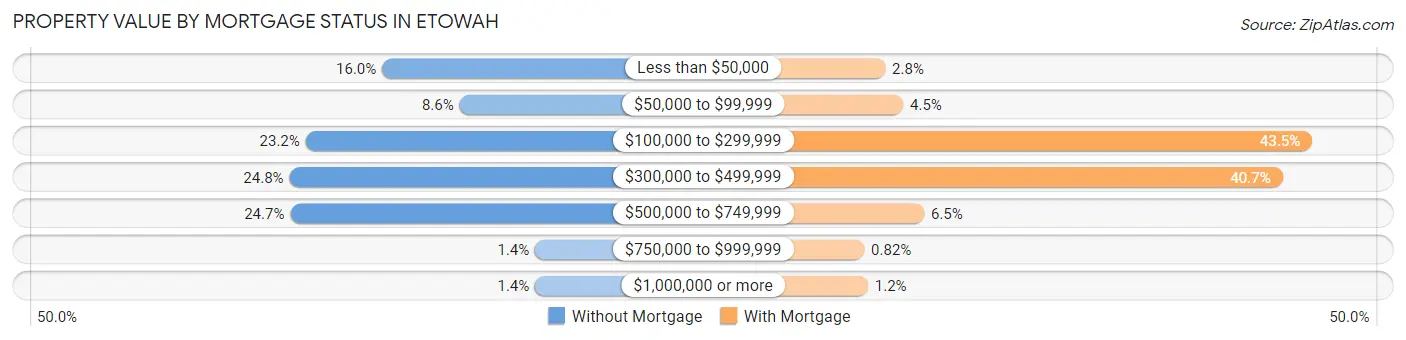
| Property Value | Without Mortgage | With Mortgage |
| Less than $50,000 | 197 (16.0%) | 41 (2.8%) |
| $50,000 to $99,999 | 106 (8.6%) | 66 (4.5%) |
| $100,000 to $299,999 | 287 (23.2%) | 633 (43.5%) |
| $300,000 to $499,999 | 306 (24.8%) | 592 (40.7%) |
| $500,000 to $749,999 | 305 (24.7%) | 95 (6.5%) |
| $750,000 to $999,999 | 17 (1.4%) | 12 (0.8%) |
| $1,000,000 or more | 17 (1.4%) | 17 (1.2%) |
| Total | 1,235 (100.0%) | 1,456 (100.0%) |
Household Income by Mortgage Status in Etowah
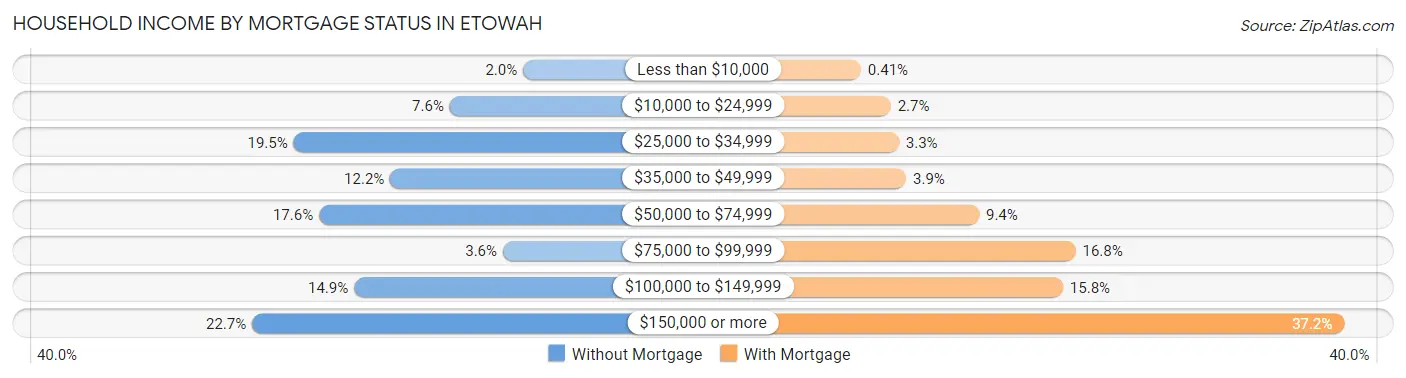
| Household Income | Without Mortgage | With Mortgage |
| Less than $10,000 | 25 (2.0%) | 6 (0.4%) |
| $10,000 to $24,999 | 94 (7.6%) | 39 (2.7%) |
| $25,000 to $34,999 | 241 (19.5%) | 48 (3.3%) |
| $35,000 to $49,999 | 150 (12.1%) | 56 (3.8%) |
| $50,000 to $74,999 | 217 (17.6%) | 137 (9.4%) |
| $75,000 to $99,999 | 44 (3.6%) | 244 (16.8%) |
| $100,000 to $149,999 | 184 (14.9%) | 230 (15.8%) |
| $150,000 or more | 280 (22.7%) | 542 (37.2%) |
| Total | 1,235 (100.0%) | 1,456 (100.0%) |
Property Value to Household Income Ratio in Etowah
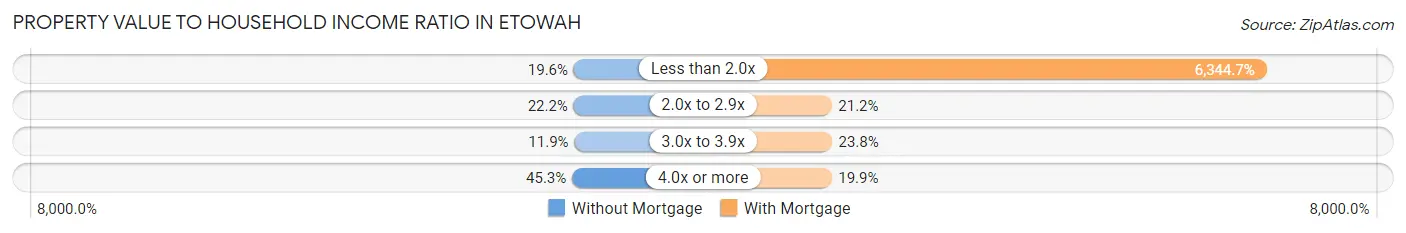
| Value-to-Income Ratio | Without Mortgage | With Mortgage |
| Less than 2.0x | 242 (19.6%) | 92,379 (6,344.7%) |
| 2.0x to 2.9x | 274 (22.2%) | 308 (21.1%) |
| 3.0x to 3.9x | 147 (11.9%) | 347 (23.8%) |
| 4.0x or more | 560 (45.3%) | 290 (19.9%) |
| Total | 1,235 (100.0%) | 1,456 (100.0%) |
Real Estate Taxes by Mortgage Status in Etowah
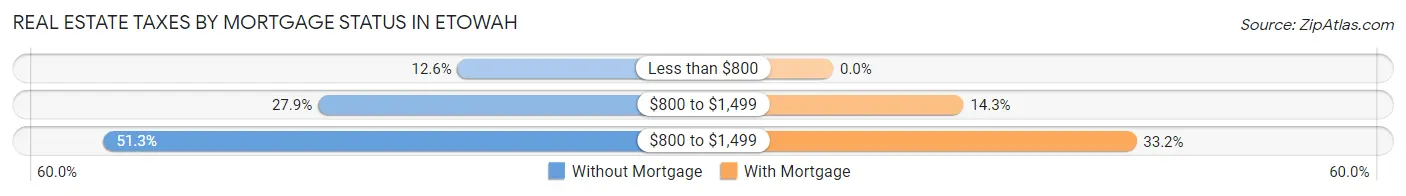
| Property Taxes | Without Mortgage | With Mortgage |
| Less than $800 | 155 (12.6%) | 0 (0.0%) |
| $800 to $1,499 | 344 (27.9%) | 208 (14.3%) |
| $800 to $1,499 | 634 (51.3%) | 484 (33.2%) |
| Total | 1,235 (100.0%) | 1,456 (100.0%) |
Health & Disability in Etowah
Health Insurance Coverage by Age in Etowah
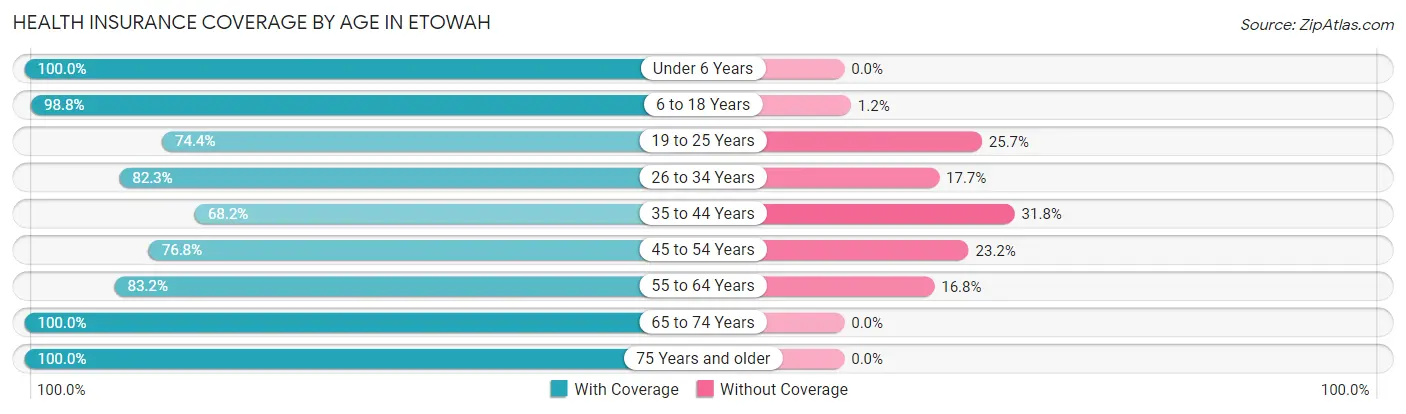
| Age Bracket | With Coverage | Without Coverage |
| Under 6 Years | 566 (100.0%) | 0 (0.0%) |
| 6 to 18 Years | 725 (98.8%) | 9 (1.2%) |
| 19 to 25 Years | 429 (74.4%) | 148 (25.7%) |
| 26 to 34 Years | 666 (82.3%) | 143 (17.7%) |
| 35 to 44 Years | 569 (68.2%) | 265 (31.8%) |
| 45 to 54 Years | 623 (76.8%) | 188 (23.2%) |
| 55 to 64 Years | 1,012 (83.2%) | 204 (16.8%) |
| 65 to 74 Years | 1,292 (100.0%) | 0 (0.0%) |
| 75 Years and older | 850 (100.0%) | 0 (0.0%) |
| Total | 6,732 (87.5%) | 957 (12.4%) |
Health Insurance Coverage by Citizenship Status in Etowah
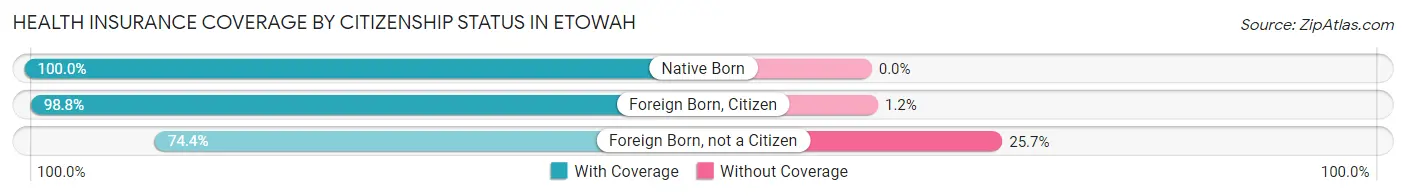
| Citizenship Status | With Coverage | Without Coverage |
| Native Born | 566 (100.0%) | 0 (0.0%) |
| Foreign Born, Citizen | 725 (98.8%) | 9 (1.2%) |
| Foreign Born, not a Citizen | 429 (74.4%) | 148 (25.7%) |
Health Insurance Coverage by Household Income in Etowah
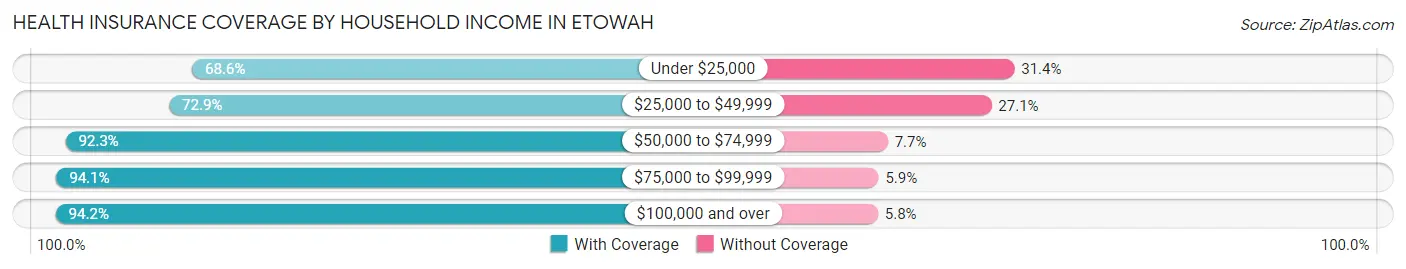
| Household Income | With Coverage | Without Coverage |
| Under $25,000 | 363 (68.6%) | 166 (31.4%) |
| $25,000 to $49,999 | 1,192 (72.9%) | 443 (27.1%) |
| $50,000 to $74,999 | 1,266 (92.3%) | 105 (7.7%) |
| $75,000 to $99,999 | 1,014 (94.1%) | 64 (5.9%) |
| $100,000 and over | 2,897 (94.2%) | 179 (5.8%) |
Public vs Private Health Insurance Coverage by Age in Etowah
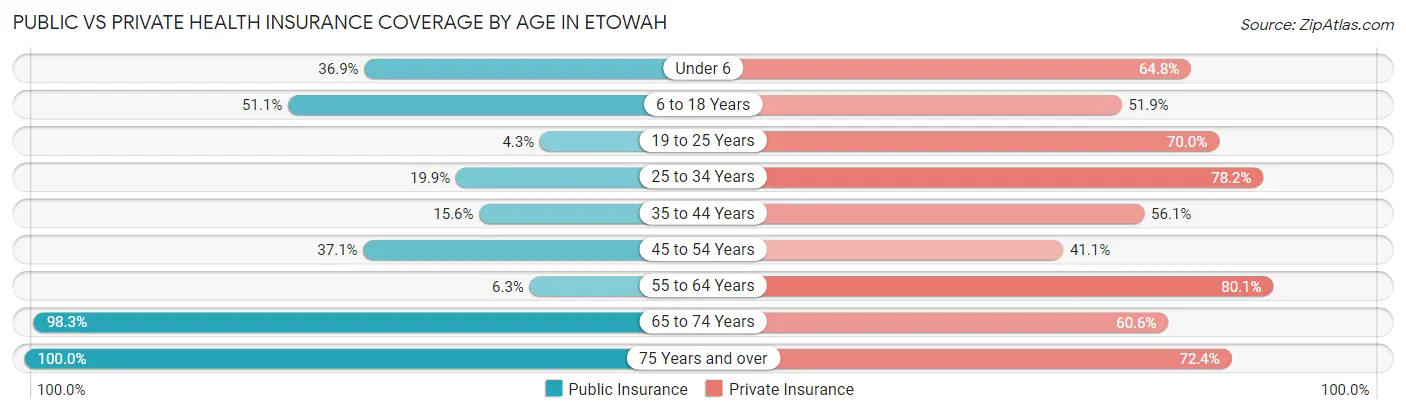
| Age Bracket | Public Insurance | Private Insurance |
| Under 6 | 209 (36.9%) | 367 (64.8%) |
| 6 to 18 Years | 375 (51.1%) | 381 (51.9%) |
| 19 to 25 Years | 25 (4.3%) | 404 (70.0%) |
| 25 to 34 Years | 161 (19.9%) | 633 (78.2%) |
| 35 to 44 Years | 130 (15.6%) | 468 (56.1%) |
| 45 to 54 Years | 301 (37.1%) | 333 (41.1%) |
| 55 to 64 Years | 76 (6.2%) | 974 (80.1%) |
| 65 to 74 Years | 1,270 (98.3%) | 783 (60.6%) |
| 75 Years and over | 850 (100.0%) | 615 (72.4%) |
| Total | 3,397 (44.2%) | 4,958 (64.5%) |
Disability Status by Sex by Age in Etowah
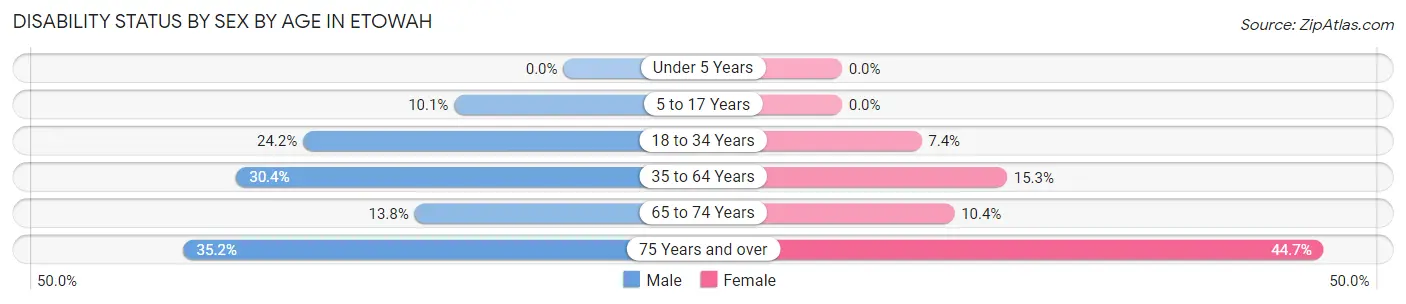
| Age Bracket | Male | Female |
| Under 5 Years | 0 (0.0%) | 0 (0.0%) |
| 5 to 17 Years | 54 (10.1%) | 0 (0.0%) |
| 18 to 34 Years | 158 (24.2%) | 54 (7.4%) |
| 35 to 64 Years | 444 (30.3%) | 214 (15.3%) |
| 65 to 74 Years | 95 (13.8%) | 63 (10.4%) |
| 75 Years and over | 160 (35.2%) | 177 (44.7%) |
Disability Class by Sex by Age in Etowah
Disability Class: Hearing Difficulty
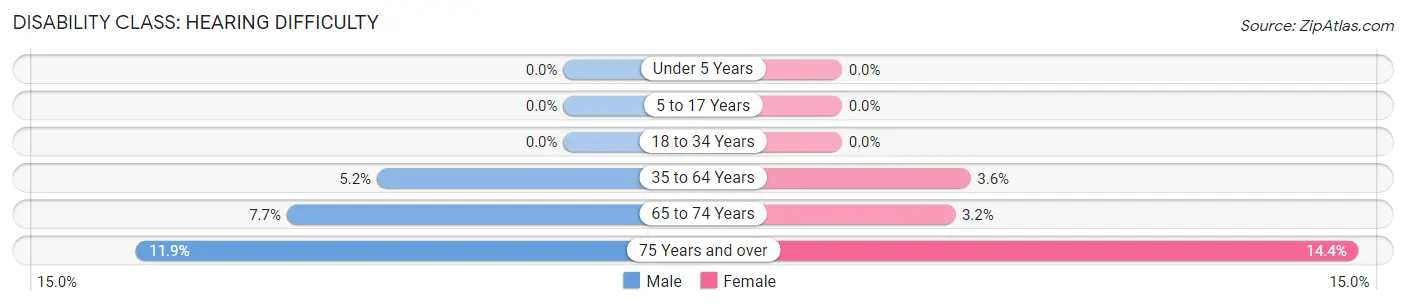
| Age Bracket | Male | Female |
| Under 5 Years | 0 (0.0%) | 0 (0.0%) |
| 5 to 17 Years | 0 (0.0%) | 0 (0.0%) |
| 18 to 34 Years | 0 (0.0%) | 0 (0.0%) |
| 35 to 64 Years | 76 (5.2%) | 50 (3.6%) |
| 65 to 74 Years | 53 (7.7%) | 19 (3.2%) |
| 75 Years and over | 54 (11.9%) | 57 (14.4%) |
Disability Class: Vision Difficulty
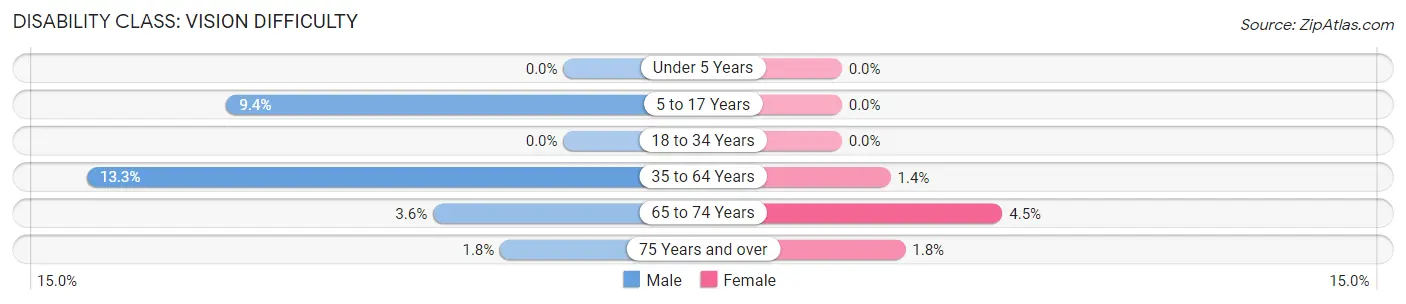
| Age Bracket | Male | Female |
| Under 5 Years | 0 (0.0%) | 0 (0.0%) |
| 5 to 17 Years | 50 (9.4%) | 0 (0.0%) |
| 18 to 34 Years | 0 (0.0%) | 0 (0.0%) |
| 35 to 64 Years | 194 (13.3%) | 19 (1.4%) |
| 65 to 74 Years | 25 (3.6%) | 27 (4.5%) |
| 75 Years and over | 8 (1.8%) | 7 (1.8%) |
Disability Class: Cognitive Difficulty
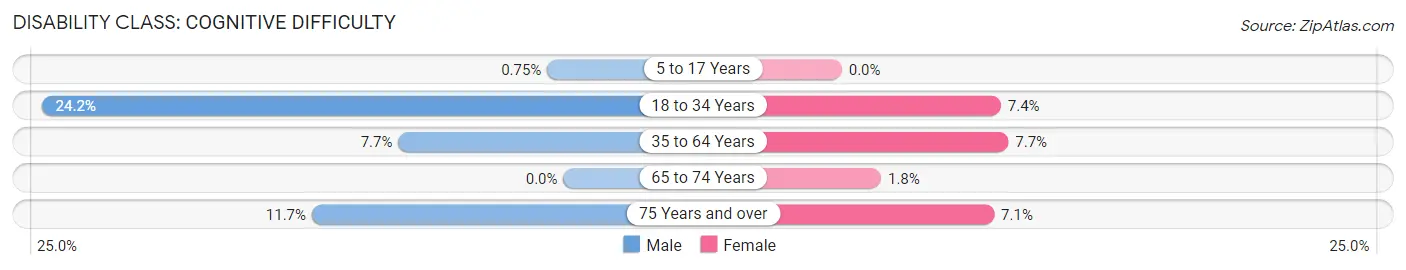
| Age Bracket | Male | Female |
| 5 to 17 Years | 4 (0.7%) | 0 (0.0%) |
| 18 to 34 Years | 158 (24.2%) | 54 (7.4%) |
| 35 to 64 Years | 112 (7.7%) | 108 (7.7%) |
| 65 to 74 Years | 0 (0.0%) | 11 (1.8%) |
| 75 Years and over | 53 (11.7%) | 28 (7.1%) |
Disability Class: Ambulatory Difficulty
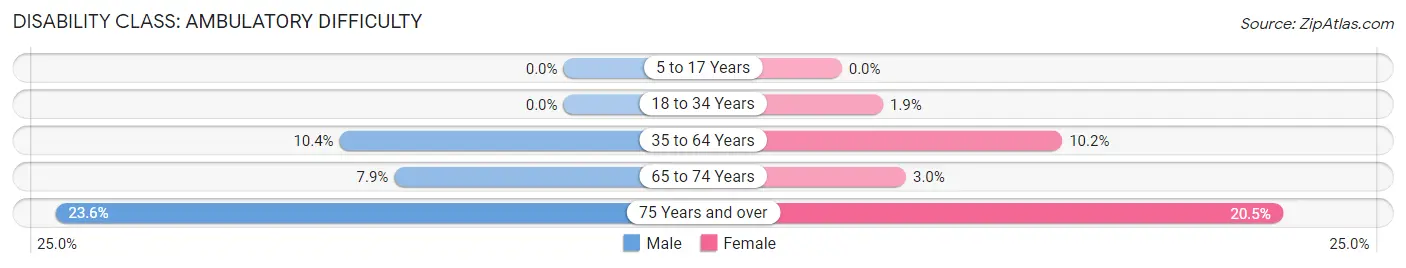
| Age Bracket | Male | Female |
| 5 to 17 Years | 0 (0.0%) | 0 (0.0%) |
| 18 to 34 Years | 0 (0.0%) | 14 (1.9%) |
| 35 to 64 Years | 152 (10.4%) | 143 (10.2%) |
| 65 to 74 Years | 54 (7.9%) | 18 (3.0%) |
| 75 Years and over | 107 (23.6%) | 81 (20.4%) |
Disability Class: Self-Care Difficulty
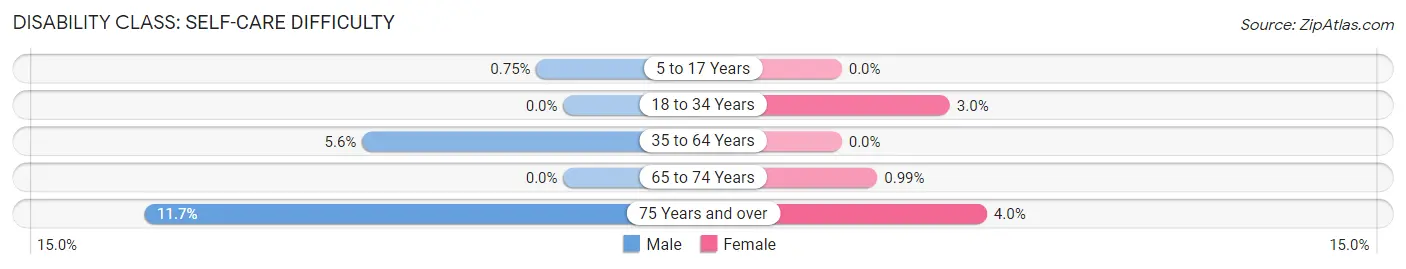
| Age Bracket | Male | Female |
| 5 to 17 Years | 4 (0.7%) | 0 (0.0%) |
| 18 to 34 Years | 0 (0.0%) | 22 (3.0%) |
| 35 to 64 Years | 82 (5.6%) | 0 (0.0%) |
| 65 to 74 Years | 0 (0.0%) | 6 (1.0%) |
| 75 Years and over | 53 (11.7%) | 16 (4.0%) |
Technology Access in Etowah
Computing Device Access in Etowah
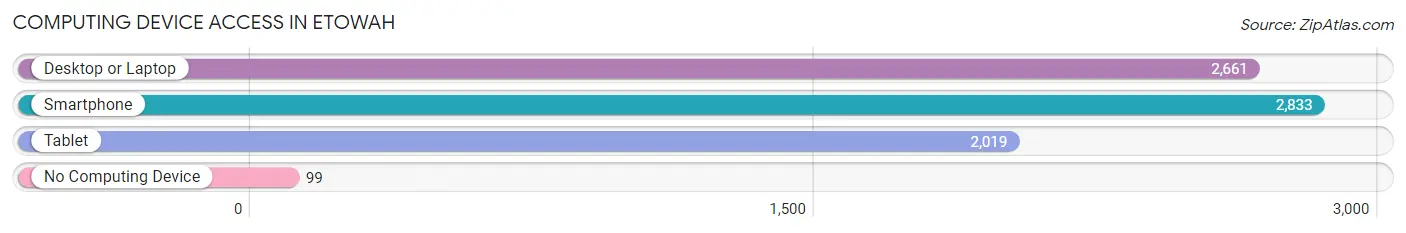
| Device Type | # Households | % Households |
| Desktop or Laptop | 2,661 | 82.6% |
| Smartphone | 2,833 | 88.0% |
| Tablet | 2,019 | 62.7% |
| No Computing Device | 99 | 3.1% |
| Total | 3,220 | 100.0% |
Internet Access in Etowah
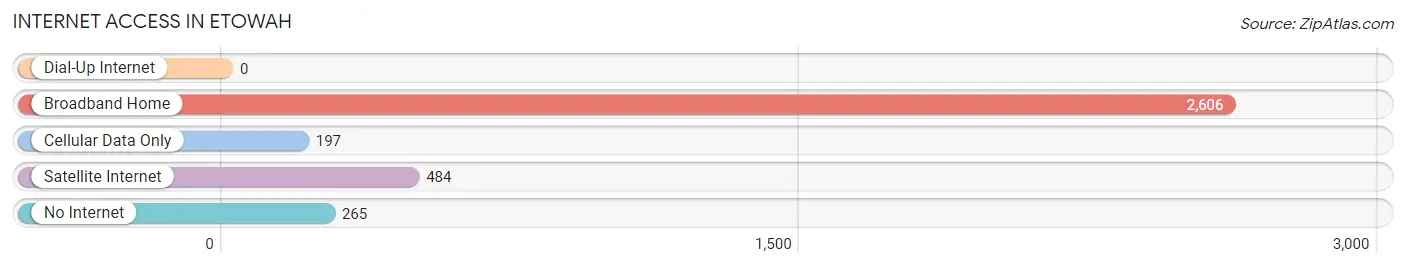
| Internet Type | # Households | % Households |
| Dial-Up Internet | 0 | 0.0% |
| Broadband Home | 2,606 | 80.9% |
| Cellular Data Only | 197 | 6.1% |
| Satellite Internet | 484 | 15.0% |
| No Internet | 265 | 8.2% |
| Total | 3,220 | 100.0% |
Etowah Summary
Etowah is a small town located in Henderson County, North Carolina. It is situated in the foothills of the Blue Ridge Mountains, about 25 miles south of Asheville. The town was founded in 1891 and has a population of approximately 1,000 people.
Geography
Etowah is located in the foothills of the Blue Ridge Mountains, about 25 miles south of Asheville. The town is situated in a valley surrounded by mountains, with the French Broad River running through it. The town is located at an elevation of 1,400 feet above sea level. The climate is mild, with temperatures ranging from the mid-30s in the winter to the mid-80s in the summer.
Economy
The economy of Etowah is largely based on agriculture and tourism. The town is home to several farms, which produce a variety of crops, including corn, soybeans, and hay. The town also has a number of small businesses, including restaurants, shops, and a local winery. Tourism is also an important part of the local economy, with visitors coming to the area to enjoy the scenic beauty of the Blue Ridge Mountains.
Demographics
As of the 2010 census, the population of Etowah was 1,000 people. The racial makeup of the town was 95.2% White, 1.2% African American, 0.7% Native American, 0.3% Asian, and 2.6% from other races. The median household income was $37,500, and the median age was 44.
History
Etowah was founded in 1891 by a group of settlers from Tennessee. The town was named after the Cherokee word for “meeting place”, and was originally intended to be a trading post. The town quickly grew, and by the early 1900s, it had become a thriving community. The town was home to several businesses, including a general store, a blacksmith shop, and a grist mill.
In the early 1900s, the town was also home to a number of churches, including the Etowah Methodist Church, which was founded in 1891. The town also had a school, which was established in 1895.
In the late 1900s, the town began to decline, as many of the businesses and churches closed. However, in recent years, the town has seen a resurgence, with new businesses and restaurants opening up. The town is now a popular destination for tourists, who come to enjoy the scenic beauty of the Blue Ridge Mountains.
Conclusion
Etowah is a small town located in Henderson County, North Carolina. It is situated in the foothills of the Blue Ridge Mountains, about 25 miles south of Asheville. The town was founded in 1891 and has a population of approximately 1,000 people. The economy of Etowah is largely based on agriculture and tourism, and the town is home to several farms, businesses, and churches. The town has seen a resurgence in recent years, with new businesses and restaurants opening up, and is now a popular destination for tourists.
Common Questions
What is Per Capita Income in Etowah?
Per Capita income in Etowah is $38,815.
What is the Median Family Income in Etowah?
Median Family Income in Etowah is $88,397.
What is the Median Household income in Etowah?
Median Household Income in Etowah is $76,071.
What is Income or Wage Gap in Etowah?
Income or Wage Gap in Etowah is 20.6%.
Women in Etowah earn 79.4 cents for every dollar earned by a man.
What is Inequality or Gini Index in Etowah?
Inequality or Gini Index in Etowah is 0.42.
What is the Total Population of Etowah?
Total Population of Etowah is 7,689.
What is the Total Male Population of Etowah?
Total Male Population of Etowah is 4,002.
What is the Total Female Population of Etowah?
Total Female Population of Etowah is 3,687.
What is the Ratio of Males per 100 Females in Etowah?
There are 108.54 Males per 100 Females in Etowah.
What is the Ratio of Females per 100 Males in Etowah?
There are 92.13 Females per 100 Males in Etowah.
What is the Median Population Age in Etowah?
Median Population Age in Etowah is 48.3 Years.
What is the Average Family Size in Etowah
Average Family Size in Etowah is 2.6 People.
What is the Average Household Size in Etowah
Average Household Size in Etowah is 2.4 People.
How Large is the Labor Force in Etowah?
There are 3,623 People in the Labor Forcein in Etowah.
What is the Percentage of People in the Labor Force in Etowah?
55.3% of People are in the Labor Force in Etowah.
What is the Unemployment Rate in Etowah?
Unemployment Rate in Etowah is 1.0%.