Harrisburg, NC Map & Demographics
Harrisburg Map
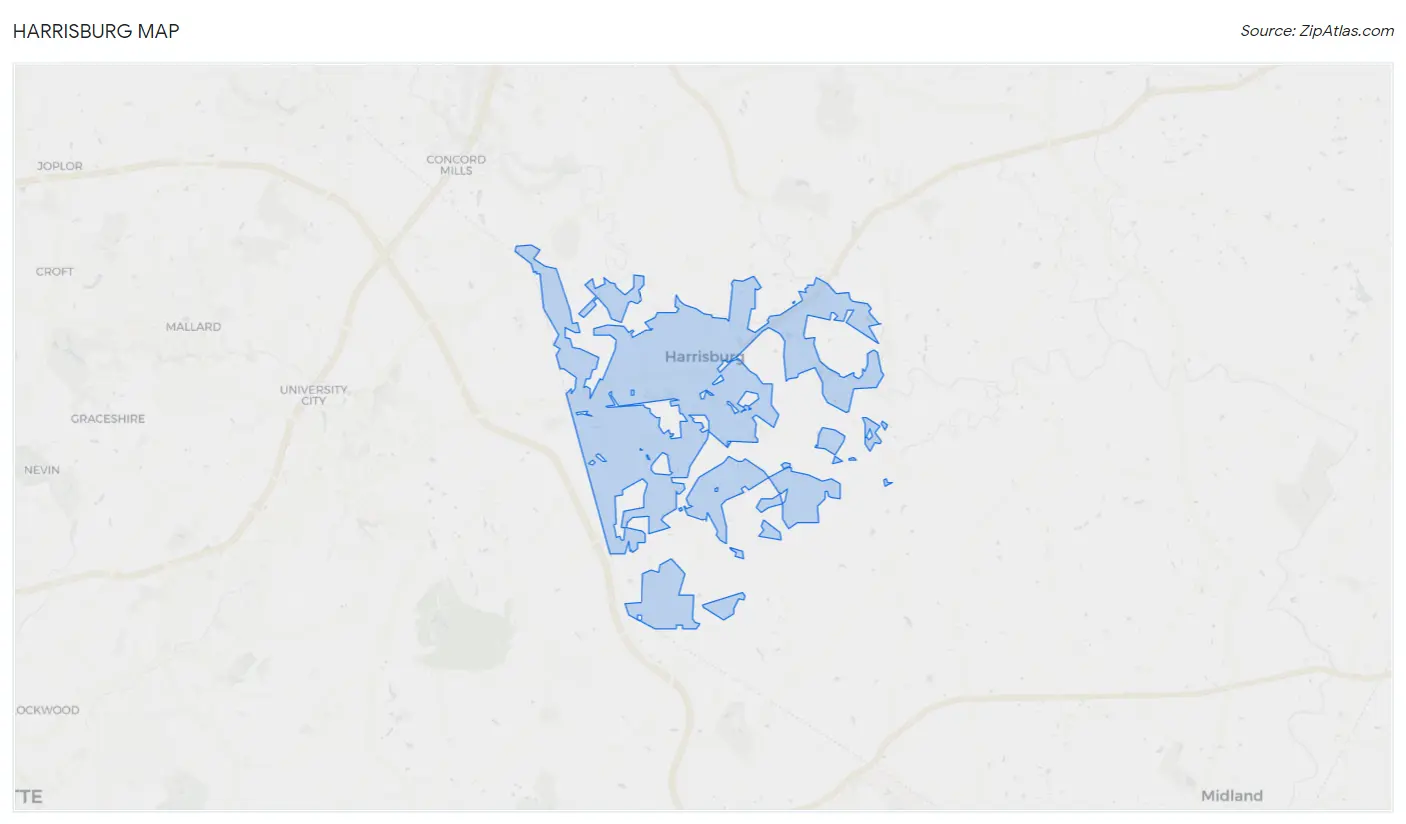
Harrisburg Overview
$45,365
PER CAPITA INCOME
$144,021
AVG FAMILY INCOME
$134,767
AVG HOUSEHOLD INCOME
43.4%
WAGE / INCOME GAP [ % ]
56.6¢/ $1
WAGE / INCOME GAP [ $ ]
0.34
INEQUALITY / GINI INDEX
18,934
TOTAL POPULATION
8,639
MALE POPULATION
10,295
FEMALE POPULATION
83.91
MALES / 100 FEMALES
119.17
FEMALES / 100 MALES
36.4
MEDIAN AGE
3.7
AVG FAMILY SIZE
3.4
AVG HOUSEHOLD SIZE
10,113
LABOR FORCE [ PEOPLE ]
70.0%
PERCENT IN LABOR FORCE
3.4%
UNEMPLOYMENT RATE
Harrisburg Zip Codes
Income in Harrisburg
Income Overview in Harrisburg
Per Capita Income in Harrisburg is $45,365, while median incomes of families and households are $144,021 and $134,767 respectively.
| Characteristic | Number | Measure |
| Per Capita Income | 18,934 | $45,365 |
| Median Family Income | 4,803 | $144,021 |
| Mean Family Income | 4,803 | $157,798 |
| Median Household Income | 5,508 | $134,767 |
| Mean Household Income | 5,508 | $148,747 |
| Income Deficit | 4,803 | $0 |
| Wage / Income Gap (%) | 18,934 | 43.38% |
| Wage / Income Gap ($) | 18,934 | 56.62¢ per $1 |
| Gini / Inequality Index | 18,934 | 0.34 |
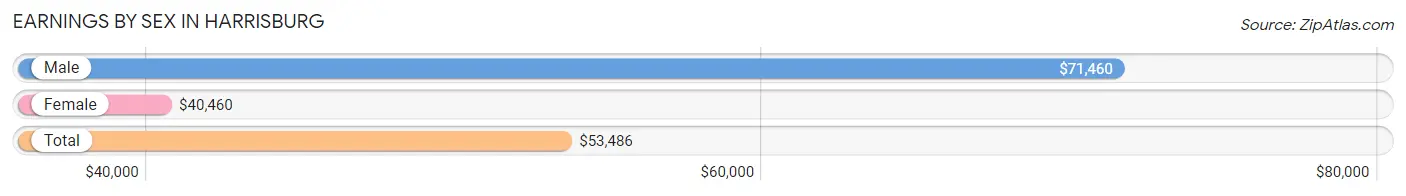
Earnings by Sex in Harrisburg
Average Earnings in Harrisburg are $53,486, $71,460 for men and $40,460 for women, a difference of 43.4%.
| Sex | Number | Average Earnings |
| Male | 5,467 (51.4%) | $71,460 |
| Female | 5,176 (48.6%) | $40,460 |
| Total | 10,643 (100.0%) | $53,486 |
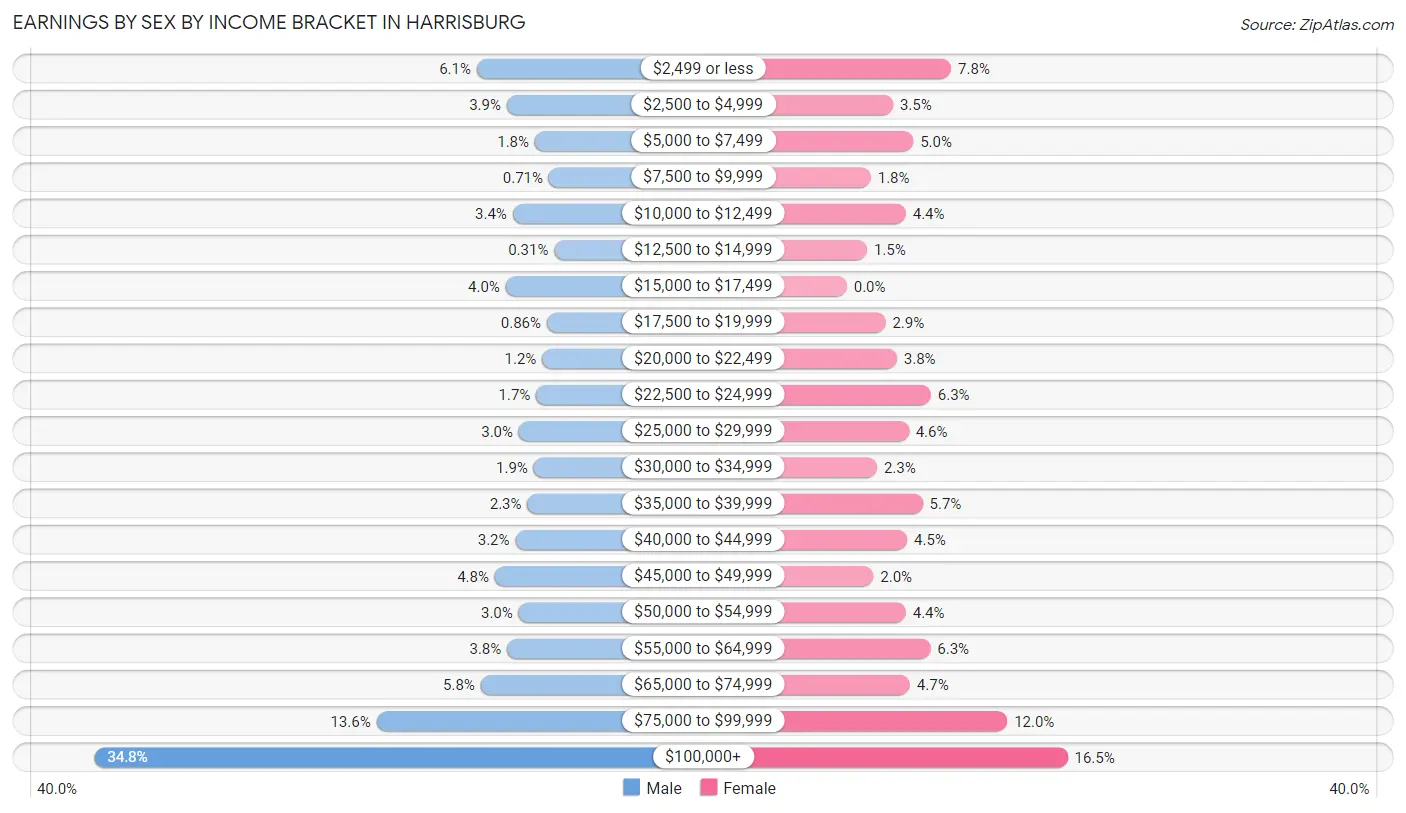
Earnings by Sex by Income Bracket in Harrisburg
The most common earnings brackets in Harrisburg are $100,000+ for men (1,901 | 34.8%) and $100,000+ for women (856 | 16.5%).
| Income | Male | Female |
| $2,499 or less | 334 (6.1%) | 405 (7.8%) |
| $2,500 to $4,999 | 211 (3.9%) | 179 (3.5%) |
| $5,000 to $7,499 | 96 (1.8%) | 258 (5.0%) |
| $7,500 to $9,999 | 39 (0.7%) | 93 (1.8%) |
| $10,000 to $12,499 | 187 (3.4%) | 229 (4.4%) |
| $12,500 to $14,999 | 17 (0.3%) | 78 (1.5%) |
| $15,000 to $17,499 | 216 (4.0%) | 0 (0.0%) |
| $17,500 to $19,999 | 47 (0.9%) | 150 (2.9%) |
| $20,000 to $22,499 | 66 (1.2%) | 194 (3.7%) |
| $22,500 to $24,999 | 91 (1.7%) | 326 (6.3%) |
| $25,000 to $29,999 | 162 (3.0%) | 240 (4.6%) |
| $30,000 to $34,999 | 101 (1.8%) | 117 (2.3%) |
| $35,000 to $39,999 | 127 (2.3%) | 294 (5.7%) |
| $40,000 to $44,999 | 176 (3.2%) | 234 (4.5%) |
| $45,000 to $49,999 | 260 (4.8%) | 103 (2.0%) |
| $50,000 to $54,999 | 163 (3.0%) | 229 (4.4%) |
| $55,000 to $64,999 | 210 (3.8%) | 324 (6.3%) |
| $65,000 to $74,999 | 318 (5.8%) | 245 (4.7%) |
| $75,000 to $99,999 | 745 (13.6%) | 622 (12.0%) |
| $100,000+ | 1,901 (34.8%) | 856 (16.5%) |
| Total | 5,467 (100.0%) | 5,176 (100.0%) |
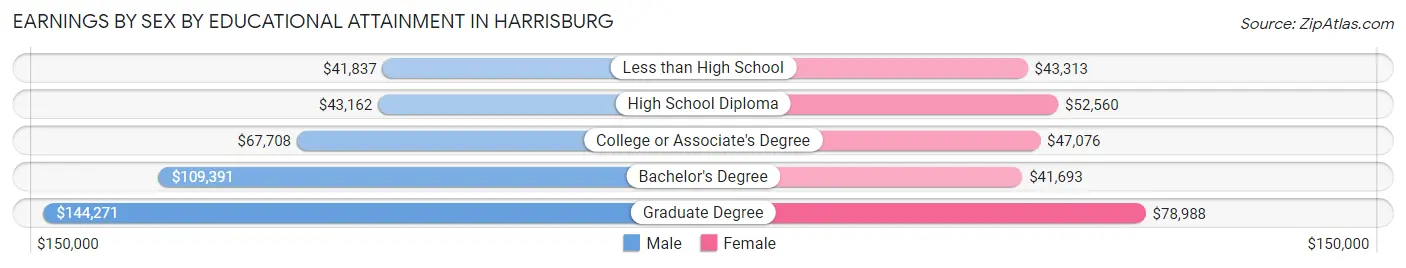
Earnings by Sex by Educational Attainment in Harrisburg
Average earnings in Harrisburg are $86,723 for men and $52,783 for women, a difference of 39.1%. Men with an educational attainment of graduate degree enjoy the highest average annual earnings of $144,271, while those with less than high school education earn the least with $41,837. Women with an educational attainment of graduate degree earn the most with the average annual earnings of $78,988, while those with bachelor's degree education have the smallest earnings of $41,693.
| Educational Attainment | Male Income | Female Income |
| Less than High School | $41,837 | $43,313 |
| High School Diploma | $43,162 | $52,560 |
| College or Associate's Degree | $67,708 | $47,076 |
| Bachelor's Degree | $109,391 | $41,693 |
| Graduate Degree | $144,271 | $78,988 |
| Total | $86,723 | $52,783 |
Family Income in Harrisburg
Family Income Brackets in Harrisburg
According to the Harrisburg family income data, there are 1,143 families falling into the $200,000+ income range, which is the most common income bracket and makes up 23.8% of all families. Conversely, the less than $10,000 income bracket is the least frequent group with only 19 families (0.4%) belonging to this category.
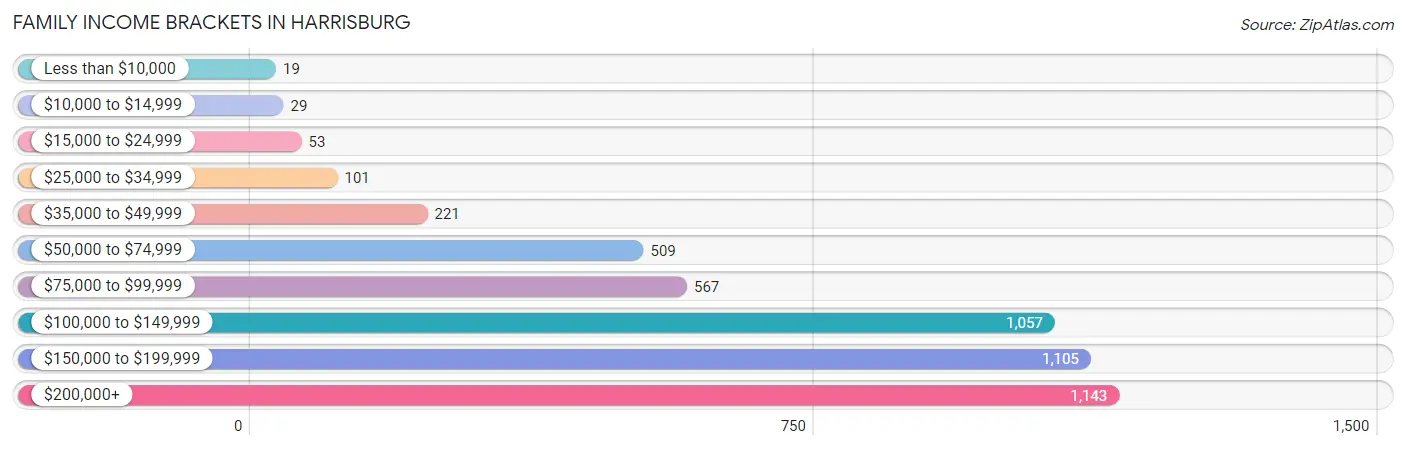
| Income Bracket | # Families | % Families |
| Less than $10,000 | 19 | 0.4% |
| $10,000 to $14,999 | 29 | 0.6% |
| $15,000 to $24,999 | 53 | 1.1% |
| $25,000 to $34,999 | 101 | 2.1% |
| $35,000 to $49,999 | 221 | 4.6% |
| $50,000 to $74,999 | 509 | 10.6% |
| $75,000 to $99,999 | 567 | 11.8% |
| $100,000 to $149,999 | 1,057 | 22.0% |
| $150,000 to $199,999 | 1,105 | 23.0% |
| $200,000+ | 1,143 | 23.8% |
Family Income by Famaliy Size in Harrisburg
6-person families (125 | 2.6%) account for the highest median family income in Harrisburg with $250,001 per family, while 2-person families (1,627 | 33.9%) have the highest median income of $51,132 per family member.
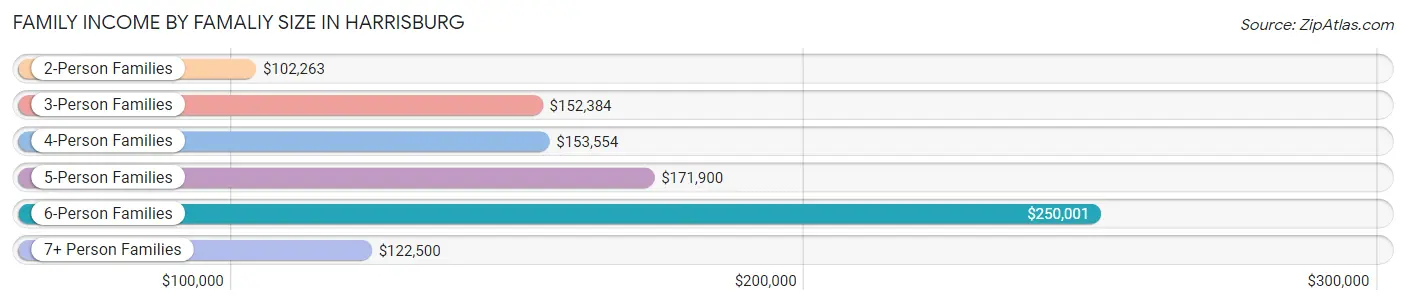
| Income Bracket | # Families | Median Income |
| 2-Person Families | 1,627 (33.9%) | $102,263 |
| 3-Person Families | 1,086 (22.6%) | $152,384 |
| 4-Person Families | 1,431 (29.8%) | $153,554 |
| 5-Person Families | 458 (9.5%) | $171,900 |
| 6-Person Families | 125 (2.6%) | $250,001 |
| 7+ Person Families | 76 (1.6%) | $122,500 |
| Total | 4,803 (100.0%) | $144,021 |
Family Income by Number of Earners in Harrisburg
The median family income in Harrisburg is $144,021, with families comprising 2 earners (2,279) having the highest median family income of $165,592, while families with no earners (381) have the lowest median family income of $68,807, accounting for 47.4% and 7.9% of families, respectively.
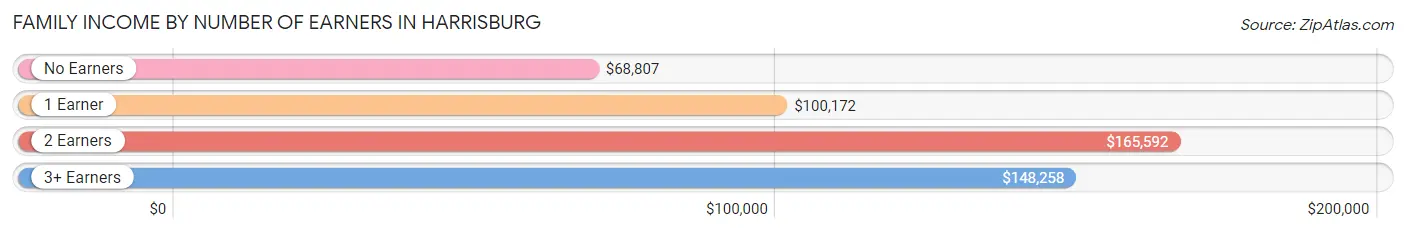
| Number of Earners | # Families | Median Income |
| No Earners | 381 (7.9%) | $68,807 |
| 1 Earner | 1,201 (25.0%) | $100,172 |
| 2 Earners | 2,279 (47.4%) | $165,592 |
| 3+ Earners | 942 (19.6%) | $148,258 |
| Total | 4,803 (100.0%) | $144,021 |
Household Income in Harrisburg
Household Income Brackets in Harrisburg
With 1,245 households falling in the category, the $100,000 to $149,999 income range is the most frequent in Harrisburg, accounting for 22.6% of all households. In contrast, only 28 households (0.5%) fall into the less than $10,000 income bracket, making it the least populous group.
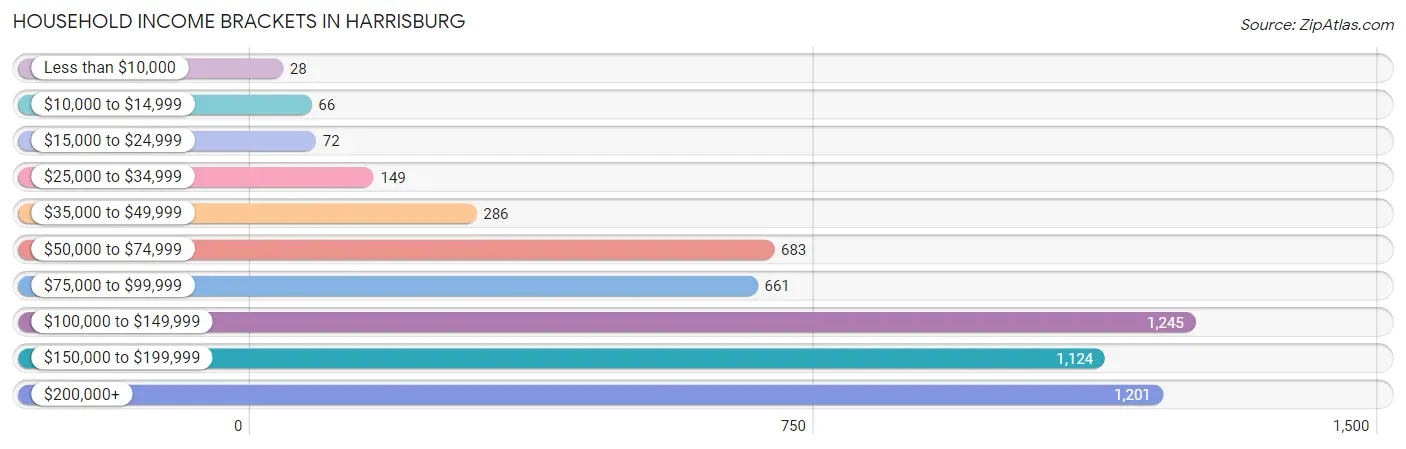
| Income Bracket | # Households | % Households |
| Less than $10,000 | 28 | 0.5% |
| $10,000 to $14,999 | 66 | 1.2% |
| $15,000 to $24,999 | 72 | 1.3% |
| $25,000 to $34,999 | 149 | 2.7% |
| $35,000 to $49,999 | 286 | 5.2% |
| $50,000 to $74,999 | 683 | 12.4% |
| $75,000 to $99,999 | 661 | 12.0% |
| $100,000 to $149,999 | 1,245 | 22.6% |
| $150,000 to $199,999 | 1,124 | 20.4% |
| $200,000+ | 1,201 | 21.8% |
Household Income by Householder Age in Harrisburg
The median household income in Harrisburg is $134,767, with the highest median household income of $159,044 found in the 25 to 44 years age bracket for the primary householder. A total of 1,767 households (32.1%) fall into this category. Meanwhile, the 15 to 24 years age bracket for the primary householder has the lowest median household income of $0, with 76 households (1.4%) in this group.
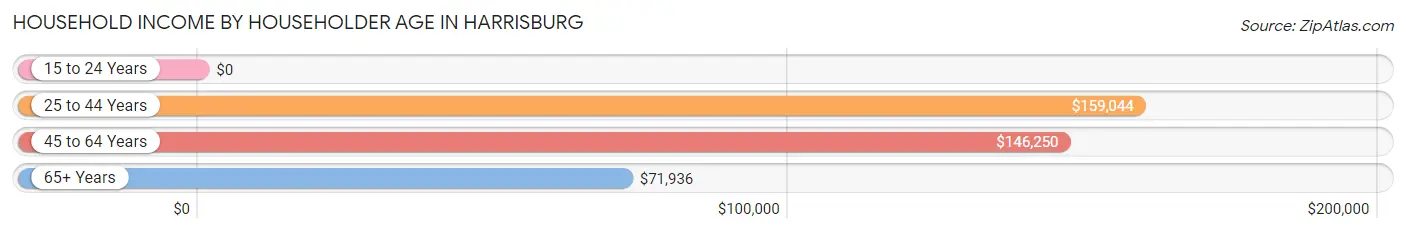
| Income Bracket | # Households | Median Income |
| 15 to 24 Years | 76 (1.4%) | $0 |
| 25 to 44 Years | 1,767 (32.1%) | $159,044 |
| 45 to 64 Years | 2,804 (50.9%) | $146,250 |
| 65+ Years | 861 (15.6%) | $71,936 |
| Total | 5,508 (100.0%) | $134,767 |
Poverty in Harrisburg
Income Below Poverty by Sex and Age in Harrisburg
With 1.8% poverty level for males and 3.7% for females among the residents of Harrisburg, 25 to 34 year old males and 18 to 24 year old females are the most vulnerable to poverty, with 63 males (9.6%) and 121 females (11.8%) in their respective age groups living below the poverty level.
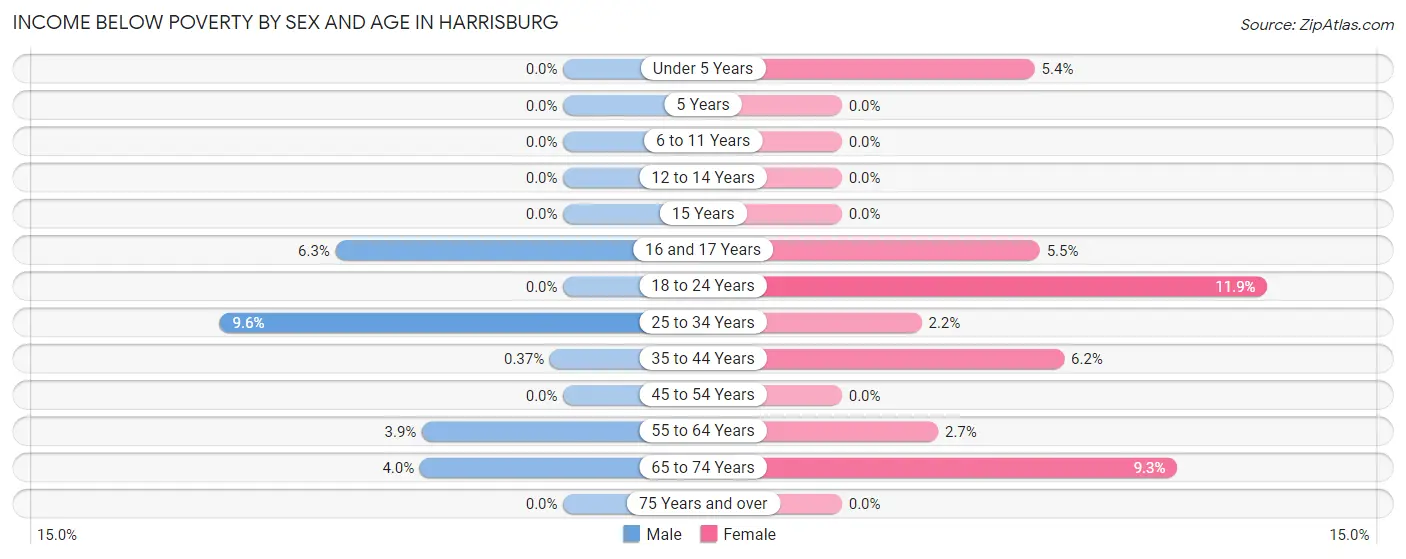
| Age Bracket | Male | Female |
| Under 5 Years | 0 (0.0%) | 38 (5.4%) |
| 5 Years | 0 (0.0%) | 0 (0.0%) |
| 6 to 11 Years | 0 (0.0%) | 0 (0.0%) |
| 12 to 14 Years | 0 (0.0%) | 0 (0.0%) |
| 15 Years | 0 (0.0%) | 0 (0.0%) |
| 16 and 17 Years | 32 (6.3%) | 28 (5.5%) |
| 18 to 24 Years | 0 (0.0%) | 121 (11.8%) |
| 25 to 34 Years | 63 (9.6%) | 21 (2.2%) |
| 35 to 44 Years | 5 (0.4%) | 90 (6.2%) |
| 45 to 54 Years | 0 (0.0%) | 0 (0.0%) |
| 55 to 64 Years | 36 (3.9%) | 25 (2.7%) |
| 65 to 74 Years | 23 (4.0%) | 57 (9.3%) |
| 75 Years and over | 0 (0.0%) | 0 (0.0%) |
| Total | 159 (1.8%) | 380 (3.7%) |
Income Above Poverty by Sex and Age in Harrisburg
According to the poverty statistics in Harrisburg, males aged under 5 years and females aged 5 years are the age groups that are most secure financially, with 100.0% of males and 100.0% of females in these age groups living above the poverty line.
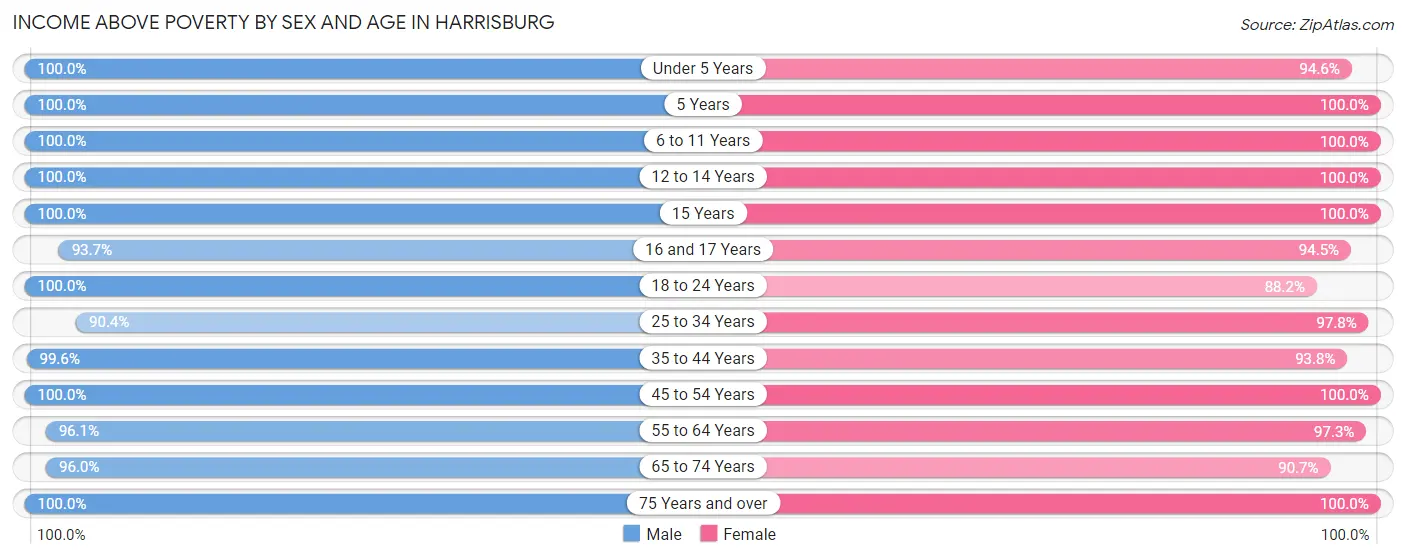
| Age Bracket | Male | Female |
| Under 5 Years | 402 (100.0%) | 670 (94.6%) |
| 5 Years | 105 (100.0%) | 293 (100.0%) |
| 6 to 11 Years | 891 (100.0%) | 958 (100.0%) |
| 12 to 14 Years | 365 (100.0%) | 444 (100.0%) |
| 15 Years | 137 (100.0%) | 149 (100.0%) |
| 16 and 17 Years | 473 (93.7%) | 480 (94.5%) |
| 18 to 24 Years | 716 (100.0%) | 900 (88.1%) |
| 25 to 34 Years | 595 (90.4%) | 925 (97.8%) |
| 35 to 44 Years | 1,342 (99.6%) | 1,365 (93.8%) |
| 45 to 54 Years | 1,767 (100.0%) | 1,809 (100.0%) |
| 55 to 64 Years | 880 (96.1%) | 909 (97.3%) |
| 65 to 74 Years | 553 (96.0%) | 553 (90.7%) |
| 75 Years and over | 230 (100.0%) | 413 (100.0%) |
| Total | 8,456 (98.2%) | 9,868 (96.3%) |
Income Below Poverty Among Married-Couple Families in Harrisburg
The poverty statistics for married-couple families in Harrisburg show that 0.3% or 14 of the total 4,190 families live below the poverty line. Families with no children have the highest poverty rate of 0.5%, comprising of 9 families. On the other hand, families with 3 or 4 children have the lowest poverty rate of 0.0%, which includes 0 families.
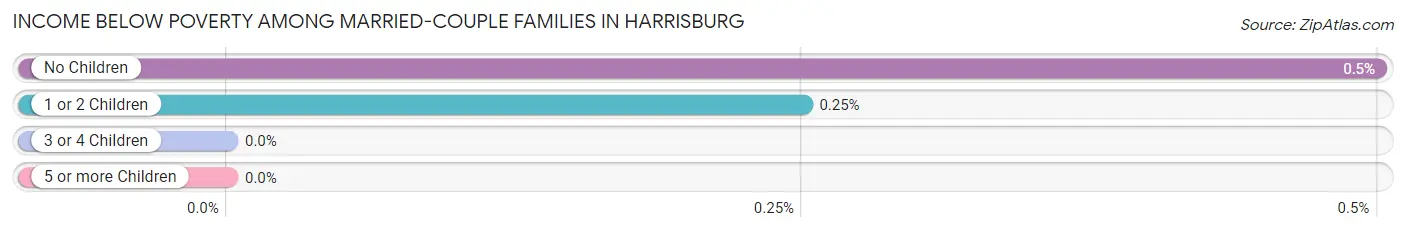
| Children | Above Poverty | Below Poverty |
| No Children | 1,800 (99.5%) | 9 (0.5%) |
| 1 or 2 Children | 2,023 (99.8%) | 5 (0.3%) |
| 3 or 4 Children | 339 (100.0%) | 0 (0.0%) |
| 5 or more Children | 14 (100.0%) | 0 (0.0%) |
| Total | 4,176 (99.7%) | 14 (0.3%) |
Income Below Poverty Among Single-Parent Households in Harrisburg
According to the poverty data in Harrisburg, 43.8% or 28 single-father households and 10.7% or 59 single-mother households are living below the poverty line. Among single-father households, those with no children have the highest poverty rate, with 28 households (71.8%) experiencing poverty. Likewise, among single-mother households, those with 1 or 2 children have the highest poverty rate, with 34 households (15.9%) falling below the poverty line.
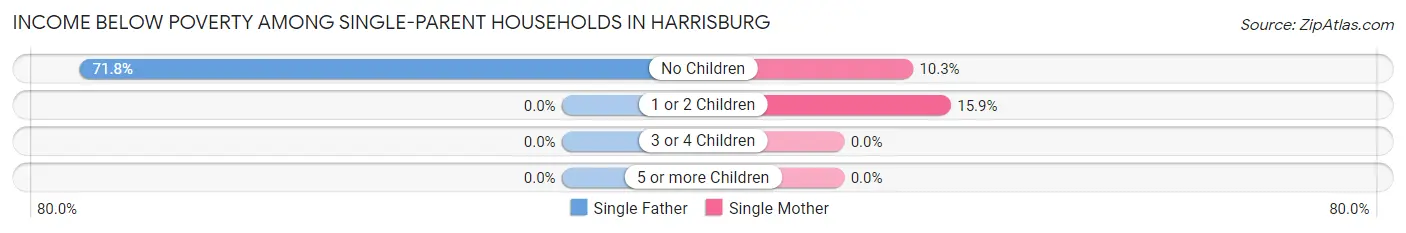
| Children | Single Father | Single Mother |
| No Children | 28 (71.8%) | 25 (10.2%) |
| 1 or 2 Children | 0 (0.0%) | 34 (15.9%) |
| 3 or 4 Children | 0 (0.0%) | 0 (0.0%) |
| 5 or more Children | 0 (0.0%) | 0 (0.0%) |
| Total | 28 (43.8%) | 59 (10.7%) |
Income Below Poverty Among Married-Couple vs Single-Parent Households in Harrisburg
The poverty data for Harrisburg shows that 14 of the married-couple family households (0.3%) and 87 of the single-parent households (14.2%) are living below the poverty level. Within the married-couple family households, those with no children have the highest poverty rate, with 9 households (0.5%) falling below the poverty line. Among the single-parent households, those with no children have the highest poverty rate, with 53 household (18.7%) living below poverty.
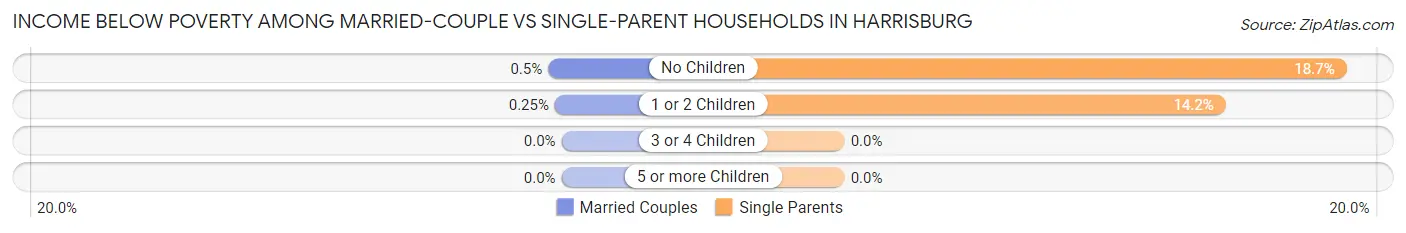
| Children | Married-Couple Families | Single-Parent Households |
| No Children | 9 (0.5%) | 53 (18.7%) |
| 1 or 2 Children | 5 (0.3%) | 34 (14.2%) |
| 3 or 4 Children | 0 (0.0%) | 0 (0.0%) |
| 5 or more Children | 0 (0.0%) | 0 (0.0%) |
| Total | 14 (0.3%) | 87 (14.2%) |
Race in Harrisburg
The most populous races in Harrisburg are White / Caucasian (11,494 | 60.7%), Black / African American (3,334 | 17.6%), and Asian (2,386 | 12.6%).
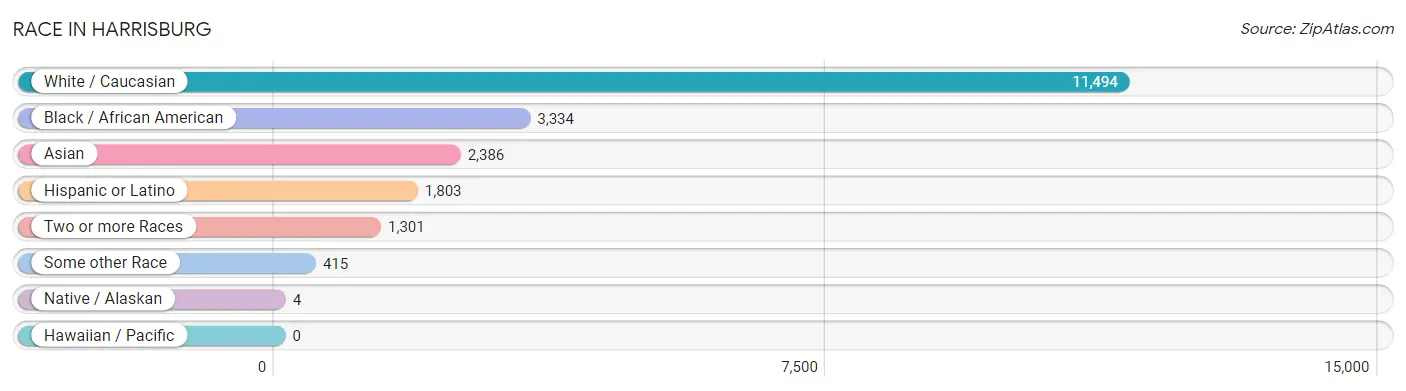
| Race | # Population | % Population |
| Asian | 2,386 | 12.6% |
| Black / African American | 3,334 | 17.6% |
| Hawaiian / Pacific | 0 | 0.0% |
| Hispanic or Latino | 1,803 | 9.5% |
| Native / Alaskan | 4 | 0.0% |
| White / Caucasian | 11,494 | 60.7% |
| Two or more Races | 1,301 | 6.9% |
| Some other Race | 415 | 2.2% |
| Total | 18,934 | 100.0% |
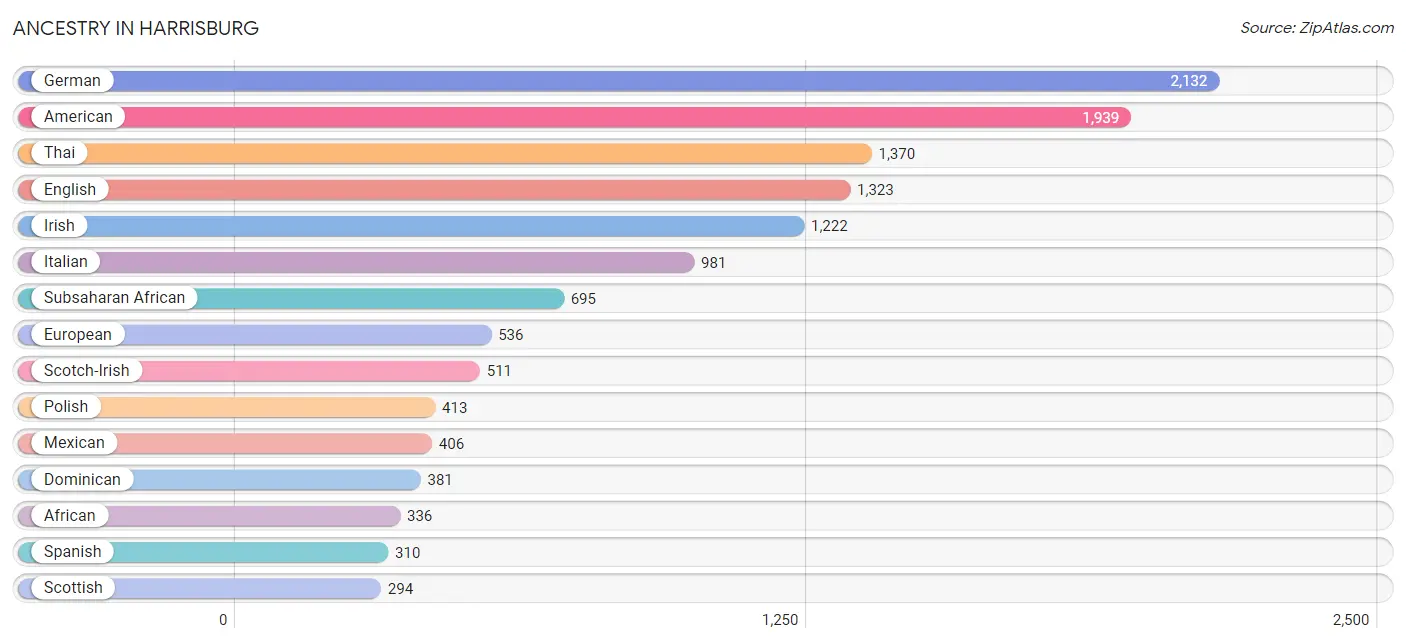
Ancestry in Harrisburg
The most populous ancestries reported in Harrisburg are German (2,132 | 11.3%), American (1,939 | 10.2%), Thai (1,370 | 7.2%), English (1,323 | 7.0%), and Irish (1,222 | 6.5%), together accounting for 42.2% of all Harrisburg residents.
| Ancestry | # Population | % Population |
| African | 336 | 1.8% |
| Alaska Native | 8 | 0.0% |
| American | 1,939 | 10.2% |
| Arab | 161 | 0.9% |
| Austrian | 89 | 0.5% |
| Bahamian | 18 | 0.1% |
| Bhutanese | 18 | 0.1% |
| Blackfeet | 2 | 0.0% |
| British | 102 | 0.5% |
| Burmese | 53 | 0.3% |
| Canadian | 9 | 0.1% |
| Central American | 173 | 0.9% |
| Cherokee | 41 | 0.2% |
| Colombian | 179 | 0.9% |
| Costa Rican | 19 | 0.1% |
| Czech | 53 | 0.3% |
| Danish | 144 | 0.8% |
| Dominican | 381 | 2.0% |
| Dutch | 18 | 0.1% |
| Eastern European | 13 | 0.1% |
| English | 1,323 | 7.0% |
| Ethiopian | 225 | 1.2% |
| European | 536 | 2.8% |
| French | 282 | 1.5% |
| French Canadian | 26 | 0.1% |
| German | 2,132 | 11.3% |
| Greek | 10 | 0.1% |
| Guatemalan | 103 | 0.5% |
| Indian (Asian) | 275 | 1.5% |
| Irish | 1,222 | 6.5% |
| Italian | 981 | 5.2% |
| Jamaican | 30 | 0.2% |
| Korean | 234 | 1.2% |
| Lebanese | 161 | 0.9% |
| Lithuanian | 58 | 0.3% |
| Malaysian | 30 | 0.2% |
| Mexican | 406 | 2.1% |
| Nicaraguan | 51 | 0.3% |
| Nigerian | 134 | 0.7% |
| Northern European | 28 | 0.2% |
| Norwegian | 108 | 0.6% |
| Peruvian | 60 | 0.3% |
| Polish | 413 | 2.2% |
| Puerto Rican | 267 | 1.4% |
| Russian | 68 | 0.4% |
| Scandinavian | 26 | 0.1% |
| Scotch-Irish | 511 | 2.7% |
| Scottish | 294 | 1.5% |
| Slovak | 65 | 0.3% |
| South American | 266 | 1.4% |
| South American Indian | 23 | 0.1% |
| Spanish | 310 | 1.6% |
| Sri Lankan | 53 | 0.3% |
| Subsaharan African | 695 | 3.7% |
| Swedish | 211 | 1.1% |
| Swiss | 37 | 0.2% |
| Thai | 1,370 | 7.2% |
| Ukrainian | 182 | 1.0% |
| Venezuelan | 27 | 0.1% |
| Welsh | 107 | 0.6% |
| West Indian | 46 | 0.2% |
| Yup'ik | 25 | 0.1% | View All 62 Rows |
Immigrants in Harrisburg
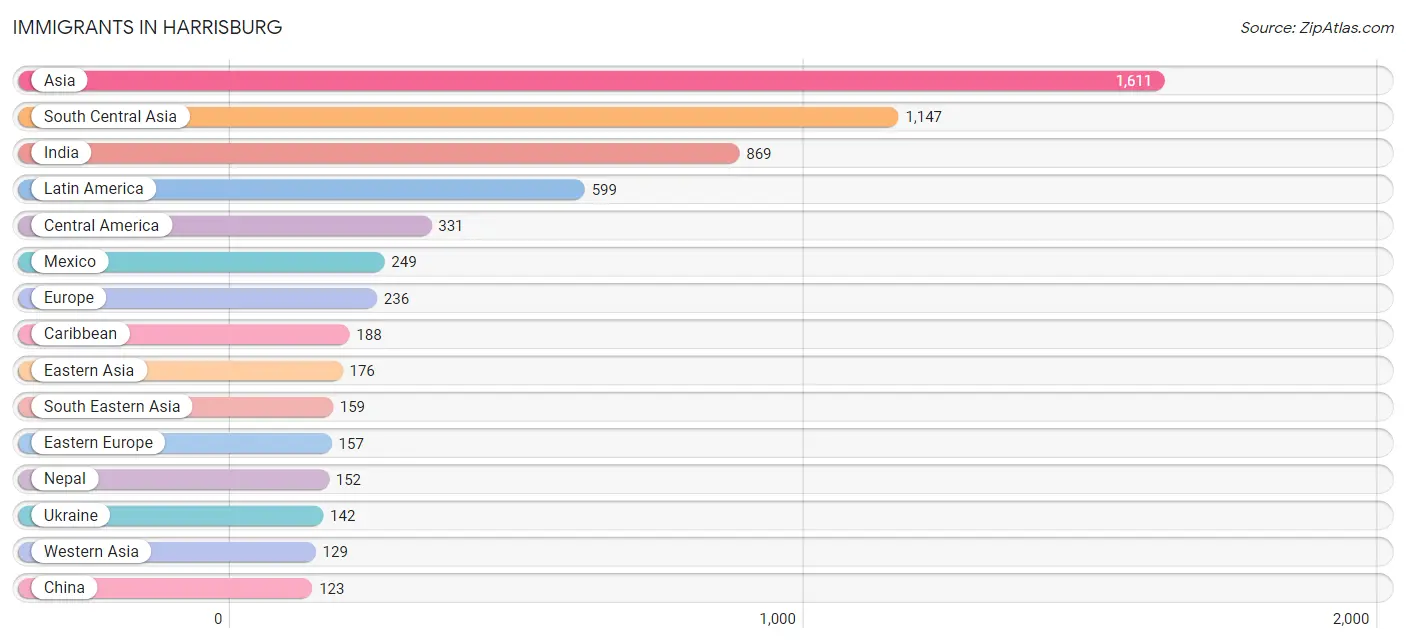
The most numerous immigrant groups reported in Harrisburg came from Asia (1,611 | 8.5%), South Central Asia (1,147 | 6.1%), India (869 | 4.6%), Latin America (599 | 3.2%), and Central America (331 | 1.8%), together accounting for 24.1% of all Harrisburg residents.
| Immigration Origin | # Population | % Population |
| Africa | 46 | 0.2% |
| Argentina | 35 | 0.2% |
| Asia | 1,611 | 8.5% |
| Bahamas | 18 | 0.1% |
| Canada | 16 | 0.1% |
| Caribbean | 188 | 1.0% |
| Central America | 331 | 1.8% |
| China | 123 | 0.6% |
| Colombia | 18 | 0.1% |
| Costa Rica | 8 | 0.0% |
| Dominican Republic | 115 | 0.6% |
| Eastern Africa | 46 | 0.2% |
| Eastern Asia | 176 | 0.9% |
| Eastern Europe | 157 | 0.8% |
| Ethiopia | 46 | 0.2% |
| Europe | 236 | 1.3% |
| Germany | 11 | 0.1% |
| Guatemala | 74 | 0.4% |
| India | 869 | 4.6% |
| Indonesia | 49 | 0.3% |
| Italy | 5 | 0.0% |
| Jamaica | 30 | 0.2% |
| Korea | 53 | 0.3% |
| Kuwait | 10 | 0.1% |
| Laos | 9 | 0.1% |
| Latin America | 599 | 3.2% |
| Lebanon | 119 | 0.6% |
| Malaysia | 12 | 0.1% |
| Mexico | 249 | 1.3% |
| Nepal | 152 | 0.8% |
| Northern Europe | 40 | 0.2% |
| Pakistan | 76 | 0.4% |
| Philippines | 43 | 0.2% |
| Russia | 15 | 0.1% |
| South America | 80 | 0.4% |
| South Central Asia | 1,147 | 6.1% |
| South Eastern Asia | 159 | 0.8% |
| Southern Europe | 28 | 0.2% |
| Spain | 23 | 0.1% |
| Sweden | 13 | 0.1% |
| Trinidad and Tobago | 25 | 0.1% |
| Ukraine | 142 | 0.7% |
| Venezuela | 27 | 0.1% |
| Vietnam | 46 | 0.2% |
| Western Asia | 129 | 0.7% |
| Western Europe | 11 | 0.1% | View All 46 Rows |
Sex and Age in Harrisburg
Sex and Age in Harrisburg
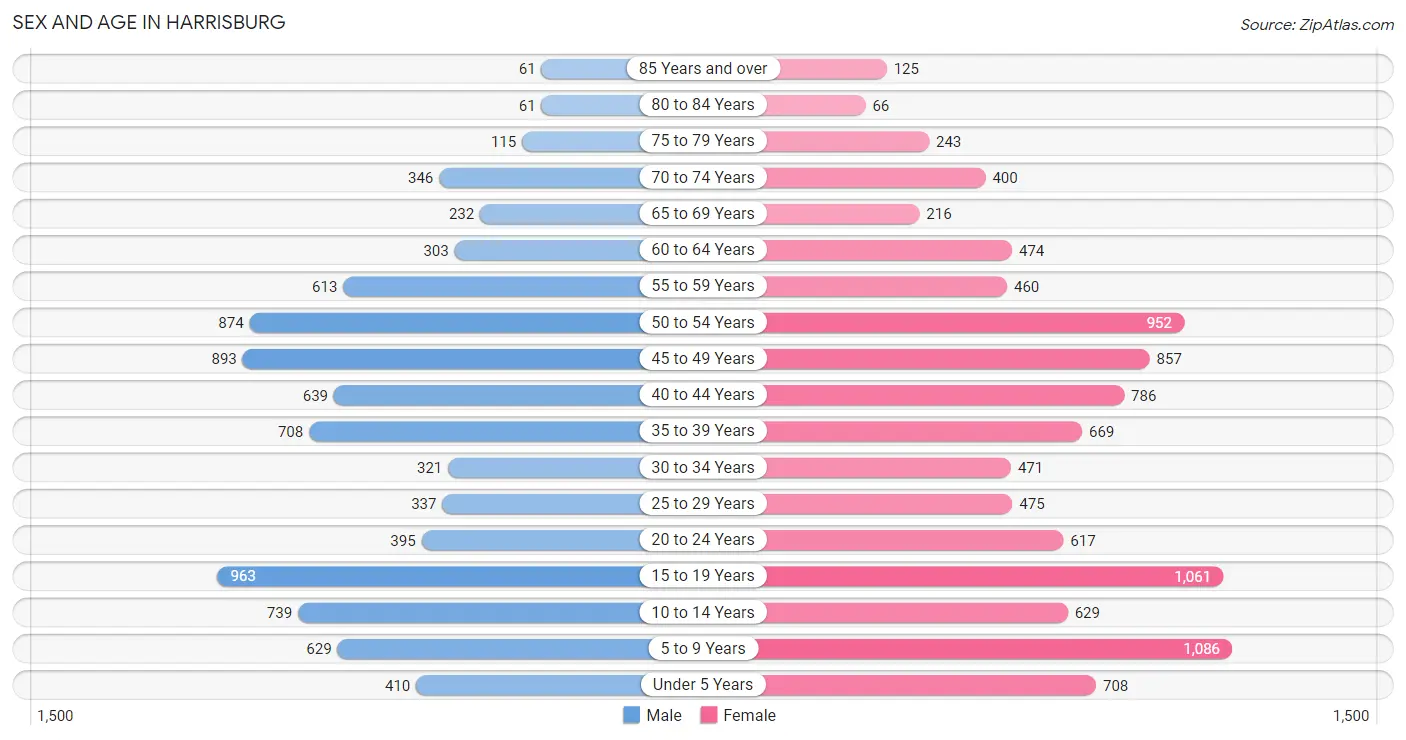
The most populous age groups in Harrisburg are 15 to 19 Years (963 | 11.2%) for men and 5 to 9 Years (1,086 | 10.5%) for women.
| Age Bracket | Male | Female |
| Under 5 Years | 410 (4.8%) | 708 (6.9%) |
| 5 to 9 Years | 629 (7.3%) | 1,086 (10.5%) |
| 10 to 14 Years | 739 (8.6%) | 629 (6.1%) |
| 15 to 19 Years | 963 (11.2%) | 1,061 (10.3%) |
| 20 to 24 Years | 395 (4.6%) | 617 (6.0%) |
| 25 to 29 Years | 337 (3.9%) | 475 (4.6%) |
| 30 to 34 Years | 321 (3.7%) | 471 (4.6%) |
| 35 to 39 Years | 708 (8.2%) | 669 (6.5%) |
| 40 to 44 Years | 639 (7.4%) | 786 (7.6%) |
| 45 to 49 Years | 893 (10.3%) | 857 (8.3%) |
| 50 to 54 Years | 874 (10.1%) | 952 (9.2%) |
| 55 to 59 Years | 613 (7.1%) | 460 (4.5%) |
| 60 to 64 Years | 303 (3.5%) | 474 (4.6%) |
| 65 to 69 Years | 232 (2.7%) | 216 (2.1%) |
| 70 to 74 Years | 346 (4.0%) | 400 (3.9%) |
| 75 to 79 Years | 115 (1.3%) | 243 (2.4%) |
| 80 to 84 Years | 61 (0.7%) | 66 (0.6%) |
| 85 Years and over | 61 (0.7%) | 125 (1.2%) |
| Total | 8,639 (100.0%) | 10,295 (100.0%) |
Families and Households in Harrisburg
Median Family Size in Harrisburg
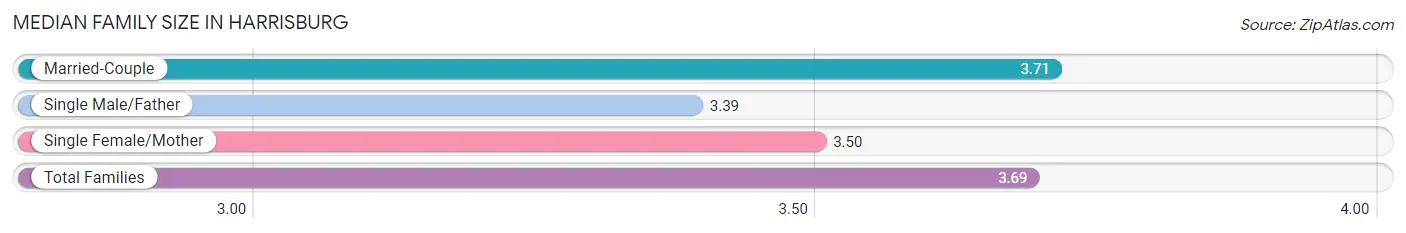
The median family size in Harrisburg is 3.69 persons per family, with married-couple families (4,190 | 87.2%) accounting for the largest median family size of 3.71 persons per family. On the other hand, single male/father families (64 | 1.3%) represent the smallest median family size with 3.39 persons per family.
| Family Type | # Families | Family Size |
| Married-Couple | 4,190 (87.2%) | 3.71 |
| Single Male/Father | 64 (1.3%) | 3.39 |
| Single Female/Mother | 549 (11.4%) | 3.50 |
| Total Families | 4,803 (100.0%) | 3.69 |
Median Household Size in Harrisburg
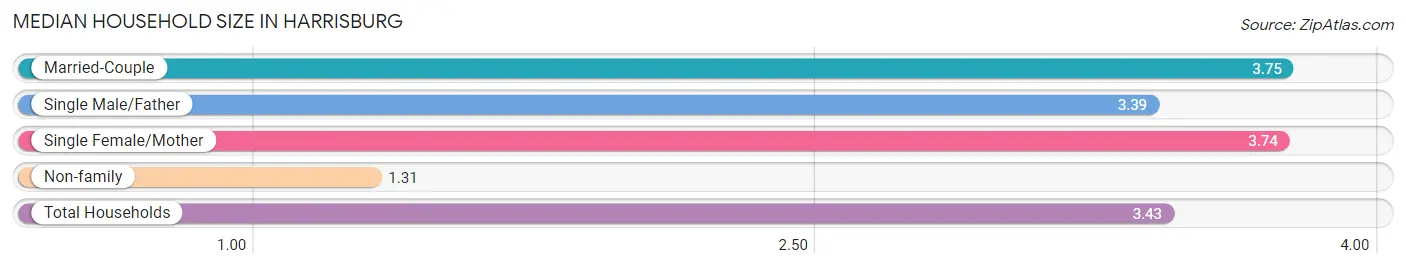
The median household size in Harrisburg is 3.43 persons per household, with married-couple households (4,190 | 76.1%) accounting for the largest median household size of 3.75 persons per household. non-family households (705 | 12.8%) represent the smallest median household size with 1.31 persons per household.
| Household Type | # Households | Household Size |
| Married-Couple | 4,190 (76.1%) | 3.75 |
| Single Male/Father | 64 (1.2%) | 3.39 |
| Single Female/Mother | 549 (10.0%) | 3.74 |
| Non-family | 705 (12.8%) | 1.31 |
| Total Households | 5,508 (100.0%) | 3.43 |
Household Size by Marriage Status in Harrisburg
Out of a total of 5,508 households in Harrisburg, 4,803 (87.2%) are family households, while 705 (12.8%) are nonfamily households. The most numerous type of family households are 2-person households, comprising 1,576, and the most common type of nonfamily households are 1-person households, comprising 584.
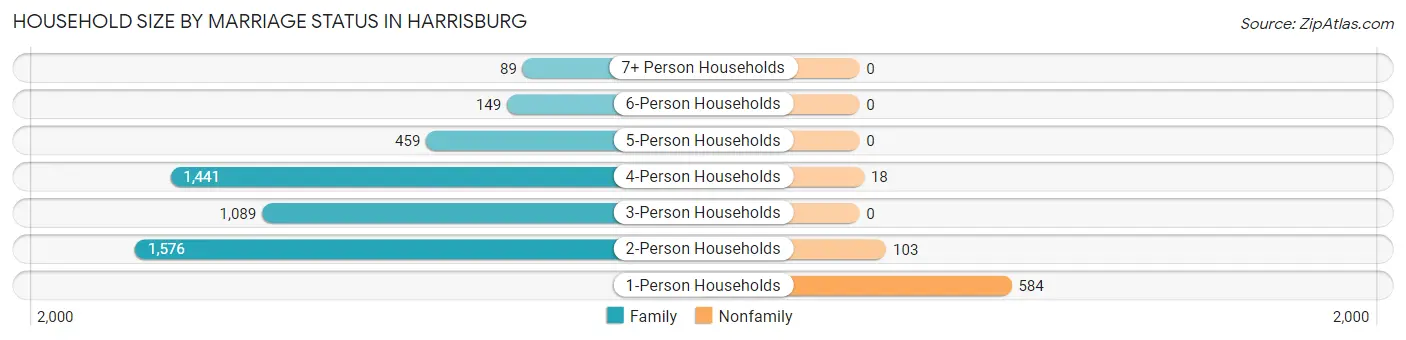
| Household Size | Family Households | Nonfamily Households |
| 1-Person Households | - | 584 (10.6%) |
| 2-Person Households | 1,576 (28.6%) | 103 (1.9%) |
| 3-Person Households | 1,089 (19.8%) | 0 (0.0%) |
| 4-Person Households | 1,441 (26.2%) | 18 (0.3%) |
| 5-Person Households | 459 (8.3%) | 0 (0.0%) |
| 6-Person Households | 149 (2.7%) | 0 (0.0%) |
| 7+ Person Households | 89 (1.6%) | 0 (0.0%) |
| Total | 4,803 (87.2%) | 705 (12.8%) |
Female Fertility in Harrisburg
Fertility by Age in Harrisburg
Average fertility rate in Harrisburg is 39.0 births per 1,000 women. Women in the age bracket of 20 to 34 years have the highest fertility rate with 52.0 births per 1,000 women. Women in the age bracket of 35 to 50 years acount for 61.8% of all women with births.
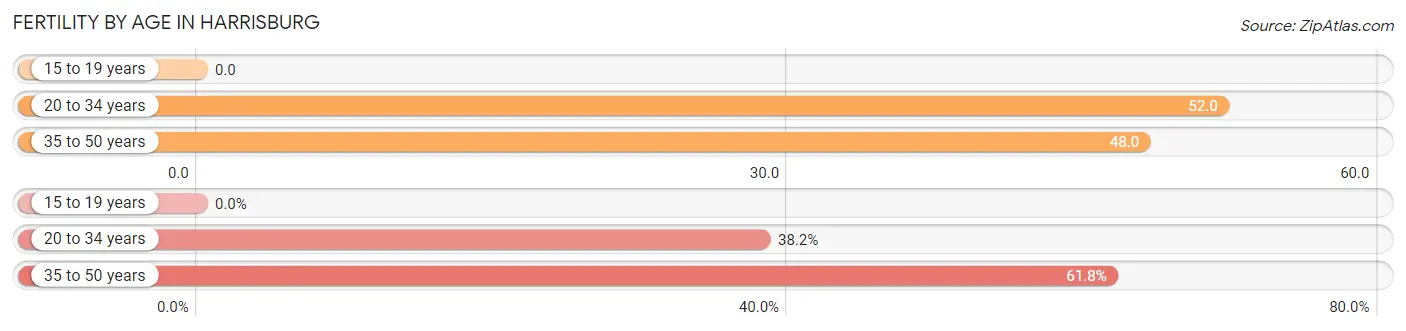
| Age Bracket | Women with Births | Births / 1,000 Women |
| 15 to 19 years | 0 (0.0%) | 0.0 |
| 20 to 34 years | 81 (38.2%) | 52.0 |
| 35 to 50 years | 131 (61.8%) | 48.0 |
| Total | 212 (100.0%) | 39.0 |
Fertility by Age by Marriage Status in Harrisburg
71.7% of women with births (212) in Harrisburg are married. The highest percentage of unmarried women with births falls into 35 to 50 years age bracket with 29.0% of them unmarried at the time of birth, while the lowest percentage of unmarried women with births belong to 20 to 34 years age bracket with 27.2% of them unmarried.
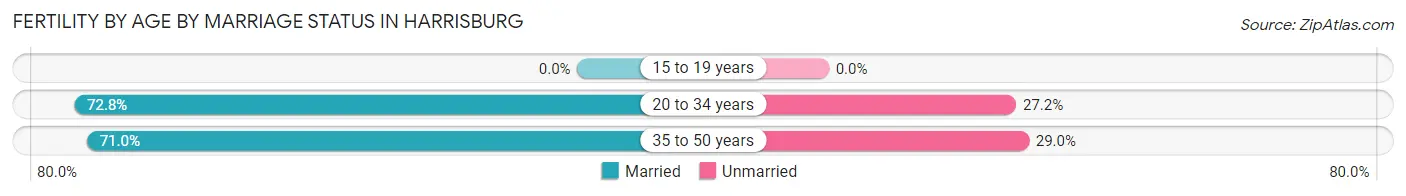
| Age Bracket | Married | Unmarried |
| 15 to 19 years | 0 (0.0%) | 0 (0.0%) |
| 20 to 34 years | 59 (72.8%) | 22 (27.2%) |
| 35 to 50 years | 93 (71.0%) | 38 (29.0%) |
| Total | 152 (71.7%) | 60 (28.3%) |
Fertility by Education in Harrisburg
Average fertility rate in Harrisburg is 39.0 births per 1,000 women. Women with the education attainment of bachelor's degree have the highest fertility rate of 60.0 births per 1,000 women, while women with the education attainment of high school diploma have the lowest fertility at 14.0 births per 1,000 women. Women with the education attainment of bachelor's degree represent 55.2% of all women with births.
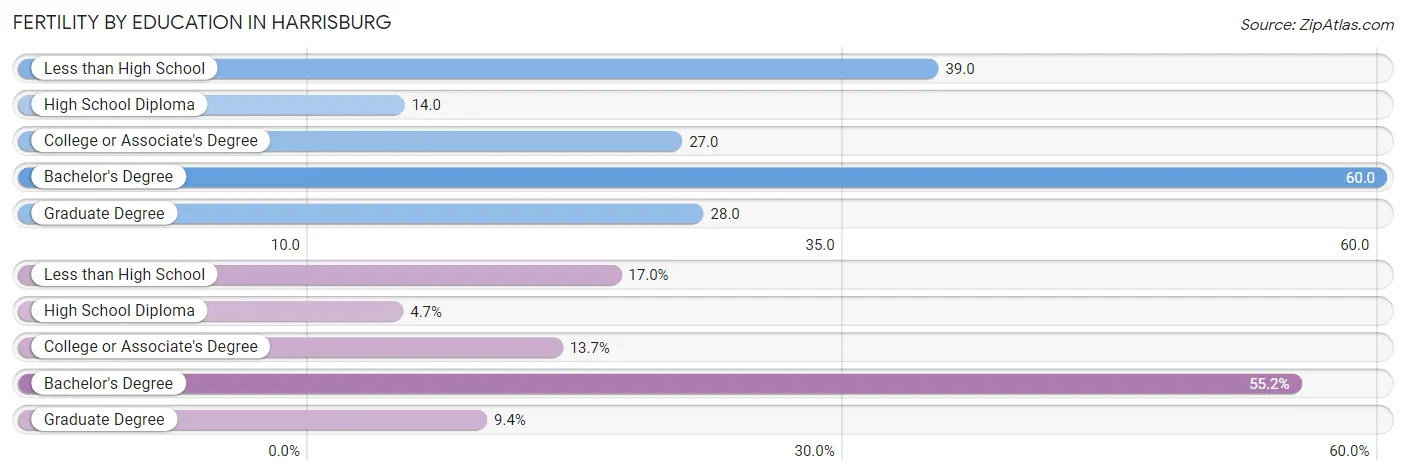
| Educational Attainment | Women with Births | Births / 1,000 Women |
| Less than High School | 36 (17.0%) | 39.0 |
| High School Diploma | 10 (4.7%) | 14.0 |
| College or Associate's Degree | 29 (13.7%) | 27.0 |
| Bachelor's Degree | 117 (55.2%) | 60.0 |
| Graduate Degree | 20 (9.4%) | 28.0 |
| Total | 212 (100.0%) | 39.0 |
Fertility by Education by Marriage Status in Harrisburg
28.3% of women with births in Harrisburg are unmarried. Women with the educational attainment of high school diploma are most likely to be married with 100.0% of them married at childbirth, while women with the educational attainment of less than high school are least likely to be married with 50.0% of them unmarried at childbirth.
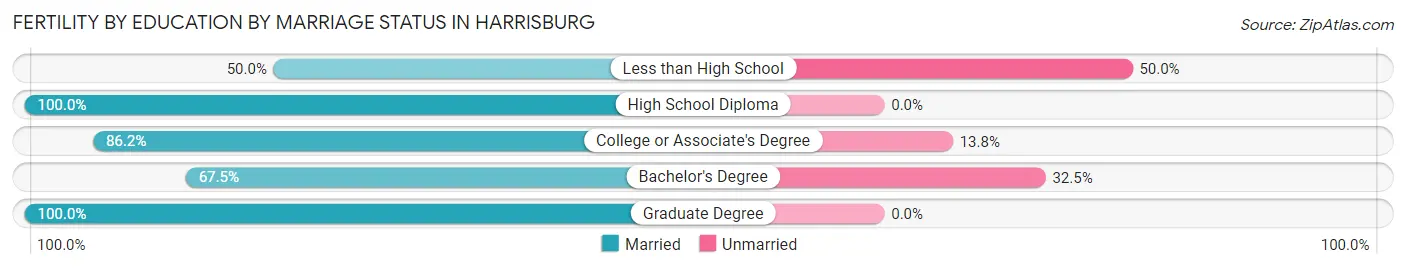
| Educational Attainment | Married | Unmarried |
| Less than High School | 18 (50.0%) | 18 (50.0%) |
| High School Diploma | 10 (100.0%) | 0 (0.0%) |
| College or Associate's Degree | 25 (86.2%) | 4 (13.8%) |
| Bachelor's Degree | 79 (67.5%) | 38 (32.5%) |
| Graduate Degree | 20 (100.0%) | 0 (0.0%) |
| Total | 152 (71.7%) | 60 (28.3%) |
Employment Characteristics in Harrisburg
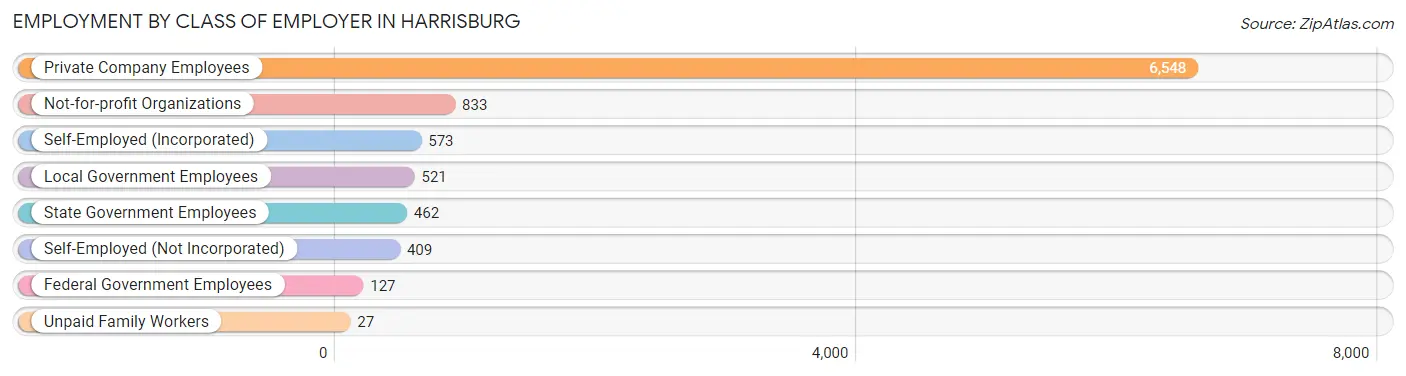
Employment by Class of Employer in Harrisburg
Among the 9,500 employed individuals in Harrisburg, private company employees (6,548 | 68.9%), not-for-profit organizations (833 | 8.8%), and self-employed (incorporated) (573 | 6.0%) make up the most common classes of employment.
| Employer Class | # Employees | % Employees |
| Private Company Employees | 6,548 | 68.9% |
| Self-Employed (Incorporated) | 573 | 6.0% |
| Self-Employed (Not Incorporated) | 409 | 4.3% |
| Not-for-profit Organizations | 833 | 8.8% |
| Local Government Employees | 521 | 5.5% |
| State Government Employees | 462 | 4.9% |
| Federal Government Employees | 127 | 1.3% |
| Unpaid Family Workers | 27 | 0.3% |
| Total | 9,500 | 100.0% |
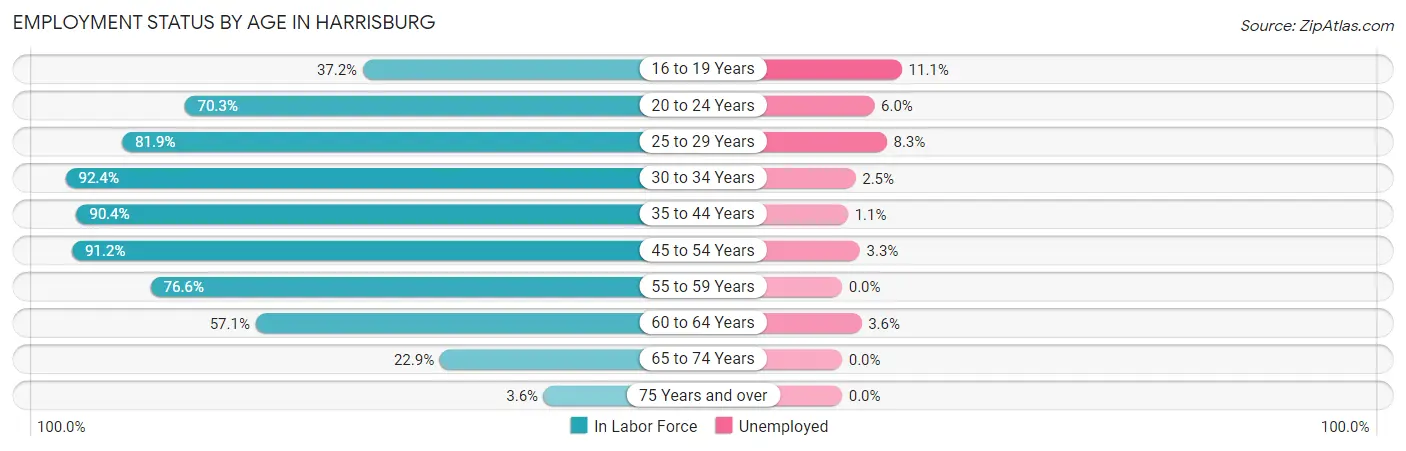
Employment Status by Age in Harrisburg
According to the labor force statistics for Harrisburg, out of the total population over 16 years of age (14,447), 70.0% or 10,113 individuals are in the labor force, with 3.4% or 344 of them unemployed. The age group with the highest labor force participation rate is 30 to 34 years, with 92.4% or 732 individuals in the labor force. Within the labor force, the 16 to 19 years age range has the highest percentage of unemployed individuals, with 11.1% or 72 of them being unemployed.
| Age Bracket | In Labor Force | Unemployed |
| 16 to 19 Years | 647 (37.2%) | 72 (11.1%) |
| 20 to 24 Years | 711 (70.3%) | 43 (6.0%) |
| 25 to 29 Years | 665 (81.9%) | 55 (8.3%) |
| 30 to 34 Years | 732 (92.4%) | 18 (2.5%) |
| 35 to 44 Years | 2,533 (90.4%) | 28 (1.1%) |
| 45 to 54 Years | 3,261 (91.2%) | 108 (3.3%) |
| 55 to 59 Years | 822 (76.6%) | 0 (0.0%) |
| 60 to 64 Years | 444 (57.1%) | 16 (3.6%) |
| 65 to 74 Years | 273 (22.9%) | 0 (0.0%) |
| 75 Years and over | 24 (3.6%) | 0 (0.0%) |
| Total | 10,113 (70.0%) | 344 (3.4%) |
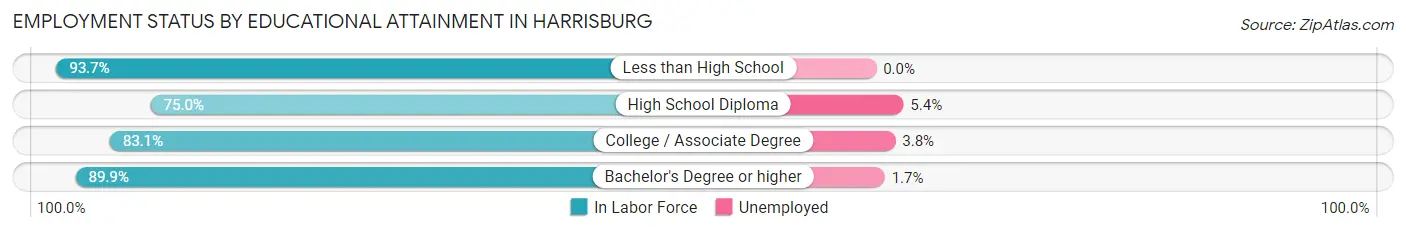
Employment Status by Educational Attainment in Harrisburg
According to labor force statistics for Harrisburg, 86.0% of individuals (8,456) out of the total population between 25 and 64 years of age (9,832) are in the labor force, with 2.7% or 228 of them being unemployed. The group with the highest labor force participation rate are those with the educational attainment of less than high school, with 93.7% or 192 individuals in the labor force. Within the labor force, individuals with high school diploma education have the highest percentage of unemployment, with 5.4% or 55 of them being unemployed.
| Educational Attainment | In Labor Force | Unemployed |
| Less than High School | 192 (93.7%) | 0 (0.0%) |
| High School Diploma | 1,018 (75.0%) | 73 (5.4%) |
| College / Associate Degree | 2,276 (83.1%) | 104 (3.8%) |
| Bachelor's Degree or higher | 4,971 (89.9%) | 94 (1.7%) |
| Total | 8,456 (86.0%) | 265 (2.7%) |
Employment Occupations by Sex in Harrisburg
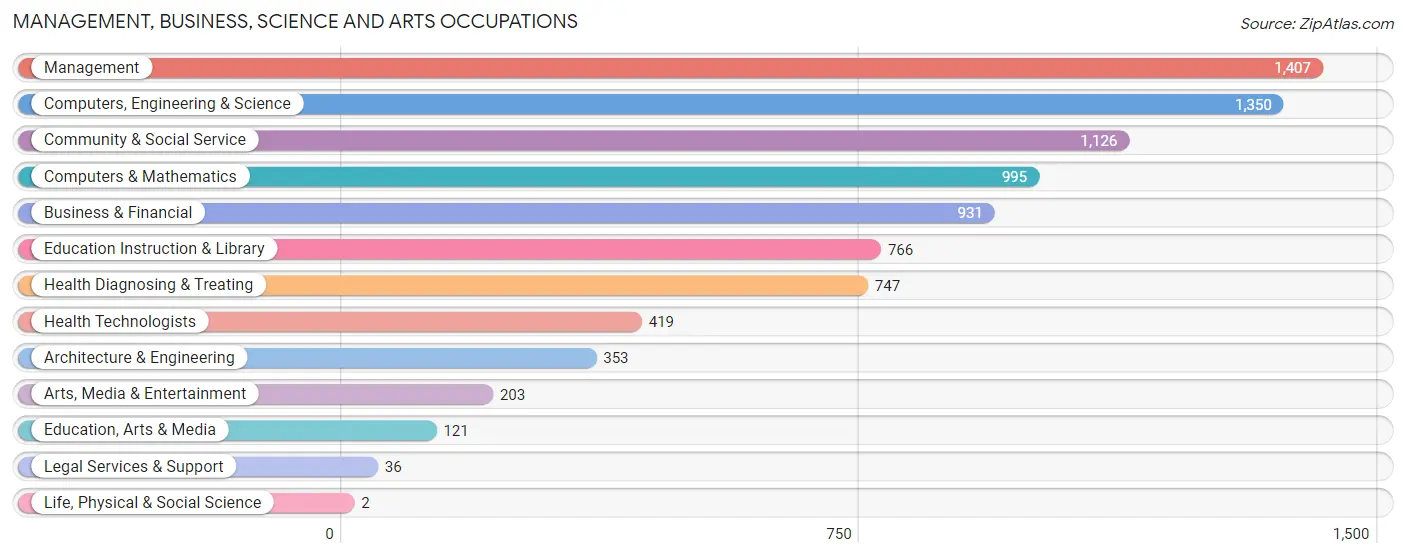
Management, Business, Science and Arts Occupations
The most common Management, Business, Science and Arts occupations in Harrisburg are Management (1,407 | 14.4%), Computers, Engineering & Science (1,350 | 13.8%), Community & Social Service (1,126 | 11.5%), Computers & Mathematics (995 | 10.2%), and Business & Financial (931 | 9.5%).
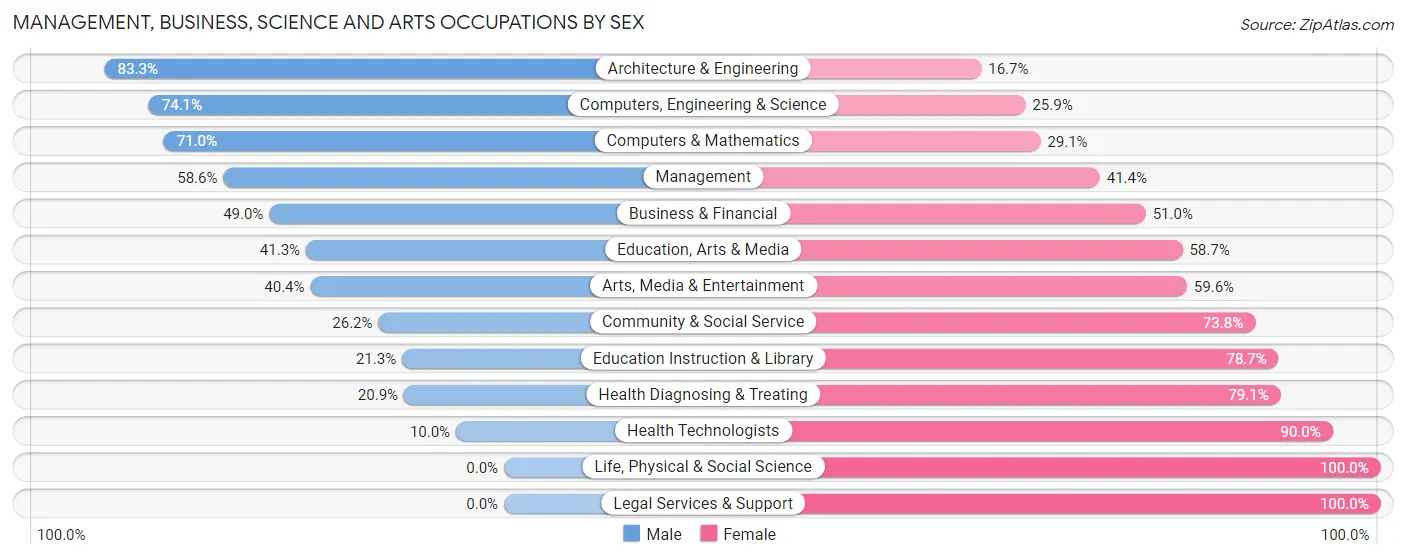
Management, Business, Science and Arts Occupations by Sex
Within the Management, Business, Science and Arts occupations in Harrisburg, the most male-oriented occupations are Architecture & Engineering (83.3%), Computers, Engineering & Science (74.1%), and Computers & Mathematics (71.0%), while the most female-oriented occupations are Life, Physical & Social Science (100.0%), Legal Services & Support (100.0%), and Health Technologists (90.0%).
| Occupation | Male | Female |
| Management | 824 (58.6%) | 583 (41.4%) |
| Business & Financial | 456 (49.0%) | 475 (51.0%) |
| Computers, Engineering & Science | 1,000 (74.1%) | 350 (25.9%) |
| Computers & Mathematics | 706 (71.0%) | 289 (29.0%) |
| Architecture & Engineering | 294 (83.3%) | 59 (16.7%) |
| Life, Physical & Social Science | 0 (0.0%) | 2 (100.0%) |
| Community & Social Service | 295 (26.2%) | 831 (73.8%) |
| Education, Arts & Media | 50 (41.3%) | 71 (58.7%) |
| Legal Services & Support | 0 (0.0%) | 36 (100.0%) |
| Education Instruction & Library | 163 (21.3%) | 603 (78.7%) |
| Arts, Media & Entertainment | 82 (40.4%) | 121 (59.6%) |
| Health Diagnosing & Treating | 156 (20.9%) | 591 (79.1%) |
| Health Technologists | 42 (10.0%) | 377 (90.0%) |
| Total (Category) | 2,731 (49.1%) | 2,830 (50.9%) |
| Total (Overall) | 5,108 (52.3%) | 4,662 (47.7%) |
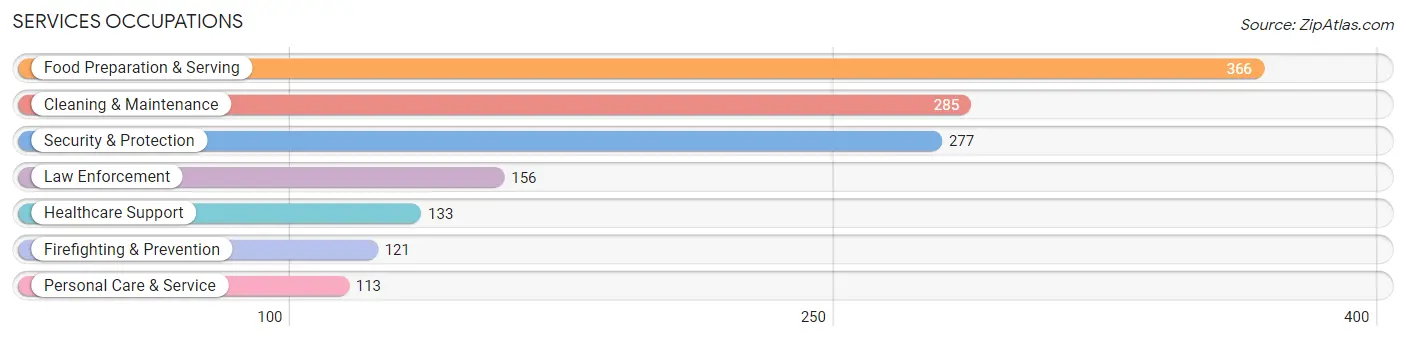
Services Occupations
The most common Services occupations in Harrisburg are Food Preparation & Serving (366 | 3.7%), Cleaning & Maintenance (285 | 2.9%), Security & Protection (277 | 2.8%), Law Enforcement (156 | 1.6%), and Healthcare Support (133 | 1.4%).
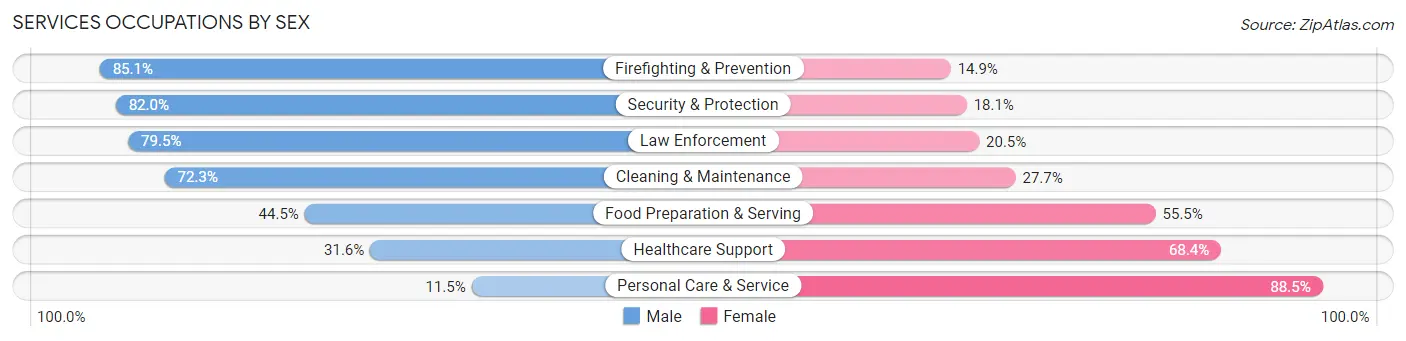
Services Occupations by Sex
Within the Services occupations in Harrisburg, the most male-oriented occupations are Firefighting & Prevention (85.1%), Security & Protection (82.0%), and Law Enforcement (79.5%), while the most female-oriented occupations are Personal Care & Service (88.5%), Healthcare Support (68.4%), and Food Preparation & Serving (55.5%).
| Occupation | Male | Female |
| Healthcare Support | 42 (31.6%) | 91 (68.4%) |
| Security & Protection | 227 (82.0%) | 50 (18.0%) |
| Firefighting & Prevention | 103 (85.1%) | 18 (14.9%) |
| Law Enforcement | 124 (79.5%) | 32 (20.5%) |
| Food Preparation & Serving | 163 (44.5%) | 203 (55.5%) |
| Cleaning & Maintenance | 206 (72.3%) | 79 (27.7%) |
| Personal Care & Service | 13 (11.5%) | 100 (88.5%) |
| Total (Category) | 651 (55.4%) | 523 (44.6%) |
| Total (Overall) | 5,108 (52.3%) | 4,662 (47.7%) |
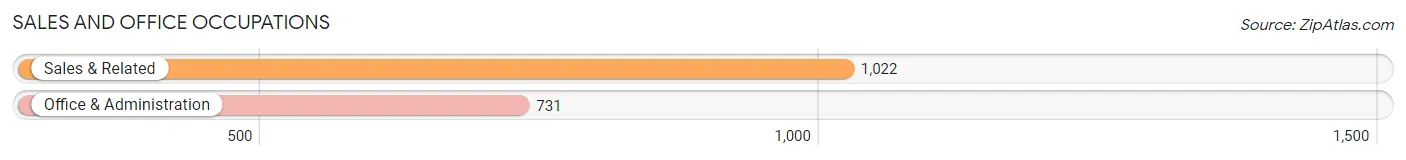
Sales and Office Occupations
The most common Sales and Office occupations in Harrisburg are Sales & Related (1,022 | 10.5%), and Office & Administration (731 | 7.5%).
Sales and Office Occupations by Sex
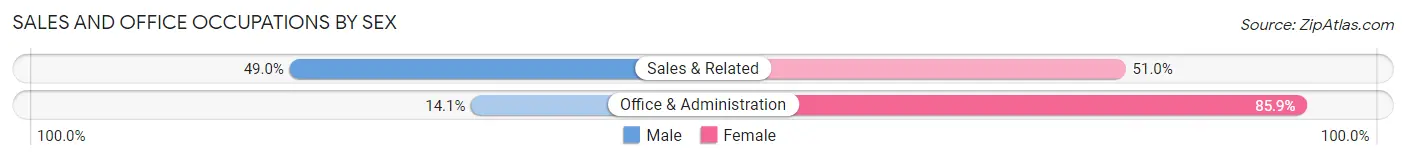
| Occupation | Male | Female |
| Sales & Related | 501 (49.0%) | 521 (51.0%) |
| Office & Administration | 103 (14.1%) | 628 (85.9%) |
| Total (Category) | 604 (34.5%) | 1,149 (65.5%) |
| Total (Overall) | 5,108 (52.3%) | 4,662 (47.7%) |
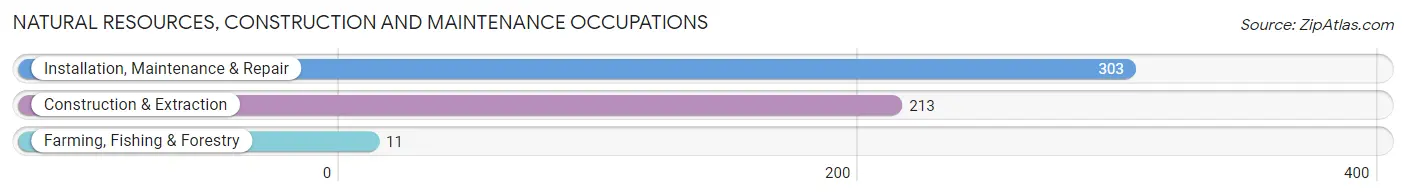
Natural Resources, Construction and Maintenance Occupations
The most common Natural Resources, Construction and Maintenance occupations in Harrisburg are Installation, Maintenance & Repair (303 | 3.1%), Construction & Extraction (213 | 2.2%), and Farming, Fishing & Forestry (11 | 0.1%).
Natural Resources, Construction and Maintenance Occupations by Sex
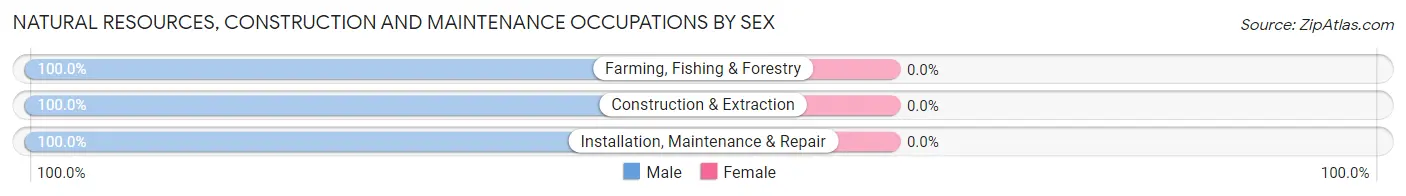
| Occupation | Male | Female |
| Farming, Fishing & Forestry | 11 (100.0%) | 0 (0.0%) |
| Construction & Extraction | 213 (100.0%) | 0 (0.0%) |
| Installation, Maintenance & Repair | 303 (100.0%) | 0 (0.0%) |
| Total (Category) | 527 (100.0%) | 0 (0.0%) |
| Total (Overall) | 5,108 (52.3%) | 4,662 (47.7%) |
Production, Transportation and Moving Occupations
The most common Production, Transportation and Moving occupations in Harrisburg are Material Moving (356 | 3.6%), Production (221 | 2.3%), and Transportation (178 | 1.8%).
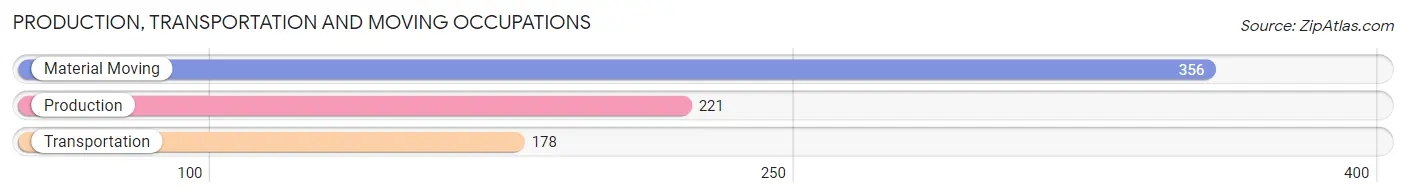
Production, Transportation and Moving Occupations by Sex
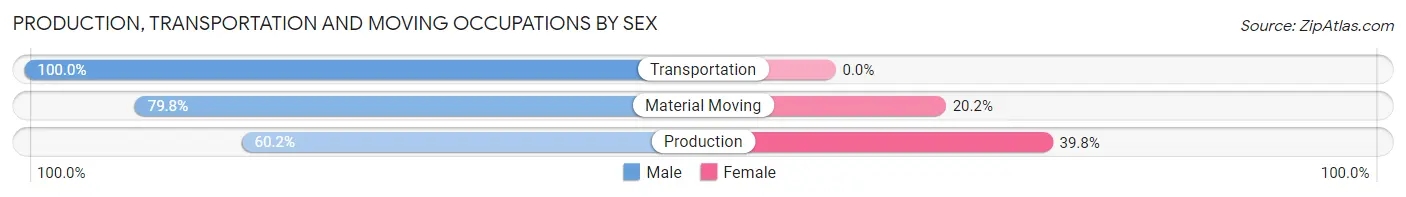
| Occupation | Male | Female |
| Production | 133 (60.2%) | 88 (39.8%) |
| Transportation | 178 (100.0%) | 0 (0.0%) |
| Material Moving | 284 (79.8%) | 72 (20.2%) |
| Total (Category) | 595 (78.8%) | 160 (21.2%) |
| Total (Overall) | 5,108 (52.3%) | 4,662 (47.7%) |
Employment Industries by Sex in Harrisburg
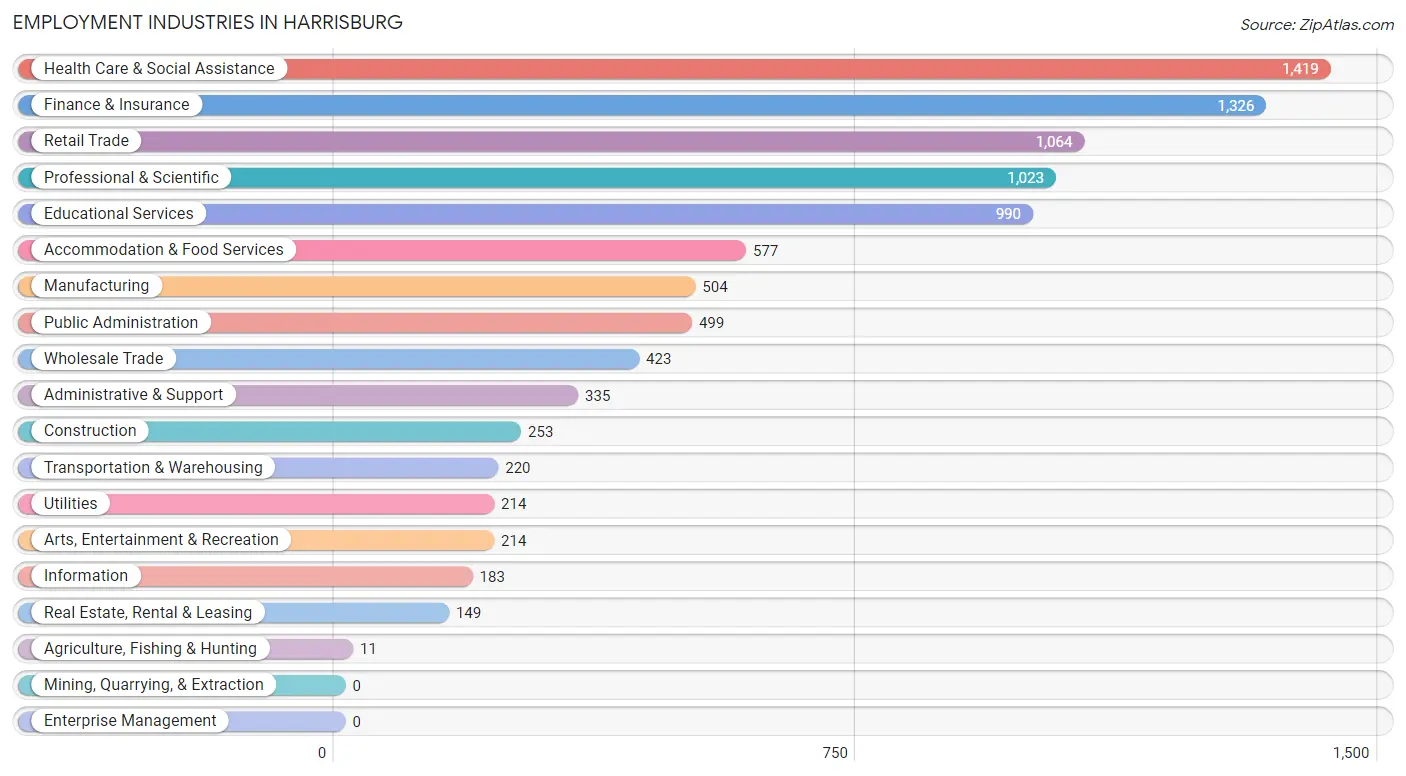
Employment Industries in Harrisburg
The major employment industries in Harrisburg include Health Care & Social Assistance (1,419 | 14.5%), Finance & Insurance (1,326 | 13.6%), Retail Trade (1,064 | 10.9%), Professional & Scientific (1,023 | 10.5%), and Educational Services (990 | 10.1%).
Employment Industries by Sex in Harrisburg
The Harrisburg industries that see more men than women are Agriculture, Fishing & Hunting (100.0%), Construction (100.0%), and Wholesale Trade (97.2%), whereas the industries that tend to have a higher number of women are Educational Services (79.5%), Health Care & Social Assistance (76.2%), and Retail Trade (60.7%).
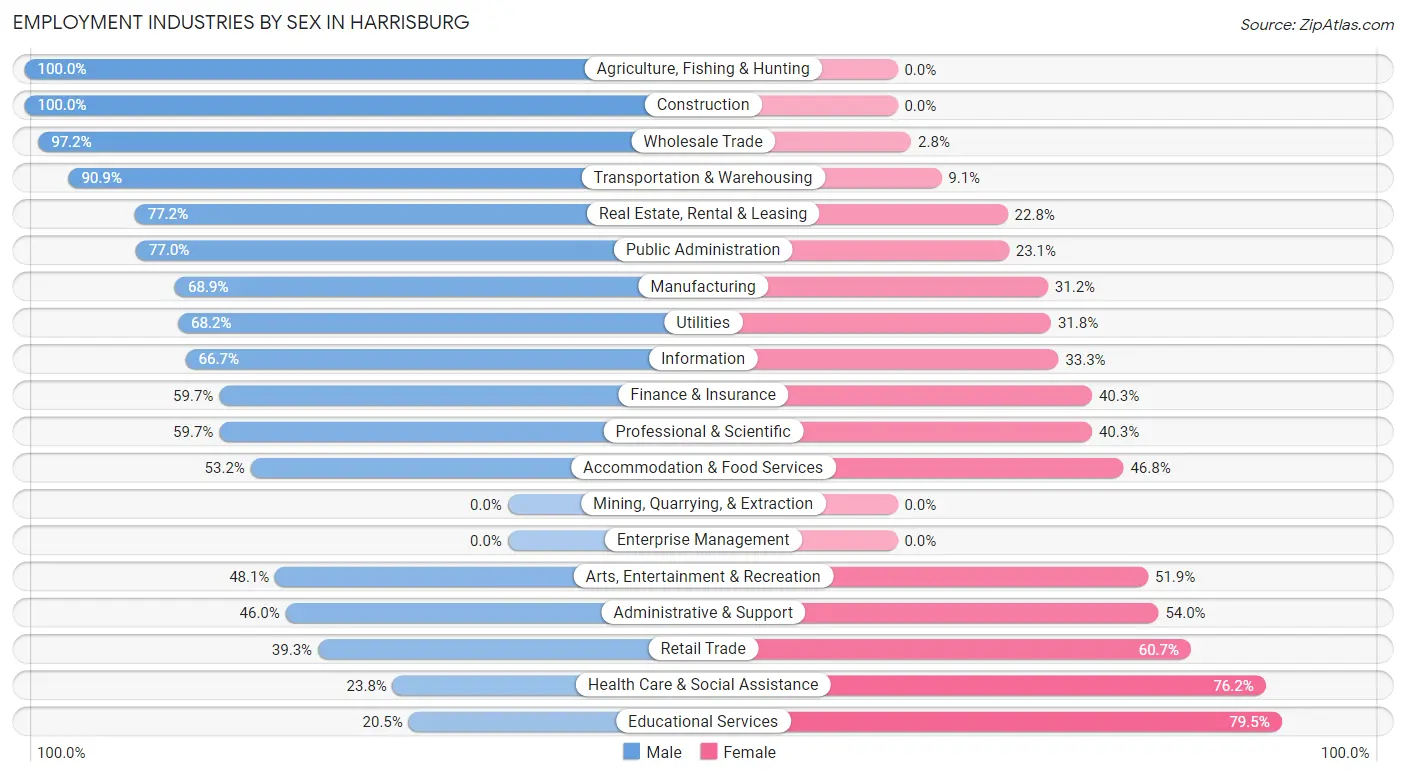
| Industry | Male | Female |
| Agriculture, Fishing & Hunting | 11 (100.0%) | 0 (0.0%) |
| Mining, Quarrying, & Extraction | 0 (0.0%) | 0 (0.0%) |
| Construction | 253 (100.0%) | 0 (0.0%) |
| Manufacturing | 347 (68.9%) | 157 (31.1%) |
| Wholesale Trade | 411 (97.2%) | 12 (2.8%) |
| Retail Trade | 418 (39.3%) | 646 (60.7%) |
| Transportation & Warehousing | 200 (90.9%) | 20 (9.1%) |
| Utilities | 146 (68.2%) | 68 (31.8%) |
| Information | 122 (66.7%) | 61 (33.3%) |
| Finance & Insurance | 792 (59.7%) | 534 (40.3%) |
| Real Estate, Rental & Leasing | 115 (77.2%) | 34 (22.8%) |
| Professional & Scientific | 611 (59.7%) | 412 (40.3%) |
| Enterprise Management | 0 (0.0%) | 0 (0.0%) |
| Administrative & Support | 154 (46.0%) | 181 (54.0%) |
| Educational Services | 203 (20.5%) | 787 (79.5%) |
| Health Care & Social Assistance | 338 (23.8%) | 1,081 (76.2%) |
| Arts, Entertainment & Recreation | 103 (48.1%) | 111 (51.9%) |
| Accommodation & Food Services | 307 (53.2%) | 270 (46.8%) |
| Public Administration | 384 (76.9%) | 115 (23.1%) |
| Total | 5,108 (52.3%) | 4,662 (47.7%) |
Education in Harrisburg
School Enrollment in Harrisburg
The most common levels of schooling among the 5,593 students in Harrisburg are high school (1,343 | 24.0%), elementary school (1,193 | 21.3%), and middle school (1,102 | 19.7%).
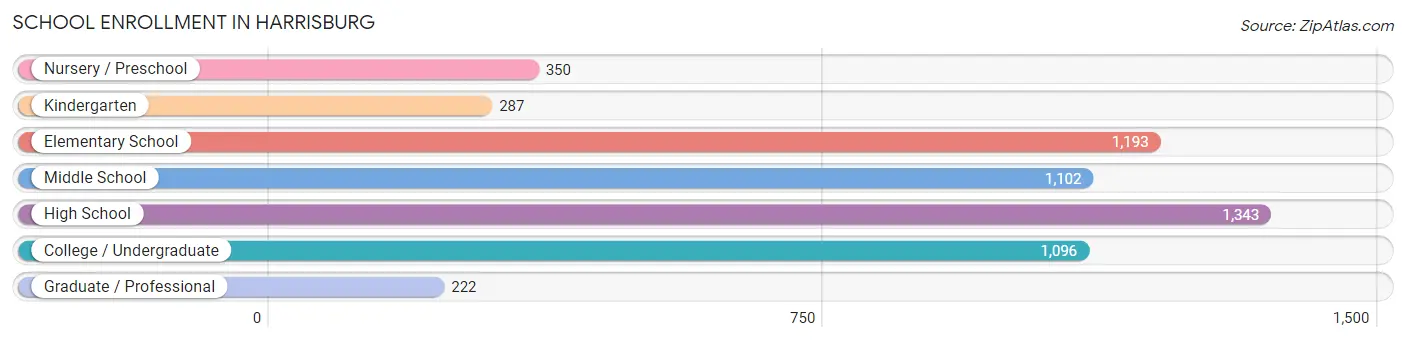
| School Level | # Students | % Students |
| Nursery / Preschool | 350 | 6.3% |
| Kindergarten | 287 | 5.1% |
| Elementary School | 1,193 | 21.3% |
| Middle School | 1,102 | 19.7% |
| High School | 1,343 | 24.0% |
| College / Undergraduate | 1,096 | 19.6% |
| Graduate / Professional | 222 | 4.0% |
| Total | 5,593 | 100.0% |
School Enrollment by Age by Funding Source in Harrisburg
Out of a total of 5,593 students who are enrolled in schools in Harrisburg, 582 (10.4%) attend a private institution, while the remaining 5,011 (89.6%) are enrolled in public schools. The age group of 3 to 4 year olds has the highest likelihood of being enrolled in private schools, with 204 (75.6% in the age bracket) enrolled. Conversely, the age group of 18 to 19 year olds has the lowest likelihood of being enrolled in a private school, with 567 (100.0% in the age bracket) attending a public institution.
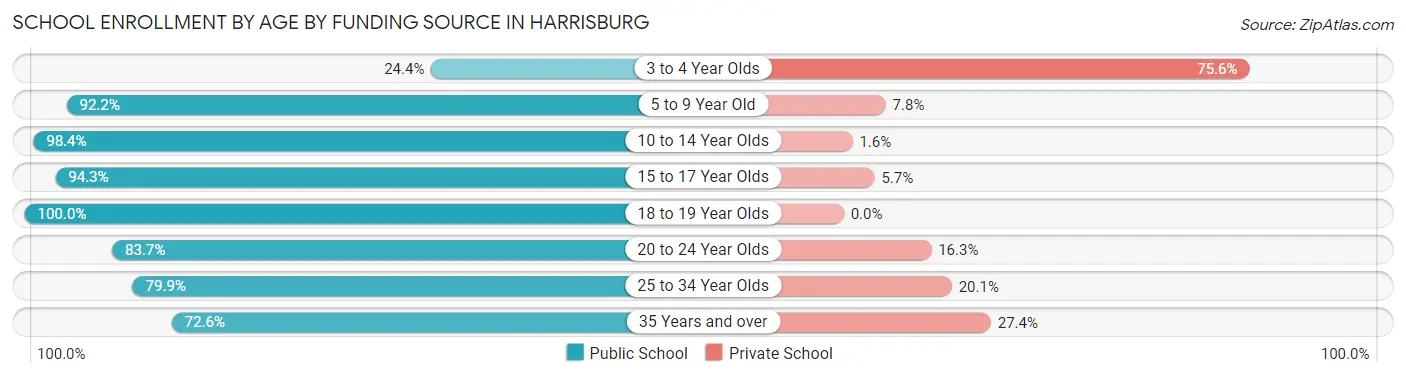
| Age Bracket | Public School | Private School |
| 3 to 4 Year Olds | 66 (24.4%) | 204 (75.6%) |
| 5 to 9 Year Old | 1,343 (92.2%) | 114 (7.8%) |
| 10 to 14 Year Olds | 1,266 (98.4%) | 21 (1.6%) |
| 15 to 17 Year Olds | 1,053 (94.3%) | 64 (5.7%) |
| 18 to 19 Year Olds | 567 (100.0%) | 0 (0.0%) |
| 20 to 24 Year Olds | 313 (83.7%) | 61 (16.3%) |
| 25 to 34 Year Olds | 250 (79.9%) | 63 (20.1%) |
| 35 Years and over | 151 (72.6%) | 57 (27.4%) |
| Total | 5,011 (89.6%) | 582 (10.4%) |
Educational Attainment by Field of Study in Harrisburg
Business (2,000 | 31.9%), computers & mathematics (755 | 12.1%), engineering (755 | 12.1%), education (707 | 11.3%), and science & technology (404 | 6.5%) are the most common fields of study among 6,261 individuals in Harrisburg who have obtained a bachelor's degree or higher.
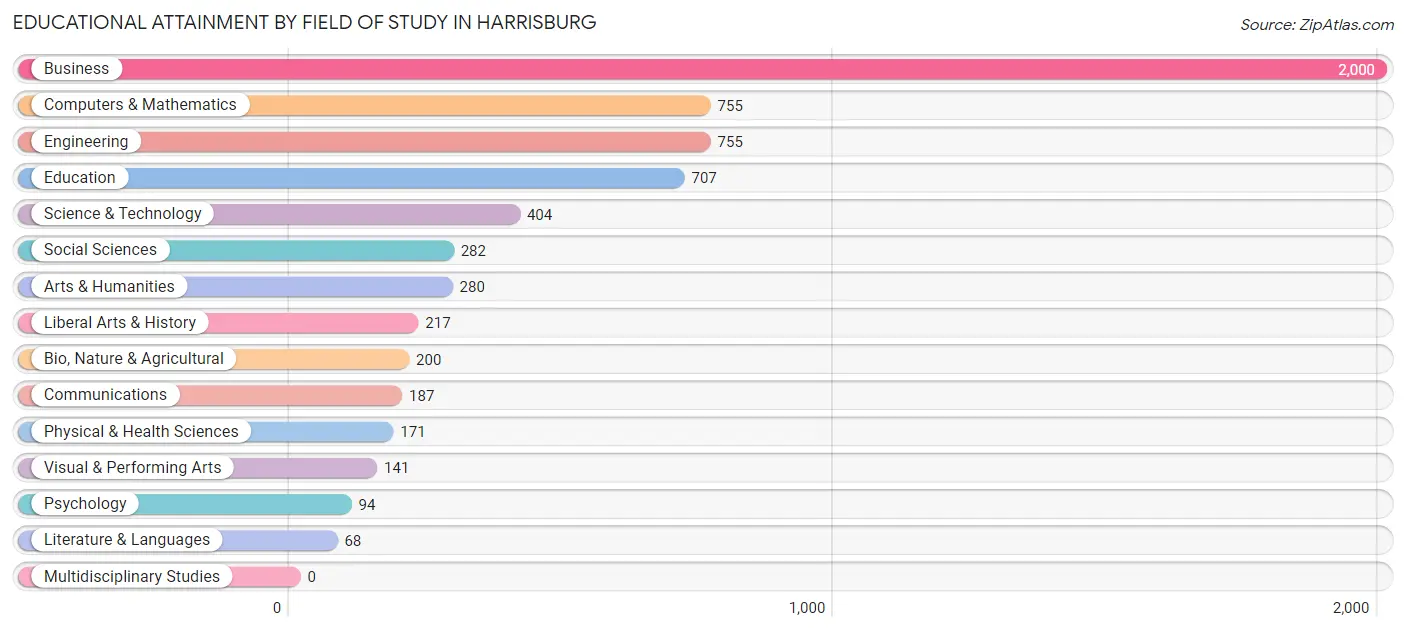
| Field of Study | # Graduates | % Graduates |
| Computers & Mathematics | 755 | 12.1% |
| Bio, Nature & Agricultural | 200 | 3.2% |
| Physical & Health Sciences | 171 | 2.7% |
| Psychology | 94 | 1.5% |
| Social Sciences | 282 | 4.5% |
| Engineering | 755 | 12.1% |
| Multidisciplinary Studies | 0 | 0.0% |
| Science & Technology | 404 | 6.5% |
| Business | 2,000 | 31.9% |
| Education | 707 | 11.3% |
| Literature & Languages | 68 | 1.1% |
| Liberal Arts & History | 217 | 3.5% |
| Visual & Performing Arts | 141 | 2.2% |
| Communications | 187 | 3.0% |
| Arts & Humanities | 280 | 4.5% |
| Total | 6,261 | 100.0% |
Transportation & Commute in Harrisburg
Vehicle Availability by Sex in Harrisburg
The most prevalent vehicle ownership categories in Harrisburg are males with 2 vehicles (1,942, accounting for 39.2%) and females with 2 vehicles (1,639, making up 42.7%).
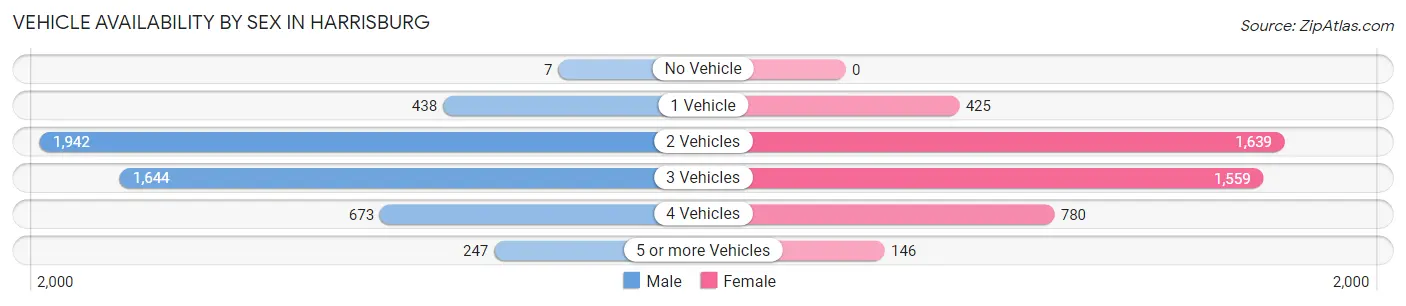
| Vehicles Available | Male | Female |
| No Vehicle | 7 (0.1%) | 0 (0.0%) |
| 1 Vehicle | 438 (8.8%) | 425 (9.3%) |
| 2 Vehicles | 1,942 (39.2%) | 1,639 (36.0%) |
| 3 Vehicles | 1,644 (33.2%) | 1,559 (34.3%) |
| 4 Vehicles | 673 (13.6%) | 780 (17.2%) |
| 5 or more Vehicles | 247 (5.0%) | 146 (3.2%) |
| Total | 4,951 (100.0%) | 4,549 (100.0%) |
Commute Time in Harrisburg
The most frequently occuring commute durations in Harrisburg are 20 to 24 minutes (1,380 commuters, 17.7%), 15 to 19 minutes (1,175 commuters, 15.1%), and 30 to 34 minutes (1,116 commuters, 14.3%).
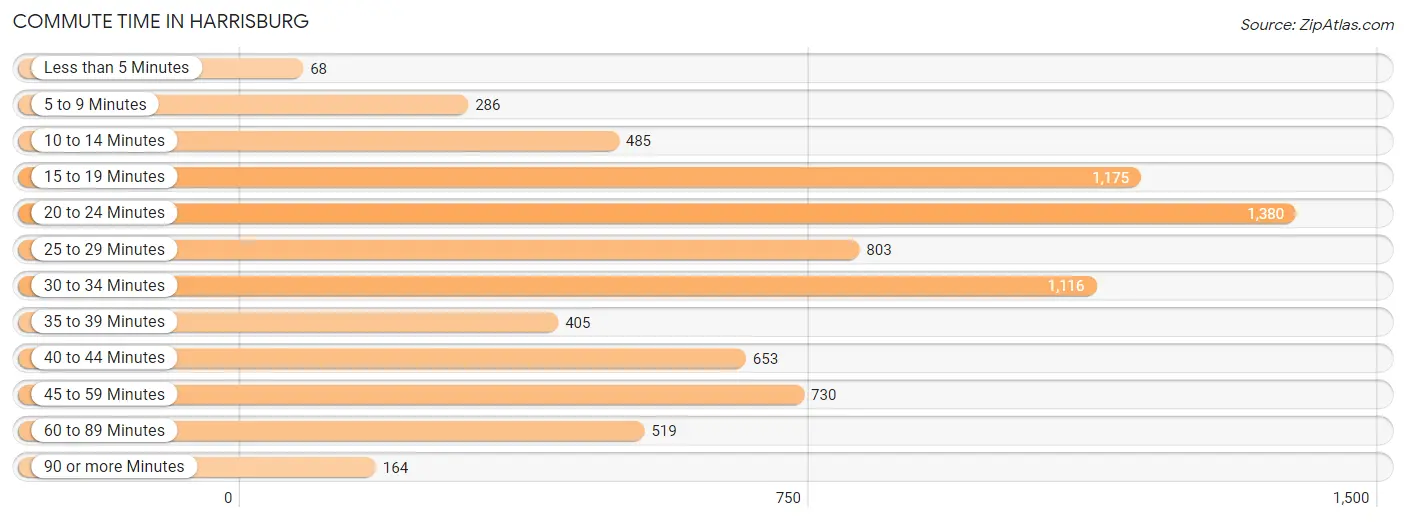
| Commute Time | # Commuters | % Commuters |
| Less than 5 Minutes | 68 | 0.9% |
| 5 to 9 Minutes | 286 | 3.7% |
| 10 to 14 Minutes | 485 | 6.2% |
| 15 to 19 Minutes | 1,175 | 15.1% |
| 20 to 24 Minutes | 1,380 | 17.7% |
| 25 to 29 Minutes | 803 | 10.3% |
| 30 to 34 Minutes | 1,116 | 14.3% |
| 35 to 39 Minutes | 405 | 5.2% |
| 40 to 44 Minutes | 653 | 8.4% |
| 45 to 59 Minutes | 730 | 9.4% |
| 60 to 89 Minutes | 519 | 6.7% |
| 90 or more Minutes | 164 | 2.1% |
Commute Time by Sex in Harrisburg
The most common commute times in Harrisburg are 15 to 19 minutes (699 commuters, 17.1%) for males and 20 to 24 minutes (815 commuters, 22.1%) for females.
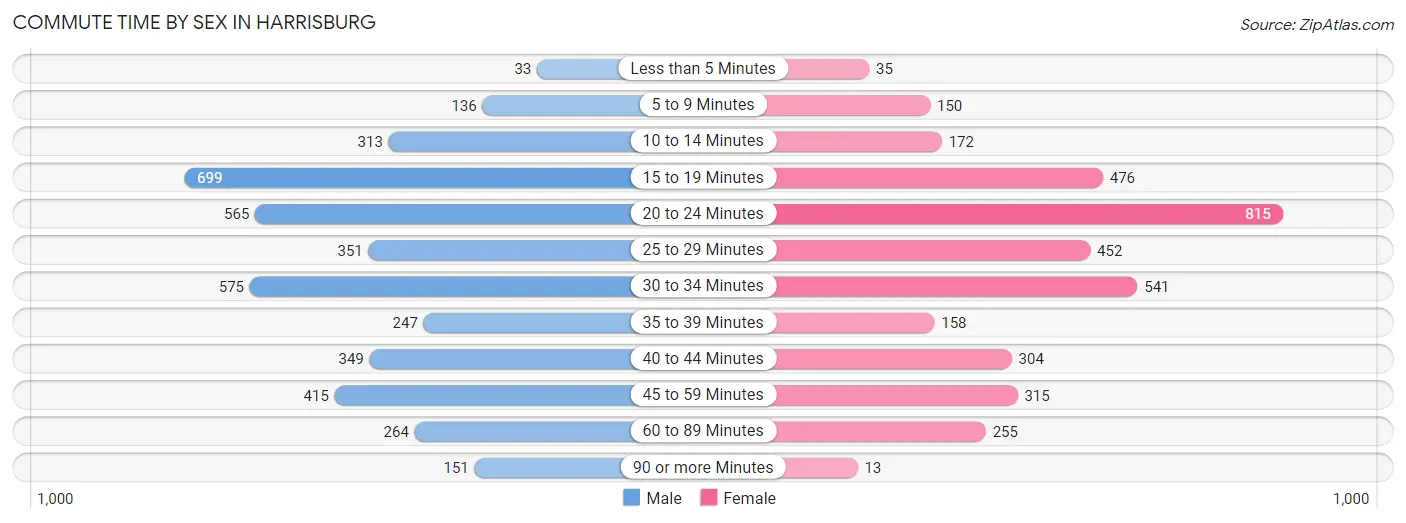
| Commute Time | Male | Female |
| Less than 5 Minutes | 33 (0.8%) | 35 (0.9%) |
| 5 to 9 Minutes | 136 (3.3%) | 150 (4.1%) |
| 10 to 14 Minutes | 313 (7.6%) | 172 (4.7%) |
| 15 to 19 Minutes | 699 (17.1%) | 476 (12.9%) |
| 20 to 24 Minutes | 565 (13.8%) | 815 (22.1%) |
| 25 to 29 Minutes | 351 (8.6%) | 452 (12.3%) |
| 30 to 34 Minutes | 575 (14.0%) | 541 (14.7%) |
| 35 to 39 Minutes | 247 (6.0%) | 158 (4.3%) |
| 40 to 44 Minutes | 349 (8.5%) | 304 (8.3%) |
| 45 to 59 Minutes | 415 (10.1%) | 315 (8.6%) |
| 60 to 89 Minutes | 264 (6.4%) | 255 (6.9%) |
| 90 or more Minutes | 151 (3.7%) | 13 (0.4%) |
Time of Departure to Work by Sex in Harrisburg
The most frequent times of departure to work in Harrisburg are 7:00 AM to 7:29 AM (728, 17.8%) for males and 7:00 AM to 7:29 AM (790, 21.4%) for females.
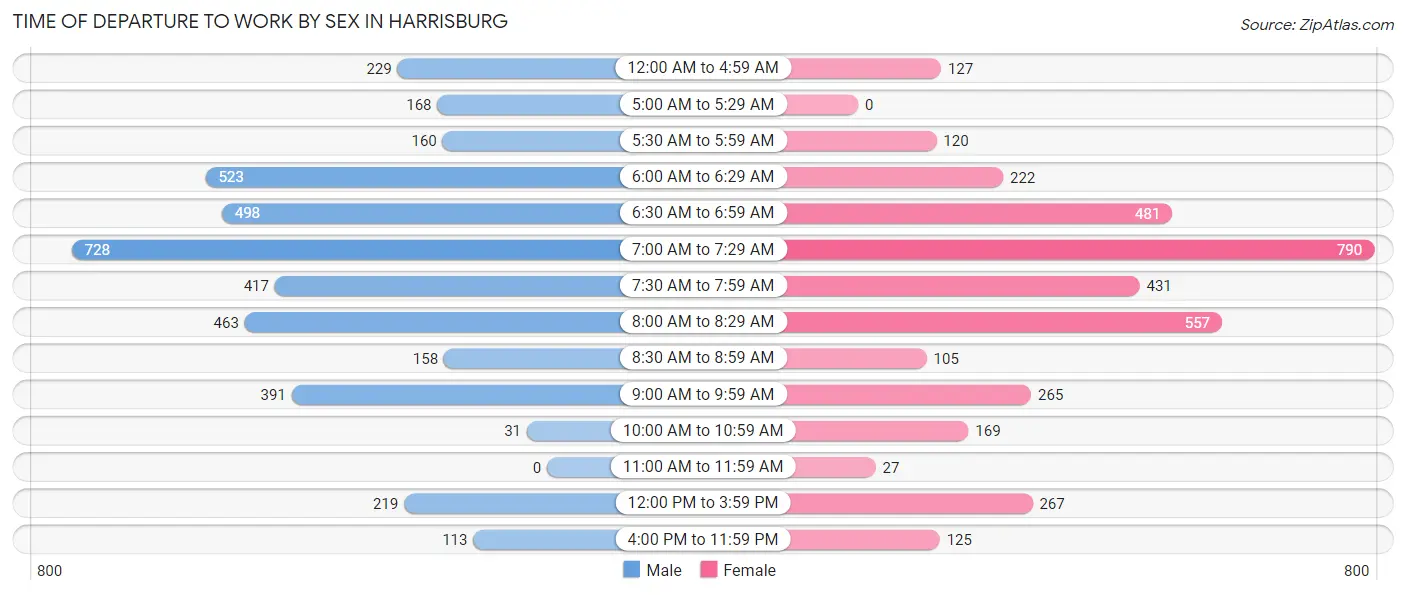
| Time of Departure | Male | Female |
| 12:00 AM to 4:59 AM | 229 (5.6%) | 127 (3.5%) |
| 5:00 AM to 5:29 AM | 168 (4.1%) | 0 (0.0%) |
| 5:30 AM to 5:59 AM | 160 (3.9%) | 120 (3.3%) |
| 6:00 AM to 6:29 AM | 523 (12.8%) | 222 (6.0%) |
| 6:30 AM to 6:59 AM | 498 (12.1%) | 481 (13.1%) |
| 7:00 AM to 7:29 AM | 728 (17.8%) | 790 (21.4%) |
| 7:30 AM to 7:59 AM | 417 (10.2%) | 431 (11.7%) |
| 8:00 AM to 8:29 AM | 463 (11.3%) | 557 (15.1%) |
| 8:30 AM to 8:59 AM | 158 (3.9%) | 105 (2.9%) |
| 9:00 AM to 9:59 AM | 391 (9.5%) | 265 (7.2%) |
| 10:00 AM to 10:59 AM | 31 (0.8%) | 169 (4.6%) |
| 11:00 AM to 11:59 AM | 0 (0.0%) | 27 (0.7%) |
| 12:00 PM to 3:59 PM | 219 (5.3%) | 267 (7.2%) |
| 4:00 PM to 11:59 PM | 113 (2.8%) | 125 (3.4%) |
| Total | 4,098 (100.0%) | 3,686 (100.0%) |
Housing Occupancy in Harrisburg
Occupancy by Ownership in Harrisburg
Of the total 5,508 dwellings in Harrisburg, owner-occupied units account for 5,005 (90.9%), while renter-occupied units make up 503 (9.1%).
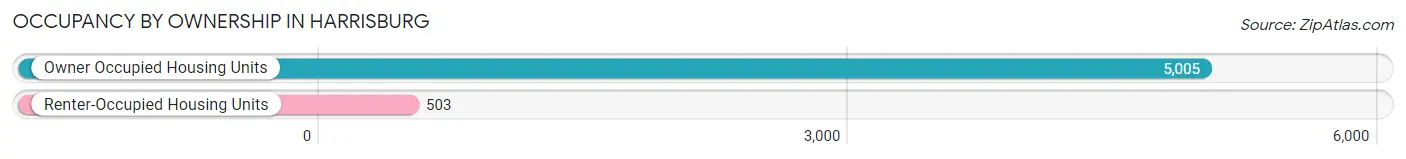
| Occupancy | # Housing Units | % Housing Units |
| Owner Occupied Housing Units | 5,005 | 90.9% |
| Renter-Occupied Housing Units | 503 | 9.1% |
| Total Occupied Housing Units | 5,508 | 100.0% |
Occupancy by Household Size in Harrisburg
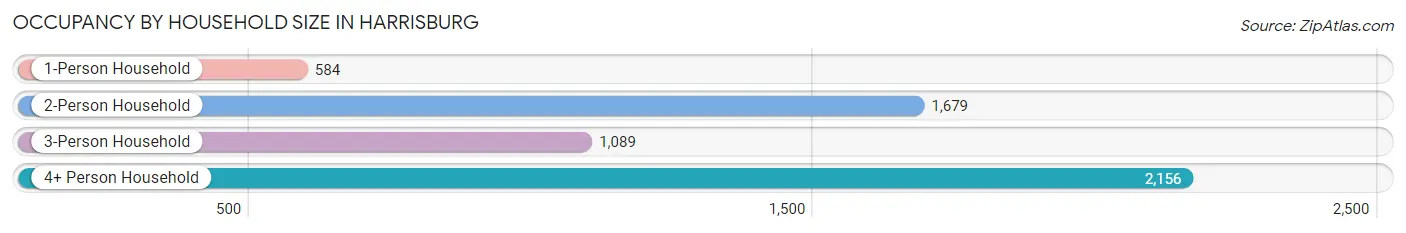
| Household Size | # Housing Units | % Housing Units |
| 1-Person Household | 584 | 10.6% |
| 2-Person Household | 1,679 | 30.5% |
| 3-Person Household | 1,089 | 19.8% |
| 4+ Person Household | 2,156 | 39.1% |
| Total Housing Units | 5,508 | 100.0% |
Occupancy by Ownership by Household Size in Harrisburg
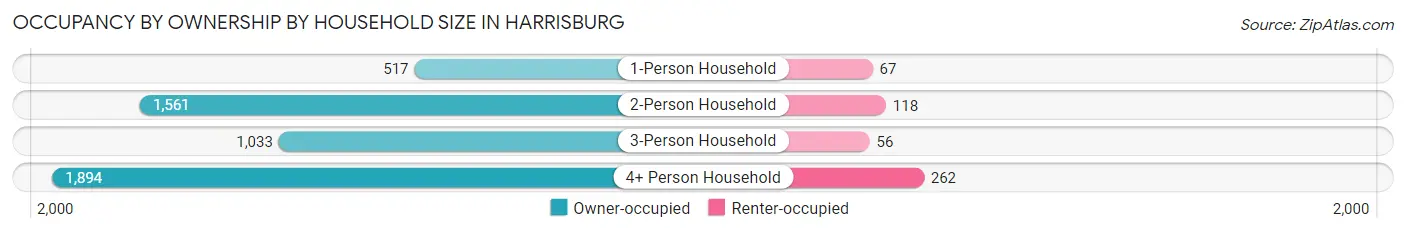
| Household Size | Owner-occupied | Renter-occupied |
| 1-Person Household | 517 (88.5%) | 67 (11.5%) |
| 2-Person Household | 1,561 (93.0%) | 118 (7.0%) |
| 3-Person Household | 1,033 (94.9%) | 56 (5.1%) |
| 4+ Person Household | 1,894 (87.8%) | 262 (12.1%) |
| Total Housing Units | 5,005 (90.9%) | 503 (9.1%) |
Occupancy by Educational Attainment in Harrisburg
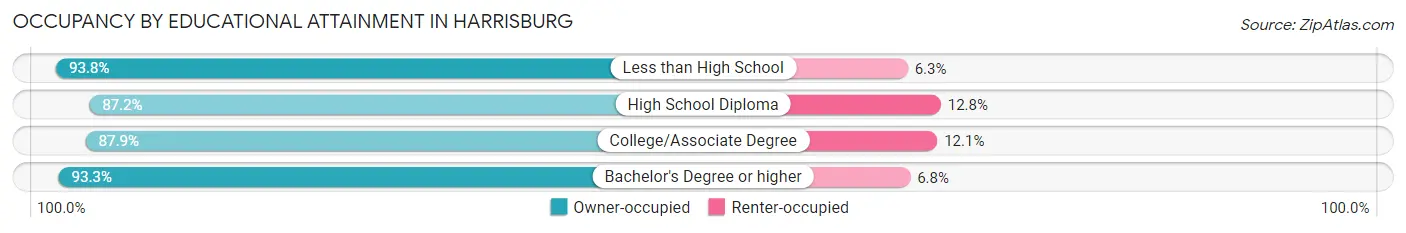
| Household Size | Owner-occupied | Renter-occupied |
| Less than High School | 105 (93.8%) | 7 (6.2%) |
| High School Diploma | 701 (87.2%) | 103 (12.8%) |
| College/Associate Degree | 1,365 (87.9%) | 188 (12.1%) |
| Bachelor's Degree or higher | 2,834 (93.2%) | 205 (6.8%) |
Occupancy by Age of Householder in Harrisburg
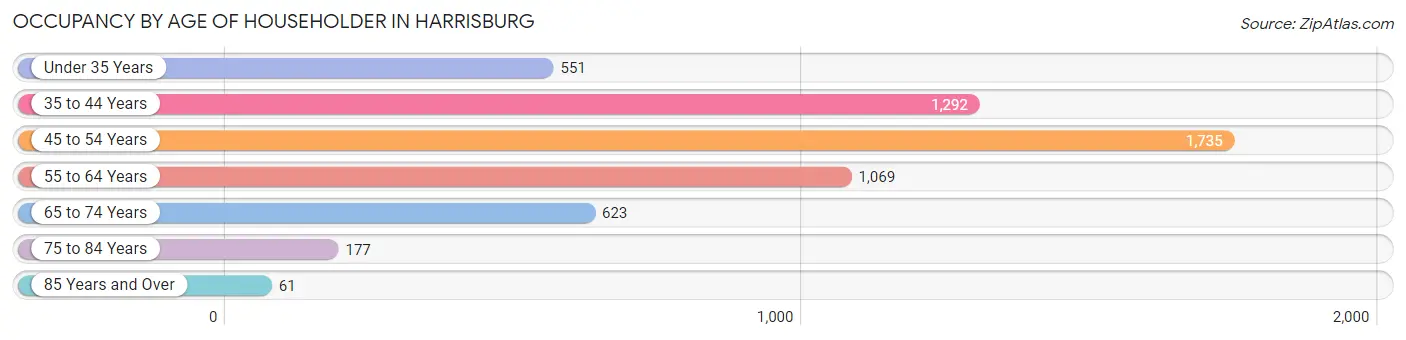
| Age Bracket | # Households | % Households |
| Under 35 Years | 551 | 10.0% |
| 35 to 44 Years | 1,292 | 23.5% |
| 45 to 54 Years | 1,735 | 31.5% |
| 55 to 64 Years | 1,069 | 19.4% |
| 65 to 74 Years | 623 | 11.3% |
| 75 to 84 Years | 177 | 3.2% |
| 85 Years and Over | 61 | 1.1% |
| Total | 5,508 | 100.0% |
Housing Finances in Harrisburg
Median Income by Occupancy in Harrisburg
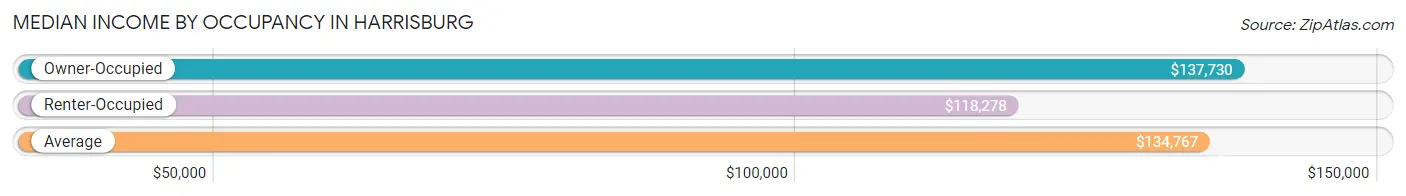
| Occupancy Type | # Households | Median Income |
| Owner-Occupied | 5,005 (90.9%) | $137,730 |
| Renter-Occupied | 503 (9.1%) | $118,278 |
| Average | 5,508 (100.0%) | $134,767 |
Occupancy by Householder Income Bracket in Harrisburg
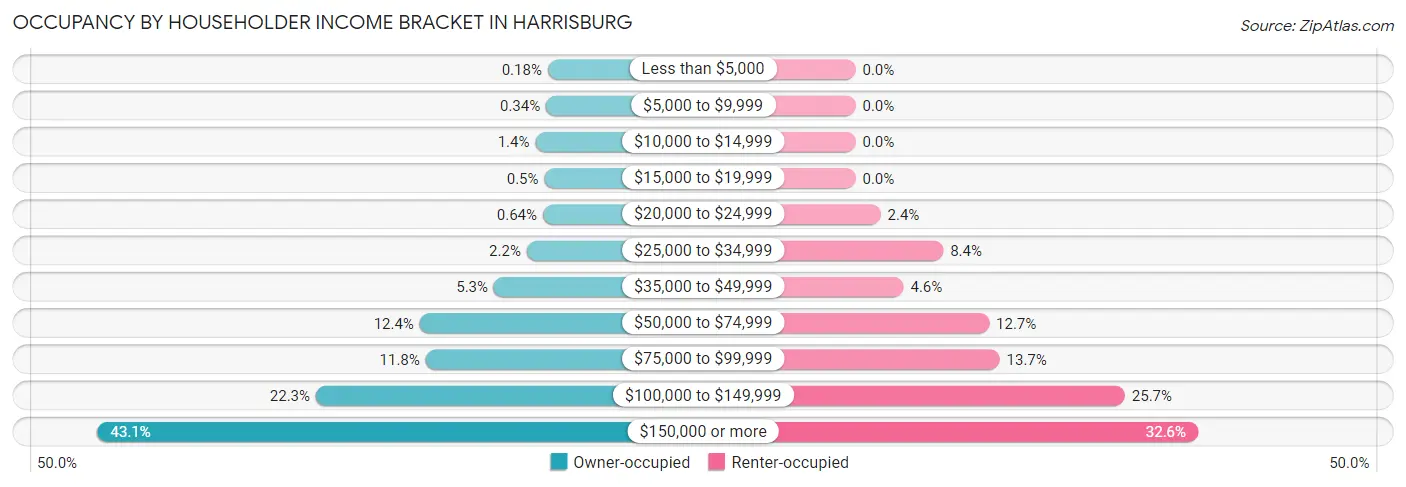
| Income Bracket | Owner-occupied | Renter-occupied |
| Less than $5,000 | 9 (0.2%) | 0 (0.0%) |
| $5,000 to $9,999 | 17 (0.3%) | 0 (0.0%) |
| $10,000 to $14,999 | 68 (1.4%) | 0 (0.0%) |
| $15,000 to $19,999 | 25 (0.5%) | 0 (0.0%) |
| $20,000 to $24,999 | 32 (0.6%) | 12 (2.4%) |
| $25,000 to $34,999 | 109 (2.2%) | 42 (8.4%) |
| $35,000 to $49,999 | 266 (5.3%) | 23 (4.6%) |
| $50,000 to $74,999 | 619 (12.4%) | 64 (12.7%) |
| $75,000 to $99,999 | 591 (11.8%) | 69 (13.7%) |
| $100,000 to $149,999 | 1,114 (22.3%) | 129 (25.7%) |
| $150,000 or more | 2,155 (43.1%) | 164 (32.6%) |
| Total | 5,005 (100.0%) | 503 (100.0%) |
Monthly Housing Cost Tiers in Harrisburg
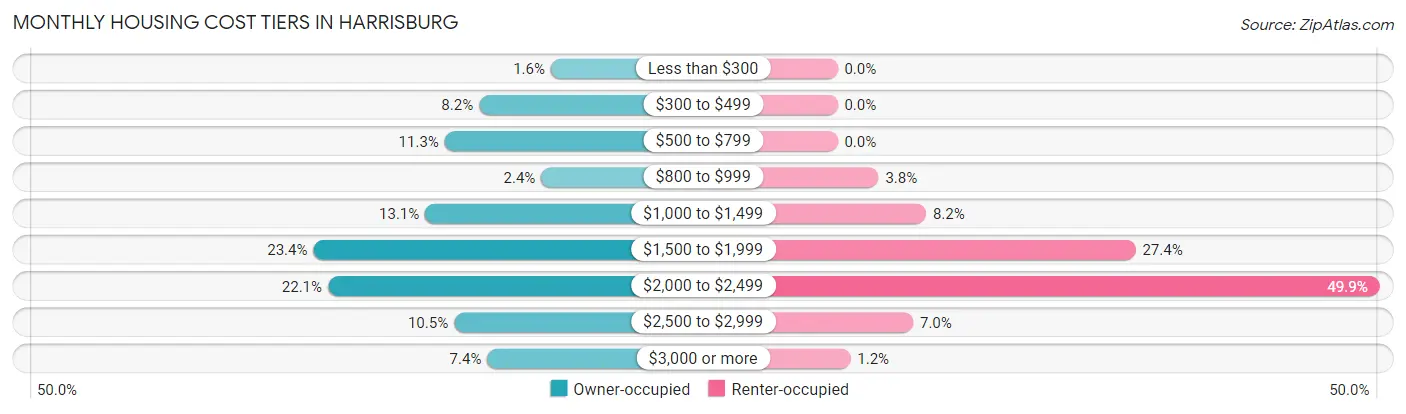
| Monthly Cost | Owner-occupied | Renter-occupied |
| Less than $300 | 78 (1.6%) | 0 (0.0%) |
| $300 to $499 | 409 (8.2%) | 0 (0.0%) |
| $500 to $799 | 567 (11.3%) | 0 (0.0%) |
| $800 to $999 | 122 (2.4%) | 19 (3.8%) |
| $1,000 to $1,499 | 657 (13.1%) | 41 (8.2%) |
| $1,500 to $1,999 | 1,172 (23.4%) | 138 (27.4%) |
| $2,000 to $2,499 | 1,105 (22.1%) | 251 (49.9%) |
| $2,500 to $2,999 | 524 (10.5%) | 35 (7.0%) |
| $3,000 or more | 371 (7.4%) | 6 (1.2%) |
| Total | 5,005 (100.0%) | 503 (100.0%) |
Physical Housing Characteristics in Harrisburg
Housing Structures in Harrisburg
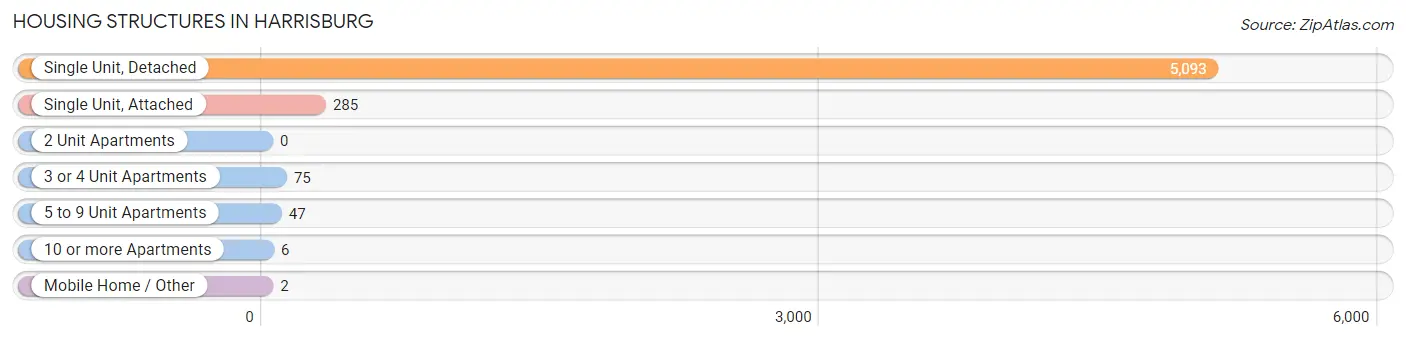
| Structure Type | # Housing Units | % Housing Units |
| Single Unit, Detached | 5,093 | 92.5% |
| Single Unit, Attached | 285 | 5.2% |
| 2 Unit Apartments | 0 | 0.0% |
| 3 or 4 Unit Apartments | 75 | 1.4% |
| 5 to 9 Unit Apartments | 47 | 0.9% |
| 10 or more Apartments | 6 | 0.1% |
| Mobile Home / Other | 2 | 0.0% |
| Total | 5,508 | 100.0% |
Housing Structures by Occupancy in Harrisburg
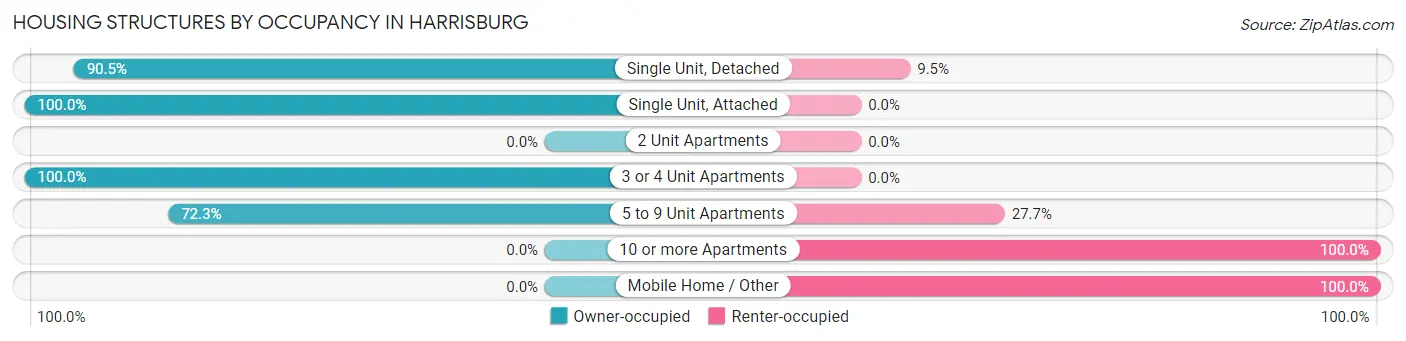
| Structure Type | Owner-occupied | Renter-occupied |
| Single Unit, Detached | 4,611 (90.5%) | 482 (9.5%) |
| Single Unit, Attached | 285 (100.0%) | 0 (0.0%) |
| 2 Unit Apartments | 0 (0.0%) | 0 (0.0%) |
| 3 or 4 Unit Apartments | 75 (100.0%) | 0 (0.0%) |
| 5 to 9 Unit Apartments | 34 (72.3%) | 13 (27.7%) |
| 10 or more Apartments | 0 (0.0%) | 6 (100.0%) |
| Mobile Home / Other | 0 (0.0%) | 2 (100.0%) |
| Total | 5,005 (90.9%) | 503 (9.1%) |
Housing Structures by Number of Rooms in Harrisburg
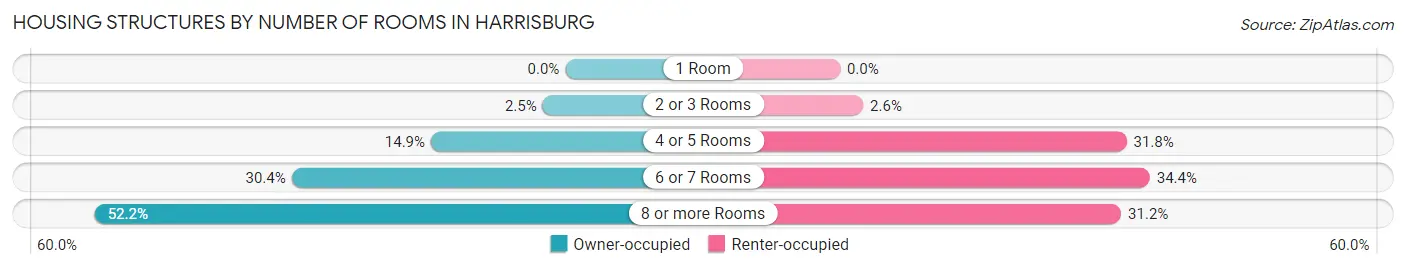
| Number of Rooms | Owner-occupied | Renter-occupied |
| 1 Room | 0 (0.0%) | 0 (0.0%) |
| 2 or 3 Rooms | 126 (2.5%) | 13 (2.6%) |
| 4 or 5 Rooms | 746 (14.9%) | 160 (31.8%) |
| 6 or 7 Rooms | 1,520 (30.4%) | 173 (34.4%) |
| 8 or more Rooms | 2,613 (52.2%) | 157 (31.2%) |
| Total | 5,005 (100.0%) | 503 (100.0%) |
Housing Structure by Heating Type in Harrisburg
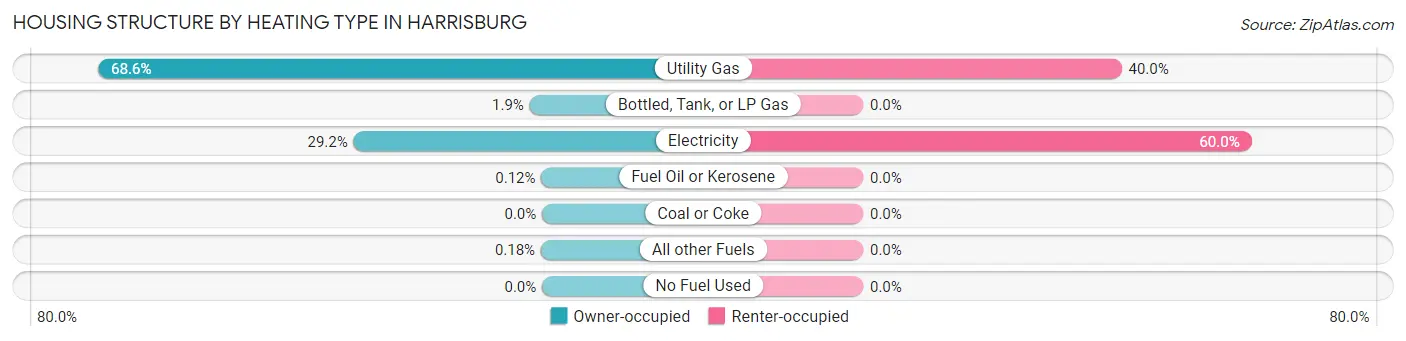
| Heating Type | Owner-occupied | Renter-occupied |
| Utility Gas | 3,435 (68.6%) | 201 (40.0%) |
| Bottled, Tank, or LP Gas | 96 (1.9%) | 0 (0.0%) |
| Electricity | 1,459 (29.1%) | 302 (60.0%) |
| Fuel Oil or Kerosene | 6 (0.1%) | 0 (0.0%) |
| Coal or Coke | 0 (0.0%) | 0 (0.0%) |
| All other Fuels | 9 (0.2%) | 0 (0.0%) |
| No Fuel Used | 0 (0.0%) | 0 (0.0%) |
| Total | 5,005 (100.0%) | 503 (100.0%) |
Household Vehicle Usage in Harrisburg
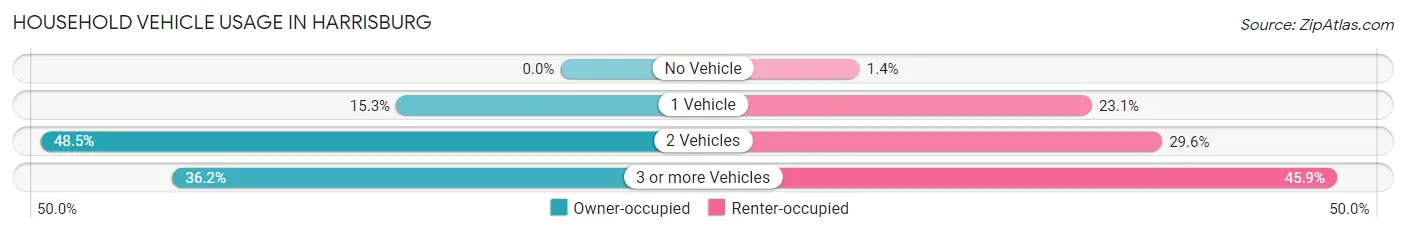
| Vehicles per Household | Owner-occupied | Renter-occupied |
| No Vehicle | 0 (0.0%) | 7 (1.4%) |
| 1 Vehicle | 768 (15.3%) | 116 (23.1%) |
| 2 Vehicles | 2,426 (48.5%) | 149 (29.6%) |
| 3 or more Vehicles | 1,811 (36.2%) | 231 (45.9%) |
| Total | 5,005 (100.0%) | 503 (100.0%) |
Real Estate & Mortgages in Harrisburg
Real Estate and Mortgage Overview in Harrisburg
| Characteristic | Without Mortgage | With Mortgage |
| Housing Units | 969 | 4,036 |
| Median Property Value | $361,300 | $389,500 |
| Median Household Income | $116,094 | $1,777 |
| Monthly Housing Costs | $512 | $371 |
| Real Estate Taxes | $2,334 | $50 |
Property Value by Mortgage Status in Harrisburg
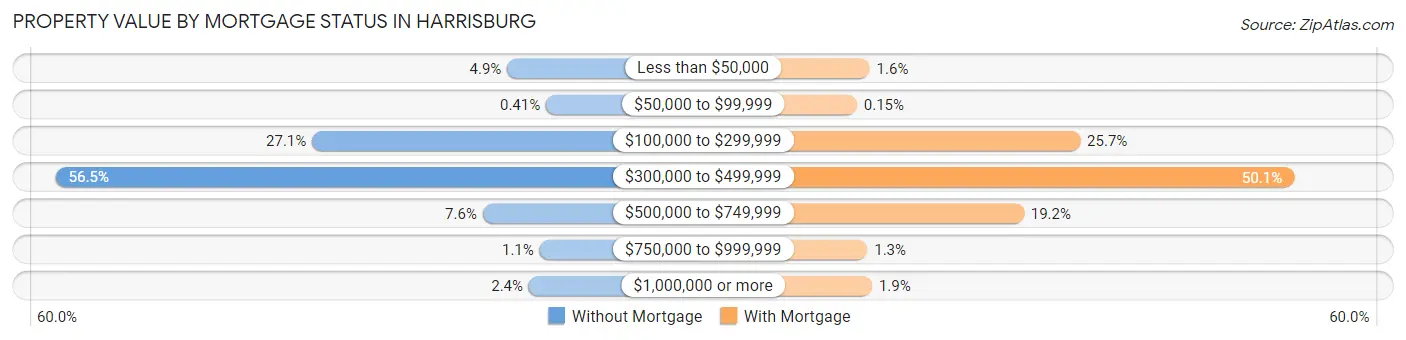
| Property Value | Without Mortgage | With Mortgage |
| Less than $50,000 | 47 (4.9%) | 65 (1.6%) |
| $50,000 to $99,999 | 4 (0.4%) | 6 (0.2%) |
| $100,000 to $299,999 | 263 (27.1%) | 1,036 (25.7%) |
| $300,000 to $499,999 | 547 (56.5%) | 2,023 (50.1%) |
| $500,000 to $749,999 | 74 (7.6%) | 776 (19.2%) |
| $750,000 to $999,999 | 11 (1.1%) | 54 (1.3%) |
| $1,000,000 or more | 23 (2.4%) | 76 (1.9%) |
| Total | 969 (100.0%) | 4,036 (100.0%) |
Household Income by Mortgage Status in Harrisburg
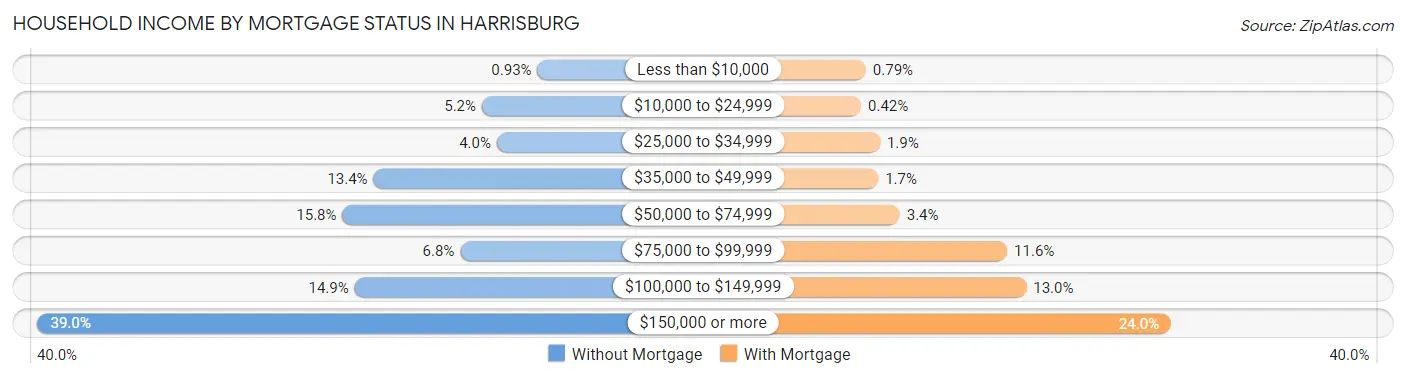
| Household Income | Without Mortgage | With Mortgage |
| Less than $10,000 | 9 (0.9%) | 32 (0.8%) |
| $10,000 to $24,999 | 50 (5.2%) | 17 (0.4%) |
| $25,000 to $34,999 | 39 (4.0%) | 75 (1.9%) |
| $35,000 to $49,999 | 130 (13.4%) | 70 (1.7%) |
| $50,000 to $74,999 | 153 (15.8%) | 136 (3.4%) |
| $75,000 to $99,999 | 66 (6.8%) | 466 (11.6%) |
| $100,000 to $149,999 | 144 (14.9%) | 525 (13.0%) |
| $150,000 or more | 378 (39.0%) | 970 (24.0%) |
| Total | 969 (100.0%) | 4,036 (100.0%) |
Property Value to Household Income Ratio in Harrisburg
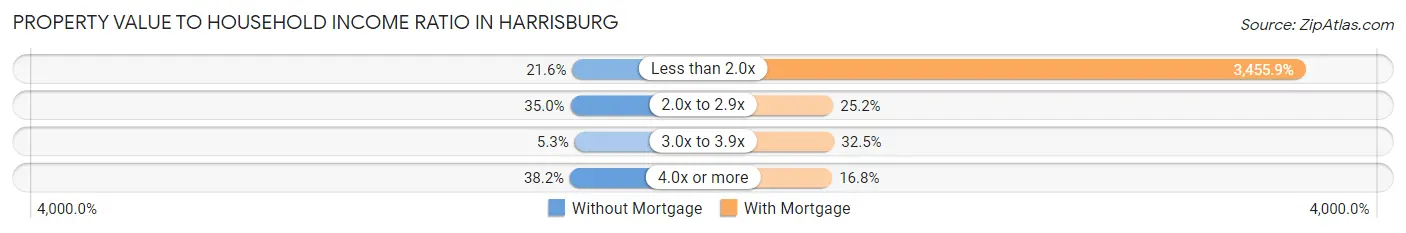
| Value-to-Income Ratio | Without Mortgage | With Mortgage |
| Less than 2.0x | 209 (21.6%) | 139,480 (3,455.9%) |
| 2.0x to 2.9x | 339 (35.0%) | 1,018 (25.2%) |
| 3.0x to 3.9x | 51 (5.3%) | 1,312 (32.5%) |
| 4.0x or more | 370 (38.2%) | 676 (16.8%) |
| Total | 969 (100.0%) | 4,036 (100.0%) |
Real Estate Taxes by Mortgage Status in Harrisburg
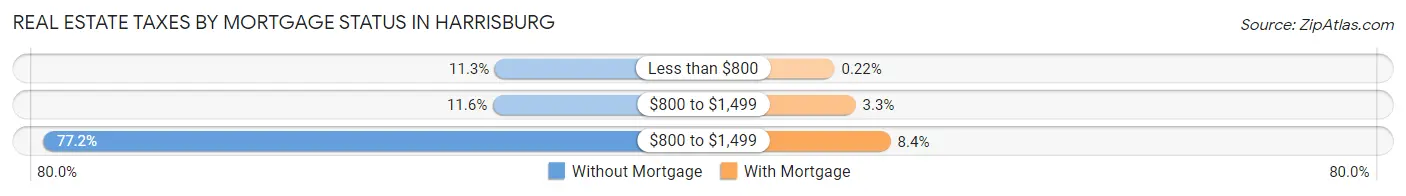
| Property Taxes | Without Mortgage | With Mortgage |
| Less than $800 | 109 (11.3%) | 9 (0.2%) |
| $800 to $1,499 | 112 (11.6%) | 133 (3.3%) |
| $800 to $1,499 | 748 (77.2%) | 340 (8.4%) |
| Total | 969 (100.0%) | 4,036 (100.0%) |
Health & Disability in Harrisburg
Health Insurance Coverage by Age in Harrisburg
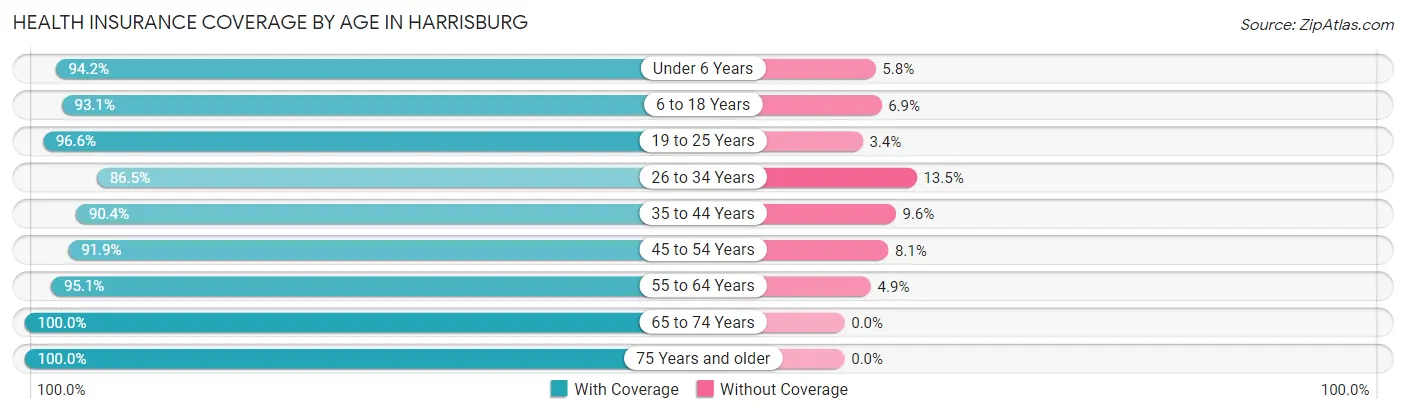
| Age Bracket | With Coverage | Without Coverage |
| Under 6 Years | 1,428 (94.2%) | 88 (5.8%) |
| 6 to 18 Years | 3,957 (93.1%) | 293 (6.9%) |
| 19 to 25 Years | 1,543 (96.6%) | 54 (3.4%) |
| 26 to 34 Years | 1,279 (86.5%) | 199 (13.5%) |
| 35 to 44 Years | 2,534 (90.4%) | 268 (9.6%) |
| 45 to 54 Years | 3,285 (91.9%) | 291 (8.1%) |
| 55 to 64 Years | 1,759 (95.1%) | 91 (4.9%) |
| 65 to 74 Years | 1,186 (100.0%) | 0 (0.0%) |
| 75 Years and older | 643 (100.0%) | 0 (0.0%) |
| Total | 17,614 (93.2%) | 1,284 (6.8%) |
Health Insurance Coverage by Citizenship Status in Harrisburg
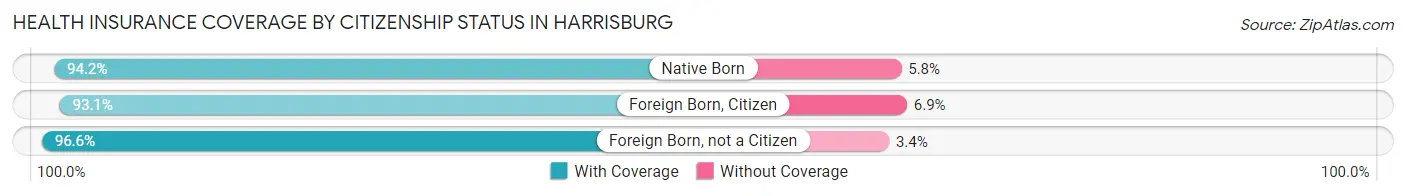
| Citizenship Status | With Coverage | Without Coverage |
| Native Born | 1,428 (94.2%) | 88 (5.8%) |
| Foreign Born, Citizen | 3,957 (93.1%) | 293 (6.9%) |
| Foreign Born, not a Citizen | 1,543 (96.6%) | 54 (3.4%) |
Health Insurance Coverage by Household Income in Harrisburg
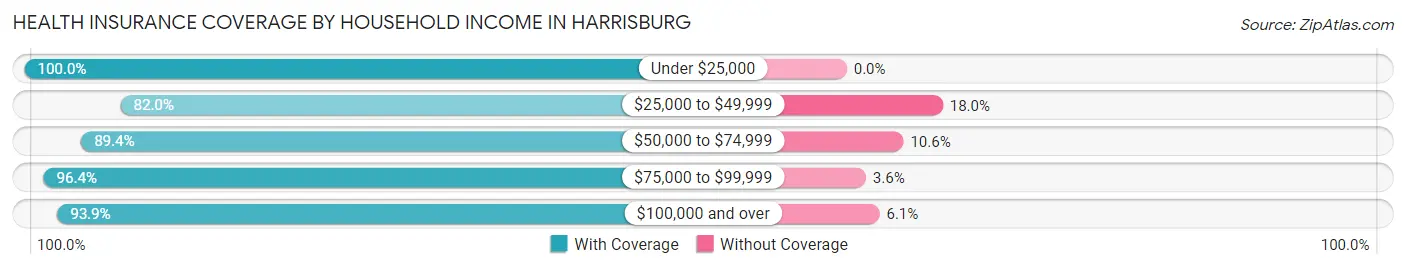
| Household Income | With Coverage | Without Coverage |
| Under $25,000 | 389 (100.0%) | 0 (0.0%) |
| $25,000 to $49,999 | 848 (82.0%) | 186 (18.0%) |
| $50,000 to $74,999 | 1,599 (89.4%) | 190 (10.6%) |
| $75,000 to $99,999 | 2,045 (96.4%) | 76 (3.6%) |
| $100,000 and over | 12,733 (93.9%) | 832 (6.1%) |
Public vs Private Health Insurance Coverage by Age in Harrisburg
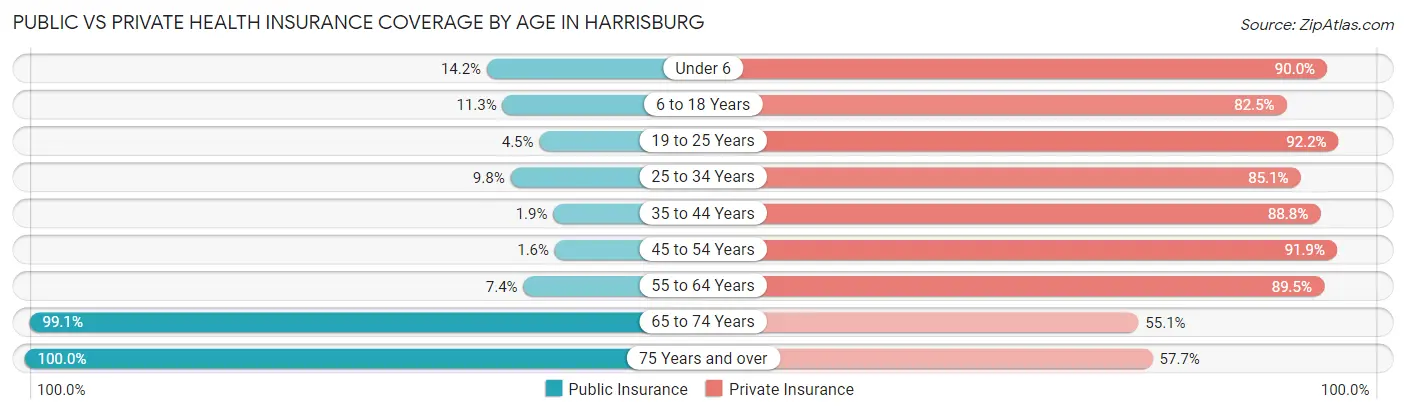
| Age Bracket | Public Insurance | Private Insurance |
| Under 6 | 215 (14.2%) | 1,365 (90.0%) |
| 6 to 18 Years | 480 (11.3%) | 3,507 (82.5%) |
| 19 to 25 Years | 71 (4.4%) | 1,472 (92.2%) |
| 25 to 34 Years | 145 (9.8%) | 1,258 (85.1%) |
| 35 to 44 Years | 52 (1.9%) | 2,487 (88.8%) |
| 45 to 54 Years | 56 (1.6%) | 3,285 (91.9%) |
| 55 to 64 Years | 137 (7.4%) | 1,655 (89.5%) |
| 65 to 74 Years | 1,175 (99.1%) | 653 (55.1%) |
| 75 Years and over | 643 (100.0%) | 371 (57.7%) |
| Total | 2,974 (15.7%) | 16,053 (85.0%) |
Disability Status by Sex by Age in Harrisburg
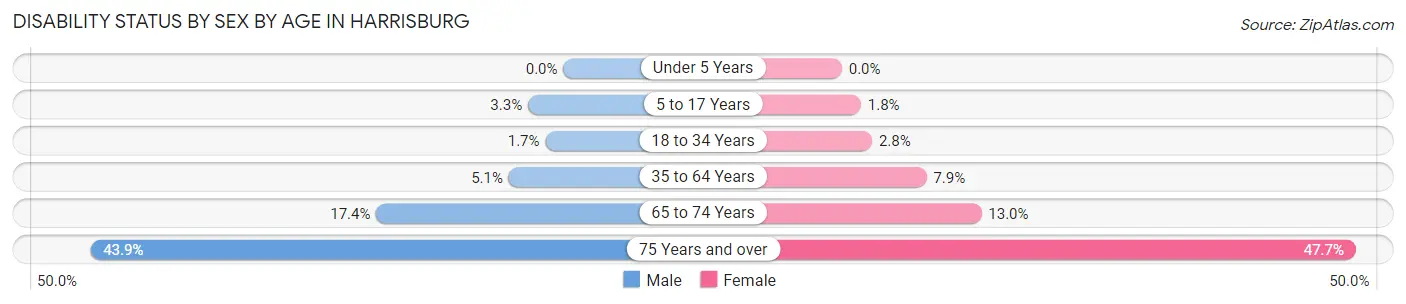
| Age Bracket | Male | Female |
| Under 5 Years | 0 (0.0%) | 0 (0.0%) |
| 5 to 17 Years | 66 (3.3%) | 42 (1.8%) |
| 18 to 34 Years | 23 (1.7%) | 55 (2.8%) |
| 35 to 64 Years | 204 (5.1%) | 330 (7.9%) |
| 65 to 74 Years | 100 (17.4%) | 79 (13.0%) |
| 75 Years and over | 101 (43.9%) | 197 (47.7%) |
Disability Class by Sex by Age in Harrisburg
Disability Class: Hearing Difficulty
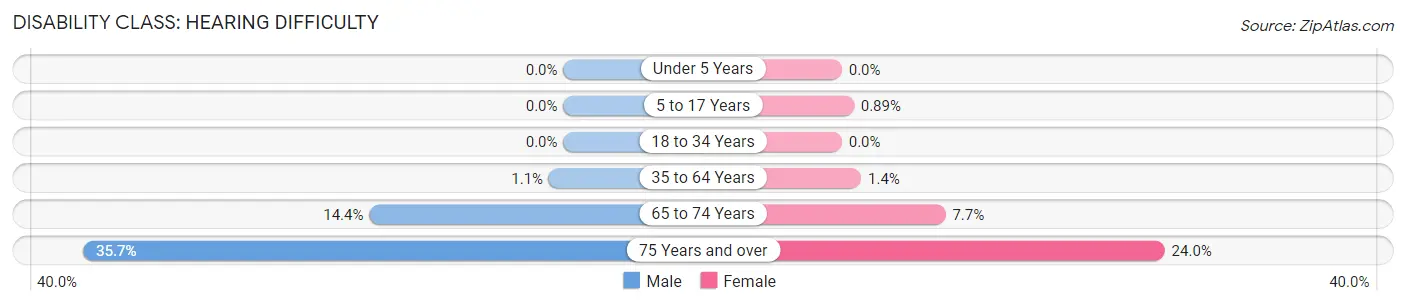
| Age Bracket | Male | Female |
| Under 5 Years | 0 (0.0%) | 0 (0.0%) |
| 5 to 17 Years | 0 (0.0%) | 21 (0.9%) |
| 18 to 34 Years | 0 (0.0%) | 0 (0.0%) |
| 35 to 64 Years | 43 (1.1%) | 60 (1.4%) |
| 65 to 74 Years | 83 (14.4%) | 47 (7.7%) |
| 75 Years and over | 82 (35.6%) | 99 (24.0%) |
Disability Class: Vision Difficulty
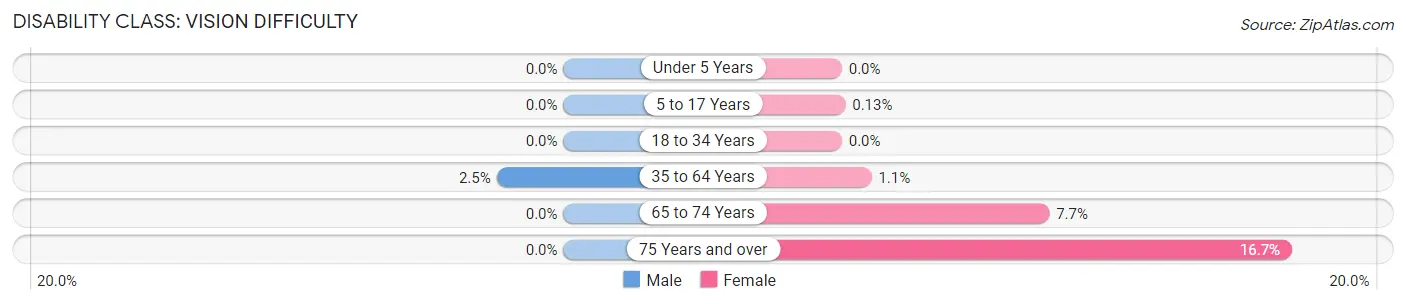
| Age Bracket | Male | Female |
| Under 5 Years | 0 (0.0%) | 0 (0.0%) |
| 5 to 17 Years | 0 (0.0%) | 3 (0.1%) |
| 18 to 34 Years | 0 (0.0%) | 0 (0.0%) |
| 35 to 64 Years | 100 (2.5%) | 46 (1.1%) |
| 65 to 74 Years | 0 (0.0%) | 47 (7.7%) |
| 75 Years and over | 0 (0.0%) | 69 (16.7%) |
Disability Class: Cognitive Difficulty
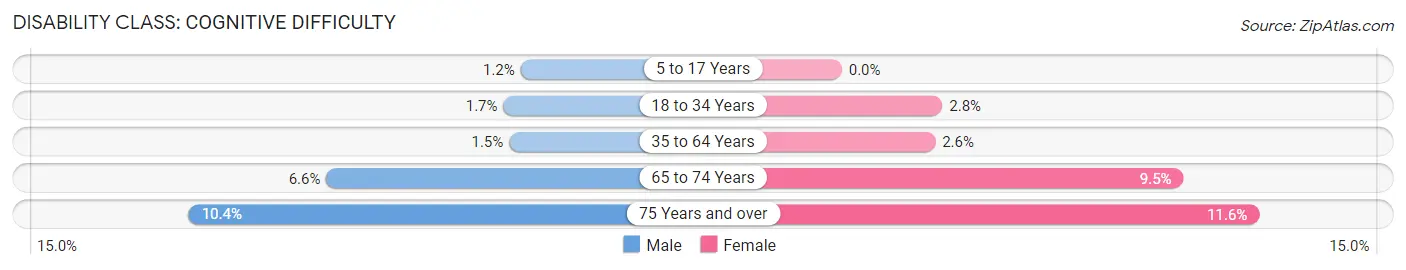
| Age Bracket | Male | Female |
| 5 to 17 Years | 24 (1.2%) | 0 (0.0%) |
| 18 to 34 Years | 23 (1.7%) | 55 (2.8%) |
| 35 to 64 Years | 61 (1.5%) | 109 (2.6%) |
| 65 to 74 Years | 38 (6.6%) | 58 (9.5%) |
| 75 Years and over | 24 (10.4%) | 48 (11.6%) |
Disability Class: Ambulatory Difficulty
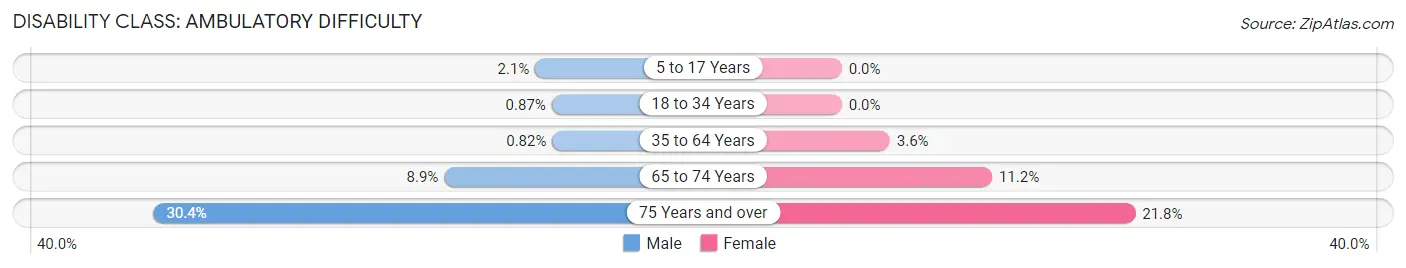
| Age Bracket | Male | Female |
| 5 to 17 Years | 42 (2.1%) | 0 (0.0%) |
| 18 to 34 Years | 12 (0.9%) | 0 (0.0%) |
| 35 to 64 Years | 33 (0.8%) | 150 (3.6%) |
| 65 to 74 Years | 51 (8.8%) | 68 (11.2%) |
| 75 Years and over | 70 (30.4%) | 90 (21.8%) |
Disability Class: Self-Care Difficulty
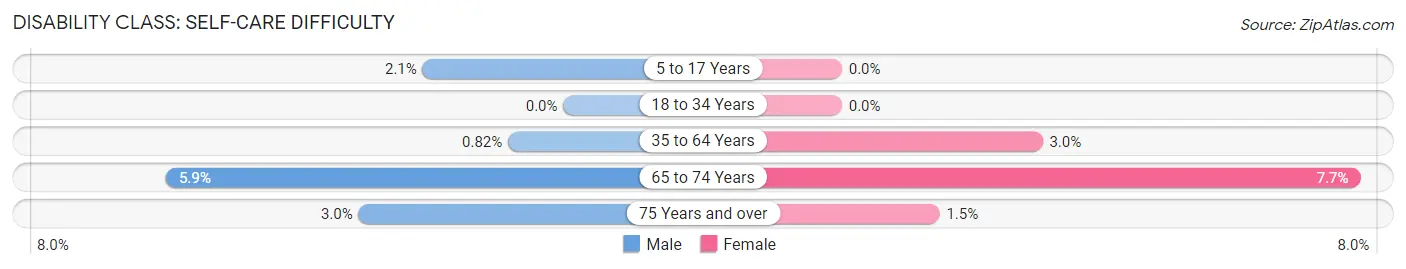
| Age Bracket | Male | Female |
| 5 to 17 Years | 42 (2.1%) | 0 (0.0%) |
| 18 to 34 Years | 0 (0.0%) | 0 (0.0%) |
| 35 to 64 Years | 33 (0.8%) | 125 (3.0%) |
| 65 to 74 Years | 34 (5.9%) | 47 (7.7%) |
| 75 Years and over | 7 (3.0%) | 6 (1.5%) |
Technology Access in Harrisburg
Computing Device Access in Harrisburg
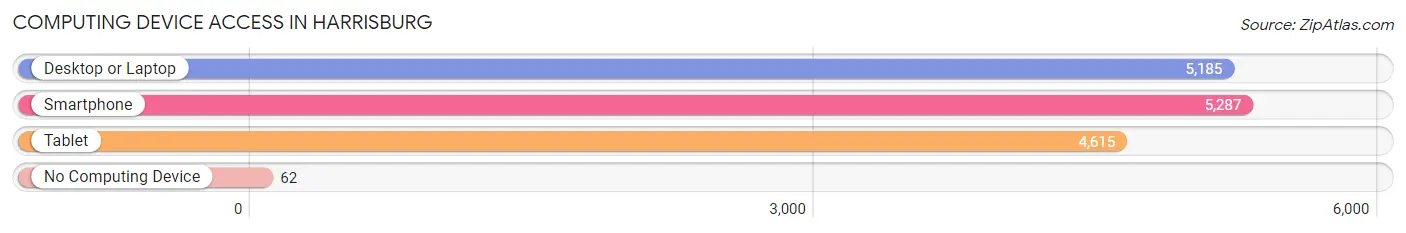
| Device Type | # Households | % Households |
| Desktop or Laptop | 5,185 | 94.1% |
| Smartphone | 5,287 | 96.0% |
| Tablet | 4,615 | 83.8% |
| No Computing Device | 62 | 1.1% |
| Total | 5,508 | 100.0% |
Internet Access in Harrisburg
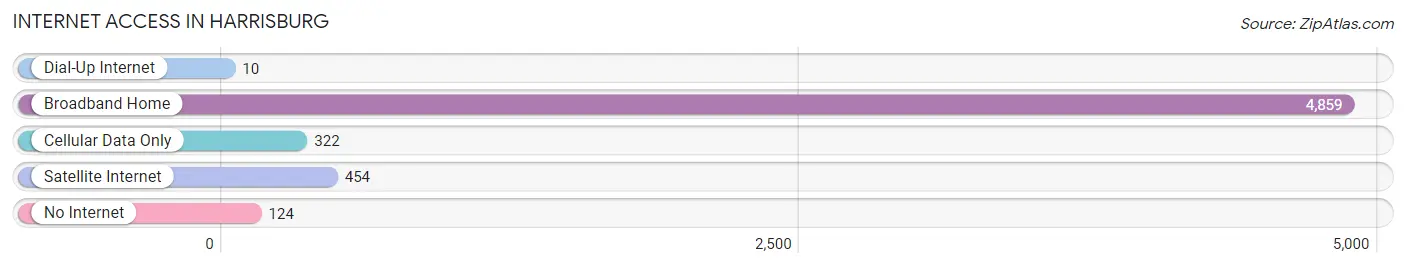
| Internet Type | # Households | % Households |
| Dial-Up Internet | 10 | 0.2% |
| Broadband Home | 4,859 | 88.2% |
| Cellular Data Only | 322 | 5.9% |
| Satellite Internet | 454 | 8.2% |
| No Internet | 124 | 2.2% |
| Total | 5,508 | 100.0% |
Harrisburg Summary
Harrisburg, North Carolina is a small town located in Cabarrus County, North Carolina. It is situated approximately 20 miles northeast of Charlotte and is part of the Charlotte metropolitan area. The town has a population of approximately 8,000 people and is home to a variety of businesses, including a number of small businesses and a few larger corporations.
History
Harrisburg was founded in 1792 by William Harris, a Revolutionary War veteran. The town was originally known as Harris’s Crossroads, and was named after Harris’s family. The town was incorporated in 1873 and was named Harrisburg in honor of William Harris.
The town was originally a farming community, but in the late 19th century, the railroad came to Harrisburg, bringing with it new industry and economic growth. The railroad also brought new people to the area, and the population of Harrisburg began to grow.
In the early 20th century, Harrisburg began to experience a period of growth and prosperity. The town was home to a number of businesses, including a cotton mill, a furniture factory, and a brickyard. The town also had a number of churches, schools, and other civic organizations.
In the late 20th century, Harrisburg began to experience a period of decline. The town’s population began to decline, and many of the businesses and factories that had been the backbone of the town’s economy began to close. In the early 21st century, Harrisburg began to experience a period of revitalization, with new businesses and development coming to the area.
Geography
Harrisburg is located in Cabarrus County, North Carolina. The town is situated approximately 20 miles northeast of Charlotte and is part of the Charlotte metropolitan area. The town is located in the Piedmont region of North Carolina, and is surrounded by rolling hills and forests. The town is located near the Catawba River, and is home to a number of parks and recreational areas.
Economy
Harrisburg’s economy is largely based on small businesses and a few larger corporations. The town is home to a number of small businesses, including restaurants, retail stores, and professional services. The town is also home to a few larger corporations, including a furniture manufacturer and a trucking company.
The town is also home to a number of educational institutions, including a community college and a technical college. The town is also home to a number of healthcare facilities, including a hospital and a number of medical clinics.
Demographics
As of the 2010 census, the population of Harrisburg was 8,000 people. The town has a population that is largely white (83.3%), with a small African American population (11.2%) and a small Hispanic population (3.2%). The town also has a small Asian population (1.2%). The median household income in Harrisburg is $50,000, and the median home value is $150,000.
Harrisburg is a small town with a rich history and a vibrant economy. The town is home to a number of businesses, educational institutions, and healthcare facilities, and is a great place to live and work.
Common Questions
What is Per Capita Income in Harrisburg?
Per Capita income in Harrisburg is $45,365.
What is the Median Family Income in Harrisburg?
Median Family Income in Harrisburg is $144,021.
What is the Median Household income in Harrisburg?
Median Household Income in Harrisburg is $134,767.
What is Income or Wage Gap in Harrisburg?
Income or Wage Gap in Harrisburg is 43.4%.
Women in Harrisburg earn 56.6 cents for every dollar earned by a man.
What is Inequality or Gini Index in Harrisburg?
Inequality or Gini Index in Harrisburg is 0.34.
What is the Total Population of Harrisburg?
Total Population of Harrisburg is 18,934.
What is the Total Male Population of Harrisburg?
Total Male Population of Harrisburg is 8,639.
What is the Total Female Population of Harrisburg?
Total Female Population of Harrisburg is 10,295.
What is the Ratio of Males per 100 Females in Harrisburg?
There are 83.91 Males per 100 Females in Harrisburg.
What is the Ratio of Females per 100 Males in Harrisburg?
There are 119.17 Females per 100 Males in Harrisburg.
What is the Median Population Age in Harrisburg?
Median Population Age in Harrisburg is 36.4 Years.
What is the Average Family Size in Harrisburg
Average Family Size in Harrisburg is 3.7 People.
What is the Average Household Size in Harrisburg
Average Household Size in Harrisburg is 3.4 People.
How Large is the Labor Force in Harrisburg?
There are 10,113 People in the Labor Forcein in Harrisburg.
What is the Percentage of People in the Labor Force in Harrisburg?
70.0% of People are in the Labor Force in Harrisburg.
What is the Unemployment Rate in Harrisburg?
Unemployment Rate in Harrisburg is 3.4%.