Pinehurst, NC Map & Demographics
Pinehurst Map
Pinehurst Overview
$62,322
PER CAPITA INCOME
$122,641
AVG FAMILY INCOME
$102,917
AVG HOUSEHOLD INCOME
44.5%
WAGE / INCOME GAP [ % ]
55.5¢/ $1
WAGE / INCOME GAP [ $ ]
$13,014
FAMILY INCOME DEFICIT
0.43
INEQUALITY / GINI INDEX
17,653
TOTAL POPULATION
8,904
MALE POPULATION
8,749
FEMALE POPULATION
101.77
MALES / 100 FEMALES
98.26
FEMALES / 100 MALES
60.3
MEDIAN AGE
2.6
AVG FAMILY SIZE
2.1
AVG HOUSEHOLD SIZE
6,759
LABOR FORCE [ PEOPLE ]
44.7%
PERCENT IN LABOR FORCE
4.2%
UNEMPLOYMENT RATE
Pinehurst Zip Codes
Pinehurst Area Codes
Income in Pinehurst
Income Overview in Pinehurst
Per Capita Income in Pinehurst is $62,322, while median incomes of families and households are $122,641 and $102,917 respectively.
| Characteristic | Number | Measure |
| Per Capita Income | 17,653 | $62,322 |
| Median Family Income | 5,371 | $122,641 |
| Mean Family Income | 5,371 | $153,605 |
| Median Household Income | 8,216 | $102,917 |
| Mean Household Income | 8,216 | $131,430 |
| Income Deficit | 5,371 | $13,014 |
| Wage / Income Gap (%) | 17,653 | 44.45% |
| Wage / Income Gap ($) | 17,653 | 55.55¢ per $1 |
| Gini / Inequality Index | 17,653 | 0.43 |
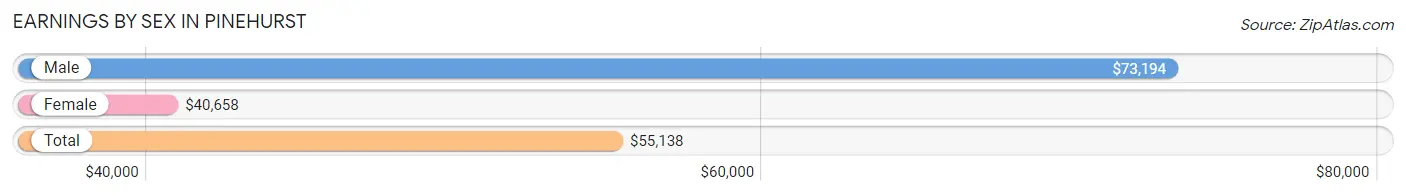
Earnings by Sex in Pinehurst
Average Earnings in Pinehurst are $55,138, $73,194 for men and $40,658 for women, a difference of 44.5%.
| Sex | Number | Average Earnings |
| Male | 4,235 (56.7%) | $73,194 |
| Female | 3,240 (43.3%) | $40,658 |
| Total | 7,475 (100.0%) | $55,138 |
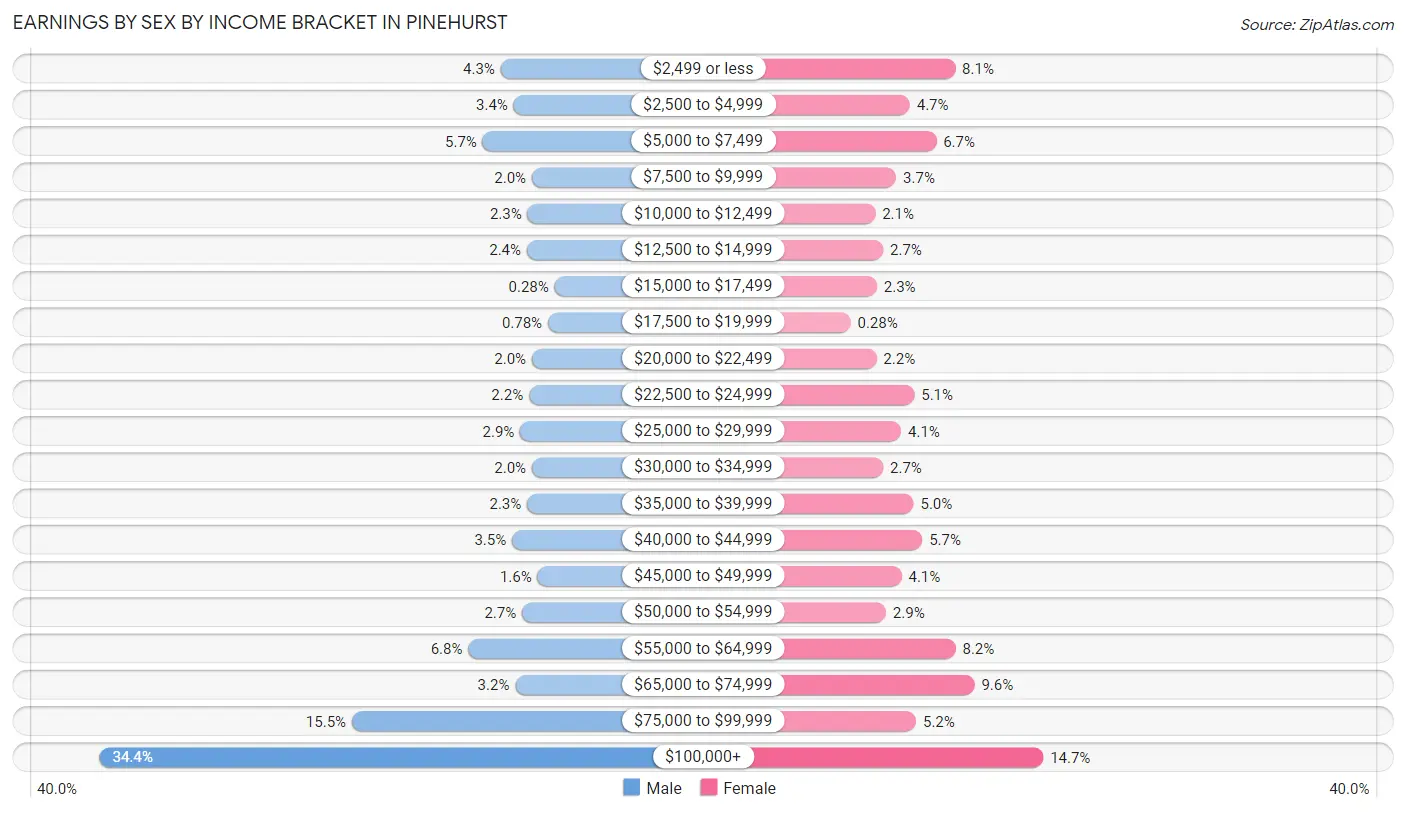
Earnings by Sex by Income Bracket in Pinehurst
The most common earnings brackets in Pinehurst are $100,000+ for men (1,456 | 34.4%) and $100,000+ for women (477 | 14.7%).
| Income | Male | Female |
| $2,499 or less | 183 (4.3%) | 263 (8.1%) |
| $2,500 to $4,999 | 142 (3.4%) | 153 (4.7%) |
| $5,000 to $7,499 | 240 (5.7%) | 217 (6.7%) |
| $7,500 to $9,999 | 84 (2.0%) | 120 (3.7%) |
| $10,000 to $12,499 | 98 (2.3%) | 69 (2.1%) |
| $12,500 to $14,999 | 100 (2.4%) | 88 (2.7%) |
| $15,000 to $17,499 | 12 (0.3%) | 73 (2.2%) |
| $17,500 to $19,999 | 33 (0.8%) | 9 (0.3%) |
| $20,000 to $22,499 | 84 (2.0%) | 72 (2.2%) |
| $22,500 to $24,999 | 93 (2.2%) | 164 (5.1%) |
| $25,000 to $29,999 | 121 (2.9%) | 132 (4.1%) |
| $30,000 to $34,999 | 84 (2.0%) | 88 (2.7%) |
| $35,000 to $39,999 | 99 (2.3%) | 162 (5.0%) |
| $40,000 to $44,999 | 147 (3.5%) | 183 (5.7%) |
| $45,000 to $49,999 | 66 (1.6%) | 133 (4.1%) |
| $50,000 to $54,999 | 115 (2.7%) | 95 (2.9%) |
| $55,000 to $64,999 | 286 (6.8%) | 264 (8.2%) |
| $65,000 to $74,999 | 137 (3.2%) | 310 (9.6%) |
| $75,000 to $99,999 | 655 (15.5%) | 168 (5.2%) |
| $100,000+ | 1,456 (34.4%) | 477 (14.7%) |
| Total | 4,235 (100.0%) | 3,240 (100.0%) |
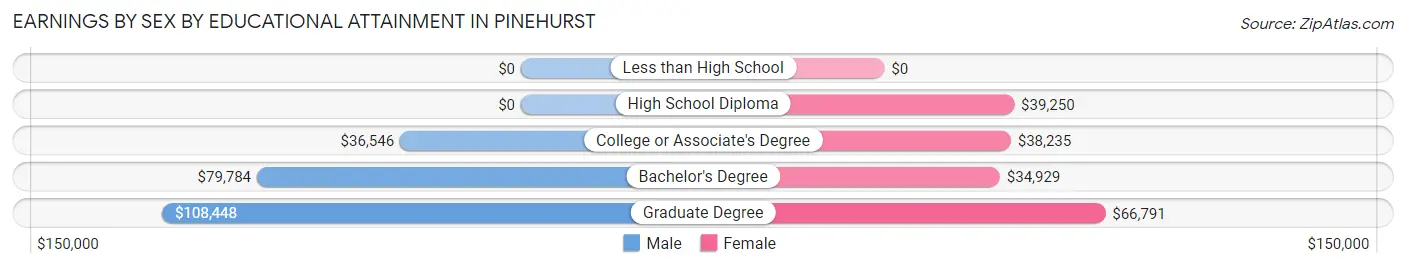
Earnings by Sex by Educational Attainment in Pinehurst
Average earnings in Pinehurst are $78,320 for men and $44,284 for women, a difference of 43.5%. Men with an educational attainment of graduate degree enjoy the highest average annual earnings of $108,448, while those with college or associate's degree education earn the least with $36,546. Women with an educational attainment of graduate degree earn the most with the average annual earnings of $66,791, while those with bachelor's degree education have the smallest earnings of $34,929.
| Educational Attainment | Male Income | Female Income |
| Less than High School | - | - |
| High School Diploma | - | - |
| College or Associate's Degree | $36,546 | $38,235 |
| Bachelor's Degree | $79,784 | $34,929 |
| Graduate Degree | $108,448 | $66,791 |
| Total | $78,320 | $44,284 |
Family Income in Pinehurst
Family Income Brackets in Pinehurst
According to the Pinehurst family income data, there are 1,203 families falling into the $100,000 to $149,999 income range, which is the most common income bracket and makes up 22.4% of all families. Conversely, the $25,000 to $34,999 income bracket is the least frequent group with only 21 families (0.4%) belonging to this category.
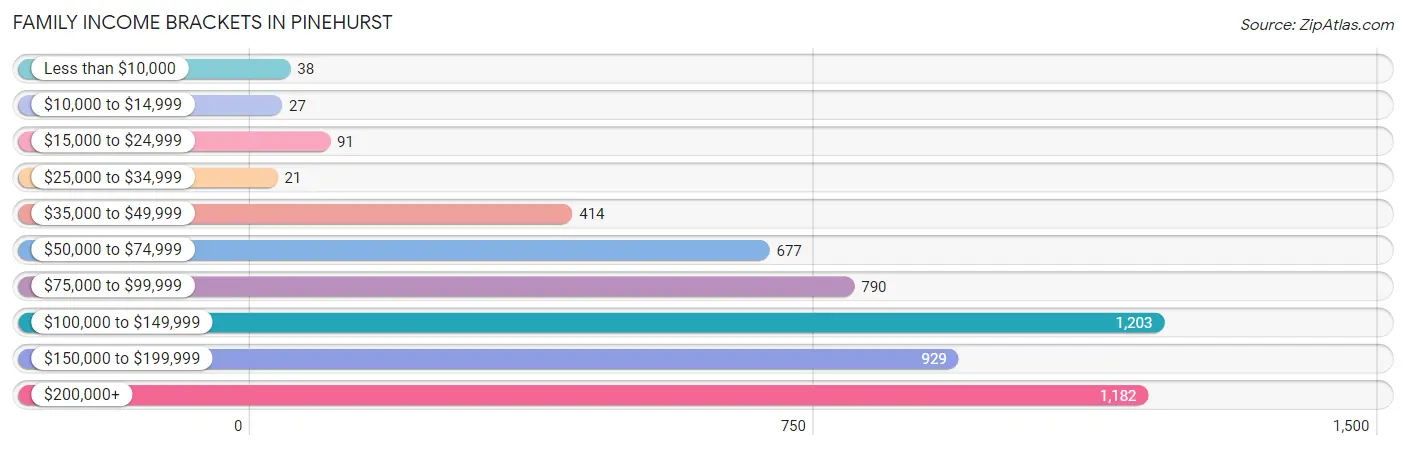
| Income Bracket | # Families | % Families |
| Less than $10,000 | 38 | 0.7% |
| $10,000 to $14,999 | 27 | 0.5% |
| $15,000 to $24,999 | 91 | 1.7% |
| $25,000 to $34,999 | 21 | 0.4% |
| $35,000 to $49,999 | 414 | 7.7% |
| $50,000 to $74,999 | 677 | 12.6% |
| $75,000 to $99,999 | 790 | 14.7% |
| $100,000 to $149,999 | 1,203 | 22.4% |
| $150,000 to $199,999 | 929 | 17.3% |
| $200,000+ | 1,182 | 22.0% |
Family Income by Famaliy Size in Pinehurst
6-person families (106 | 2.0%) account for the highest median family income in Pinehurst with $175,161 per family, while 2-person families (3,615 | 67.3%) have the highest median income of $60,101 per family member.
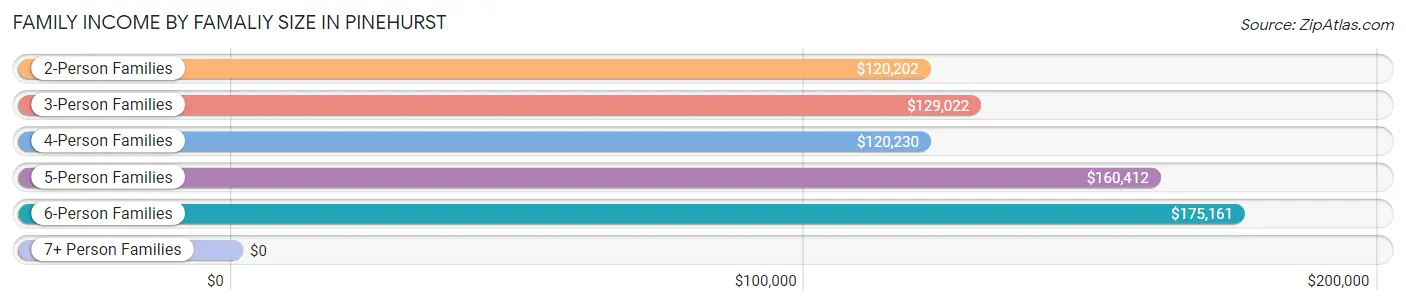
| Income Bracket | # Families | Median Income |
| 2-Person Families | 3,615 (67.3%) | $120,202 |
| 3-Person Families | 870 (16.2%) | $129,022 |
| 4-Person Families | 499 (9.3%) | $120,230 |
| 5-Person Families | 281 (5.2%) | $160,412 |
| 6-Person Families | 106 (2.0%) | $175,161 |
| 7+ Person Families | 0 (0.0%) | $0 |
| Total | 5,371 (100.0%) | $122,641 |
Family Income by Number of Earners in Pinehurst
The median family income in Pinehurst is $122,641, with families comprising 3+ earners (260) having the highest median family income of $197,679, while families with no earners (1,699) have the lowest median family income of $99,375, accounting for 4.8% and 31.6% of families, respectively.
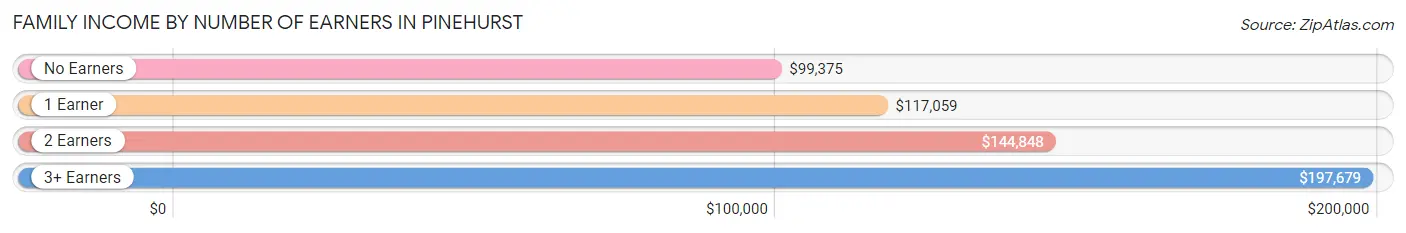
| Number of Earners | # Families | Median Income |
| No Earners | 1,699 (31.6%) | $99,375 |
| 1 Earner | 1,620 (30.2%) | $117,059 |
| 2 Earners | 1,792 (33.4%) | $144,848 |
| 3+ Earners | 260 (4.8%) | $197,679 |
| Total | 5,371 (100.0%) | $122,641 |
Household Income in Pinehurst
Household Income Brackets in Pinehurst
With 1,586 households falling in the category, the $100,000 to $149,999 income range is the most frequent in Pinehurst, accounting for 19.3% of all households. In contrast, only 66 households (0.8%) fall into the $10,000 to $14,999 income bracket, making it the least populous group.
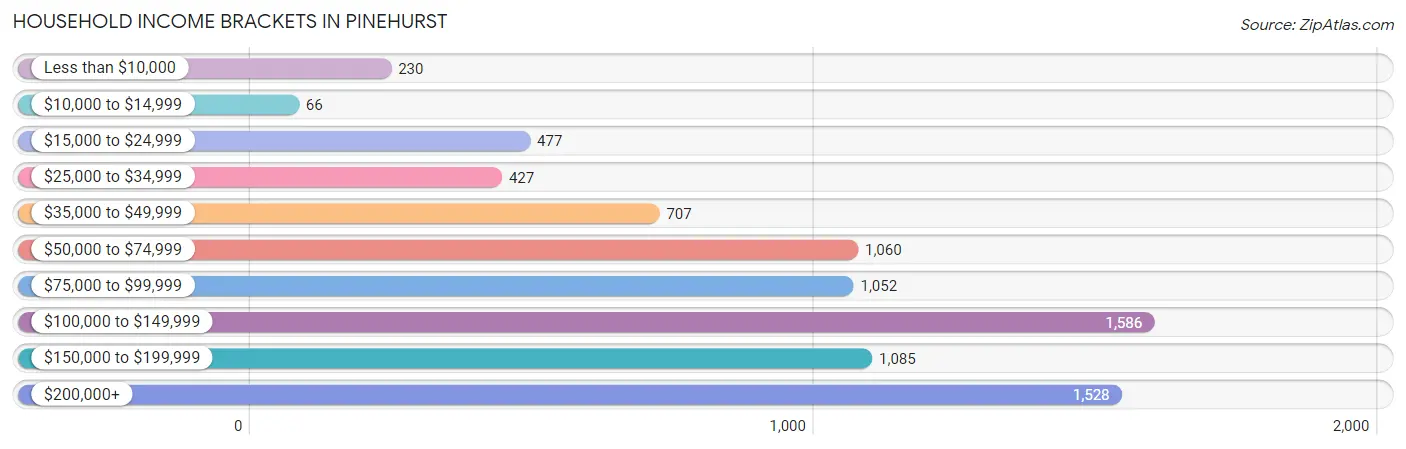
| Income Bracket | # Households | % Households |
| Less than $10,000 | 230 | 2.8% |
| $10,000 to $14,999 | 66 | 0.8% |
| $15,000 to $24,999 | 477 | 5.8% |
| $25,000 to $34,999 | 427 | 5.2% |
| $35,000 to $49,999 | 707 | 8.6% |
| $50,000 to $74,999 | 1,060 | 12.9% |
| $75,000 to $99,999 | 1,052 | 12.8% |
| $100,000 to $149,999 | 1,586 | 19.3% |
| $150,000 to $199,999 | 1,085 | 13.2% |
| $200,000+ | 1,528 | 18.6% |
Household Income by Householder Age in Pinehurst
The median household income in Pinehurst is $102,917, with the highest median household income of $152,750 found in the 45 to 64 years age bracket for the primary householder. A total of 2,400 households (29.2%) fall into this category. Meanwhile, the 15 to 24 years age bracket for the primary householder has the lowest median household income of $0, with 156 households (1.9%) in this group.
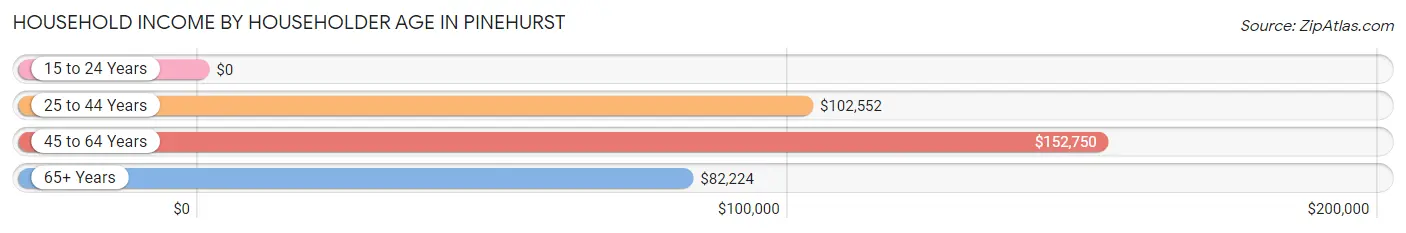
| Income Bracket | # Households | Median Income |
| 15 to 24 Years | 156 (1.9%) | $0 |
| 25 to 44 Years | 1,415 (17.2%) | $102,552 |
| 45 to 64 Years | 2,400 (29.2%) | $152,750 |
| 65+ Years | 4,245 (51.7%) | $82,224 |
| Total | 8,216 (100.0%) | $102,917 |
Poverty in Pinehurst
Income Below Poverty by Sex and Age in Pinehurst
With 1.7% poverty level for males and 5.4% for females among the residents of Pinehurst, 18 to 24 year old males and 18 to 24 year old females are the most vulnerable to poverty, with 17 males (6.4%) and 158 females (37.0%) in their respective age groups living below the poverty level.
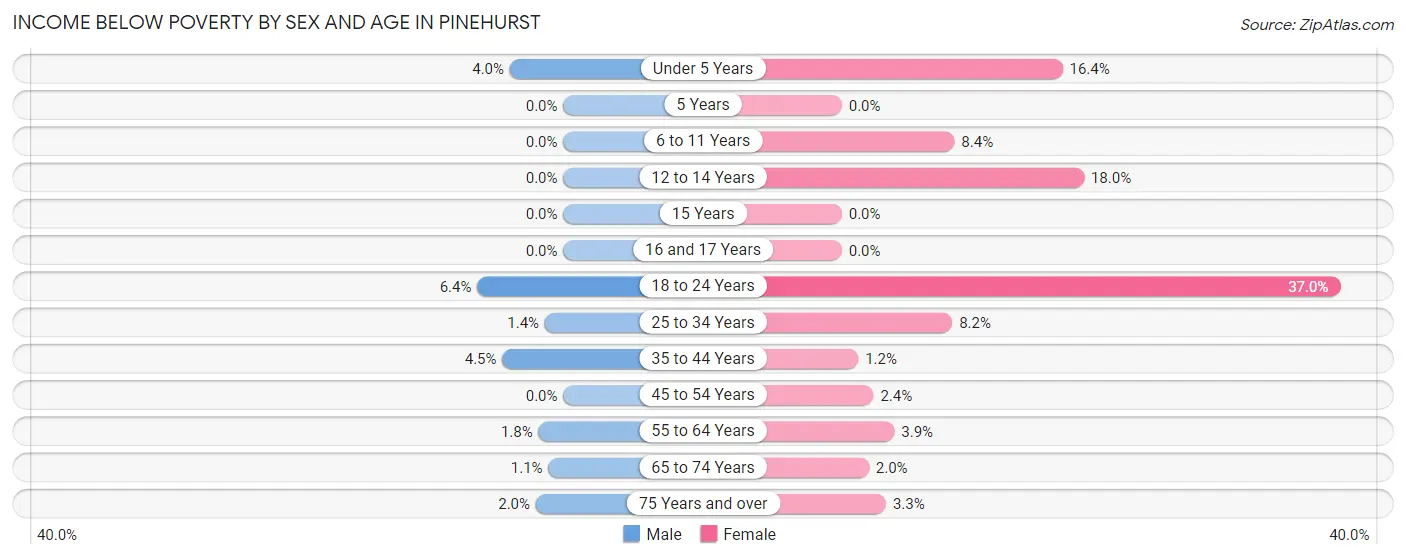
| Age Bracket | Male | Female |
| Under 5 Years | 19 (4.0%) | 39 (16.4%) |
| 5 Years | 0 (0.0%) | 0 (0.0%) |
| 6 to 11 Years | 0 (0.0%) | 26 (8.4%) |
| 12 to 14 Years | 0 (0.0%) | 16 (18.0%) |
| 15 Years | 0 (0.0%) | 0 (0.0%) |
| 16 and 17 Years | 0 (0.0%) | 0 (0.0%) |
| 18 to 24 Years | 17 (6.4%) | 158 (37.0%) |
| 25 to 34 Years | 10 (1.4%) | 40 (8.2%) |
| 35 to 44 Years | 30 (4.5%) | 11 (1.2%) |
| 45 to 54 Years | 0 (0.0%) | 19 (2.4%) |
| 55 to 64 Years | 21 (1.8%) | 57 (3.9%) |
| 65 to 74 Years | 19 (1.1%) | 36 (2.0%) |
| 75 Years and over | 31 (2.0%) | 59 (3.3%) |
| Total | 147 (1.7%) | 461 (5.4%) |
Income Above Poverty by Sex and Age in Pinehurst
According to the poverty statistics in Pinehurst, males aged 5 years and females aged 5 years are the age groups that are most secure financially, with 100.0% of males and 100.0% of females in these age groups living above the poverty line.
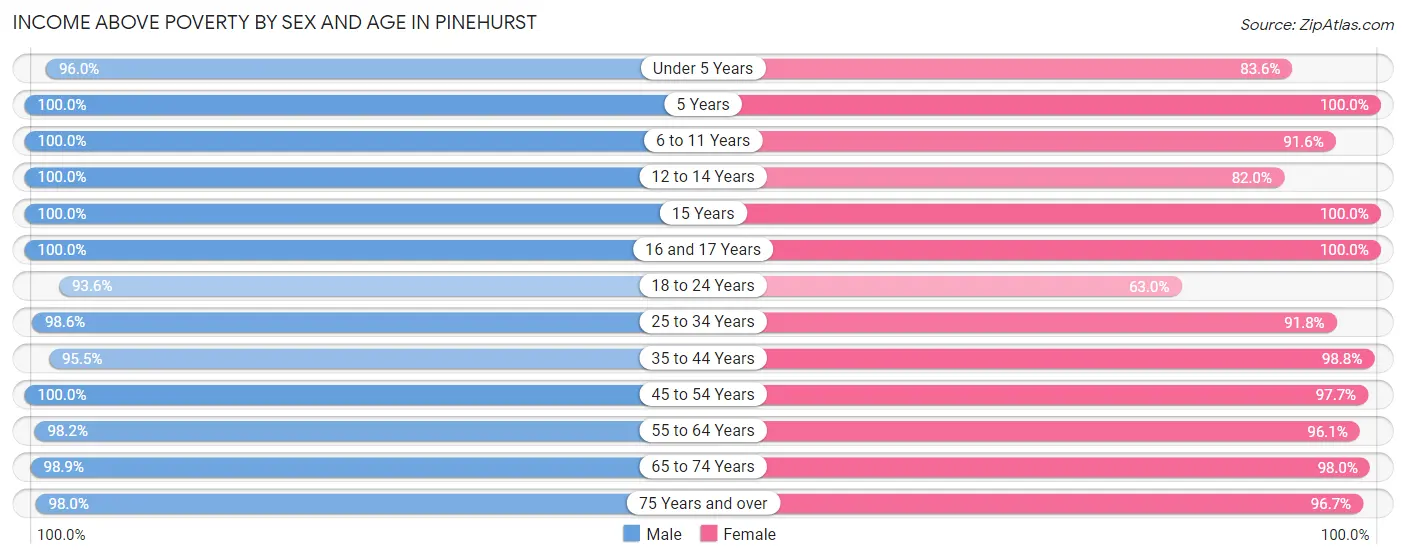
| Age Bracket | Male | Female |
| Under 5 Years | 460 (96.0%) | 199 (83.6%) |
| 5 Years | 86 (100.0%) | 108 (100.0%) |
| 6 to 11 Years | 595 (100.0%) | 285 (91.6%) |
| 12 to 14 Years | 389 (100.0%) | 73 (82.0%) |
| 15 Years | 168 (100.0%) | 56 (100.0%) |
| 16 and 17 Years | 156 (100.0%) | 96 (100.0%) |
| 18 to 24 Years | 249 (93.6%) | 269 (63.0%) |
| 25 to 34 Years | 721 (98.6%) | 448 (91.8%) |
| 35 to 44 Years | 632 (95.5%) | 887 (98.8%) |
| 45 to 54 Years | 862 (100.0%) | 789 (97.7%) |
| 55 to 64 Years | 1,120 (98.2%) | 1,403 (96.1%) |
| 65 to 74 Years | 1,700 (98.9%) | 1,752 (98.0%) |
| 75 Years and over | 1,489 (98.0%) | 1,742 (96.7%) |
| Total | 8,627 (98.3%) | 8,107 (94.6%) |
Income Below Poverty Among Married-Couple Families in Pinehurst
The poverty statistics for married-couple families in Pinehurst show that 0.9% or 45 of the total 5,035 families live below the poverty line. Families with no children have the highest poverty rate of 1.2%, comprising of 45 families. On the other hand, families with 1 or 2 children have the lowest poverty rate of 0.0%, which includes 0 families.
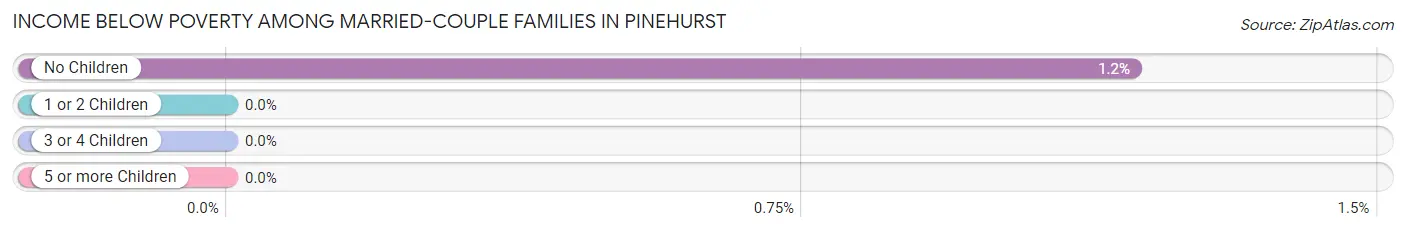
| Children | Above Poverty | Below Poverty |
| No Children | 3,770 (98.8%) | 45 (1.2%) |
| 1 or 2 Children | 875 (100.0%) | 0 (0.0%) |
| 3 or 4 Children | 345 (100.0%) | 0 (0.0%) |
| 5 or more Children | 0 (0.0%) | 0 (0.0%) |
| Total | 4,990 (99.1%) | 45 (0.9%) |
Income Below Poverty Among Single-Parent Households in Pinehurst
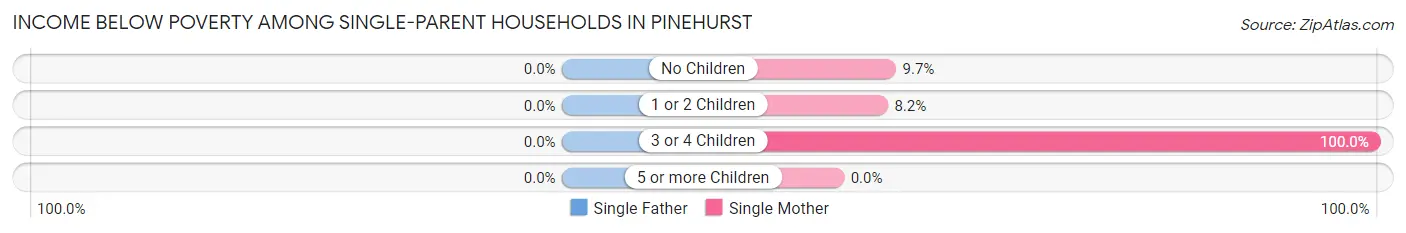
| Children | Single Father | Single Mother |
| No Children | 0 (0.0%) | 12 (9.7%) |
| 1 or 2 Children | 0 (0.0%) | 11 (8.2%) |
| 3 or 4 Children | 0 (0.0%) | 19 (100.0%) |
| 5 or more Children | 0 (0.0%) | 0 (0.0%) |
| Total | 0 (0.0%) | 42 (15.1%) |
Income Below Poverty Among Married-Couple vs Single-Parent Households in Pinehurst
The poverty data for Pinehurst shows that 45 of the married-couple family households (0.9%) and 42 of the single-parent households (12.5%) are living below the poverty level. Within the married-couple family households, those with no children have the highest poverty rate, with 45 households (1.2%) falling below the poverty line. Among the single-parent households, those with 3 or 4 children have the highest poverty rate, with 19 household (55.9%) living below poverty.
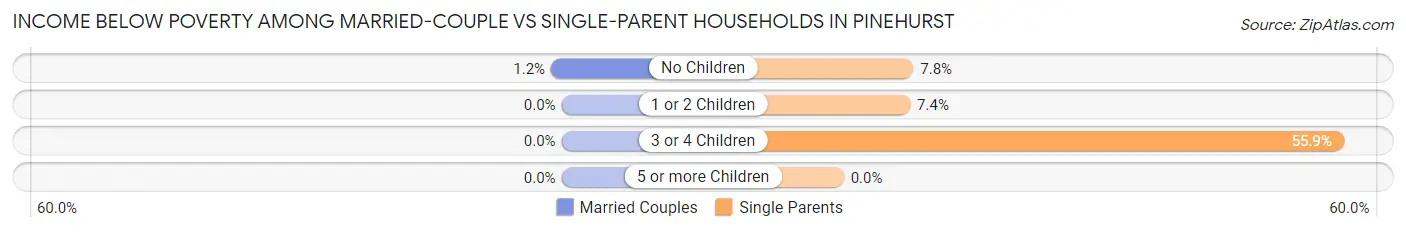
| Children | Married-Couple Families | Single-Parent Households |
| No Children | 45 (1.2%) | 12 (7.8%) |
| 1 or 2 Children | 0 (0.0%) | 11 (7.4%) |
| 3 or 4 Children | 0 (0.0%) | 19 (55.9%) |
| 5 or more Children | 0 (0.0%) | 0 (0.0%) |
| Total | 45 (0.9%) | 42 (12.5%) |
Race in Pinehurst
The most populous races in Pinehurst are White / Caucasian (15,834 | 89.7%), Two or more Races (815 | 4.6%), and Hispanic or Latino (470 | 2.7%).
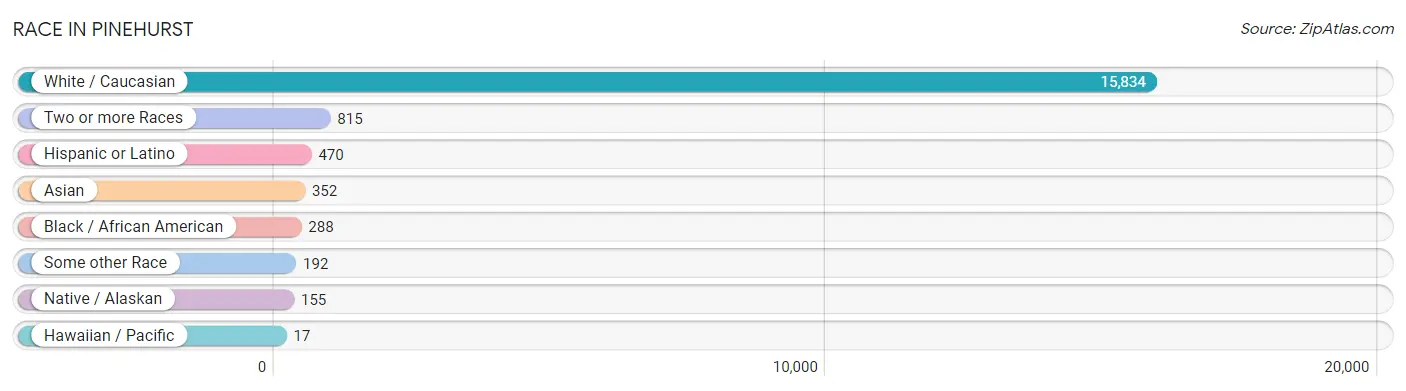
| Race | # Population | % Population |
| Asian | 352 | 2.0% |
| Black / African American | 288 | 1.6% |
| Hawaiian / Pacific | 17 | 0.1% |
| Hispanic or Latino | 470 | 2.7% |
| Native / Alaskan | 155 | 0.9% |
| White / Caucasian | 15,834 | 89.7% |
| Two or more Races | 815 | 4.6% |
| Some other Race | 192 | 1.1% |
| Total | 17,653 | 100.0% |
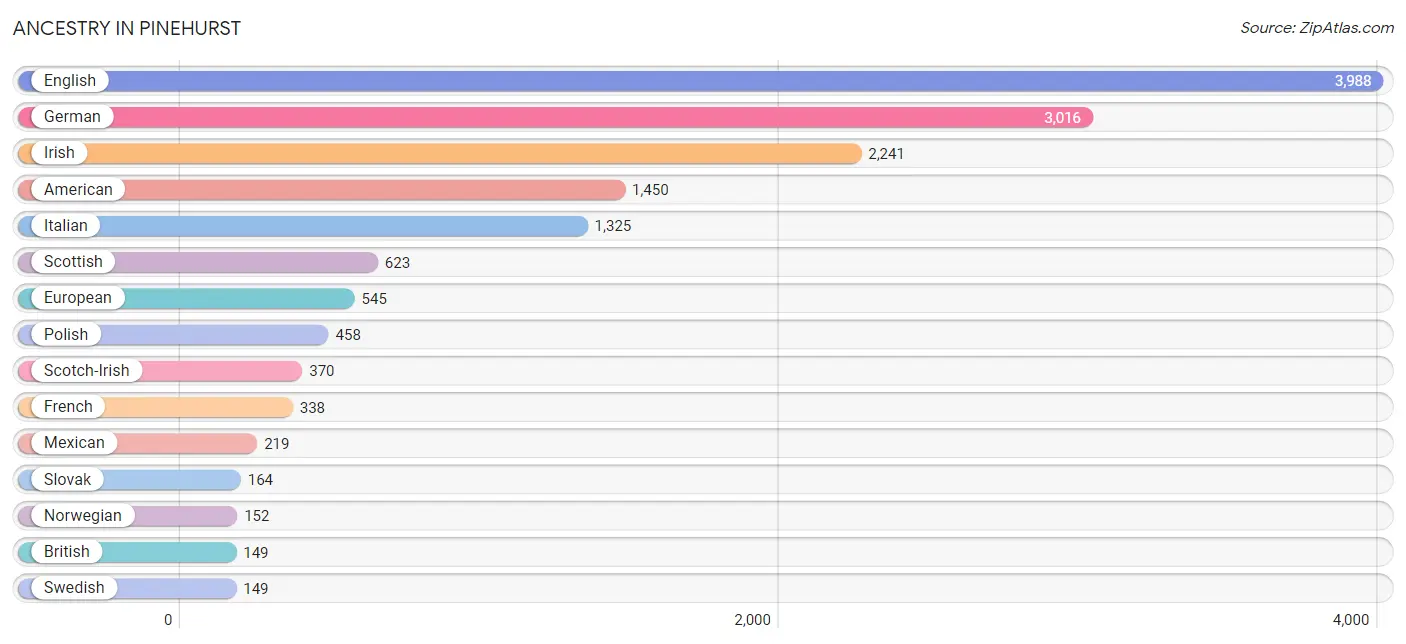
Ancestry in Pinehurst
The most populous ancestries reported in Pinehurst are English (3,988 | 22.6%), German (3,016 | 17.1%), Irish (2,241 | 12.7%), American (1,450 | 8.2%), and Italian (1,325 | 7.5%), together accounting for 68.1% of all Pinehurst residents.
| Ancestry | # Population | % Population |
| African | 58 | 0.3% |
| Albanian | 27 | 0.2% |
| American | 1,450 | 8.2% |
| Arab | 11 | 0.1% |
| Argentinean | 1 | 0.0% |
| Austrian | 67 | 0.4% |
| Belgian | 9 | 0.1% |
| Bhutanese | 125 | 0.7% |
| British | 149 | 0.8% |
| Burmese | 15 | 0.1% |
| Canadian | 27 | 0.2% |
| Central American | 17 | 0.1% |
| Cherokee | 104 | 0.6% |
| Chickasaw | 44 | 0.3% |
| Croatian | 82 | 0.5% |
| Cuban | 11 | 0.1% |
| Czech | 98 | 0.6% |
| Czechoslovakian | 29 | 0.2% |
| Danish | 16 | 0.1% |
| Dutch | 128 | 0.7% |
| Eastern European | 17 | 0.1% |
| English | 3,988 | 22.6% |
| European | 545 | 3.1% |
| Filipino | 15 | 0.1% |
| Finnish | 57 | 0.3% |
| French | 338 | 1.9% |
| French Canadian | 144 | 0.8% |
| German | 3,016 | 17.1% |
| Greek | 127 | 0.7% |
| Hungarian | 89 | 0.5% |
| Indian (Asian) | 105 | 0.6% |
| Irish | 2,241 | 12.7% |
| Italian | 1,325 | 7.5% |
| Jamaican | 47 | 0.3% |
| Korean | 125 | 0.7% |
| Latvian | 14 | 0.1% |
| Lebanese | 11 | 0.1% |
| Lithuanian | 10 | 0.1% |
| Lumbee | 47 | 0.3% |
| Mexican | 219 | 1.2% |
| Native Hawaiian | 17 | 0.1% |
| Northern European | 36 | 0.2% |
| Norwegian | 152 | 0.9% |
| Okinawan | 11 | 0.1% |
| Pakistani | 12 | 0.1% |
| Panamanian | 5 | 0.0% |
| Pennsylvania German | 8 | 0.1% |
| Peruvian | 61 | 0.4% |
| Polish | 458 | 2.6% |
| Puerto Rican | 140 | 0.8% |
| Romanian | 110 | 0.6% |
| Russian | 102 | 0.6% |
| Salvadoran | 12 | 0.1% |
| Scandinavian | 10 | 0.1% |
| Scotch-Irish | 370 | 2.1% |
| Scottish | 623 | 3.5% |
| Seminole | 6 | 0.0% |
| Serbian | 21 | 0.1% |
| Slavic | 8 | 0.1% |
| Slovak | 164 | 0.9% |
| Slovene | 12 | 0.1% |
| South American | 62 | 0.4% |
| Spaniard | 11 | 0.1% |
| Subsaharan African | 58 | 0.3% |
| Swedish | 149 | 0.8% |
| Swiss | 88 | 0.5% |
| Thai | 73 | 0.4% |
| Ukrainian | 138 | 0.8% |
| Welsh | 142 | 0.8% |
| Yugoslavian | 22 | 0.1% | View All 70 Rows |
Immigrants in Pinehurst
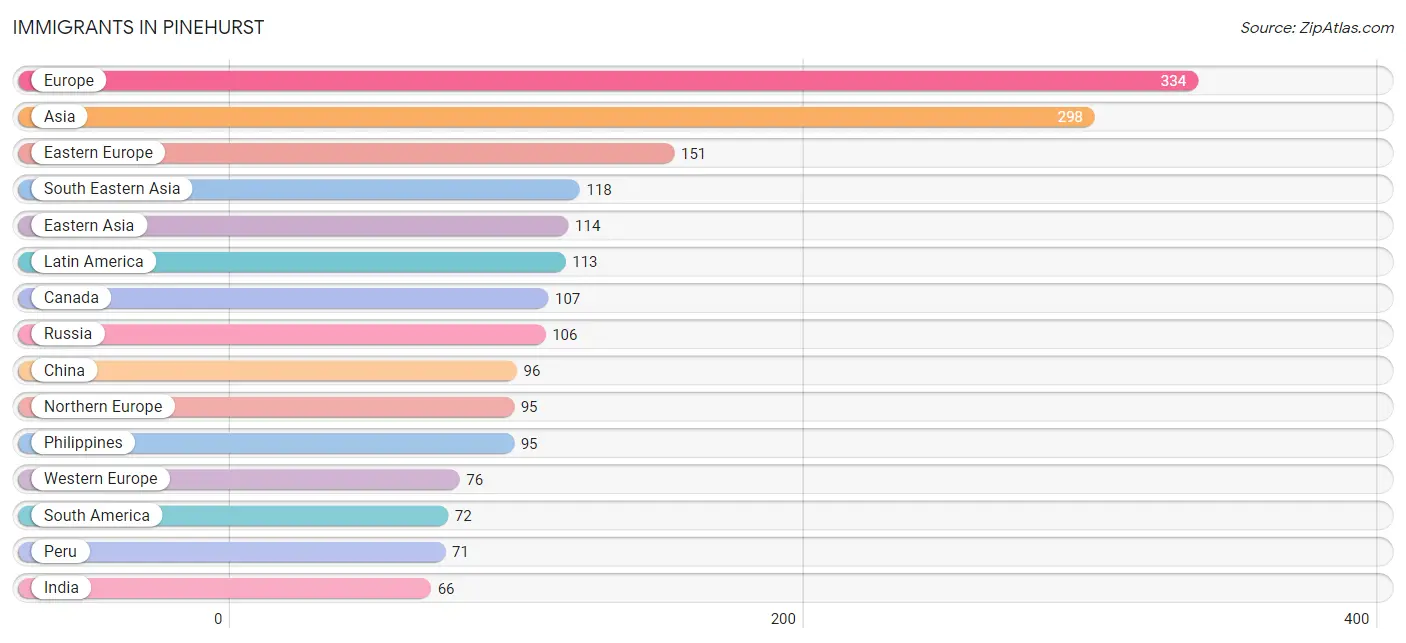
The most numerous immigrant groups reported in Pinehurst came from Europe (334 | 1.9%), Asia (298 | 1.7%), Eastern Europe (151 | 0.9%), South Eastern Asia (118 | 0.7%), and Eastern Asia (114 | 0.6%), together accounting for 5.8% of all Pinehurst residents.
| Immigration Origin | # Population | % Population |
| Africa | 36 | 0.2% |
| Albania | 15 | 0.1% |
| Argentina | 1 | 0.0% |
| Asia | 298 | 1.7% |
| Australia | 8 | 0.1% |
| Austria | 17 | 0.1% |
| Barbados | 13 | 0.1% |
| Canada | 107 | 0.6% |
| Caribbean | 29 | 0.2% |
| Central America | 12 | 0.1% |
| China | 96 | 0.5% |
| Croatia | 30 | 0.2% |
| Eastern Africa | 36 | 0.2% |
| Eastern Asia | 114 | 0.6% |
| Eastern Europe | 151 | 0.9% |
| El Salvador | 12 | 0.1% |
| England | 29 | 0.2% |
| Europe | 334 | 1.9% |
| France | 39 | 0.2% |
| Germany | 20 | 0.1% |
| India | 66 | 0.4% |
| Italy | 12 | 0.1% |
| Jamaica | 16 | 0.1% |
| Japan | 18 | 0.1% |
| Latin America | 113 | 0.6% |
| Malaysia | 11 | 0.1% |
| Northern Europe | 95 | 0.5% |
| Oceania | 8 | 0.1% |
| Peru | 71 | 0.4% |
| Philippines | 95 | 0.5% |
| Russia | 106 | 0.6% |
| South America | 72 | 0.4% |
| South Central Asia | 66 | 0.4% |
| South Eastern Asia | 118 | 0.7% |
| Southern Europe | 12 | 0.1% |
| Taiwan | 15 | 0.1% |
| Thailand | 12 | 0.1% |
| Western Europe | 76 | 0.4% | View All 38 Rows |
Sex and Age in Pinehurst
Sex and Age in Pinehurst
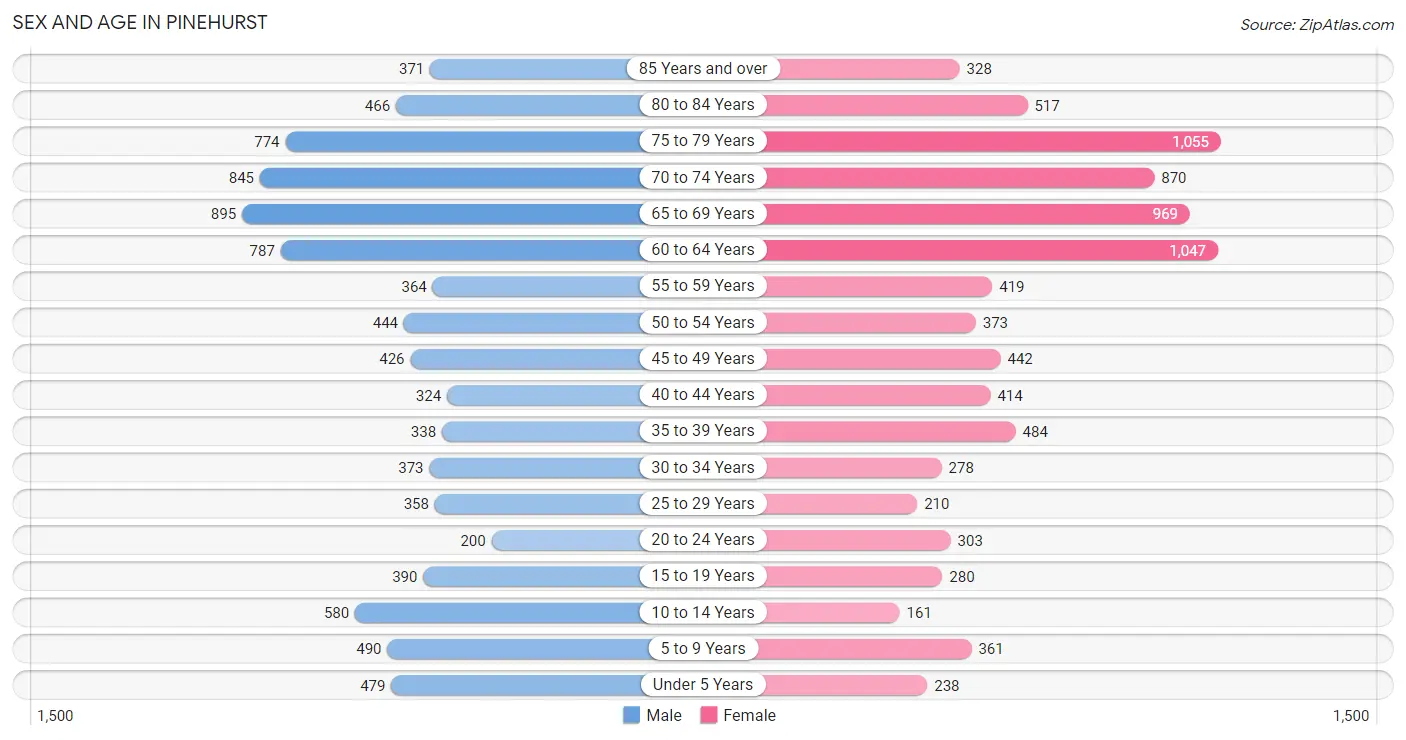
The most populous age groups in Pinehurst are 65 to 69 Years (895 | 10.1%) for men and 75 to 79 Years (1,055 | 12.1%) for women.
| Age Bracket | Male | Female |
| Under 5 Years | 479 (5.4%) | 238 (2.7%) |
| 5 to 9 Years | 490 (5.5%) | 361 (4.1%) |
| 10 to 14 Years | 580 (6.5%) | 161 (1.8%) |
| 15 to 19 Years | 390 (4.4%) | 280 (3.2%) |
| 20 to 24 Years | 200 (2.2%) | 303 (3.5%) |
| 25 to 29 Years | 358 (4.0%) | 210 (2.4%) |
| 30 to 34 Years | 373 (4.2%) | 278 (3.2%) |
| 35 to 39 Years | 338 (3.8%) | 484 (5.5%) |
| 40 to 44 Years | 324 (3.6%) | 414 (4.7%) |
| 45 to 49 Years | 426 (4.8%) | 442 (5.1%) |
| 50 to 54 Years | 444 (5.0%) | 373 (4.3%) |
| 55 to 59 Years | 364 (4.1%) | 419 (4.8%) |
| 60 to 64 Years | 787 (8.8%) | 1,047 (12.0%) |
| 65 to 69 Years | 895 (10.1%) | 969 (11.1%) |
| 70 to 74 Years | 845 (9.5%) | 870 (9.9%) |
| 75 to 79 Years | 774 (8.7%) | 1,055 (12.1%) |
| 80 to 84 Years | 466 (5.2%) | 517 (5.9%) |
| 85 Years and over | 371 (4.2%) | 328 (3.7%) |
| Total | 8,904 (100.0%) | 8,749 (100.0%) |
Families and Households in Pinehurst
Median Family Size in Pinehurst
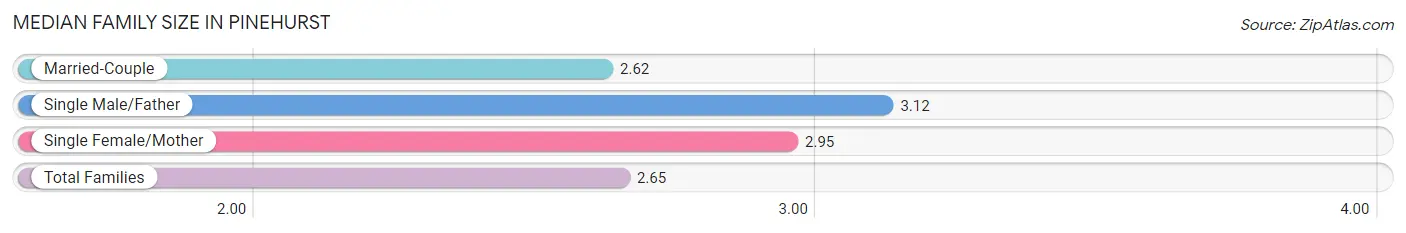
The median family size in Pinehurst is 2.65 persons per family, with single male/father families (58 | 1.1%) accounting for the largest median family size of 3.12 persons per family. On the other hand, married-couple families (5,035 | 93.7%) represent the smallest median family size with 2.62 persons per family.
| Family Type | # Families | Family Size |
| Married-Couple | 5,035 (93.7%) | 2.62 |
| Single Male/Father | 58 (1.1%) | 3.12 |
| Single Female/Mother | 278 (5.2%) | 2.95 |
| Total Families | 5,371 (100.0%) | 2.65 |
Median Household Size in Pinehurst
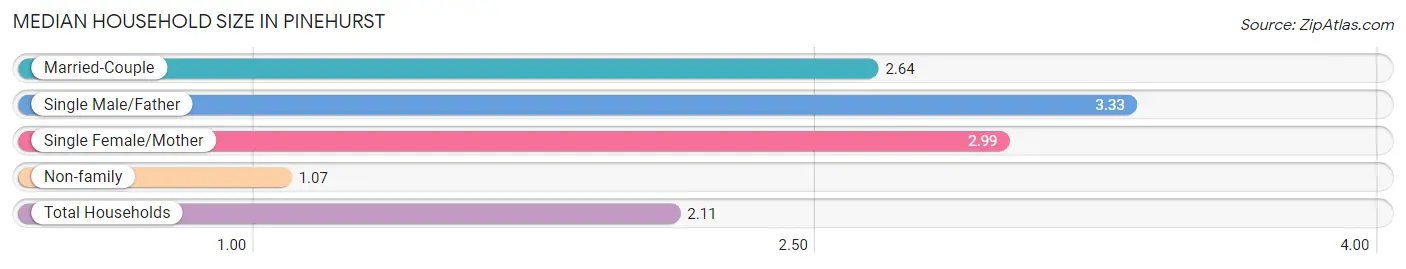
The median household size in Pinehurst is 2.11 persons per household, with single male/father households (58 | 0.7%) accounting for the largest median household size of 3.33 persons per household. non-family households (2,845 | 34.6%) represent the smallest median household size with 1.07 persons per household.
| Household Type | # Households | Household Size |
| Married-Couple | 5,035 (61.3%) | 2.64 |
| Single Male/Father | 58 (0.7%) | 3.33 |
| Single Female/Mother | 278 (3.4%) | 2.99 |
| Non-family | 2,845 (34.6%) | 1.07 |
| Total Households | 8,216 (100.0%) | 2.11 |
Household Size by Marriage Status in Pinehurst
Out of a total of 8,216 households in Pinehurst, 5,371 (65.4%) are family households, while 2,845 (34.6%) are nonfamily households. The most numerous type of family households are 2-person households, comprising 3,588, and the most common type of nonfamily households are 1-person households, comprising 2,635.
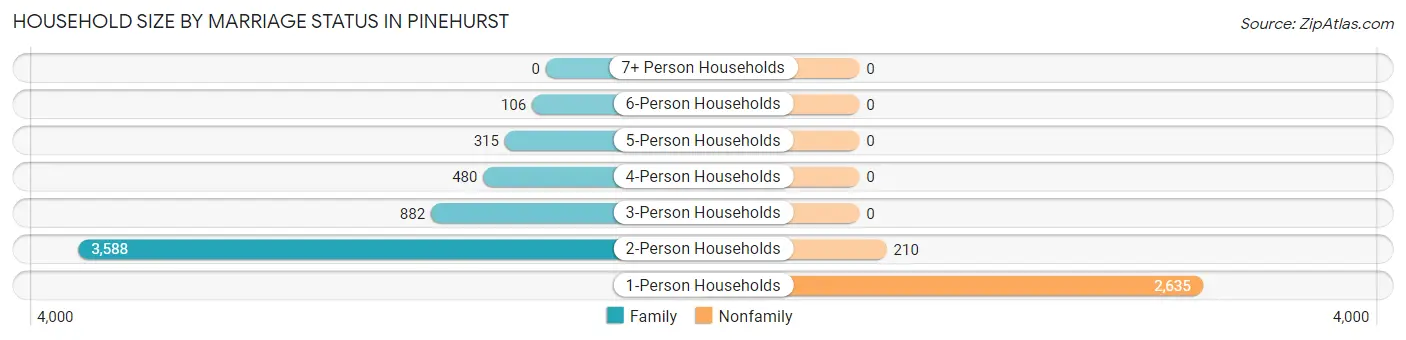
| Household Size | Family Households | Nonfamily Households |
| 1-Person Households | - | 2,635 (32.1%) |
| 2-Person Households | 3,588 (43.7%) | 210 (2.6%) |
| 3-Person Households | 882 (10.7%) | 0 (0.0%) |
| 4-Person Households | 480 (5.8%) | 0 (0.0%) |
| 5-Person Households | 315 (3.8%) | 0 (0.0%) |
| 6-Person Households | 106 (1.3%) | 0 (0.0%) |
| 7+ Person Households | 0 (0.0%) | 0 (0.0%) |
| Total | 5,371 (65.4%) | 2,845 (34.6%) |
Female Fertility in Pinehurst
Fertility by Age in Pinehurst
Average fertility rate in Pinehurst is 57.0 births per 1,000 women. Women in the age bracket of 20 to 34 years have the highest fertility rate with 114.0 births per 1,000 women. Women in the age bracket of 20 to 34 years acount for 64.7% of all women with births.
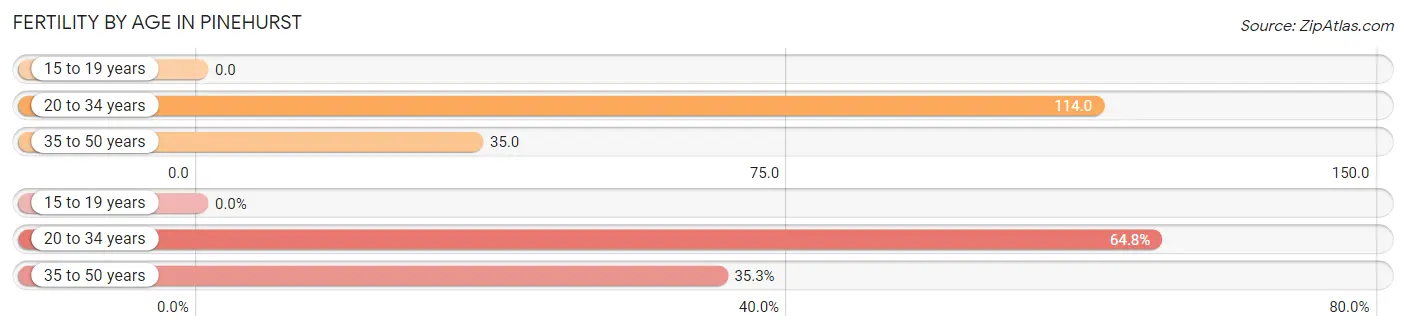
| Age Bracket | Women with Births | Births / 1,000 Women |
| 15 to 19 years | 0 (0.0%) | 0.0 |
| 20 to 34 years | 90 (64.7%) | 114.0 |
| 35 to 50 years | 49 (35.2%) | 35.0 |
| Total | 139 (100.0%) | 57.0 |
Fertility by Age by Marriage Status in Pinehurst
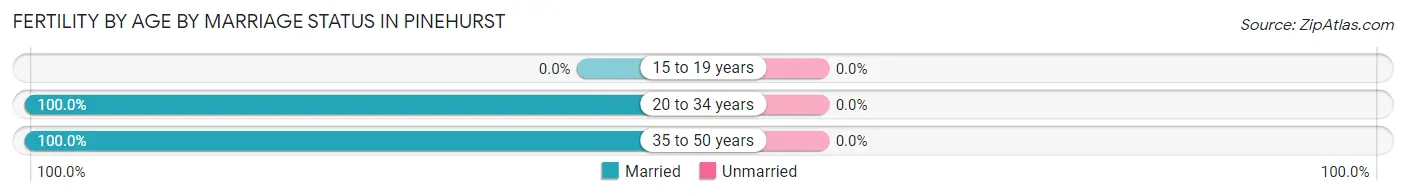
| Age Bracket | Married | Unmarried |
| 15 to 19 years | 0 (0.0%) | 0 (0.0%) |
| 20 to 34 years | 90 (100.0%) | 0 (0.0%) |
| 35 to 50 years | 49 (100.0%) | 0 (0.0%) |
| Total | 139 (100.0%) | 0 (0.0%) |
Fertility by Education in Pinehurst
Average fertility rate in Pinehurst is 57.0 births per 1,000 women. Women with the education attainment of graduate degree have the highest fertility rate of 79.0 births per 1,000 women, while women with the education attainment of less than high school have the lowest fertility at 35.0 births per 1,000 women. Women with the education attainment of graduate degree represent 36.0% of all women with births.
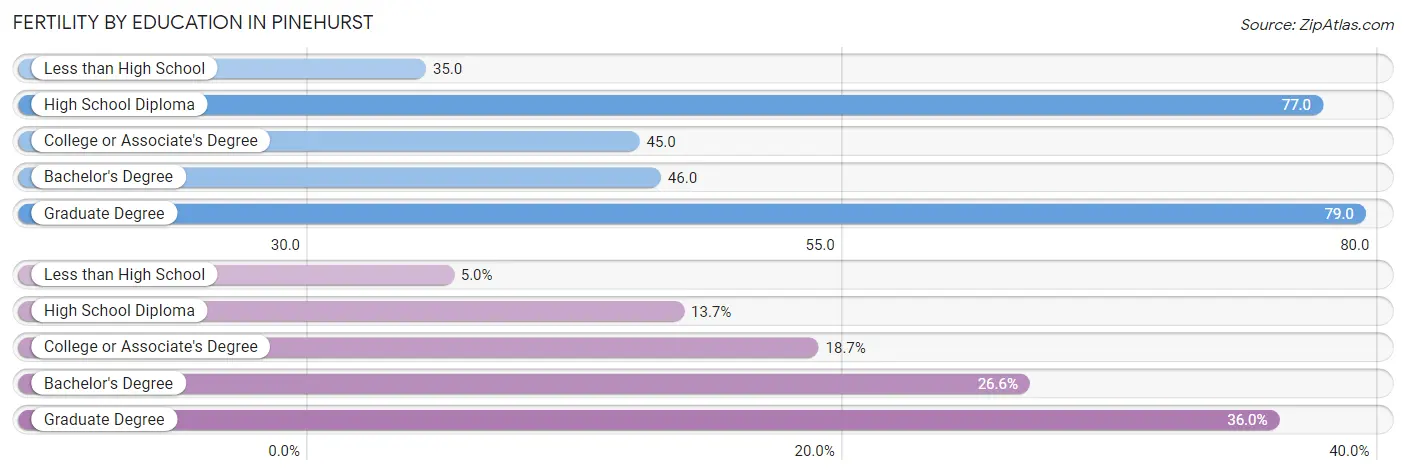
| Educational Attainment | Women with Births | Births / 1,000 Women |
| Less than High School | 7 (5.0%) | 35.0 |
| High School Diploma | 19 (13.7%) | 77.0 |
| College or Associate's Degree | 26 (18.7%) | 45.0 |
| Bachelor's Degree | 37 (26.6%) | 46.0 |
| Graduate Degree | 50 (36.0%) | 79.0 |
| Total | 139 (100.0%) | 57.0 |
Fertility by Education by Marriage Status in Pinehurst
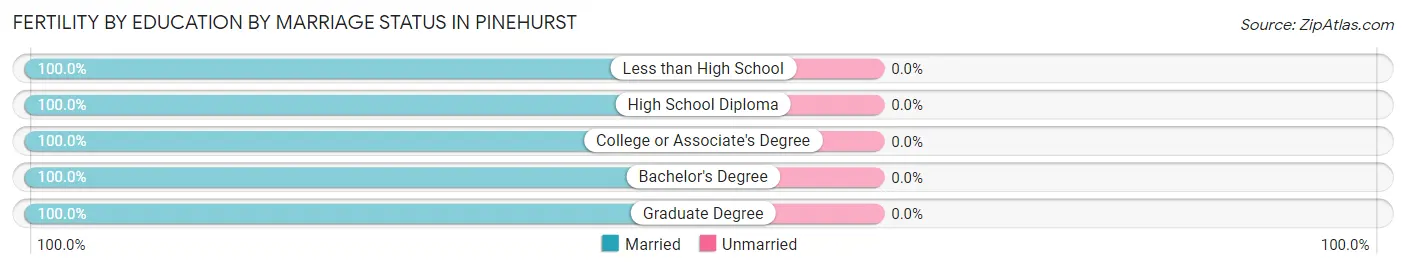
| Educational Attainment | Married | Unmarried |
| Less than High School | 7 (100.0%) | 0 (0.0%) |
| High School Diploma | 19 (100.0%) | 0 (0.0%) |
| College or Associate's Degree | 26 (100.0%) | 0 (0.0%) |
| Bachelor's Degree | 37 (100.0%) | 0 (0.0%) |
| Graduate Degree | 50 (100.0%) | 0 (0.0%) |
| Total | 139 (100.0%) | 0 (0.0%) |
Employment Characteristics in Pinehurst
Employment by Class of Employer in Pinehurst
Among the 6,371 employed individuals in Pinehurst, private company employees (3,103 | 48.7%), federal government employees (1,088 | 17.1%), and not-for-profit organizations (647 | 10.2%) make up the most common classes of employment.
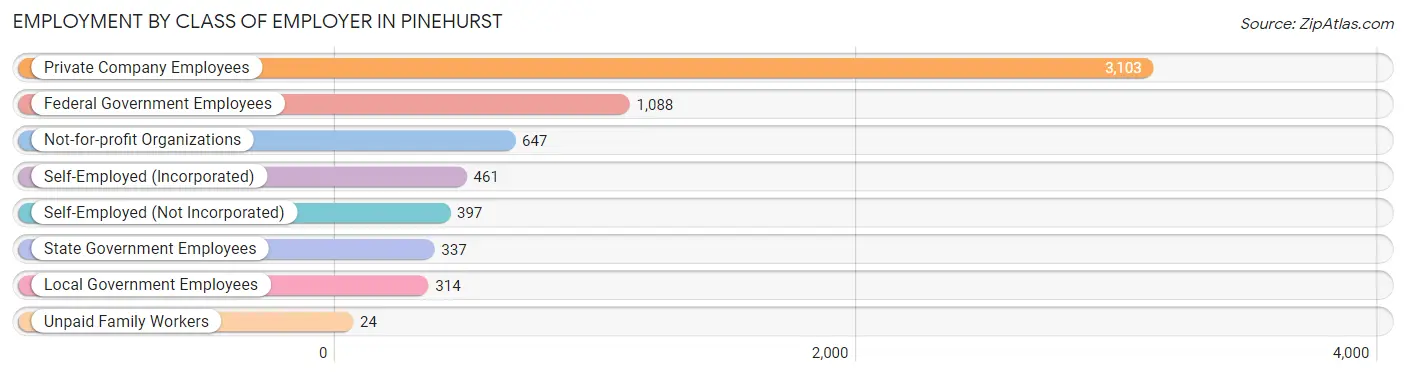
| Employer Class | # Employees | % Employees |
| Private Company Employees | 3,103 | 48.7% |
| Self-Employed (Incorporated) | 461 | 7.2% |
| Self-Employed (Not Incorporated) | 397 | 6.2% |
| Not-for-profit Organizations | 647 | 10.2% |
| Local Government Employees | 314 | 4.9% |
| State Government Employees | 337 | 5.3% |
| Federal Government Employees | 1,088 | 17.1% |
| Unpaid Family Workers | 24 | 0.4% |
| Total | 6,371 | 100.0% |
Employment Status by Age in Pinehurst
According to the labor force statistics for Pinehurst, out of the total population over 16 years of age (15,120), 44.7% or 6,759 individuals are in the labor force, with 4.2% or 284 of them unemployed. The age group with the highest labor force participation rate is 25 to 29 years, with 88.0% or 500 individuals in the labor force. Within the labor force, the 65 to 74 years age range has the highest percentage of unemployed individuals, with 14.8% or 119 of them being unemployed.
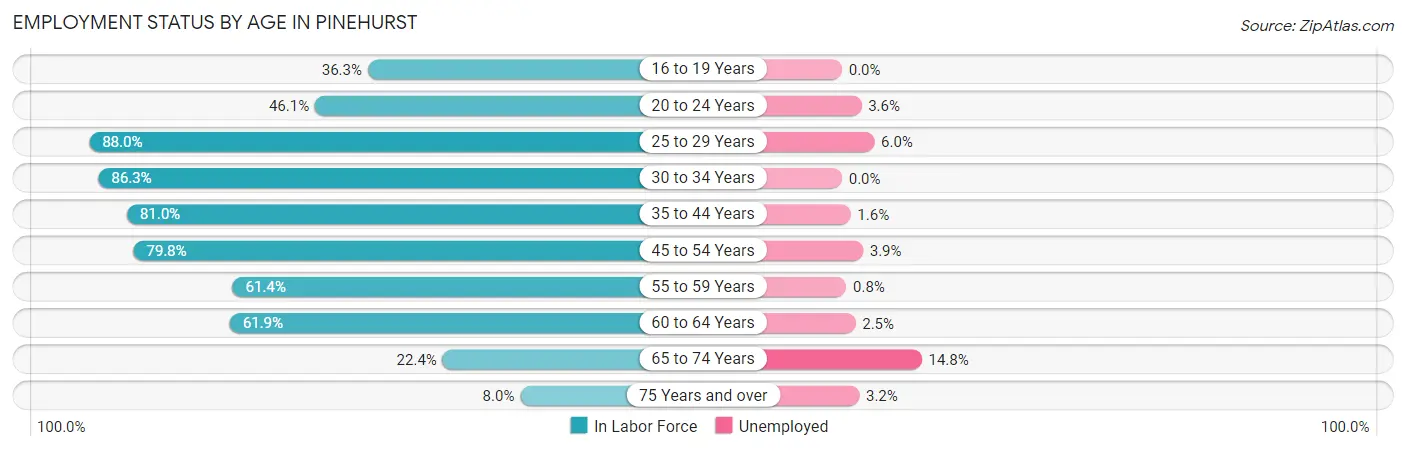
| Age Bracket | In Labor Force | Unemployed |
| 16 to 19 Years | 162 (36.3%) | 0 (0.0%) |
| 20 to 24 Years | 232 (46.1%) | 8 (3.6%) |
| 25 to 29 Years | 500 (88.0%) | 30 (6.0%) |
| 30 to 34 Years | 562 (86.3%) | 0 (0.0%) |
| 35 to 44 Years | 1,264 (81.0%) | 20 (1.6%) |
| 45 to 54 Years | 1,345 (79.8%) | 52 (3.9%) |
| 55 to 59 Years | 481 (61.4%) | 4 (0.8%) |
| 60 to 64 Years | 1,135 (61.9%) | 28 (2.5%) |
| 65 to 74 Years | 802 (22.4%) | 119 (14.8%) |
| 75 Years and over | 281 (8.0%) | 9 (3.2%) |
| Total | 6,759 (44.7%) | 284 (4.2%) |
Employment Status by Educational Attainment in Pinehurst
According to labor force statistics for Pinehurst, 74.7% of individuals (5,290) out of the total population between 25 and 64 years of age (7,081) are in the labor force, with 2.5% or 132 of them being unemployed. The group with the highest labor force participation rate are those with the educational attainment of bachelor's degree or higher, with 80.3% or 3,751 individuals in the labor force. Within the labor force, individuals with high school diploma education have the highest percentage of unemployment, with 8.1% or 26 of them being unemployed.
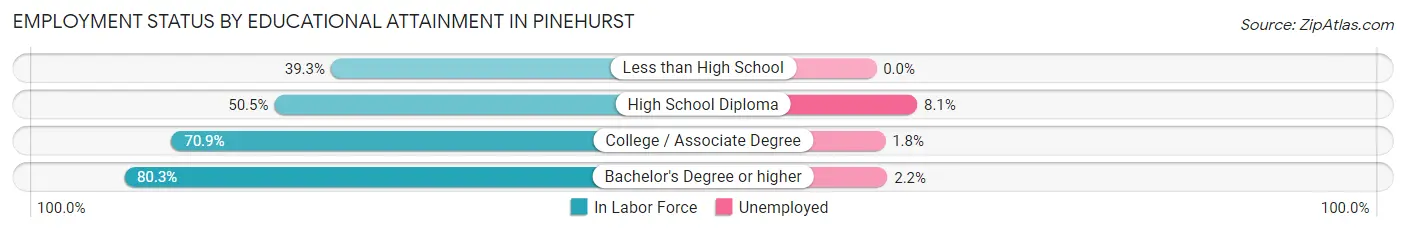
| Educational Attainment | In Labor Force | Unemployed |
| Less than High School | 53 (39.3%) | 0 (0.0%) |
| High School Diploma | 322 (50.5%) | 52 (8.1%) |
| College / Associate Degree | 1,161 (70.9%) | 29 (1.8%) |
| Bachelor's Degree or higher | 3,751 (80.3%) | 103 (2.2%) |
| Total | 5,290 (74.7%) | 177 (2.5%) |
Employment Occupations by Sex in Pinehurst
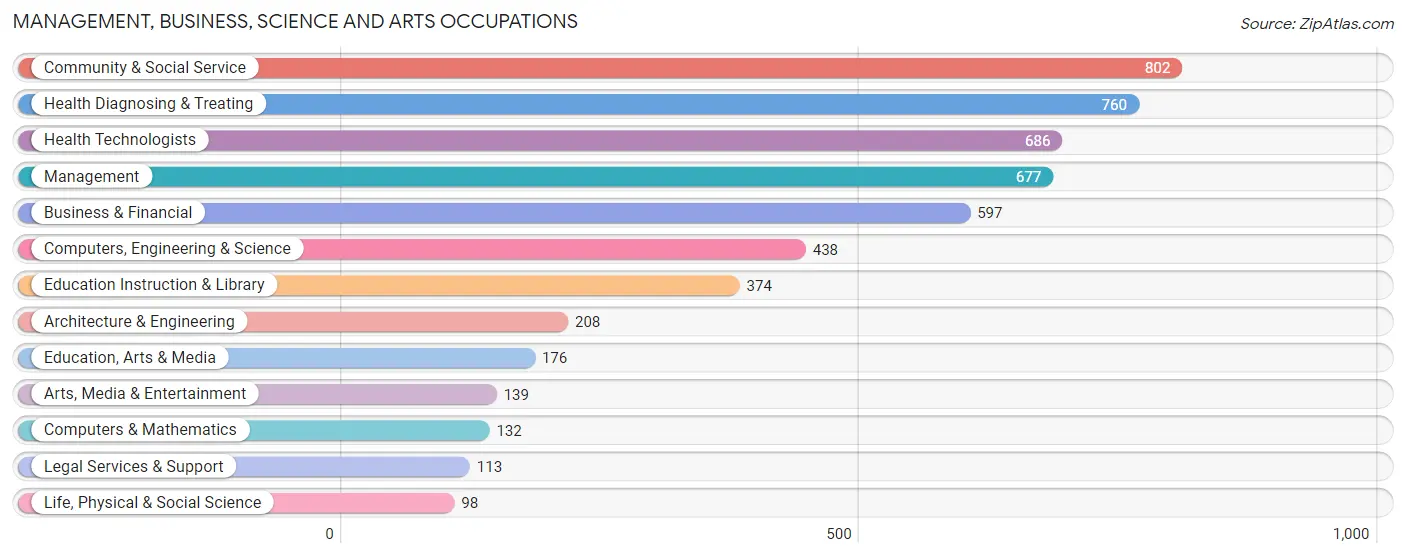
Management, Business, Science and Arts Occupations
The most common Management, Business, Science and Arts occupations in Pinehurst are Community & Social Service (802 | 13.9%), Health Diagnosing & Treating (760 | 13.2%), Health Technologists (686 | 11.9%), Management (677 | 11.8%), and Business & Financial (597 | 10.4%).
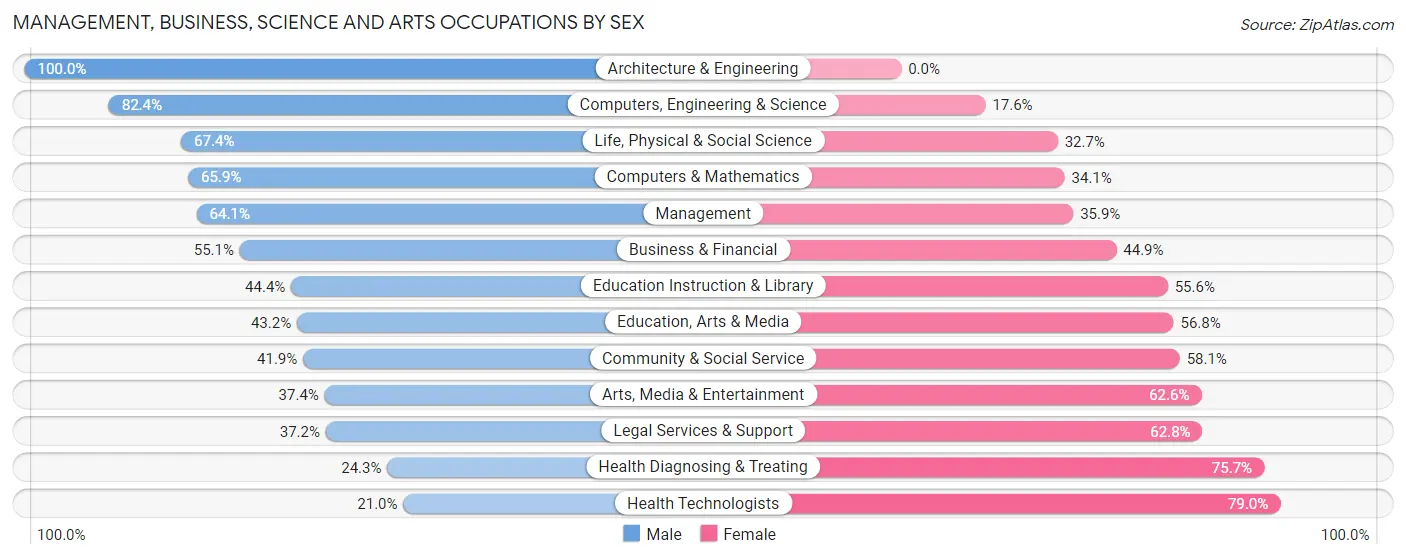
Management, Business, Science and Arts Occupations by Sex
Within the Management, Business, Science and Arts occupations in Pinehurst, the most male-oriented occupations are Architecture & Engineering (100.0%), Computers, Engineering & Science (82.4%), and Life, Physical & Social Science (67.3%), while the most female-oriented occupations are Health Technologists (79.0%), Health Diagnosing & Treating (75.7%), and Legal Services & Support (62.8%).
| Occupation | Male | Female |
| Management | 434 (64.1%) | 243 (35.9%) |
| Business & Financial | 329 (55.1%) | 268 (44.9%) |
| Computers, Engineering & Science | 361 (82.4%) | 77 (17.6%) |
| Computers & Mathematics | 87 (65.9%) | 45 (34.1%) |
| Architecture & Engineering | 208 (100.0%) | 0 (0.0%) |
| Life, Physical & Social Science | 66 (67.3%) | 32 (32.7%) |
| Community & Social Service | 336 (41.9%) | 466 (58.1%) |
| Education, Arts & Media | 76 (43.2%) | 100 (56.8%) |
| Legal Services & Support | 42 (37.2%) | 71 (62.8%) |
| Education Instruction & Library | 166 (44.4%) | 208 (55.6%) |
| Arts, Media & Entertainment | 52 (37.4%) | 87 (62.6%) |
| Health Diagnosing & Treating | 185 (24.3%) | 575 (75.7%) |
| Health Technologists | 144 (21.0%) | 542 (79.0%) |
| Total (Category) | 1,645 (50.2%) | 1,629 (49.8%) |
| Total (Overall) | 2,923 (50.8%) | 2,831 (49.2%) |
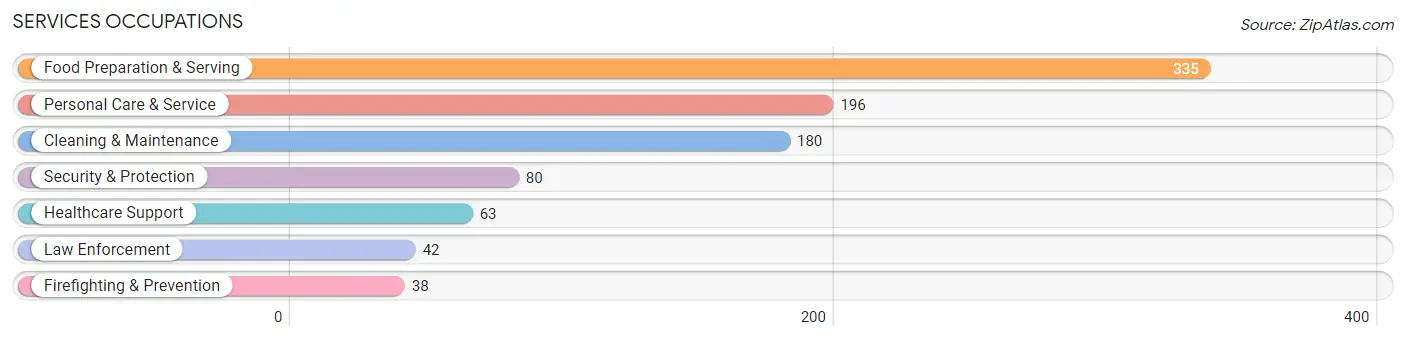
Services Occupations
The most common Services occupations in Pinehurst are Food Preparation & Serving (335 | 5.8%), Personal Care & Service (196 | 3.4%), Cleaning & Maintenance (180 | 3.1%), Security & Protection (80 | 1.4%), and Healthcare Support (63 | 1.1%).
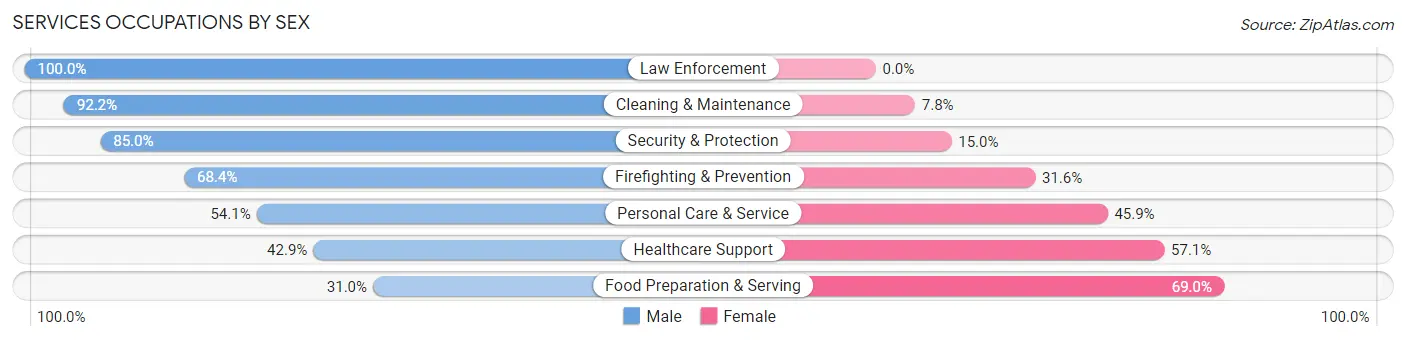
Services Occupations by Sex
Within the Services occupations in Pinehurst, the most male-oriented occupations are Law Enforcement (100.0%), Cleaning & Maintenance (92.2%), and Security & Protection (85.0%), while the most female-oriented occupations are Food Preparation & Serving (69.0%), Healthcare Support (57.1%), and Personal Care & Service (45.9%).
| Occupation | Male | Female |
| Healthcare Support | 27 (42.9%) | 36 (57.1%) |
| Security & Protection | 68 (85.0%) | 12 (15.0%) |
| Firefighting & Prevention | 26 (68.4%) | 12 (31.6%) |
| Law Enforcement | 42 (100.0%) | 0 (0.0%) |
| Food Preparation & Serving | 104 (31.0%) | 231 (69.0%) |
| Cleaning & Maintenance | 166 (92.2%) | 14 (7.8%) |
| Personal Care & Service | 106 (54.1%) | 90 (45.9%) |
| Total (Category) | 471 (55.1%) | 383 (44.9%) |
| Total (Overall) | 2,923 (50.8%) | 2,831 (49.2%) |
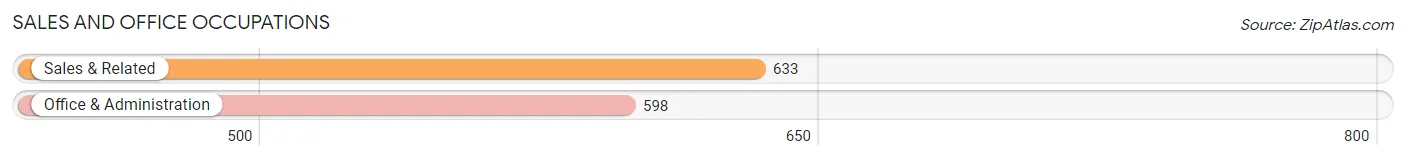
Sales and Office Occupations
The most common Sales and Office occupations in Pinehurst are Sales & Related (633 | 11.0%), and Office & Administration (598 | 10.4%).
Sales and Office Occupations by Sex
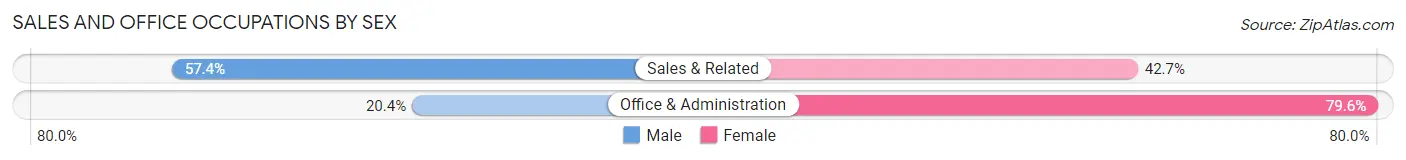
| Occupation | Male | Female |
| Sales & Related | 363 (57.4%) | 270 (42.6%) |
| Office & Administration | 122 (20.4%) | 476 (79.6%) |
| Total (Category) | 485 (39.4%) | 746 (60.6%) |
| Total (Overall) | 2,923 (50.8%) | 2,831 (49.2%) |
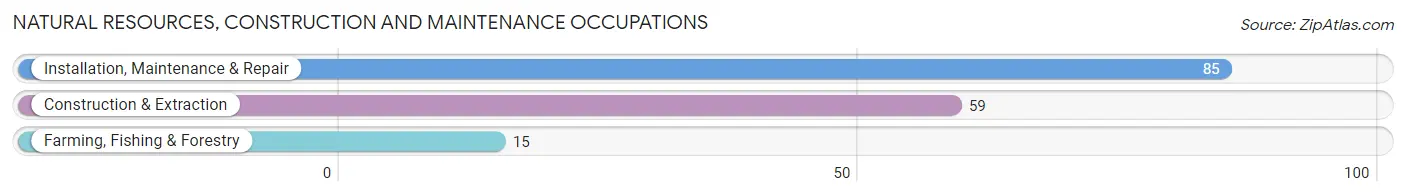
Natural Resources, Construction and Maintenance Occupations
The most common Natural Resources, Construction and Maintenance occupations in Pinehurst are Installation, Maintenance & Repair (85 | 1.5%), Construction & Extraction (59 | 1.0%), and Farming, Fishing & Forestry (15 | 0.3%).
Natural Resources, Construction and Maintenance Occupations by Sex
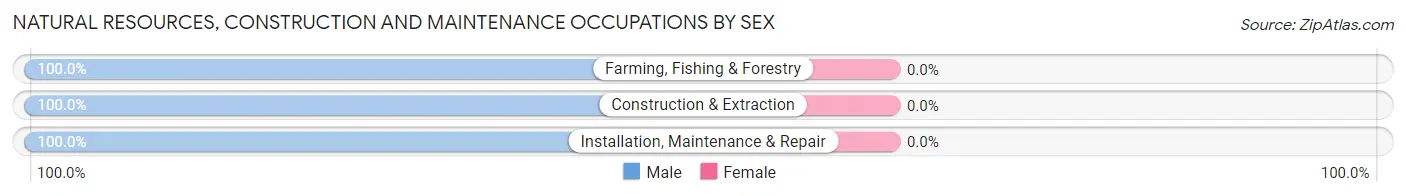
| Occupation | Male | Female |
| Farming, Fishing & Forestry | 15 (100.0%) | 0 (0.0%) |
| Construction & Extraction | 59 (100.0%) | 0 (0.0%) |
| Installation, Maintenance & Repair | 85 (100.0%) | 0 (0.0%) |
| Total (Category) | 159 (100.0%) | 0 (0.0%) |
| Total (Overall) | 2,923 (50.8%) | 2,831 (49.2%) |
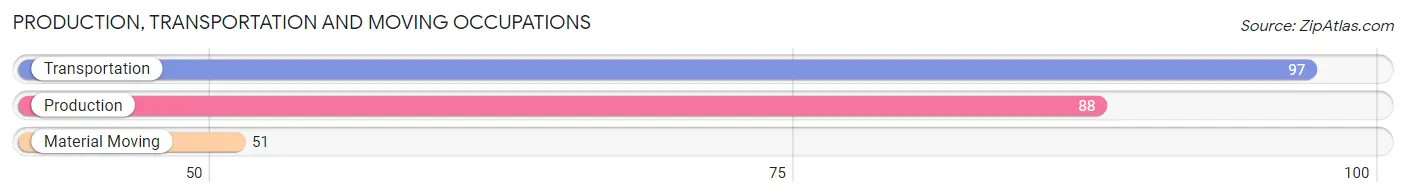
Production, Transportation and Moving Occupations
The most common Production, Transportation and Moving occupations in Pinehurst are Transportation (97 | 1.7%), Production (88 | 1.5%), and Material Moving (51 | 0.9%).
Production, Transportation and Moving Occupations by Sex
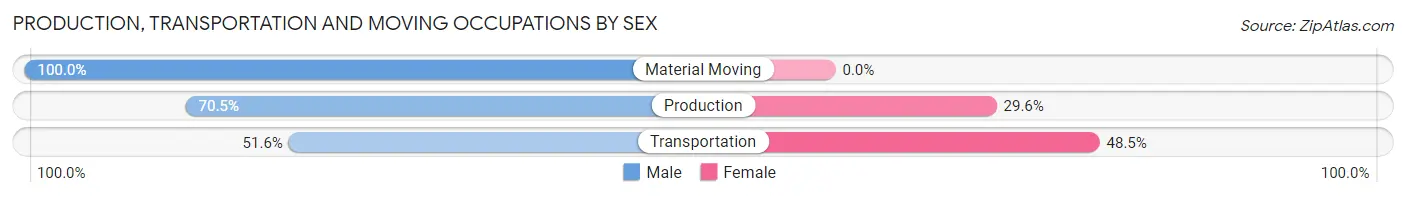
| Occupation | Male | Female |
| Production | 62 (70.5%) | 26 (29.5%) |
| Transportation | 50 (51.5%) | 47 (48.4%) |
| Material Moving | 51 (100.0%) | 0 (0.0%) |
| Total (Category) | 163 (69.1%) | 73 (30.9%) |
| Total (Overall) | 2,923 (50.8%) | 2,831 (49.2%) |
Employment Industries by Sex in Pinehurst
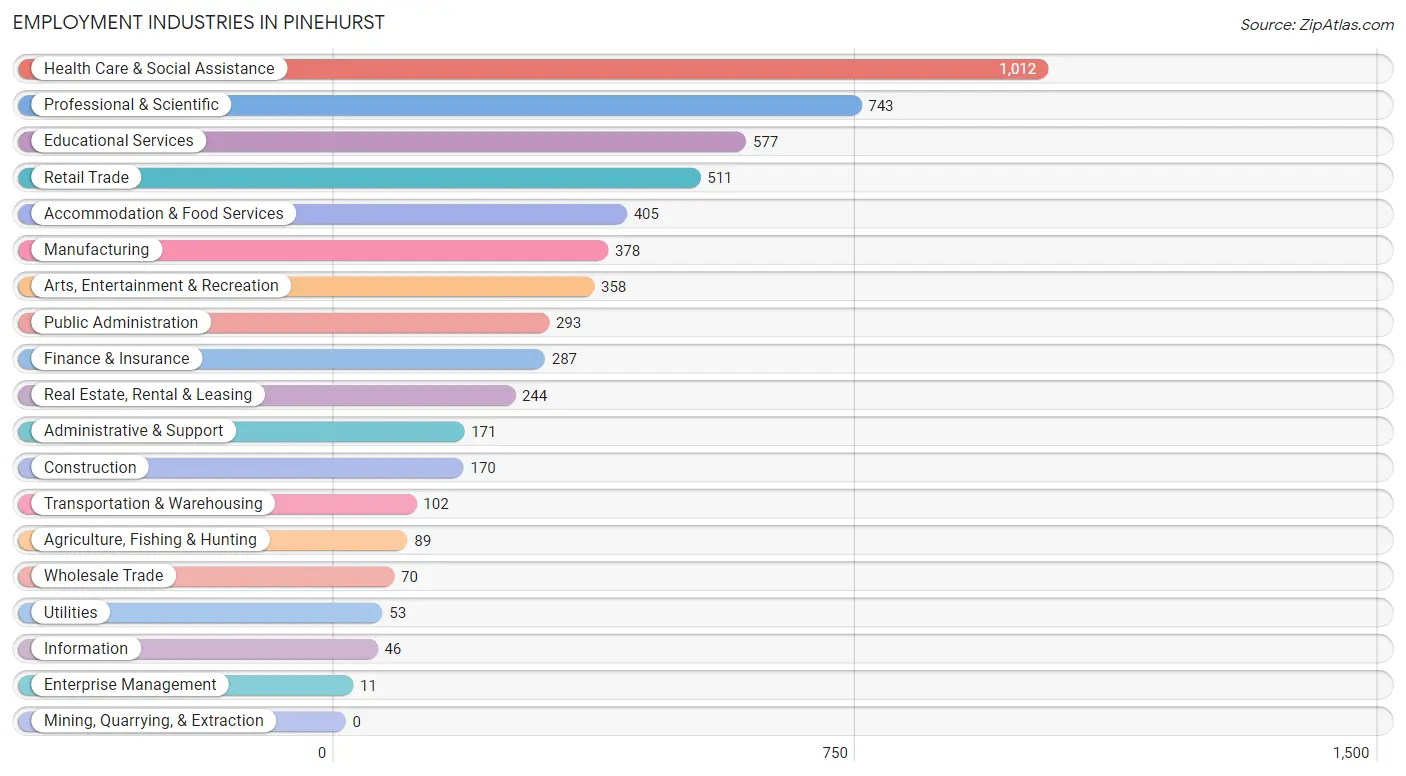
Employment Industries in Pinehurst
The major employment industries in Pinehurst include Health Care & Social Assistance (1,012 | 17.6%), Professional & Scientific (743 | 12.9%), Educational Services (577 | 10.0%), Retail Trade (511 | 8.9%), and Accommodation & Food Services (405 | 7.0%).
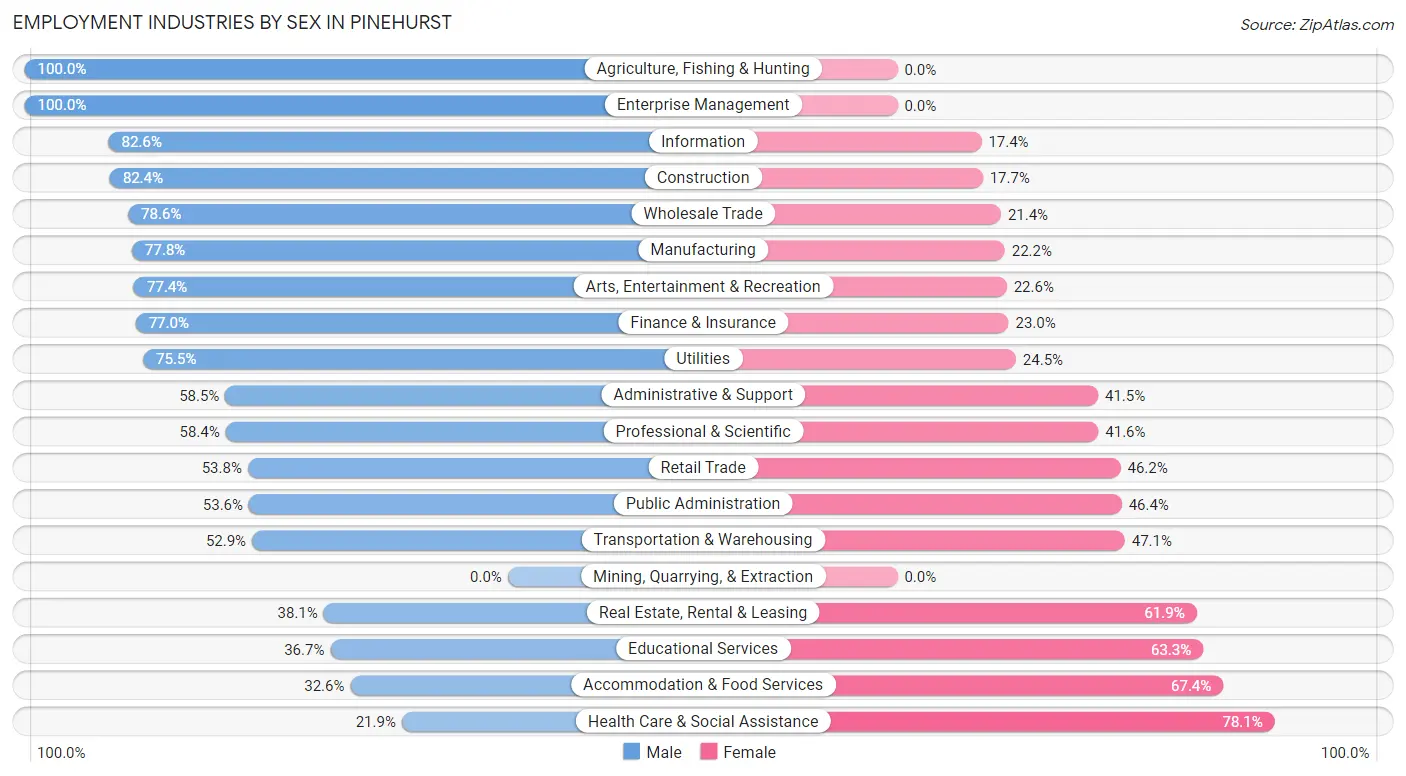
Employment Industries by Sex in Pinehurst
The Pinehurst industries that see more men than women are Agriculture, Fishing & Hunting (100.0%), Enterprise Management (100.0%), and Information (82.6%), whereas the industries that tend to have a higher number of women are Health Care & Social Assistance (78.1%), Accommodation & Food Services (67.4%), and Educational Services (63.3%).
| Industry | Male | Female |
| Agriculture, Fishing & Hunting | 89 (100.0%) | 0 (0.0%) |
| Mining, Quarrying, & Extraction | 0 (0.0%) | 0 (0.0%) |
| Construction | 140 (82.4%) | 30 (17.6%) |
| Manufacturing | 294 (77.8%) | 84 (22.2%) |
| Wholesale Trade | 55 (78.6%) | 15 (21.4%) |
| Retail Trade | 275 (53.8%) | 236 (46.2%) |
| Transportation & Warehousing | 54 (52.9%) | 48 (47.1%) |
| Utilities | 40 (75.5%) | 13 (24.5%) |
| Information | 38 (82.6%) | 8 (17.4%) |
| Finance & Insurance | 221 (77.0%) | 66 (23.0%) |
| Real Estate, Rental & Leasing | 93 (38.1%) | 151 (61.9%) |
| Professional & Scientific | 434 (58.4%) | 309 (41.6%) |
| Enterprise Management | 11 (100.0%) | 0 (0.0%) |
| Administrative & Support | 100 (58.5%) | 71 (41.5%) |
| Educational Services | 212 (36.7%) | 365 (63.3%) |
| Health Care & Social Assistance | 222 (21.9%) | 790 (78.1%) |
| Arts, Entertainment & Recreation | 277 (77.4%) | 81 (22.6%) |
| Accommodation & Food Services | 132 (32.6%) | 273 (67.4%) |
| Public Administration | 157 (53.6%) | 136 (46.4%) |
| Total | 2,923 (50.8%) | 2,831 (49.2%) |
Education in Pinehurst
School Enrollment in Pinehurst
The most common levels of schooling among the 2,918 students in Pinehurst are elementary school (636 | 21.8%), middle school (581 | 19.9%), and college / undergraduate (572 | 19.6%).
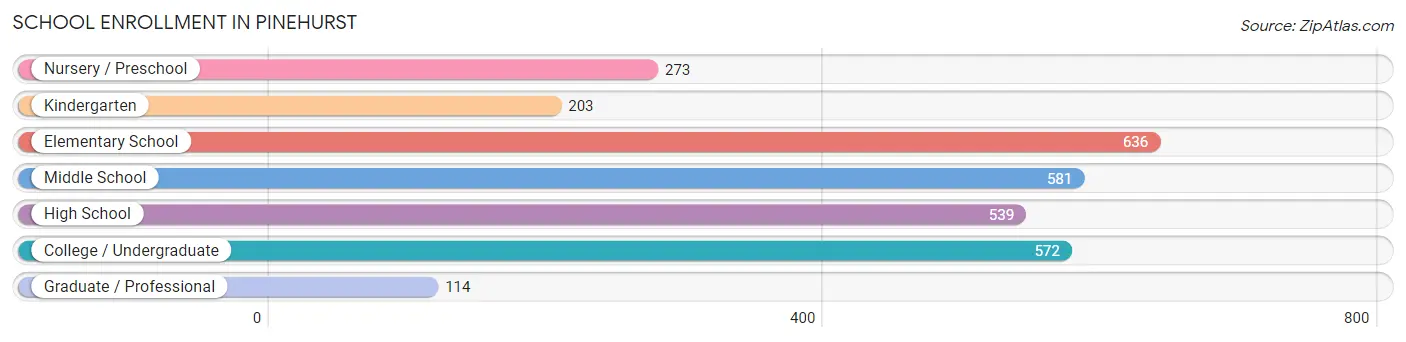
| School Level | # Students | % Students |
| Nursery / Preschool | 273 | 9.4% |
| Kindergarten | 203 | 7.0% |
| Elementary School | 636 | 21.8% |
| Middle School | 581 | 19.9% |
| High School | 539 | 18.5% |
| College / Undergraduate | 572 | 19.6% |
| Graduate / Professional | 114 | 3.9% |
| Total | 2,918 | 100.0% |
School Enrollment by Age by Funding Source in Pinehurst
Out of a total of 2,918 students who are enrolled in schools in Pinehurst, 569 (19.5%) attend a private institution, while the remaining 2,349 (80.5%) are enrolled in public schools. The age group of 3 to 4 year olds has the highest likelihood of being enrolled in private schools, with 96 (56.1% in the age bracket) enrolled. Conversely, the age group of 20 to 24 year olds has the lowest likelihood of being enrolled in a private school, with 298 (100.0% in the age bracket) attending a public institution.
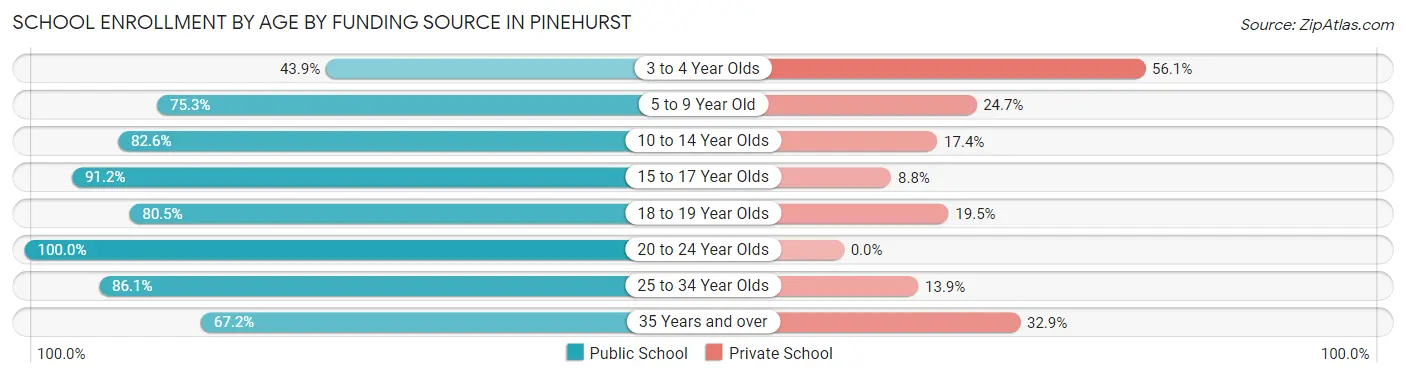
| Age Bracket | Public School | Private School |
| 3 to 4 Year Olds | 75 (43.9%) | 96 (56.1%) |
| 5 to 9 Year Old | 641 (75.3%) | 210 (24.7%) |
| 10 to 14 Year Olds | 612 (82.6%) | 129 (17.4%) |
| 15 to 17 Year Olds | 382 (91.2%) | 37 (8.8%) |
| 18 to 19 Year Olds | 132 (80.5%) | 32 (19.5%) |
| 20 to 24 Year Olds | 298 (100.0%) | 0 (0.0%) |
| 25 to 34 Year Olds | 118 (86.1%) | 19 (13.9%) |
| 35 Years and over | 92 (67.1%) | 45 (32.9%) |
| Total | 2,349 (80.5%) | 569 (19.5%) |
Educational Attainment by Field of Study in Pinehurst
Business (2,006 | 21.7%), education (1,007 | 10.9%), social sciences (931 | 10.1%), science & technology (860 | 9.3%), and engineering (758 | 8.2%) are the most common fields of study among 9,262 individuals in Pinehurst who have obtained a bachelor's degree or higher.
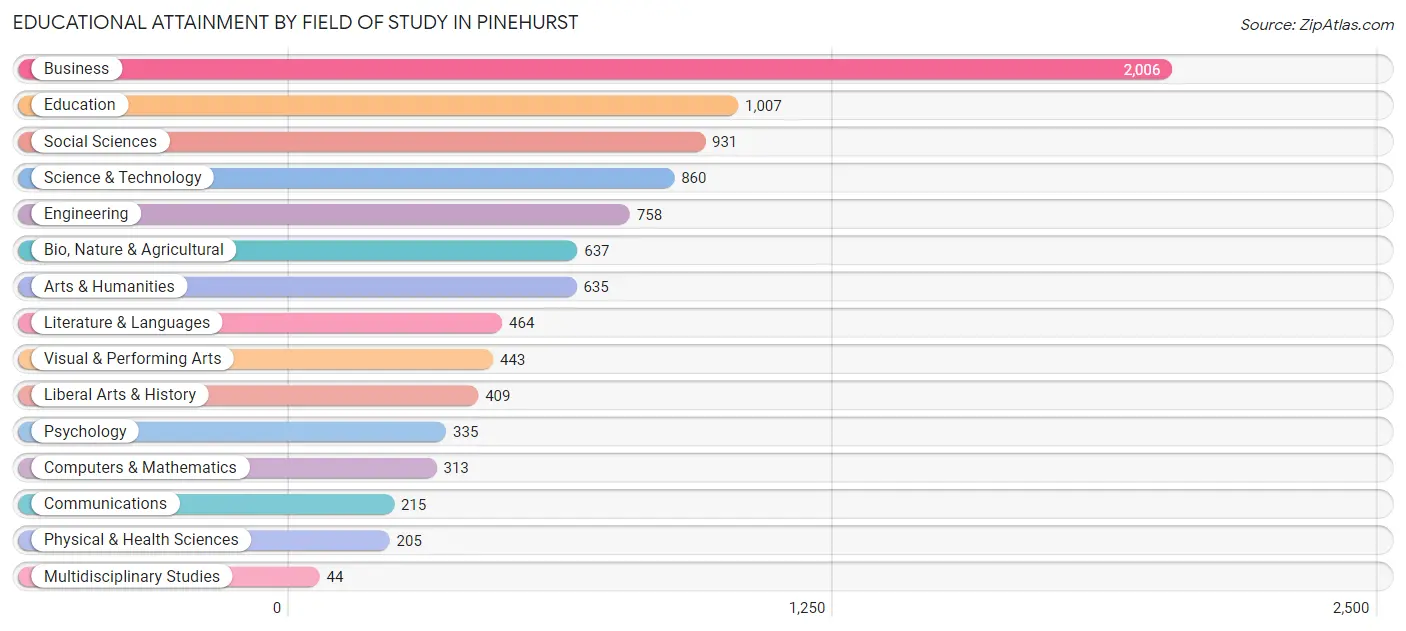
| Field of Study | # Graduates | % Graduates |
| Computers & Mathematics | 313 | 3.4% |
| Bio, Nature & Agricultural | 637 | 6.9% |
| Physical & Health Sciences | 205 | 2.2% |
| Psychology | 335 | 3.6% |
| Social Sciences | 931 | 10.1% |
| Engineering | 758 | 8.2% |
| Multidisciplinary Studies | 44 | 0.5% |
| Science & Technology | 860 | 9.3% |
| Business | 2,006 | 21.7% |
| Education | 1,007 | 10.9% |
| Literature & Languages | 464 | 5.0% |
| Liberal Arts & History | 409 | 4.4% |
| Visual & Performing Arts | 443 | 4.8% |
| Communications | 215 | 2.3% |
| Arts & Humanities | 635 | 6.9% |
| Total | 9,262 | 100.0% |
Transportation & Commute in Pinehurst
Vehicle Availability by Sex in Pinehurst
The most prevalent vehicle ownership categories in Pinehurst are males with 2 vehicles (1,947, accounting for 53.9%) and females with 2 vehicles (1,438, making up 70.6%).
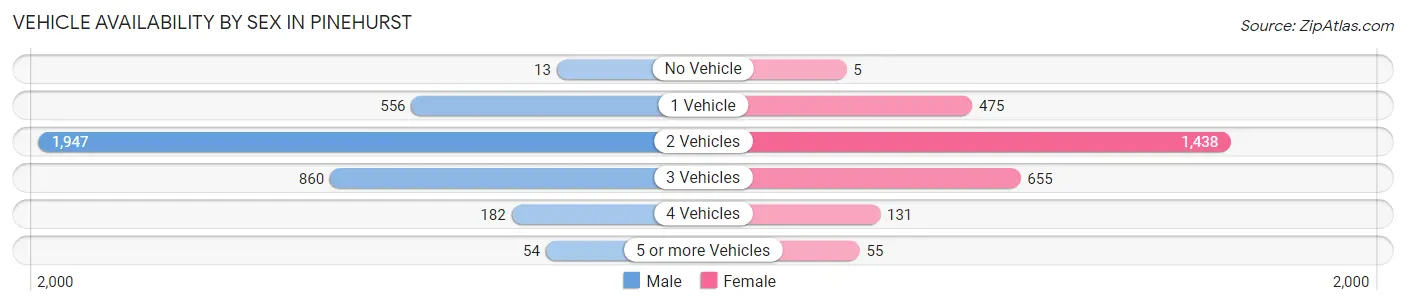
| Vehicles Available | Male | Female |
| No Vehicle | 13 (0.4%) | 5 (0.2%) |
| 1 Vehicle | 556 (15.4%) | 475 (17.2%) |
| 2 Vehicles | 1,947 (53.9%) | 1,438 (52.1%) |
| 3 Vehicles | 860 (23.8%) | 655 (23.7%) |
| 4 Vehicles | 182 (5.0%) | 131 (4.8%) |
| 5 or more Vehicles | 54 (1.5%) | 55 (2.0%) |
| Total | 3,612 (100.0%) | 2,759 (100.0%) |
Commute Time in Pinehurst
The most frequently occuring commute durations in Pinehurst are 10 to 14 minutes (963 commuters, 18.9%), 15 to 19 minutes (917 commuters, 18.0%), and 5 to 9 minutes (788 commuters, 15.4%).
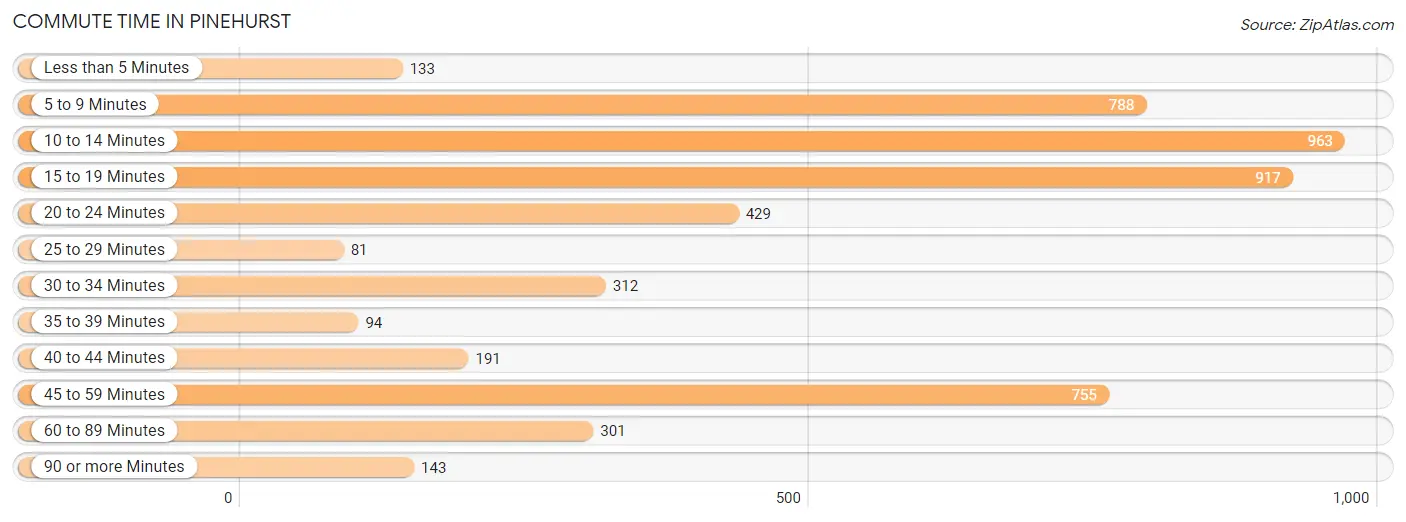
| Commute Time | # Commuters | % Commuters |
| Less than 5 Minutes | 133 | 2.6% |
| 5 to 9 Minutes | 788 | 15.4% |
| 10 to 14 Minutes | 963 | 18.9% |
| 15 to 19 Minutes | 917 | 18.0% |
| 20 to 24 Minutes | 429 | 8.4% |
| 25 to 29 Minutes | 81 | 1.6% |
| 30 to 34 Minutes | 312 | 6.1% |
| 35 to 39 Minutes | 94 | 1.8% |
| 40 to 44 Minutes | 191 | 3.7% |
| 45 to 59 Minutes | 755 | 14.8% |
| 60 to 89 Minutes | 301 | 5.9% |
| 90 or more Minutes | 143 | 2.8% |
Commute Time by Sex in Pinehurst
The most common commute times in Pinehurst are 45 to 59 minutes (602 commuters, 20.5%) for males and 10 to 14 minutes (540 commuters, 24.9%) for females.
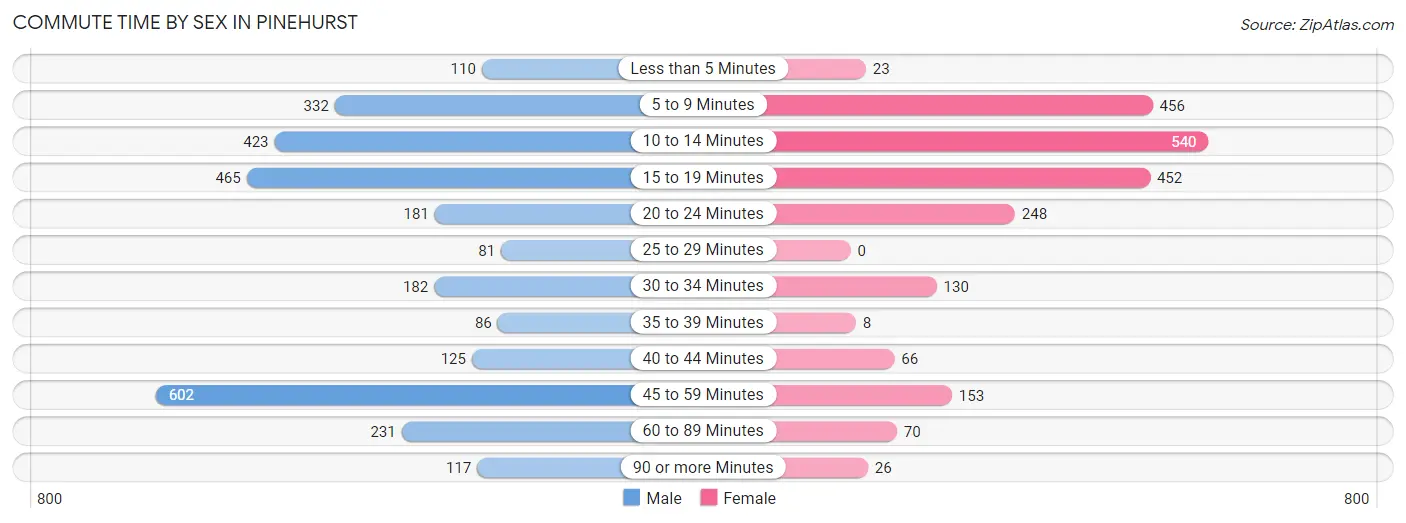
| Commute Time | Male | Female |
| Less than 5 Minutes | 110 (3.7%) | 23 (1.1%) |
| 5 to 9 Minutes | 332 (11.3%) | 456 (21.0%) |
| 10 to 14 Minutes | 423 (14.4%) | 540 (24.9%) |
| 15 to 19 Minutes | 465 (15.8%) | 452 (20.8%) |
| 20 to 24 Minutes | 181 (6.2%) | 248 (11.4%) |
| 25 to 29 Minutes | 81 (2.8%) | 0 (0.0%) |
| 30 to 34 Minutes | 182 (6.2%) | 130 (6.0%) |
| 35 to 39 Minutes | 86 (2.9%) | 8 (0.4%) |
| 40 to 44 Minutes | 125 (4.3%) | 66 (3.0%) |
| 45 to 59 Minutes | 602 (20.5%) | 153 (7.0%) |
| 60 to 89 Minutes | 231 (7.9%) | 70 (3.2%) |
| 90 or more Minutes | 117 (4.0%) | 26 (1.2%) |
Time of Departure to Work by Sex in Pinehurst
The most frequent times of departure to work in Pinehurst are 8:00 AM to 8:29 AM (531, 18.1%) for males and 7:30 AM to 7:59 AM (523, 24.1%) for females.
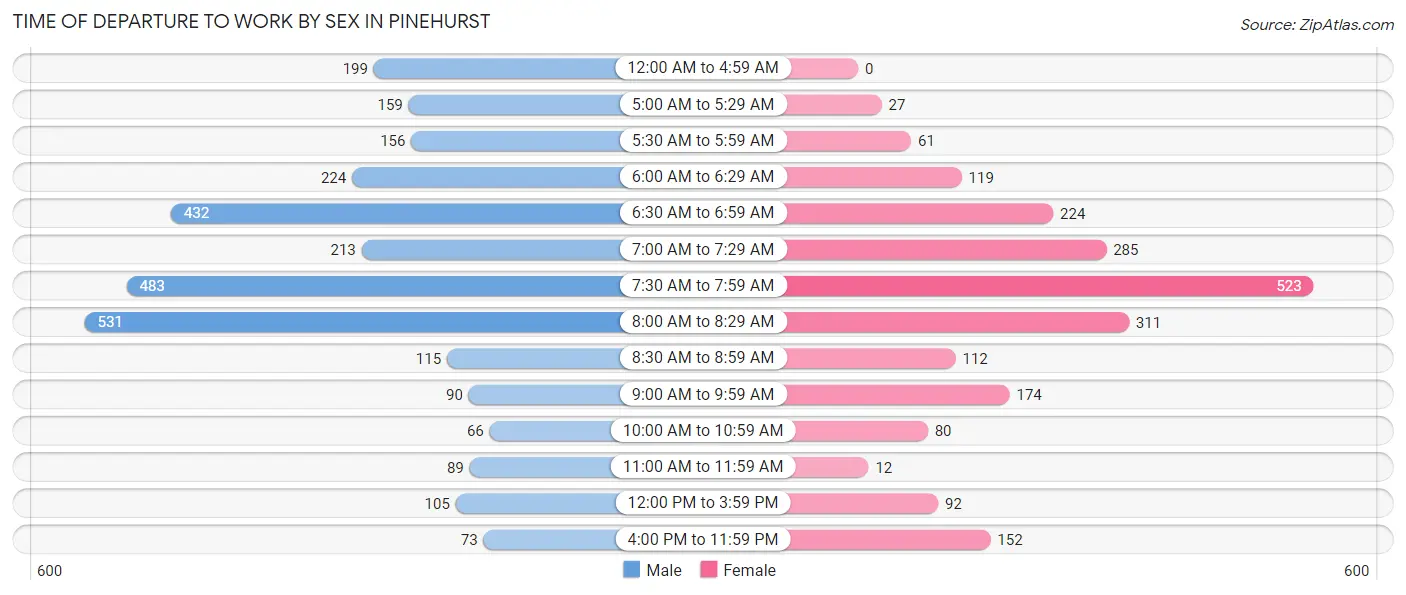
| Time of Departure | Male | Female |
| 12:00 AM to 4:59 AM | 199 (6.8%) | 0 (0.0%) |
| 5:00 AM to 5:29 AM | 159 (5.4%) | 27 (1.2%) |
| 5:30 AM to 5:59 AM | 156 (5.3%) | 61 (2.8%) |
| 6:00 AM to 6:29 AM | 224 (7.6%) | 119 (5.5%) |
| 6:30 AM to 6:59 AM | 432 (14.7%) | 224 (10.3%) |
| 7:00 AM to 7:29 AM | 213 (7.3%) | 285 (13.1%) |
| 7:30 AM to 7:59 AM | 483 (16.5%) | 523 (24.1%) |
| 8:00 AM to 8:29 AM | 531 (18.1%) | 311 (14.3%) |
| 8:30 AM to 8:59 AM | 115 (3.9%) | 112 (5.2%) |
| 9:00 AM to 9:59 AM | 90 (3.1%) | 174 (8.0%) |
| 10:00 AM to 10:59 AM | 66 (2.2%) | 80 (3.7%) |
| 11:00 AM to 11:59 AM | 89 (3.0%) | 12 (0.5%) |
| 12:00 PM to 3:59 PM | 105 (3.6%) | 92 (4.2%) |
| 4:00 PM to 11:59 PM | 73 (2.5%) | 152 (7.0%) |
| Total | 2,935 (100.0%) | 2,172 (100.0%) |
Housing Occupancy in Pinehurst
Occupancy by Ownership in Pinehurst
Of the total 8,216 dwellings in Pinehurst, owner-occupied units account for 7,189 (87.5%), while renter-occupied units make up 1,027 (12.5%).
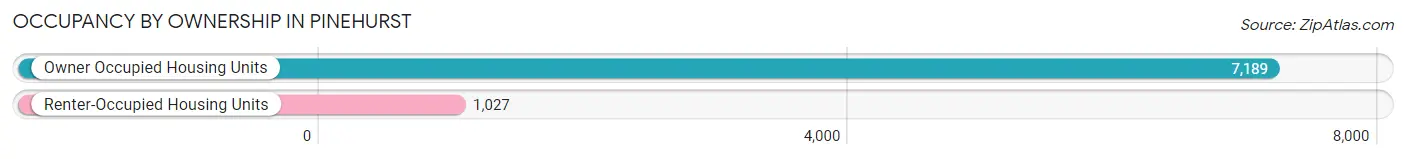
| Occupancy | # Housing Units | % Housing Units |
| Owner Occupied Housing Units | 7,189 | 87.5% |
| Renter-Occupied Housing Units | 1,027 | 12.5% |
| Total Occupied Housing Units | 8,216 | 100.0% |
Occupancy by Household Size in Pinehurst
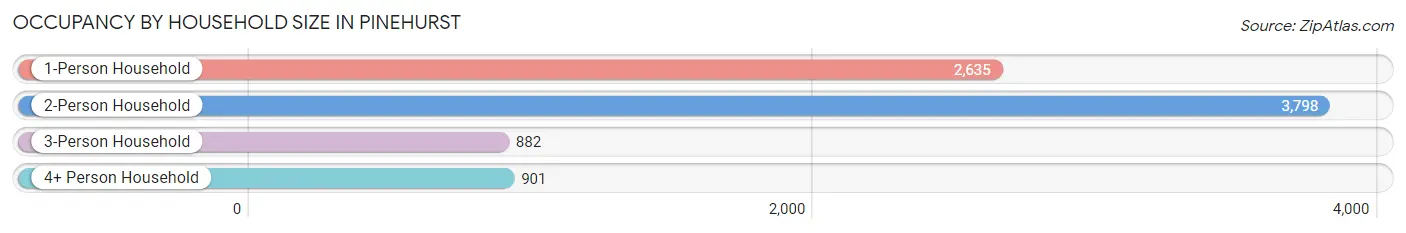
| Household Size | # Housing Units | % Housing Units |
| 1-Person Household | 2,635 | 32.1% |
| 2-Person Household | 3,798 | 46.2% |
| 3-Person Household | 882 | 10.7% |
| 4+ Person Household | 901 | 11.0% |
| Total Housing Units | 8,216 | 100.0% |
Occupancy by Ownership by Household Size in Pinehurst
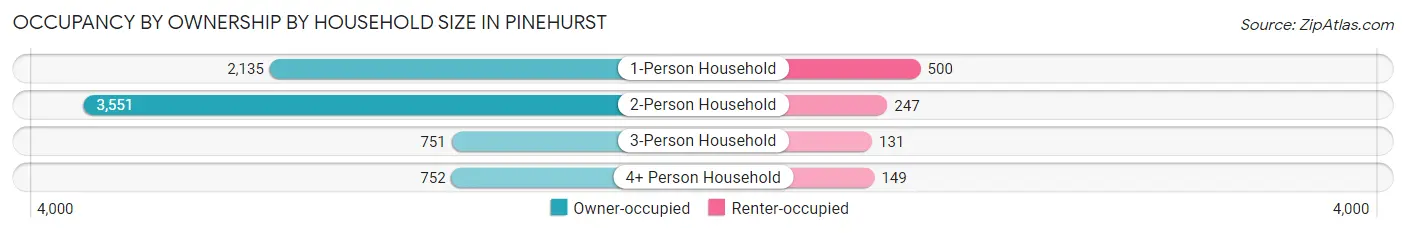
| Household Size | Owner-occupied | Renter-occupied |
| 1-Person Household | 2,135 (81.0%) | 500 (19.0%) |
| 2-Person Household | 3,551 (93.5%) | 247 (6.5%) |
| 3-Person Household | 751 (85.2%) | 131 (14.8%) |
| 4+ Person Household | 752 (83.5%) | 149 (16.5%) |
| Total Housing Units | 7,189 (87.5%) | 1,027 (12.5%) |
Occupancy by Educational Attainment in Pinehurst
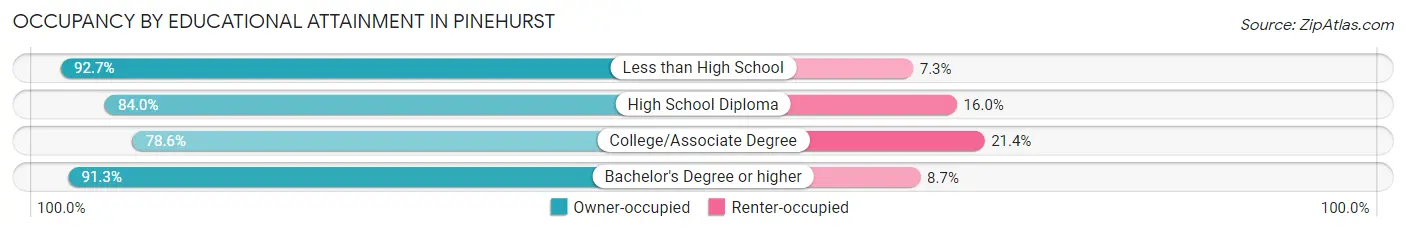
| Household Size | Owner-occupied | Renter-occupied |
| Less than High School | 115 (92.7%) | 9 (7.3%) |
| High School Diploma | 558 (84.0%) | 106 (16.0%) |
| College/Associate Degree | 1,636 (78.6%) | 446 (21.4%) |
| Bachelor's Degree or higher | 4,880 (91.3%) | 466 (8.7%) |
Occupancy by Age of Householder in Pinehurst
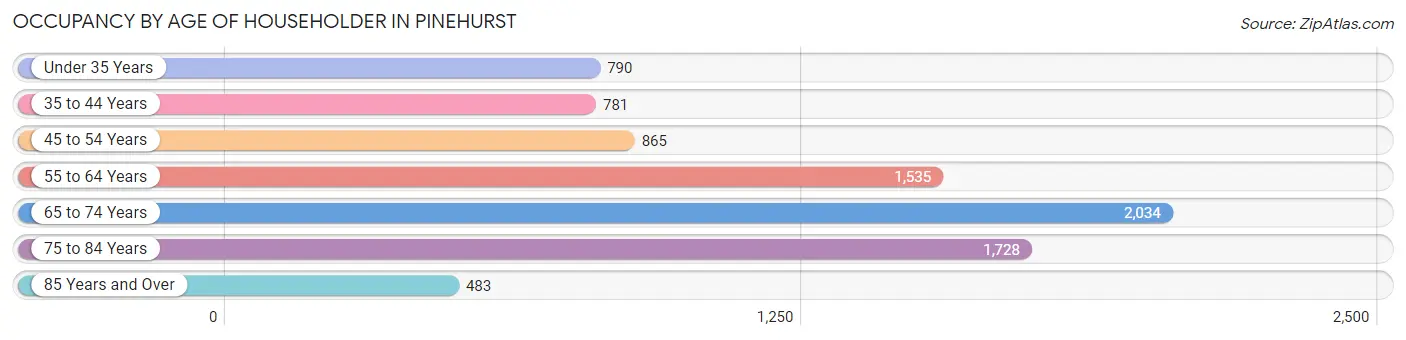
| Age Bracket | # Households | % Households |
| Under 35 Years | 790 | 9.6% |
| 35 to 44 Years | 781 | 9.5% |
| 45 to 54 Years | 865 | 10.5% |
| 55 to 64 Years | 1,535 | 18.7% |
| 65 to 74 Years | 2,034 | 24.8% |
| 75 to 84 Years | 1,728 | 21.0% |
| 85 Years and Over | 483 | 5.9% |
| Total | 8,216 | 100.0% |
Housing Finances in Pinehurst
Median Income by Occupancy in Pinehurst
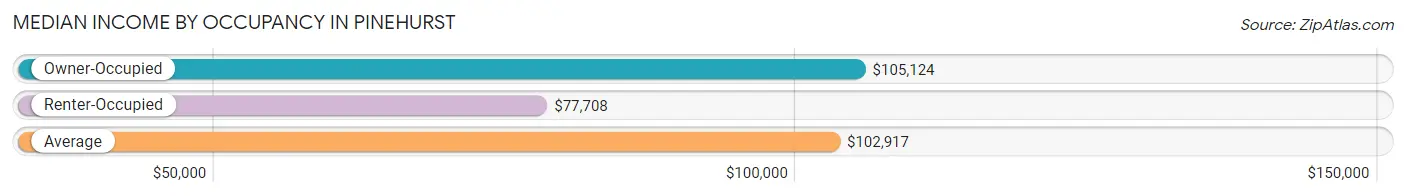
| Occupancy Type | # Households | Median Income |
| Owner-Occupied | 7,189 (87.5%) | $105,124 |
| Renter-Occupied | 1,027 (12.5%) | $77,708 |
| Average | 8,216 (100.0%) | $102,917 |
Occupancy by Householder Income Bracket in Pinehurst
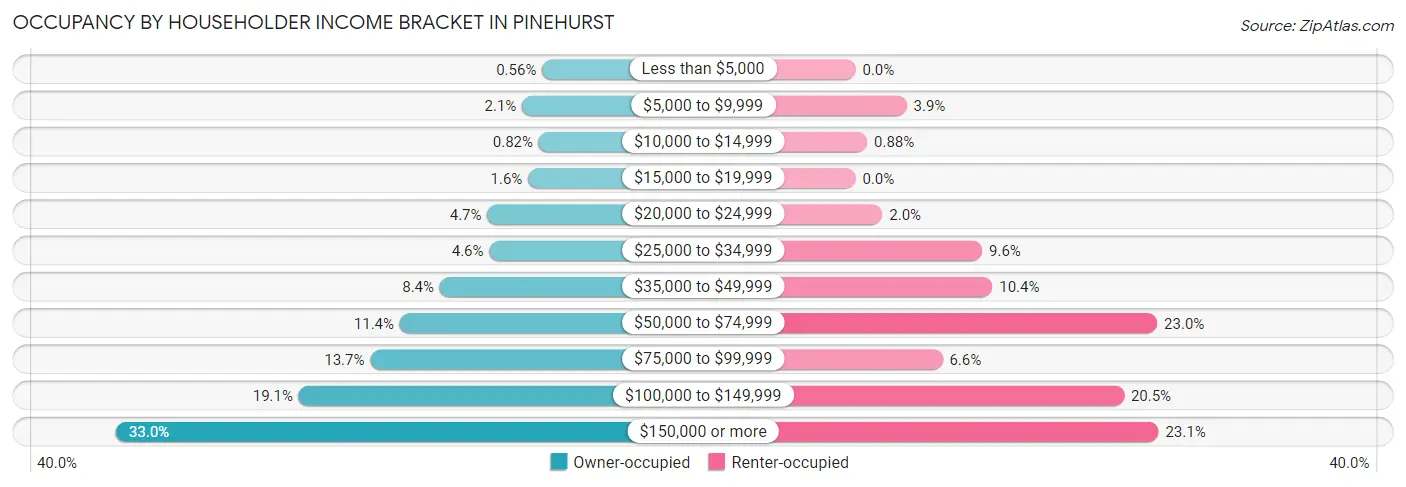
| Income Bracket | Owner-occupied | Renter-occupied |
| Less than $5,000 | 40 (0.6%) | 0 (0.0%) |
| $5,000 to $9,999 | 150 (2.1%) | 40 (3.9%) |
| $10,000 to $14,999 | 59 (0.8%) | 9 (0.9%) |
| $15,000 to $19,999 | 117 (1.6%) | 0 (0.0%) |
| $20,000 to $24,999 | 341 (4.7%) | 21 (2.0%) |
| $25,000 to $34,999 | 330 (4.6%) | 99 (9.6%) |
| $35,000 to $49,999 | 601 (8.4%) | 107 (10.4%) |
| $50,000 to $74,999 | 820 (11.4%) | 236 (23.0%) |
| $75,000 to $99,999 | 982 (13.7%) | 68 (6.6%) |
| $100,000 to $149,999 | 1,374 (19.1%) | 210 (20.4%) |
| $150,000 or more | 2,375 (33.0%) | 237 (23.1%) |
| Total | 7,189 (100.0%) | 1,027 (100.0%) |
Monthly Housing Cost Tiers in Pinehurst
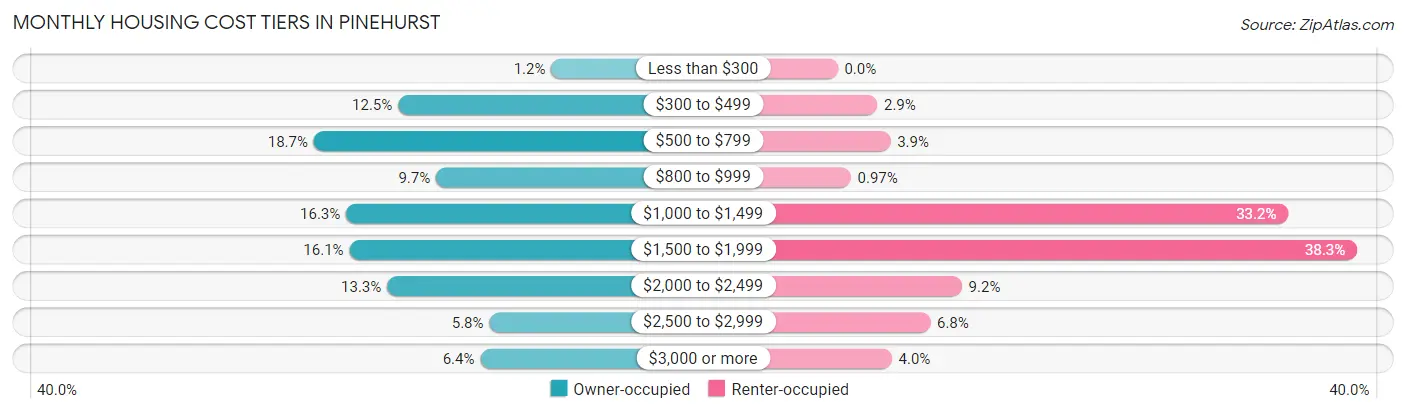
| Monthly Cost | Owner-occupied | Renter-occupied |
| Less than $300 | 87 (1.2%) | 0 (0.0%) |
| $300 to $499 | 898 (12.5%) | 30 (2.9%) |
| $500 to $799 | 1,344 (18.7%) | 40 (3.9%) |
| $800 to $999 | 697 (9.7%) | 10 (1.0%) |
| $1,000 to $1,499 | 1,173 (16.3%) | 341 (33.2%) |
| $1,500 to $1,999 | 1,156 (16.1%) | 393 (38.3%) |
| $2,000 to $2,499 | 956 (13.3%) | 94 (9.1%) |
| $2,500 to $2,999 | 415 (5.8%) | 70 (6.8%) |
| $3,000 or more | 463 (6.4%) | 41 (4.0%) |
| Total | 7,189 (100.0%) | 1,027 (100.0%) |
Physical Housing Characteristics in Pinehurst
Housing Structures in Pinehurst
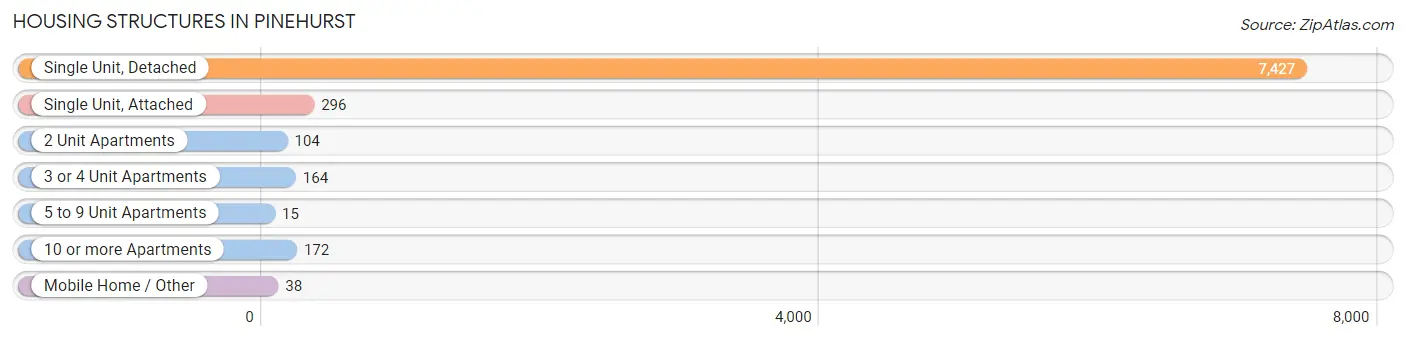
| Structure Type | # Housing Units | % Housing Units |
| Single Unit, Detached | 7,427 | 90.4% |
| Single Unit, Attached | 296 | 3.6% |
| 2 Unit Apartments | 104 | 1.3% |
| 3 or 4 Unit Apartments | 164 | 2.0% |
| 5 to 9 Unit Apartments | 15 | 0.2% |
| 10 or more Apartments | 172 | 2.1% |
| Mobile Home / Other | 38 | 0.5% |
| Total | 8,216 | 100.0% |
Housing Structures by Occupancy in Pinehurst
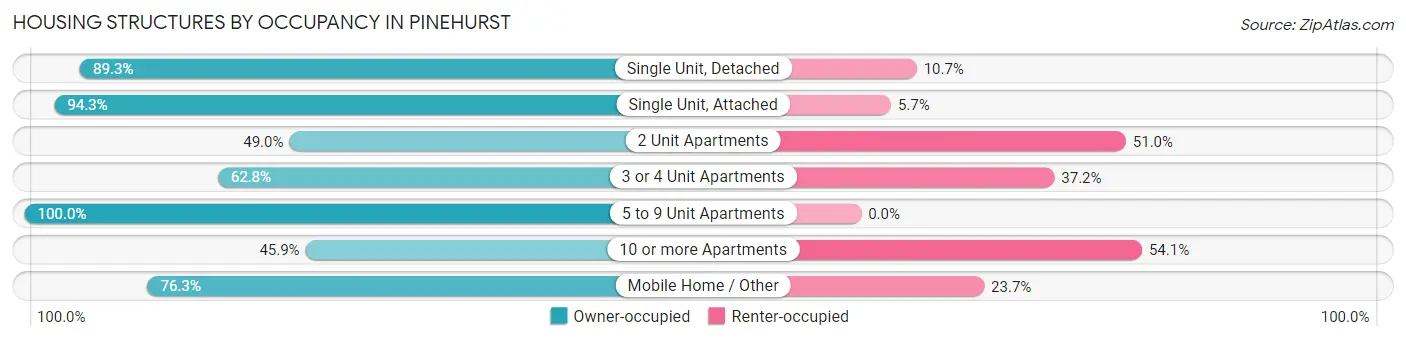
| Structure Type | Owner-occupied | Renter-occupied |
| Single Unit, Detached | 6,633 (89.3%) | 794 (10.7%) |
| Single Unit, Attached | 279 (94.3%) | 17 (5.7%) |
| 2 Unit Apartments | 51 (49.0%) | 53 (51.0%) |
| 3 or 4 Unit Apartments | 103 (62.8%) | 61 (37.2%) |
| 5 to 9 Unit Apartments | 15 (100.0%) | 0 (0.0%) |
| 10 or more Apartments | 79 (45.9%) | 93 (54.1%) |
| Mobile Home / Other | 29 (76.3%) | 9 (23.7%) |
| Total | 7,189 (87.5%) | 1,027 (12.5%) |
Housing Structures by Number of Rooms in Pinehurst
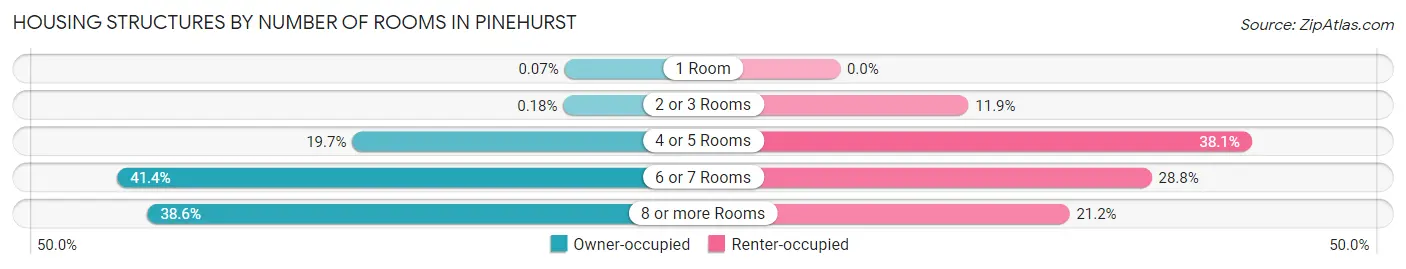
| Number of Rooms | Owner-occupied | Renter-occupied |
| 1 Room | 5 (0.1%) | 0 (0.0%) |
| 2 or 3 Rooms | 13 (0.2%) | 122 (11.9%) |
| 4 or 5 Rooms | 1,416 (19.7%) | 391 (38.1%) |
| 6 or 7 Rooms | 2,978 (41.4%) | 296 (28.8%) |
| 8 or more Rooms | 2,777 (38.6%) | 218 (21.2%) |
| Total | 7,189 (100.0%) | 1,027 (100.0%) |
Housing Structure by Heating Type in Pinehurst
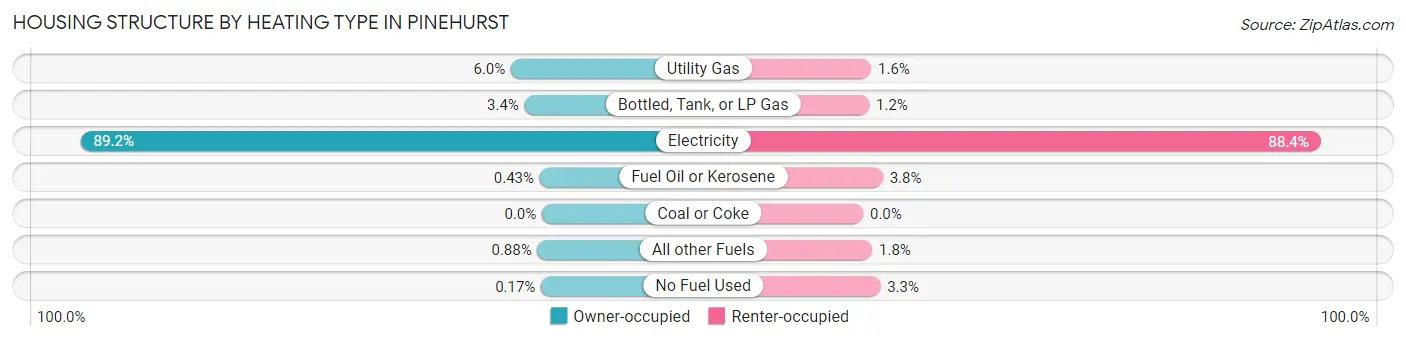
| Heating Type | Owner-occupied | Renter-occupied |
| Utility Gas | 431 (6.0%) | 16 (1.6%) |
| Bottled, Tank, or LP Gas | 242 (3.4%) | 12 (1.2%) |
| Electricity | 6,410 (89.2%) | 908 (88.4%) |
| Fuel Oil or Kerosene | 31 (0.4%) | 39 (3.8%) |
| Coal or Coke | 0 (0.0%) | 0 (0.0%) |
| All other Fuels | 63 (0.9%) | 18 (1.8%) |
| No Fuel Used | 12 (0.2%) | 34 (3.3%) |
| Total | 7,189 (100.0%) | 1,027 (100.0%) |
Household Vehicle Usage in Pinehurst
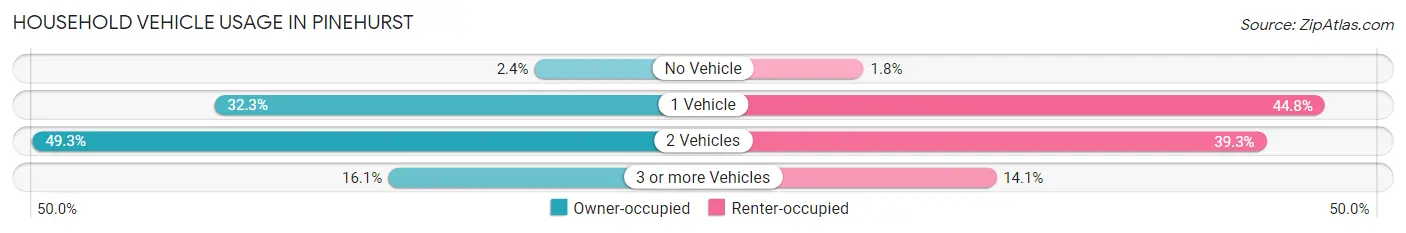
| Vehicles per Household | Owner-occupied | Renter-occupied |
| No Vehicle | 174 (2.4%) | 18 (1.8%) |
| 1 Vehicle | 2,319 (32.3%) | 460 (44.8%) |
| 2 Vehicles | 3,541 (49.3%) | 404 (39.3%) |
| 3 or more Vehicles | 1,155 (16.1%) | 145 (14.1%) |
| Total | 7,189 (100.0%) | 1,027 (100.0%) |
Real Estate & Mortgages in Pinehurst
Real Estate and Mortgage Overview in Pinehurst
| Characteristic | Without Mortgage | With Mortgage |
| Housing Units | 2,809 | 4,380 |
| Median Property Value | $415,700 | $364,800 |
| Median Household Income | $92,011 | $1,461 |
| Monthly Housing Costs | $613 | $445 |
| Real Estate Taxes | $2,819 | $103 |
Property Value by Mortgage Status in Pinehurst
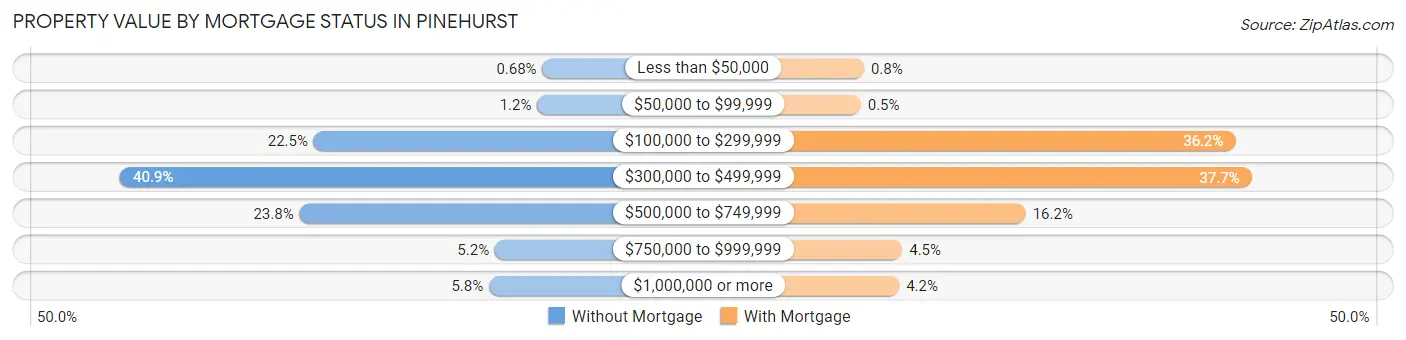
| Property Value | Without Mortgage | With Mortgage |
| Less than $50,000 | 19 (0.7%) | 35 (0.8%) |
| $50,000 to $99,999 | 33 (1.2%) | 22 (0.5%) |
| $100,000 to $299,999 | 631 (22.5%) | 1,584 (36.2%) |
| $300,000 to $499,999 | 1,149 (40.9%) | 1,652 (37.7%) |
| $500,000 to $749,999 | 669 (23.8%) | 710 (16.2%) |
| $750,000 to $999,999 | 146 (5.2%) | 195 (4.4%) |
| $1,000,000 or more | 162 (5.8%) | 182 (4.2%) |
| Total | 2,809 (100.0%) | 4,380 (100.0%) |
Household Income by Mortgage Status in Pinehurst
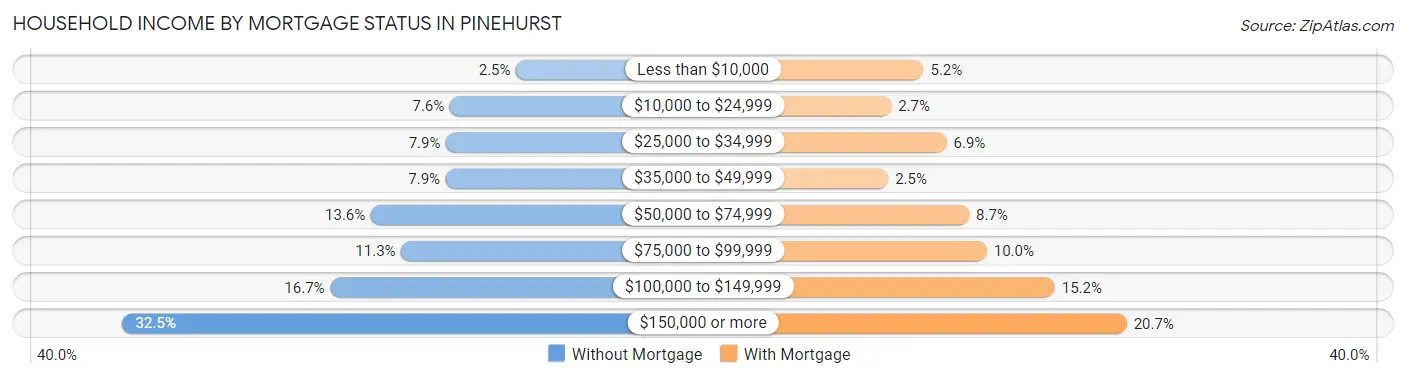
| Household Income | Without Mortgage | With Mortgage |
| Less than $10,000 | 71 (2.5%) | 227 (5.2%) |
| $10,000 to $24,999 | 213 (7.6%) | 119 (2.7%) |
| $25,000 to $34,999 | 221 (7.9%) | 304 (6.9%) |
| $35,000 to $49,999 | 222 (7.9%) | 109 (2.5%) |
| $50,000 to $74,999 | 382 (13.6%) | 379 (8.6%) |
| $75,000 to $99,999 | 317 (11.3%) | 438 (10.0%) |
| $100,000 to $149,999 | 469 (16.7%) | 665 (15.2%) |
| $150,000 or more | 914 (32.5%) | 905 (20.7%) |
| Total | 2,809 (100.0%) | 4,380 (100.0%) |
Property Value to Household Income Ratio in Pinehurst
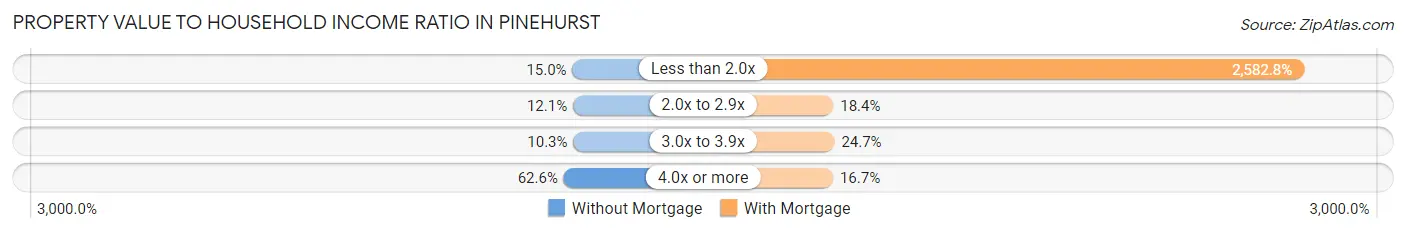
| Value-to-Income Ratio | Without Mortgage | With Mortgage |
| Less than 2.0x | 422 (15.0%) | 113,125 (2,582.8%) |
| 2.0x to 2.9x | 341 (12.1%) | 807 (18.4%) |
| 3.0x to 3.9x | 289 (10.3%) | 1,083 (24.7%) |
| 4.0x or more | 1,757 (62.5%) | 730 (16.7%) |
| Total | 2,809 (100.0%) | 4,380 (100.0%) |
Real Estate Taxes by Mortgage Status in Pinehurst
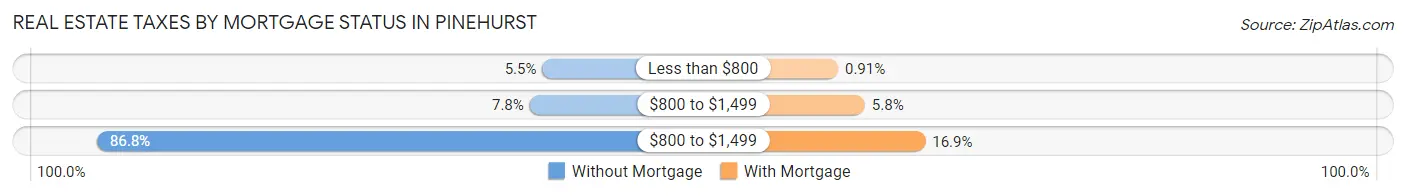
| Property Taxes | Without Mortgage | With Mortgage |
| Less than $800 | 153 (5.4%) | 40 (0.9%) |
| $800 to $1,499 | 218 (7.8%) | 255 (5.8%) |
| $800 to $1,499 | 2,438 (86.8%) | 738 (16.9%) |
| Total | 2,809 (100.0%) | 4,380 (100.0%) |
Health & Disability in Pinehurst
Health Insurance Coverage by Age in Pinehurst
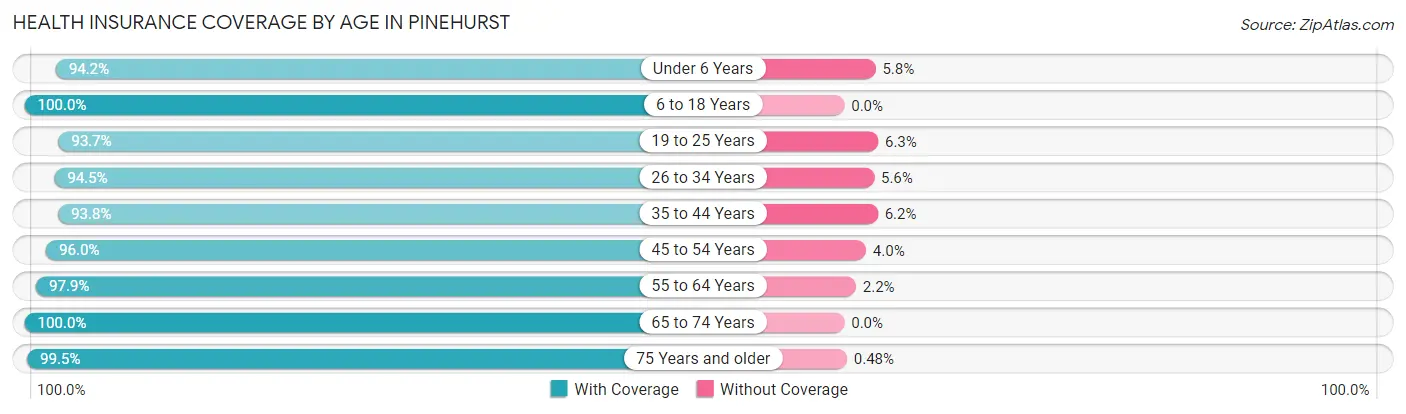
| Age Bracket | With Coverage | Without Coverage |
| Under 6 Years | 858 (94.2%) | 53 (5.8%) |
| 6 to 18 Years | 2,023 (100.0%) | 0 (0.0%) |
| 19 to 25 Years | 536 (93.7%) | 36 (6.3%) |
| 26 to 34 Years | 783 (94.5%) | 46 (5.6%) |
| 35 to 44 Years | 1,189 (93.8%) | 79 (6.2%) |
| 45 to 54 Years | 1,502 (96.0%) | 63 (4.0%) |
| 55 to 64 Years | 2,545 (97.9%) | 56 (2.1%) |
| 65 to 74 Years | 3,507 (100.0%) | 0 (0.0%) |
| 75 Years and older | 3,305 (99.5%) | 16 (0.5%) |
| Total | 16,248 (97.9%) | 349 (2.1%) |
Health Insurance Coverage by Citizenship Status in Pinehurst
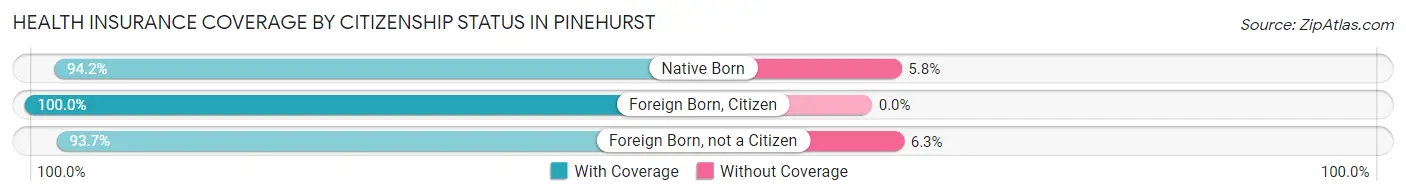
| Citizenship Status | With Coverage | Without Coverage |
| Native Born | 858 (94.2%) | 53 (5.8%) |
| Foreign Born, Citizen | 2,023 (100.0%) | 0 (0.0%) |
| Foreign Born, not a Citizen | 536 (93.7%) | 36 (6.3%) |
Health Insurance Coverage by Household Income in Pinehurst
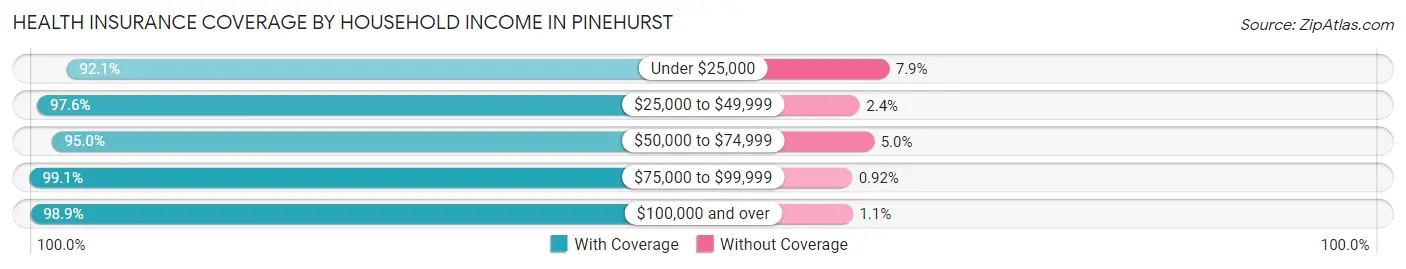
| Household Income | With Coverage | Without Coverage |
| Under $25,000 | 1,019 (92.1%) | 87 (7.9%) |
| $25,000 to $49,999 | 1,615 (97.6%) | 39 (2.4%) |
| $50,000 to $74,999 | 1,903 (95.0%) | 101 (5.0%) |
| $75,000 to $99,999 | 2,154 (99.1%) | 20 (0.9%) |
| $100,000 and over | 9,557 (98.9%) | 102 (1.1%) |
Public vs Private Health Insurance Coverage by Age in Pinehurst
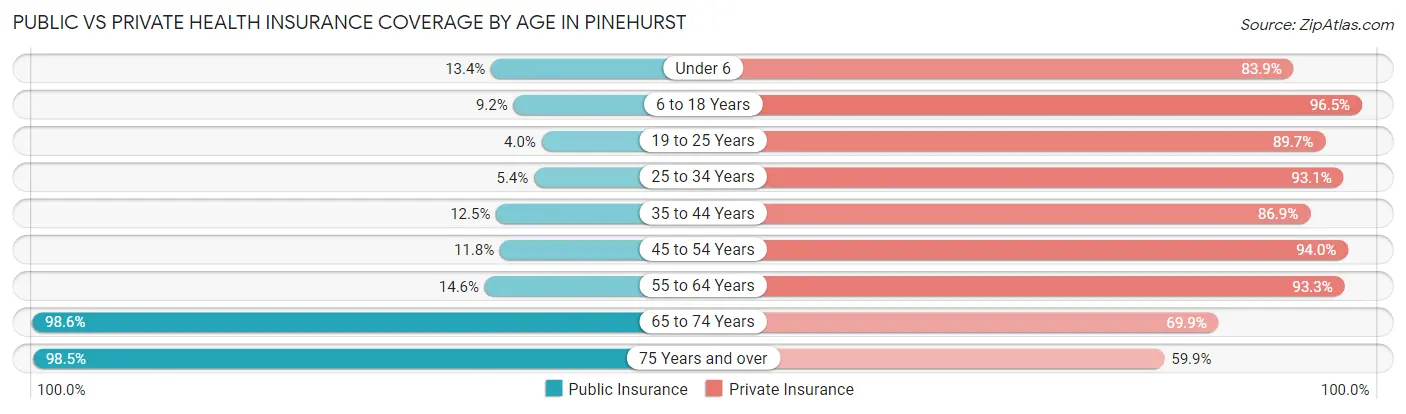
| Age Bracket | Public Insurance | Private Insurance |
| Under 6 | 122 (13.4%) | 764 (83.9%) |
| 6 to 18 Years | 187 (9.2%) | 1,953 (96.5%) |
| 19 to 25 Years | 23 (4.0%) | 513 (89.7%) |
| 25 to 34 Years | 45 (5.4%) | 772 (93.1%) |
| 35 to 44 Years | 158 (12.5%) | 1,102 (86.9%) |
| 45 to 54 Years | 184 (11.8%) | 1,471 (94.0%) |
| 55 to 64 Years | 379 (14.6%) | 2,427 (93.3%) |
| 65 to 74 Years | 3,458 (98.6%) | 2,452 (69.9%) |
| 75 Years and over | 3,271 (98.5%) | 1,988 (59.9%) |
| Total | 7,827 (47.2%) | 13,442 (81.0%) |
Disability Status by Sex by Age in Pinehurst
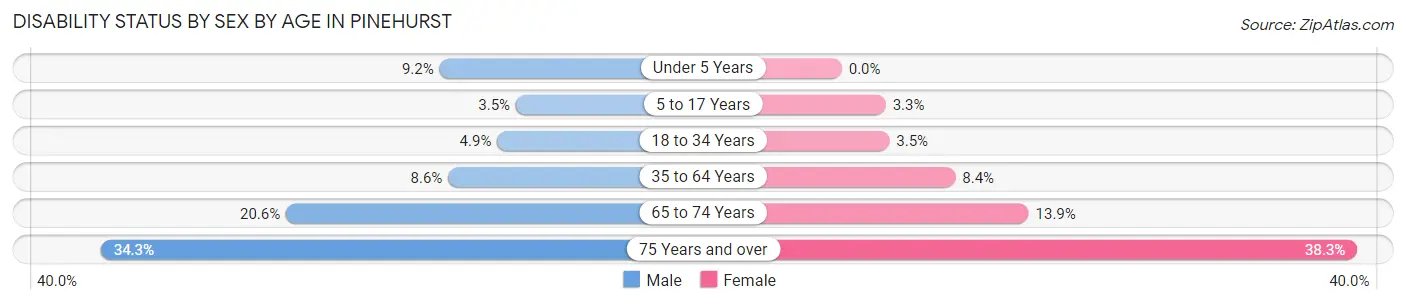
| Age Bracket | Male | Female |
| Under 5 Years | 44 (9.2%) | 0 (0.0%) |
| 5 to 17 Years | 49 (3.5%) | 22 (3.3%) |
| 18 to 34 Years | 33 (4.9%) | 31 (3.5%) |
| 35 to 64 Years | 194 (8.6%) | 267 (8.4%) |
| 65 to 74 Years | 354 (20.6%) | 248 (13.9%) |
| 75 Years and over | 522 (34.3%) | 689 (38.3%) |
Disability Class by Sex by Age in Pinehurst
Disability Class: Hearing Difficulty
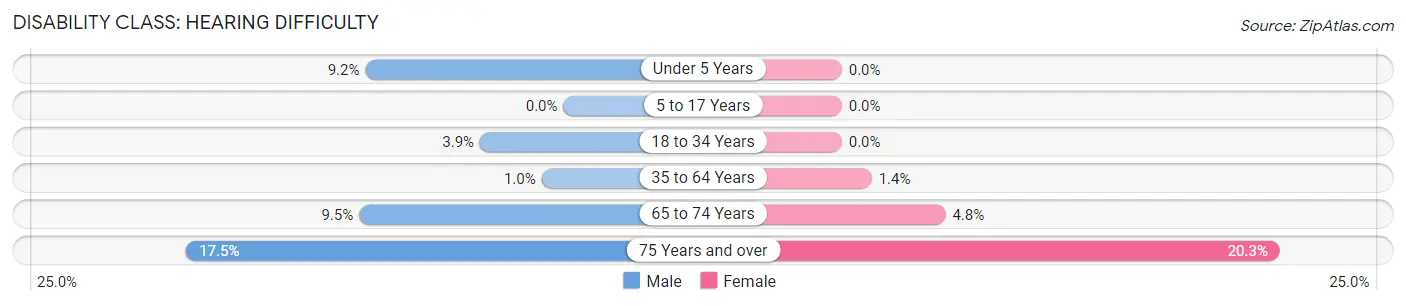
| Age Bracket | Male | Female |
| Under 5 Years | 44 (9.2%) | 0 (0.0%) |
| 5 to 17 Years | 0 (0.0%) | 0 (0.0%) |
| 18 to 34 Years | 26 (3.9%) | 0 (0.0%) |
| 35 to 64 Years | 23 (1.0%) | 44 (1.4%) |
| 65 to 74 Years | 163 (9.5%) | 86 (4.8%) |
| 75 Years and over | 266 (17.5%) | 366 (20.3%) |
Disability Class: Vision Difficulty
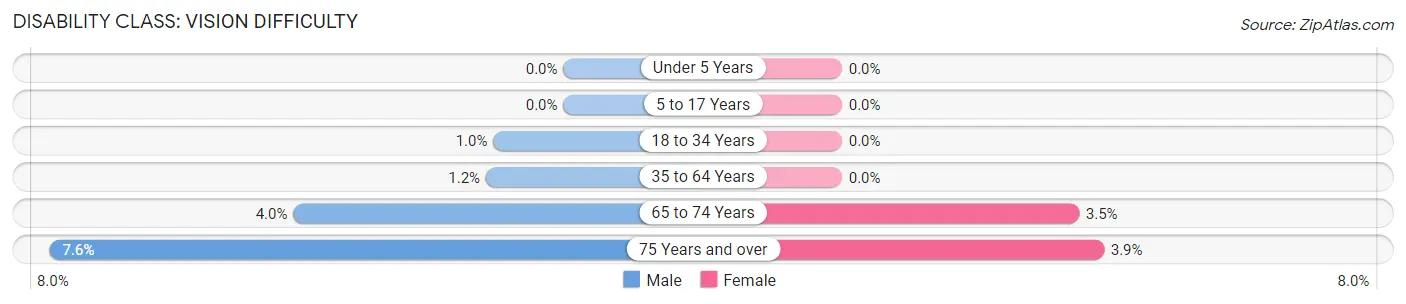
| Age Bracket | Male | Female |
| Under 5 Years | 0 (0.0%) | 0 (0.0%) |
| 5 to 17 Years | 0 (0.0%) | 0 (0.0%) |
| 18 to 34 Years | 7 (1.0%) | 0 (0.0%) |
| 35 to 64 Years | 26 (1.1%) | 0 (0.0%) |
| 65 to 74 Years | 69 (4.0%) | 63 (3.5%) |
| 75 Years and over | 116 (7.6%) | 70 (3.9%) |
Disability Class: Cognitive Difficulty
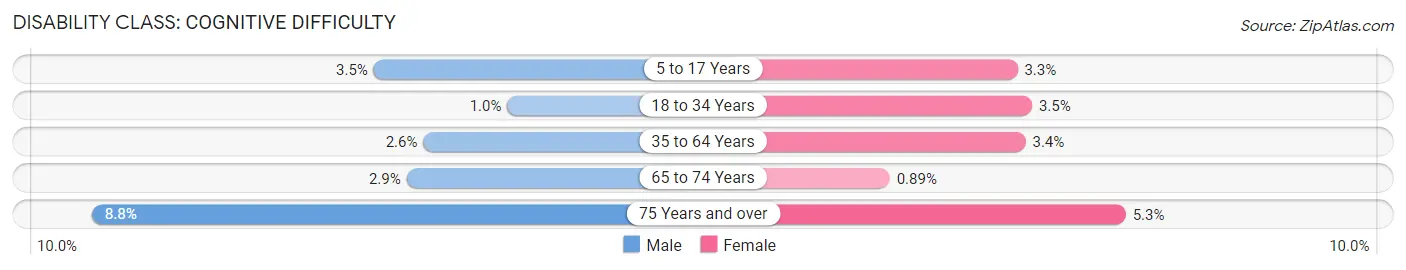
| Age Bracket | Male | Female |
| 5 to 17 Years | 49 (3.5%) | 22 (3.3%) |
| 18 to 34 Years | 7 (1.0%) | 31 (3.5%) |
| 35 to 64 Years | 59 (2.6%) | 108 (3.4%) |
| 65 to 74 Years | 50 (2.9%) | 16 (0.9%) |
| 75 Years and over | 133 (8.7%) | 95 (5.3%) |
Disability Class: Ambulatory Difficulty
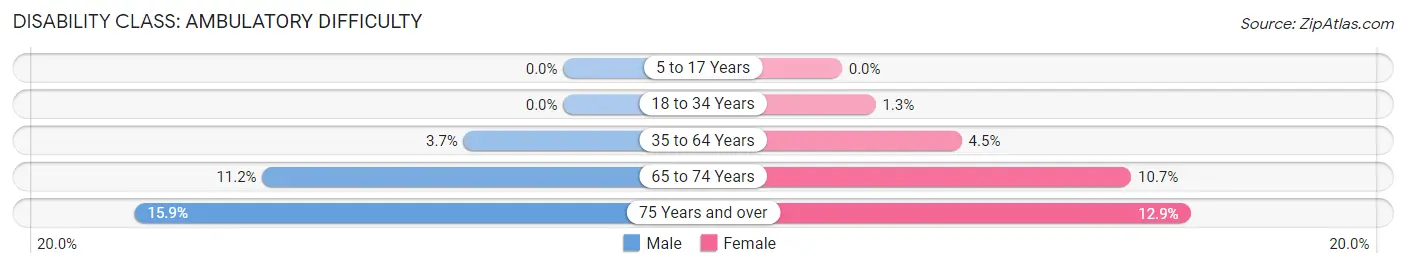
| Age Bracket | Male | Female |
| 5 to 17 Years | 0 (0.0%) | 0 (0.0%) |
| 18 to 34 Years | 0 (0.0%) | 11 (1.3%) |
| 35 to 64 Years | 84 (3.7%) | 141 (4.4%) |
| 65 to 74 Years | 192 (11.2%) | 192 (10.7%) |
| 75 Years and over | 242 (15.9%) | 233 (12.9%) |
Disability Class: Self-Care Difficulty
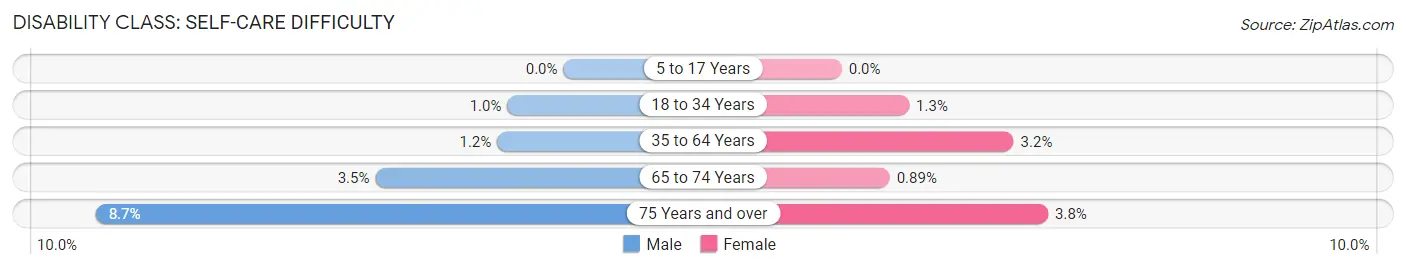
| Age Bracket | Male | Female |
| 5 to 17 Years | 0 (0.0%) | 0 (0.0%) |
| 18 to 34 Years | 7 (1.0%) | 11 (1.3%) |
| 35 to 64 Years | 28 (1.2%) | 101 (3.2%) |
| 65 to 74 Years | 60 (3.5%) | 16 (0.9%) |
| 75 Years and over | 132 (8.7%) | 69 (3.8%) |
Technology Access in Pinehurst
Computing Device Access in Pinehurst
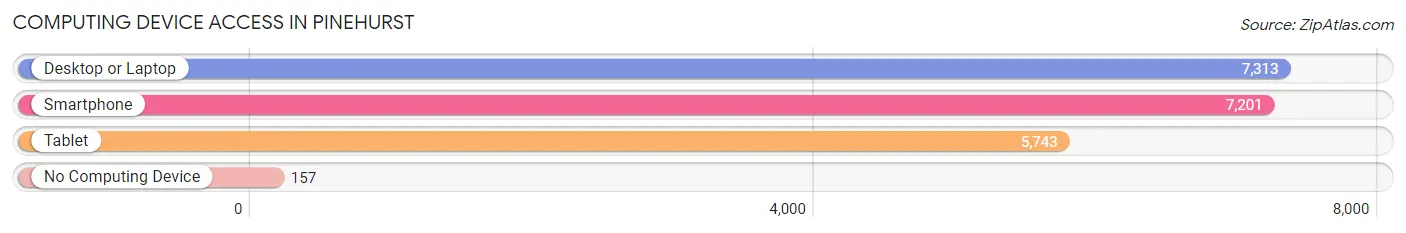
| Device Type | # Households | % Households |
| Desktop or Laptop | 7,313 | 89.0% |
| Smartphone | 7,201 | 87.6% |
| Tablet | 5,743 | 69.9% |
| No Computing Device | 157 | 1.9% |
| Total | 8,216 | 100.0% |
Internet Access in Pinehurst
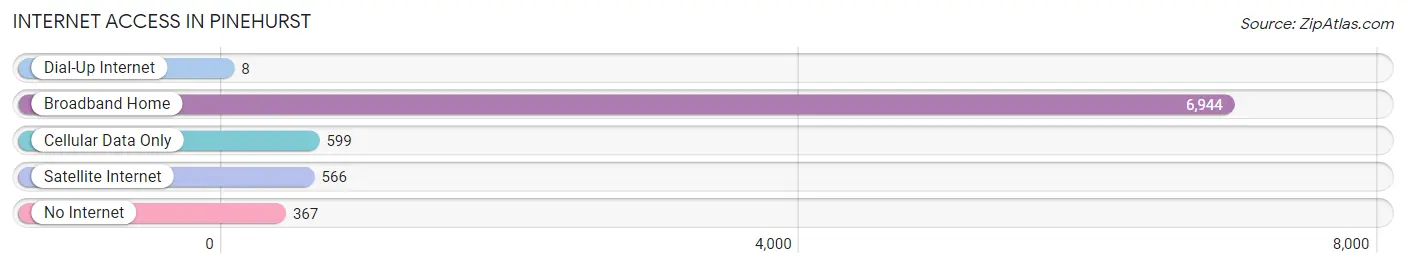
| Internet Type | # Households | % Households |
| Dial-Up Internet | 8 | 0.1% |
| Broadband Home | 6,944 | 84.5% |
| Cellular Data Only | 599 | 7.3% |
| Satellite Internet | 566 | 6.9% |
| No Internet | 367 | 4.5% |
| Total | 8,216 | 100.0% |
Pinehurst Summary
Pinehurst, North Carolina is a small town located in Moore County, North Carolina. It is situated in the Sandhills region of the state, and is known for its golf courses and resorts. The town has a population of approximately 13,000 people, and is home to the Pinehurst Resort, which is one of the most famous golf resorts in the world.
History
Pinehurst was founded in 1895 by James Walker Tufts, a wealthy Boston businessman. Tufts purchased 5,500 acres of land in the Sandhills region of North Carolina and began to develop the area into a resort. He built a hotel, golf courses, and other amenities, and the resort quickly became a popular destination for wealthy Northerners. In the early 1900s, Pinehurst was known as the “Golf Capital of the South” and was home to some of the most prestigious golf tournaments in the world.
In the 1950s, Pinehurst began to decline as a resort destination. The area was hit hard by the Great Depression and World War II, and the resort was no longer able to attract the same number of visitors. In the 1970s, the resort was purchased by a group of investors and underwent a major renovation. The resort was restored to its former glory and is now one of the most popular golf resorts in the world.
Geography
Pinehurst is located in the Sandhills region of North Carolina, which is characterized by rolling hills and sandy soil. The town is situated in Moore County, which is located in the central part of the state. The town is located approximately 70 miles south of Raleigh, the state capital, and is about a two-hour drive from Charlotte.
The town is situated in a humid subtropical climate, which is characterized by hot, humid summers and mild winters. The average temperature in the summer is around 80 degrees Fahrenheit, and the average temperature in the winter is around 50 degrees Fahrenheit.
Economy
Pinehurst’s economy is largely driven by tourism. The town is home to the Pinehurst Resort, which is one of the most famous golf resorts in the world. The resort attracts thousands of visitors each year, and is a major source of revenue for the town. In addition to the resort, Pinehurst is home to several other businesses, including restaurants, shops, and other tourist attractions.
Demographics
As of the 2010 census, Pinehurst had a population of 13,124 people. The racial makeup of the town was 87.3% White, 8.2% African American, 0.7% Native American, 1.2% Asian, 0.1% Pacific Islander, and 2.5% from other races. The median household income in Pinehurst was $50,945, and the median family income was $60,945. The town’s population is largely made up of retirees, as the median age is 57.7 years.
Common Questions
What is Per Capita Income in Pinehurst?
Per Capita income in Pinehurst is $62,322.
What is the Median Family Income in Pinehurst?
Median Family Income in Pinehurst is $122,641.
What is the Median Household income in Pinehurst?
Median Household Income in Pinehurst is $102,917.
What is Income or Wage Gap in Pinehurst?
Income or Wage Gap in Pinehurst is 44.5%.
Women in Pinehurst earn 55.5 cents for every dollar earned by a man.
What is Family Income Deficit in Pinehurst?
Family Income Deficit in Pinehurst is $13,014.
Families that are below poverty line in Pinehurst earn $13,014 less on average than the poverty threshold level.
What is Inequality or Gini Index in Pinehurst?
Inequality or Gini Index in Pinehurst is 0.43.
What is the Total Population of Pinehurst?
Total Population of Pinehurst is 17,653.
What is the Total Male Population of Pinehurst?
Total Male Population of Pinehurst is 8,904.
What is the Total Female Population of Pinehurst?
Total Female Population of Pinehurst is 8,749.
What is the Ratio of Males per 100 Females in Pinehurst?
There are 101.77 Males per 100 Females in Pinehurst.
What is the Ratio of Females per 100 Males in Pinehurst?
There are 98.26 Females per 100 Males in Pinehurst.
What is the Median Population Age in Pinehurst?
Median Population Age in Pinehurst is 60.3 Years.
What is the Average Family Size in Pinehurst
Average Family Size in Pinehurst is 2.6 People.
What is the Average Household Size in Pinehurst
Average Household Size in Pinehurst is 2.1 People.
How Large is the Labor Force in Pinehurst?
There are 6,759 People in the Labor Forcein in Pinehurst.
What is the Percentage of People in the Labor Force in Pinehurst?
44.7% of People are in the Labor Force in Pinehurst.
What is the Unemployment Rate in Pinehurst?
Unemployment Rate in Pinehurst is 4.2%.