Kinston, NC Map & Demographics
Kinston Map
Kinston Overview
$27,127
PER CAPITA INCOME
$46,840
AVG FAMILY INCOME
$35,653
AVG HOUSEHOLD INCOME
28.7%
WAGE / INCOME GAP [ % ]
71.3¢/ $1
WAGE / INCOME GAP [ $ ]
0.52
INEQUALITY / GINI INDEX
19,704
TOTAL POPULATION
8,980
MALE POPULATION
10,724
FEMALE POPULATION
83.74
MALES / 100 FEMALES
119.42
FEMALES / 100 MALES
44.1
MEDIAN AGE
3.1
AVG FAMILY SIZE
2.2
AVG HOUSEHOLD SIZE
7,809
LABOR FORCE [ PEOPLE ]
49.0%
PERCENT IN LABOR FORCE
13.6%
UNEMPLOYMENT RATE
Kinston Area Codes
Income in Kinston
Income Overview in Kinston
Per Capita Income in Kinston is $27,127, while median incomes of families and households are $46,840 and $35,653 respectively.
| Characteristic | Number | Measure |
| Per Capita Income | 19,704 | $27,127 |
| Median Family Income | 4,197 | $46,840 |
| Mean Family Income | 4,197 | $72,916 |
| Median Household Income | 8,711 | $35,653 |
| Mean Household Income | 8,711 | $54,363 |
| Income Deficit | 4,197 | $0 |
| Wage / Income Gap (%) | 19,704 | 28.70% |
| Wage / Income Gap ($) | 19,704 | 71.30¢ per $1 |
| Gini / Inequality Index | 19,704 | 0.52 |
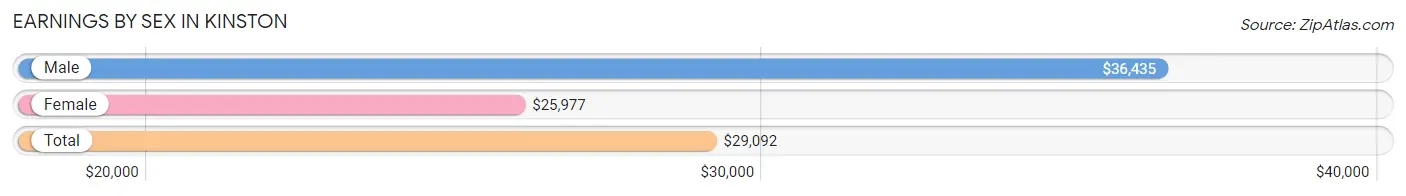
Earnings by Sex in Kinston
Average Earnings in Kinston are $29,092, $36,435 for men and $25,977 for women, a difference of 28.7%.
| Sex | Number | Average Earnings |
| Male | 3,635 (46.6%) | $36,435 |
| Female | 4,173 (53.4%) | $25,977 |
| Total | 7,808 (100.0%) | $29,092 |
Earnings by Sex by Income Bracket in Kinston
The most common earnings brackets in Kinston are $25,000 to $29,999 for men (418 | 11.5%) and $25,000 to $29,999 for women (592 | 14.2%).
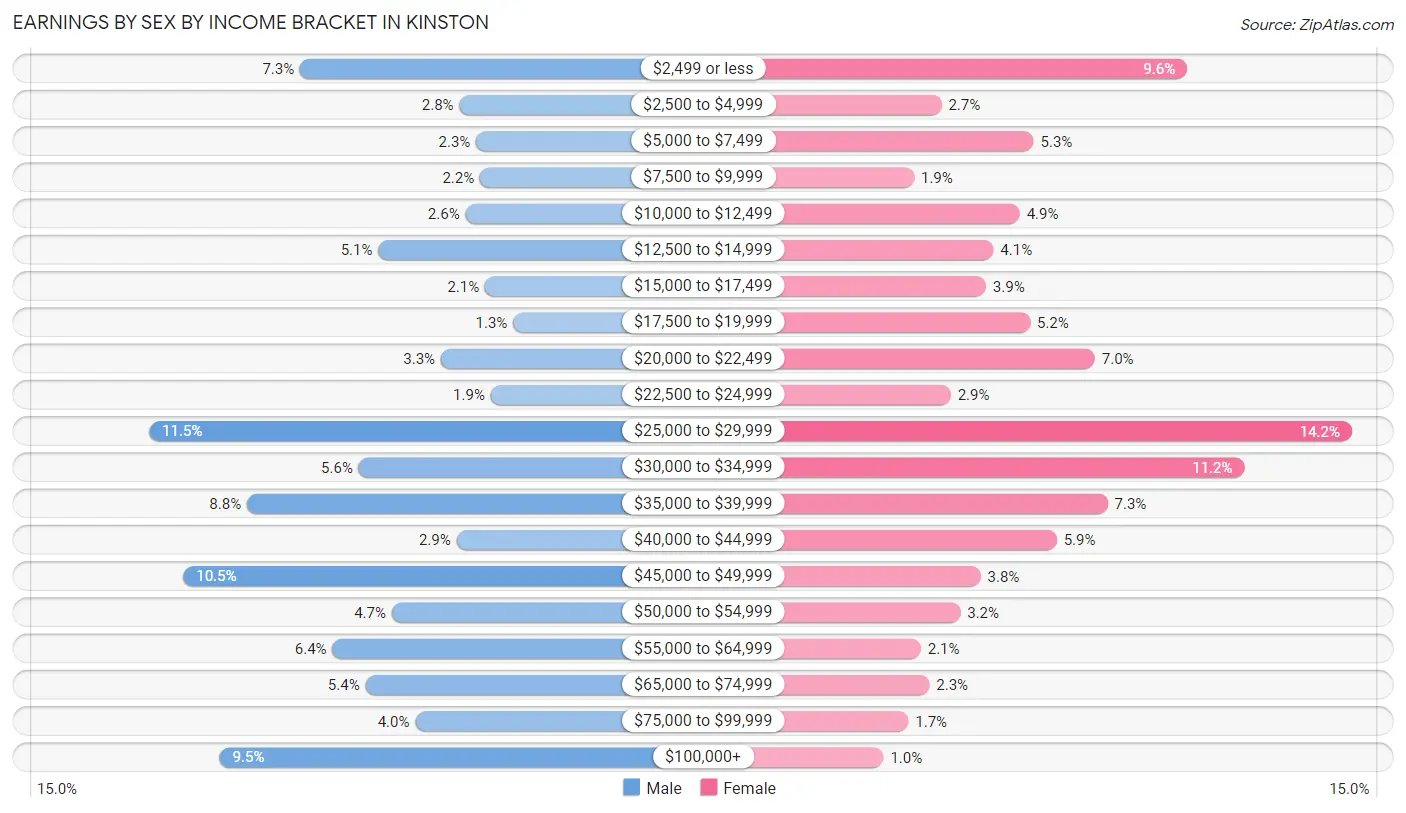
| Income | Male | Female |
| $2,499 or less | 264 (7.3%) | 399 (9.6%) |
| $2,500 to $4,999 | 101 (2.8%) | 111 (2.7%) |
| $5,000 to $7,499 | 84 (2.3%) | 219 (5.2%) |
| $7,500 to $9,999 | 80 (2.2%) | 79 (1.9%) |
| $10,000 to $12,499 | 95 (2.6%) | 203 (4.9%) |
| $12,500 to $14,999 | 184 (5.1%) | 172 (4.1%) |
| $15,000 to $17,499 | 75 (2.1%) | 163 (3.9%) |
| $17,500 to $19,999 | 46 (1.3%) | 215 (5.1%) |
| $20,000 to $22,499 | 120 (3.3%) | 291 (7.0%) |
| $22,500 to $24,999 | 69 (1.9%) | 122 (2.9%) |
| $25,000 to $29,999 | 418 (11.5%) | 592 (14.2%) |
| $30,000 to $34,999 | 204 (5.6%) | 466 (11.2%) |
| $35,000 to $39,999 | 318 (8.7%) | 306 (7.3%) |
| $40,000 to $44,999 | 104 (2.9%) | 246 (5.9%) |
| $45,000 to $49,999 | 383 (10.5%) | 157 (3.8%) |
| $50,000 to $54,999 | 170 (4.7%) | 133 (3.2%) |
| $55,000 to $64,999 | 231 (6.4%) | 87 (2.1%) |
| $65,000 to $74,999 | 197 (5.4%) | 97 (2.3%) |
| $75,000 to $99,999 | 146 (4.0%) | 72 (1.7%) |
| $100,000+ | 346 (9.5%) | 43 (1.0%) |
| Total | 3,635 (100.0%) | 4,173 (100.0%) |
Earnings by Sex by Educational Attainment in Kinston
Average earnings in Kinston are $37,250 for men and $28,602 for women, a difference of 23.2%. Men with an educational attainment of bachelor's degree enjoy the highest average annual earnings of $64,135, while those with less than high school education earn the least with $11,115. Women with an educational attainment of graduate degree earn the most with the average annual earnings of $45,882, while those with high school diploma education have the smallest earnings of $25,466.
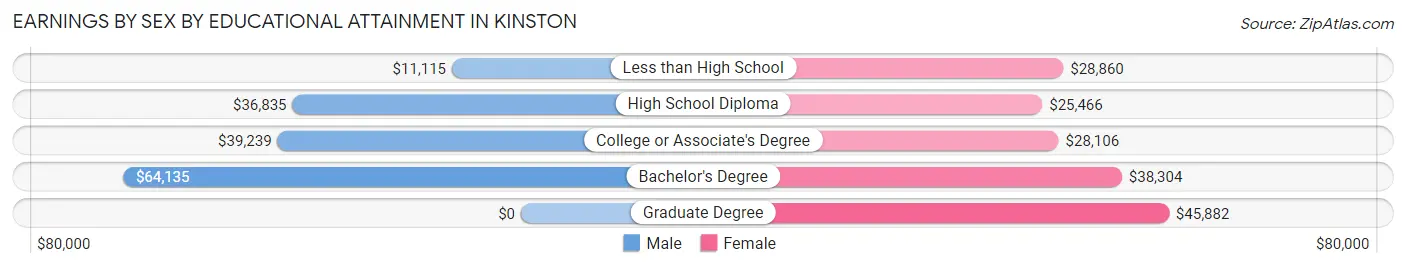
| Educational Attainment | Male Income | Female Income |
| Less than High School | $11,115 | $28,860 |
| High School Diploma | $36,835 | $25,466 |
| College or Associate's Degree | $39,239 | $28,106 |
| Bachelor's Degree | $64,135 | $38,304 |
| Graduate Degree | - | - |
| Total | $37,250 | $28,602 |
Family Income in Kinston
Family Income Brackets in Kinston
According to the Kinston family income data, there are 743 families falling into the $50,000 to $74,999 income range, which is the most common income bracket and makes up 17.7% of all families. Conversely, the $150,000 to $199,999 income bracket is the least frequent group with only 118 families (2.8%) belonging to this category.
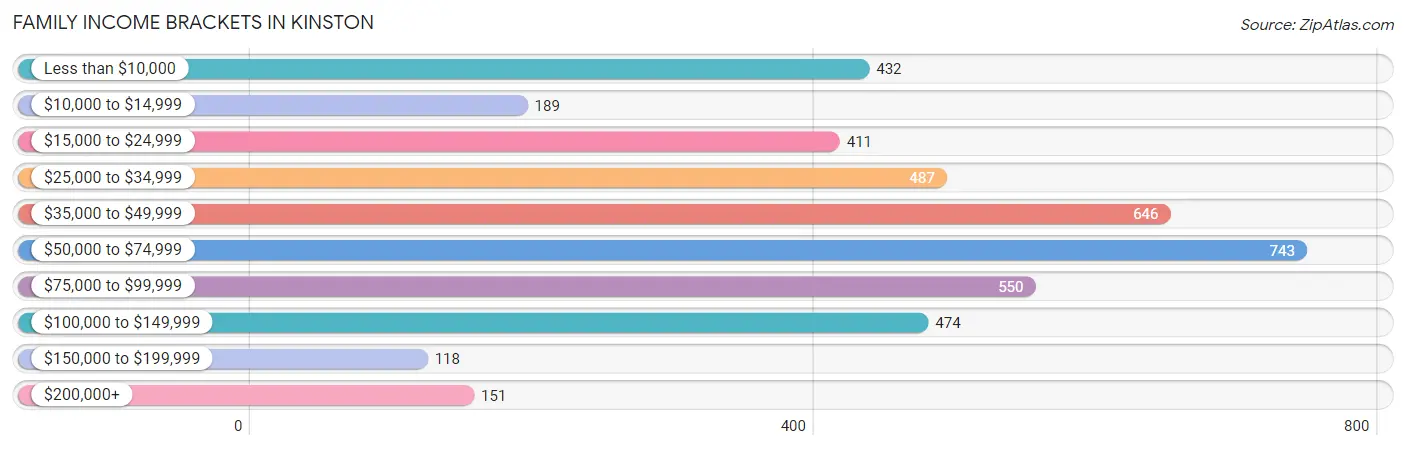
| Income Bracket | # Families | % Families |
| Less than $10,000 | 432 | 10.3% |
| $10,000 to $14,999 | 189 | 4.5% |
| $15,000 to $24,999 | 411 | 9.8% |
| $25,000 to $34,999 | 487 | 11.6% |
| $35,000 to $49,999 | 646 | 15.4% |
| $50,000 to $74,999 | 743 | 17.7% |
| $75,000 to $99,999 | 550 | 13.1% |
| $100,000 to $149,999 | 474 | 11.3% |
| $150,000 to $199,999 | 118 | 2.8% |
| $200,000+ | 151 | 3.6% |
Family Income by Famaliy Size in Kinston
7+ person families (132 | 3.2%) account for the highest median family income in Kinston with $97,177 per family, while 2-person families (2,191 | 52.2%) have the highest median income of $22,784 per family member.
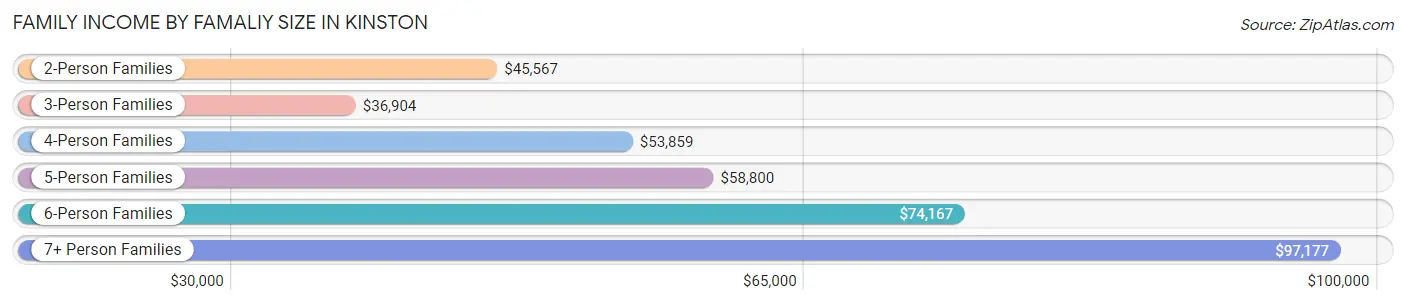
| Income Bracket | # Families | Median Income |
| 2-Person Families | 2,191 (52.2%) | $45,567 |
| 3-Person Families | 981 (23.4%) | $36,904 |
| 4-Person Families | 533 (12.7%) | $53,859 |
| 5-Person Families | 330 (7.9%) | $58,800 |
| 6-Person Families | 30 (0.7%) | $74,167 |
| 7+ Person Families | 132 (3.2%) | $97,177 |
| Total | 4,197 (100.0%) | $46,840 |
Family Income by Number of Earners in Kinston
The median family income in Kinston is $46,840, with families comprising 3+ earners (233) having the highest median family income of $81,979, while families with no earners (1,081) have the lowest median family income of $32,488, accounting for 5.6% and 25.8% of families, respectively.
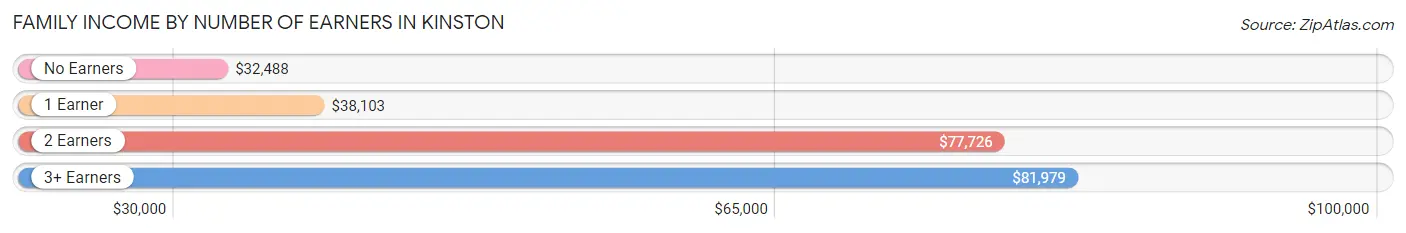
| Number of Earners | # Families | Median Income |
| No Earners | 1,081 (25.8%) | $32,488 |
| 1 Earner | 1,560 (37.2%) | $38,103 |
| 2 Earners | 1,323 (31.5%) | $77,726 |
| 3+ Earners | 233 (5.6%) | $81,979 |
| Total | 4,197 (100.0%) | $46,840 |
Household Income in Kinston
Household Income Brackets in Kinston
With 1,429 households falling in the category, the $35,000 to $49,999 income range is the most frequent in Kinston, accounting for 16.4% of all households. In contrast, only 113 households (1.3%) fall into the $150,000 to $199,999 income bracket, making it the least populous group.
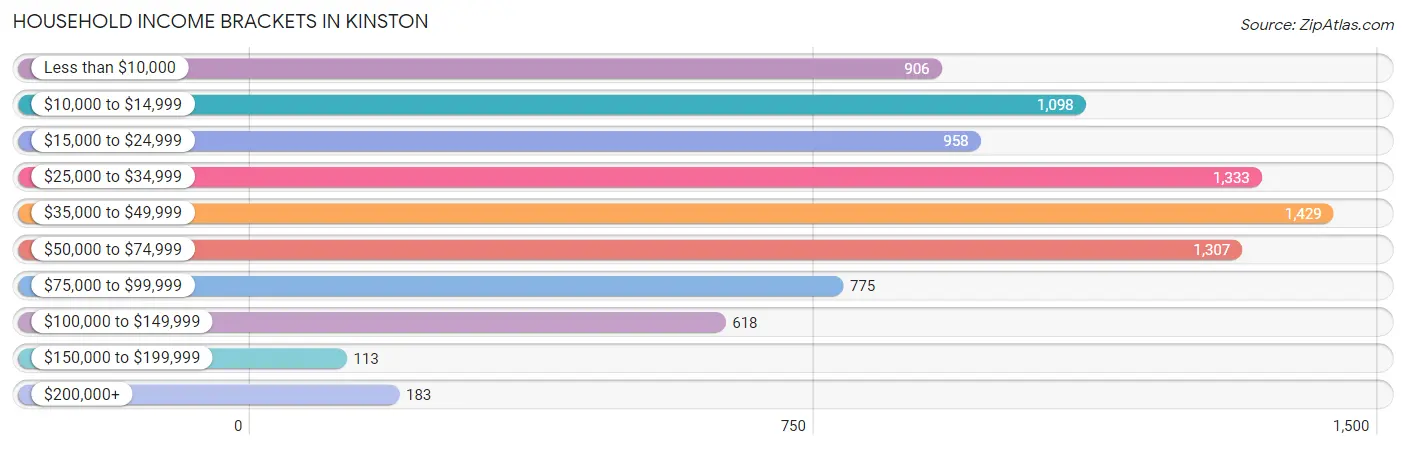
| Income Bracket | # Households | % Households |
| Less than $10,000 | 906 | 10.4% |
| $10,000 to $14,999 | 1,098 | 12.6% |
| $15,000 to $24,999 | 958 | 11.0% |
| $25,000 to $34,999 | 1,333 | 15.3% |
| $35,000 to $49,999 | 1,429 | 16.4% |
| $50,000 to $74,999 | 1,307 | 15.0% |
| $75,000 to $99,999 | 775 | 8.9% |
| $100,000 to $149,999 | 618 | 7.1% |
| $150,000 to $199,999 | 113 | 1.3% |
| $200,000+ | 183 | 2.1% |
Household Income by Householder Age in Kinston
The median household income in Kinston is $35,653, with the highest median household income of $46,502 found in the 15 to 24 years age bracket for the primary householder. A total of 359 households (4.1%) fall into this category. Meanwhile, the 25 to 44 years age bracket for the primary householder has the lowest median household income of $29,623, with 2,178 households (25.0%) in this group.
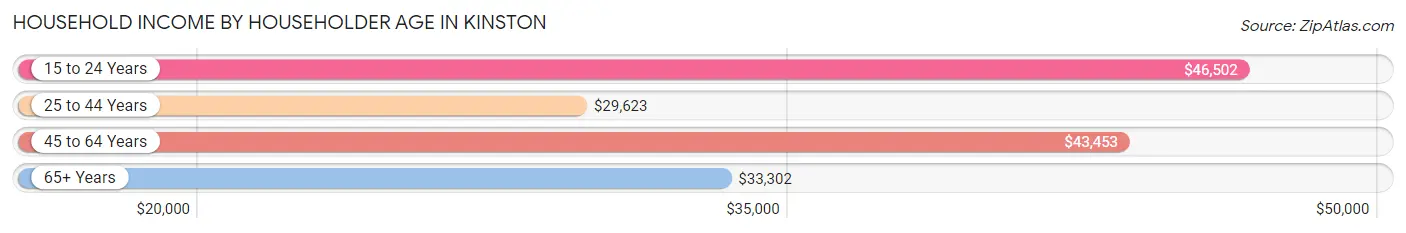
| Income Bracket | # Households | Median Income |
| 15 to 24 Years | 359 (4.1%) | $46,502 |
| 25 to 44 Years | 2,178 (25.0%) | $29,623 |
| 45 to 64 Years | 2,757 (31.7%) | $43,453 |
| 65+ Years | 3,417 (39.2%) | $33,302 |
| Total | 8,711 (100.0%) | $35,653 |
Poverty in Kinston
Income Below Poverty by Sex and Age in Kinston
With 24.5% poverty level for males and 31.2% for females among the residents of Kinston, 15 year old males and 15 year old females are the most vulnerable to poverty, with 83 males (78.3%) and 119 females (78.8%) in their respective age groups living below the poverty level.
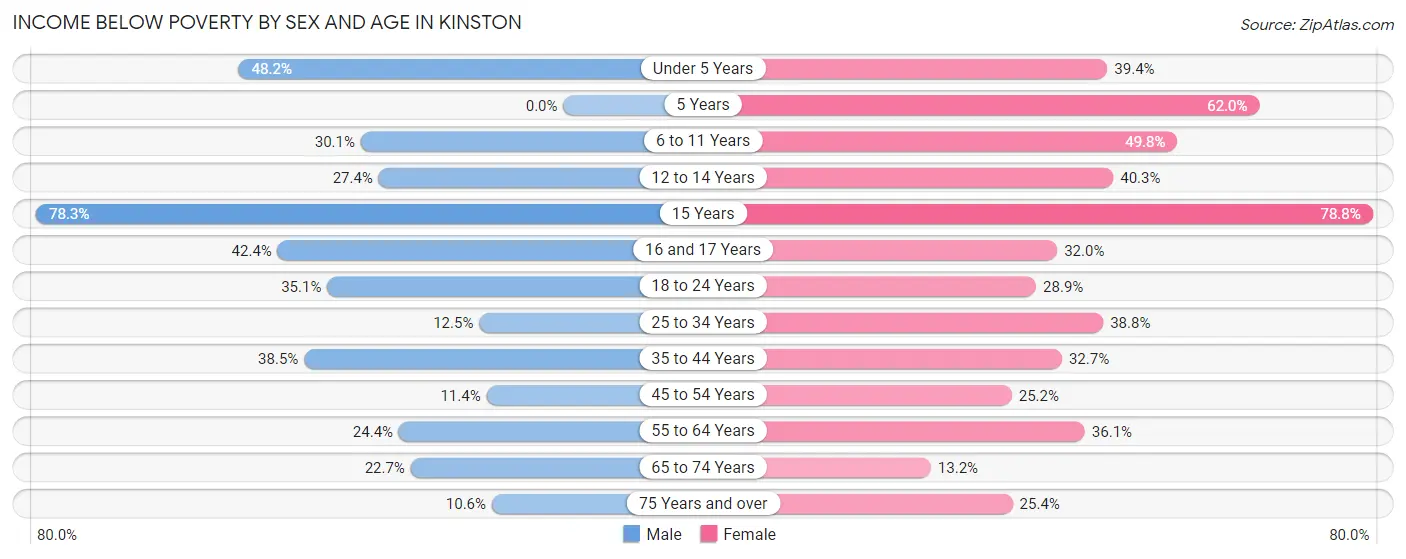
| Age Bracket | Male | Female |
| Under 5 Years | 202 (48.2%) | 254 (39.4%) |
| 5 Years | 0 (0.0%) | 106 (62.0%) |
| 6 to 11 Years | 191 (30.1%) | 272 (49.8%) |
| 12 to 14 Years | 116 (27.4%) | 127 (40.3%) |
| 15 Years | 83 (78.3%) | 119 (78.8%) |
| 16 and 17 Years | 112 (42.4%) | 95 (32.0%) |
| 18 to 24 Years | 230 (35.1%) | 241 (28.9%) |
| 25 to 34 Years | 123 (12.5%) | 290 (38.8%) |
| 35 to 44 Years | 301 (38.5%) | 399 (32.7%) |
| 45 to 54 Years | 110 (11.4%) | 313 (25.2%) |
| 55 to 64 Years | 284 (24.4%) | 492 (36.1%) |
| 65 to 74 Years | 233 (22.7%) | 203 (13.2%) |
| 75 Years and over | 85 (10.6%) | 363 (25.4%) |
| Total | 2,070 (24.5%) | 3,274 (31.2%) |
Income Above Poverty by Sex and Age in Kinston
According to the poverty statistics in Kinston, males aged 5 years and females aged 65 to 74 years are the age groups that are most secure financially, with 100.0% of males and 86.8% of females in these age groups living above the poverty line.
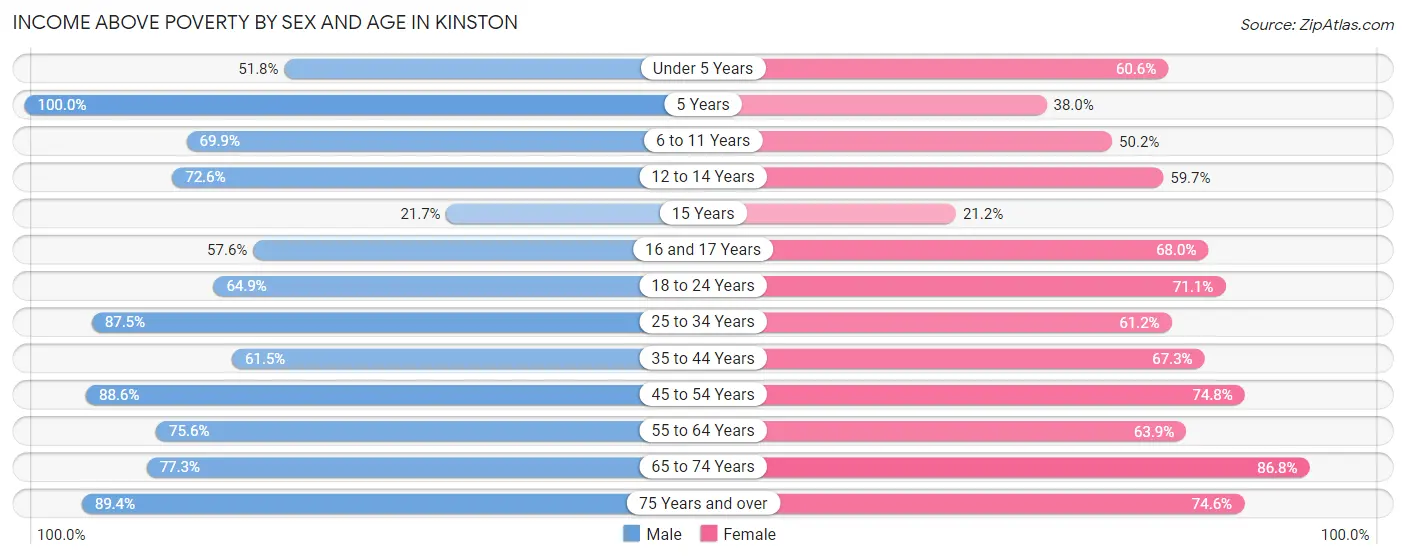
| Age Bracket | Male | Female |
| Under 5 Years | 217 (51.8%) | 390 (60.6%) |
| 5 Years | 207 (100.0%) | 65 (38.0%) |
| 6 to 11 Years | 444 (69.9%) | 274 (50.2%) |
| 12 to 14 Years | 307 (72.6%) | 188 (59.7%) |
| 15 Years | 23 (21.7%) | 32 (21.2%) |
| 16 and 17 Years | 152 (57.6%) | 202 (68.0%) |
| 18 to 24 Years | 426 (64.9%) | 594 (71.1%) |
| 25 to 34 Years | 862 (87.5%) | 457 (61.2%) |
| 35 to 44 Years | 481 (61.5%) | 821 (67.3%) |
| 45 to 54 Years | 854 (88.6%) | 927 (74.8%) |
| 55 to 64 Years | 879 (75.6%) | 871 (63.9%) |
| 65 to 74 Years | 795 (77.3%) | 1,331 (86.8%) |
| 75 Years and over | 715 (89.4%) | 1,068 (74.6%) |
| Total | 6,362 (75.4%) | 7,220 (68.8%) |
Income Below Poverty Among Married-Couple Families in Kinston
The poverty statistics for married-couple families in Kinston show that 6.7% or 125 of the total 1,863 families live below the poverty line. Families with no children have the highest poverty rate of 8.4%, comprising of 115 families. On the other hand, families with 3 or 4 children have the lowest poverty rate of 0.0%, which includes 0 families.
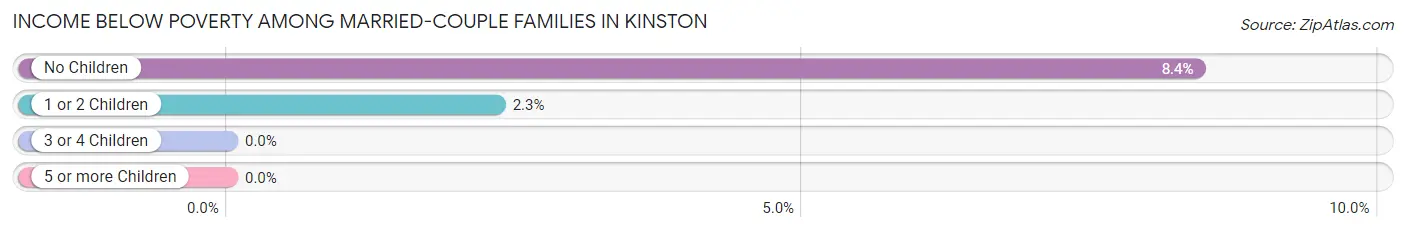
| Children | Above Poverty | Below Poverty |
| No Children | 1,251 (91.6%) | 115 (8.4%) |
| 1 or 2 Children | 419 (97.7%) | 10 (2.3%) |
| 3 or 4 Children | 45 (100.0%) | 0 (0.0%) |
| 5 or more Children | 23 (100.0%) | 0 (0.0%) |
| Total | 1,738 (93.3%) | 125 (6.7%) |
Income Below Poverty Among Single-Parent Households in Kinston
According to the poverty data in Kinston, 35.9% or 87 single-father households and 40.0% or 837 single-mother households are living below the poverty line. Among single-father households, those with 3 or 4 children have the highest poverty rate, with 51 households (100.0%) experiencing poverty. Likewise, among single-mother households, those with 3 or 4 children have the highest poverty rate, with 190 households (59.0%) falling below the poverty line.
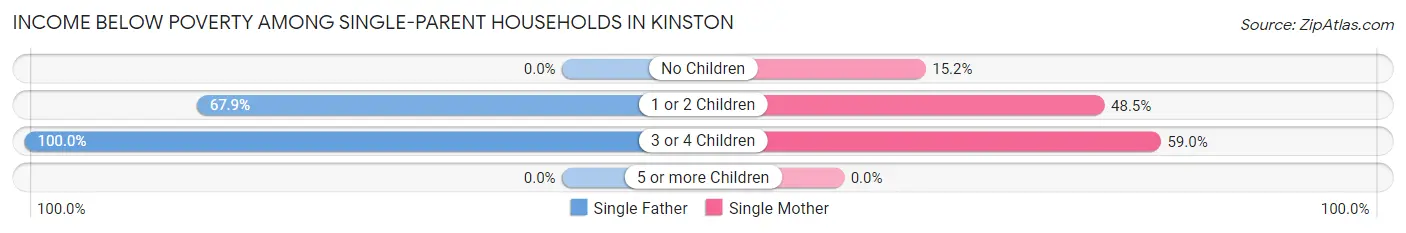
| Children | Single Father | Single Mother |
| No Children | 0 (0.0%) | 92 (15.2%) |
| 1 or 2 Children | 36 (67.9%) | 555 (48.5%) |
| 3 or 4 Children | 51 (100.0%) | 190 (59.0%) |
| 5 or more Children | 0 (0.0%) | 0 (0.0%) |
| Total | 87 (35.9%) | 837 (40.0%) |
Income Below Poverty Among Married-Couple vs Single-Parent Households in Kinston
The poverty data for Kinston shows that 125 of the married-couple family households (6.7%) and 924 of the single-parent households (39.6%) are living below the poverty level. Within the married-couple family households, those with no children have the highest poverty rate, with 115 households (8.4%) falling below the poverty line. Among the single-parent households, those with 3 or 4 children have the highest poverty rate, with 241 household (64.6%) living below poverty.
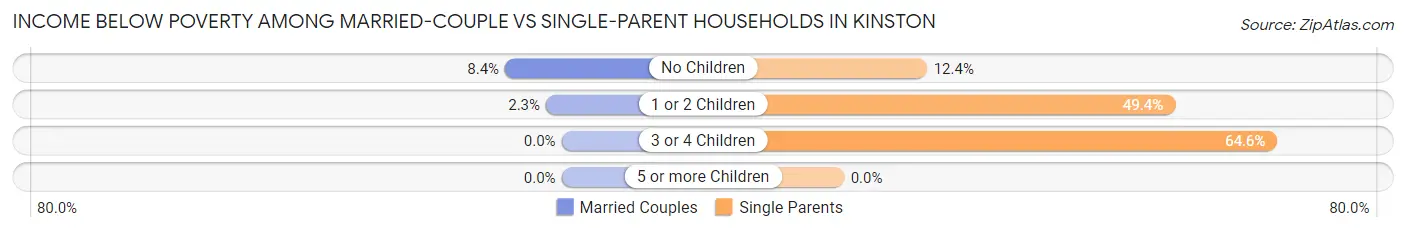
| Children | Married-Couple Families | Single-Parent Households |
| No Children | 115 (8.4%) | 92 (12.4%) |
| 1 or 2 Children | 10 (2.3%) | 591 (49.4%) |
| 3 or 4 Children | 0 (0.0%) | 241 (64.6%) |
| 5 or more Children | 0 (0.0%) | 0 (0.0%) |
| Total | 125 (6.7%) | 924 (39.6%) |
Race in Kinston
The most populous races in Kinston are Black / African American (13,626 | 69.2%), White / Caucasian (4,561 | 23.2%), and Two or more Races (996 | 5.1%).
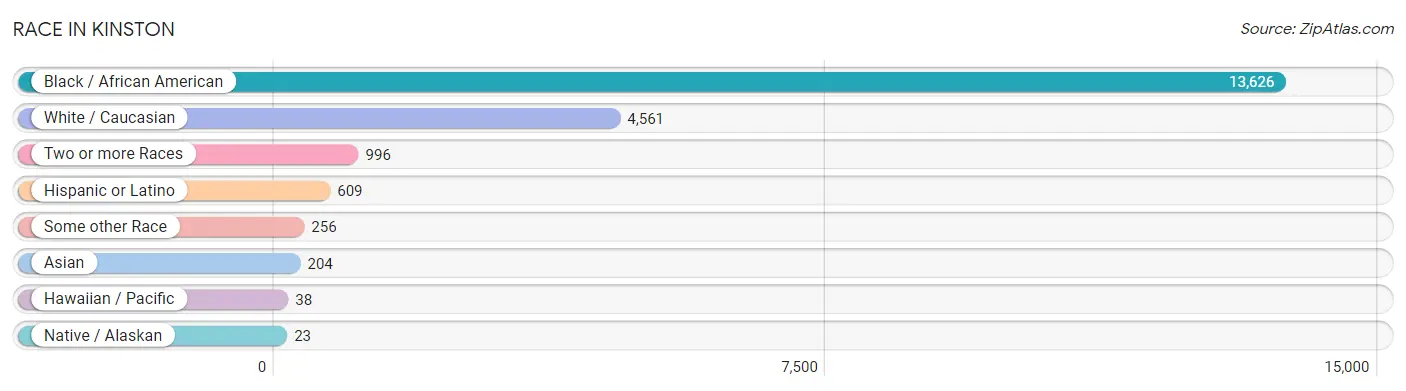
| Race | # Population | % Population |
| Asian | 204 | 1.0% |
| Black / African American | 13,626 | 69.2% |
| Hawaiian / Pacific | 38 | 0.2% |
| Hispanic or Latino | 609 | 3.1% |
| Native / Alaskan | 23 | 0.1% |
| White / Caucasian | 4,561 | 23.2% |
| Two or more Races | 996 | 5.1% |
| Some other Race | 256 | 1.3% |
| Total | 19,704 | 100.0% |
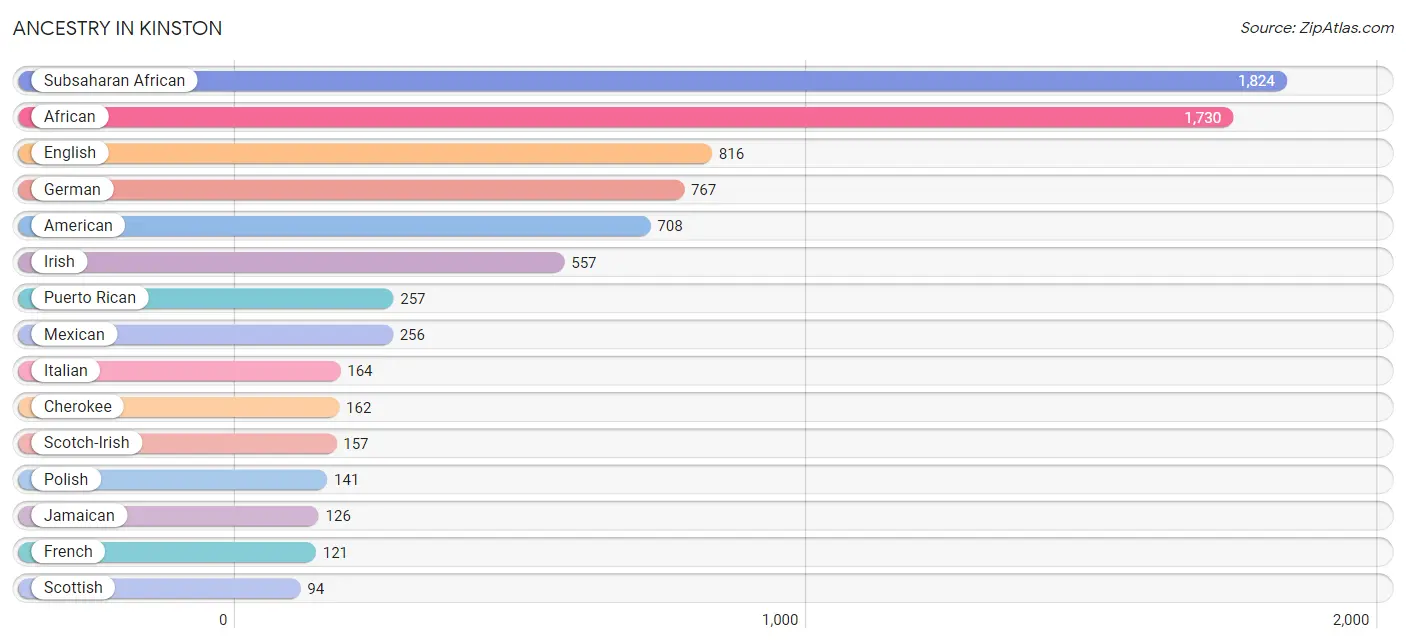
Ancestry in Kinston
The most populous ancestries reported in Kinston are Subsaharan African (1,824 | 9.3%), African (1,730 | 8.8%), English (816 | 4.1%), German (767 | 3.9%), and American (708 | 3.6%), together accounting for 29.7% of all Kinston residents.
| Ancestry | # Population | % Population |
| African | 1,730 | 8.8% |
| American | 708 | 3.6% |
| Bahamian | 66 | 0.3% |
| Barbadian | 50 | 0.3% |
| Bhutanese | 39 | 0.2% |
| Blackfeet | 17 | 0.1% |
| British | 8 | 0.0% |
| Central American | 65 | 0.3% |
| Cherokee | 162 | 0.8% |
| Chilean | 21 | 0.1% |
| Dutch | 22 | 0.1% |
| English | 816 | 4.1% |
| European | 38 | 0.2% |
| French | 121 | 0.6% |
| French Canadian | 51 | 0.3% |
| German | 767 | 3.9% |
| Greek | 17 | 0.1% |
| Guatemalan | 39 | 0.2% |
| Haitian | 42 | 0.2% |
| Hungarian | 75 | 0.4% |
| Indian (Asian) | 30 | 0.2% |
| Irish | 557 | 2.8% |
| Italian | 164 | 0.8% |
| Jamaican | 126 | 0.6% |
| Japanese | 59 | 0.3% |
| Korean | 11 | 0.1% |
| Lumbee | 32 | 0.2% |
| Mexican | 256 | 1.3% |
| Mongolian | 21 | 0.1% |
| Nigerian | 13 | 0.1% |
| Panamanian | 26 | 0.1% |
| Polish | 141 | 0.7% |
| Puerto Rican | 257 | 1.3% |
| Romanian | 43 | 0.2% |
| Russian | 3 | 0.0% |
| Scandinavian | 24 | 0.1% |
| Scotch-Irish | 157 | 0.8% |
| Scottish | 94 | 0.5% |
| Slovak | 15 | 0.1% |
| South American | 21 | 0.1% |
| Sri Lankan | 58 | 0.3% |
| Subsaharan African | 1,824 | 9.3% |
| Thai | 26 | 0.1% |
| Trinidadian and Tobagonian | 27 | 0.1% |
| Ugandan | 81 | 0.4% |
| Ukrainian | 64 | 0.3% |
| Welsh | 17 | 0.1% | View All 47 Rows |
Immigrants in Kinston
The most numerous immigrant groups reported in Kinston came from Europe (299 | 1.5%), Eastern Europe (246 | 1.3%), Latin America (207 | 1.1%), Central America (165 | 0.8%), and Asia (150 | 0.8%), together accounting for 5.4% of all Kinston residents.
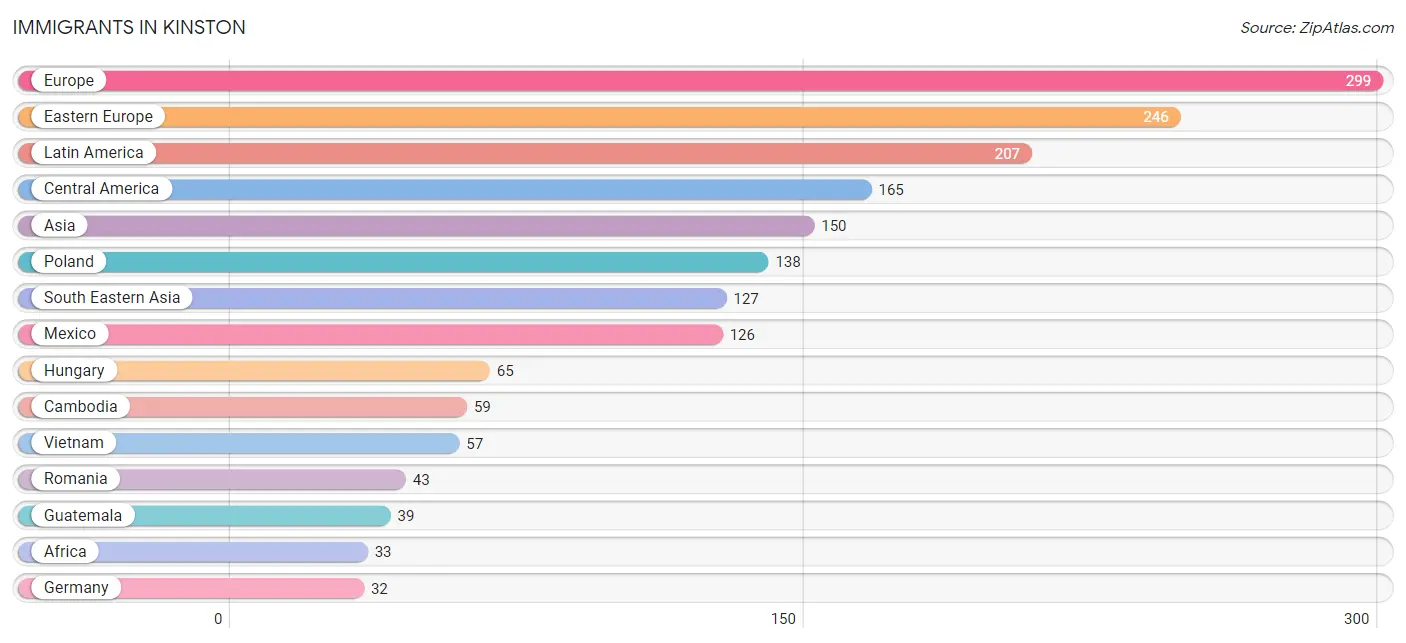
| Immigration Origin | # Population | % Population |
| Africa | 33 | 0.2% |
| Asia | 150 | 0.8% |
| Cambodia | 59 | 0.3% |
| Caribbean | 21 | 0.1% |
| Central America | 165 | 0.8% |
| Chile | 21 | 0.1% |
| China | 23 | 0.1% |
| Eastern Africa | 17 | 0.1% |
| Eastern Asia | 23 | 0.1% |
| Eastern Europe | 246 | 1.3% |
| Europe | 299 | 1.5% |
| Germany | 32 | 0.2% |
| Guatemala | 39 | 0.2% |
| Haiti | 13 | 0.1% |
| Hungary | 65 | 0.3% |
| Jamaica | 7 | 0.0% |
| Latin America | 207 | 1.1% |
| Mexico | 126 | 0.6% |
| Northern Europe | 21 | 0.1% |
| Philippines | 11 | 0.1% |
| Poland | 138 | 0.7% |
| Romania | 43 | 0.2% |
| South Africa | 8 | 0.0% |
| South America | 21 | 0.1% |
| South Eastern Asia | 127 | 0.6% |
| Trinidad and Tobago | 1 | 0.0% |
| Uganda | 17 | 0.1% |
| Vietnam | 57 | 0.3% |
| Western Europe | 32 | 0.2% | View All 29 Rows |
Sex and Age in Kinston
Sex and Age in Kinston
The most populous age groups in Kinston are 15 to 19 Years (697 | 7.8%) for men and 65 to 69 Years (905 | 8.4%) for women.
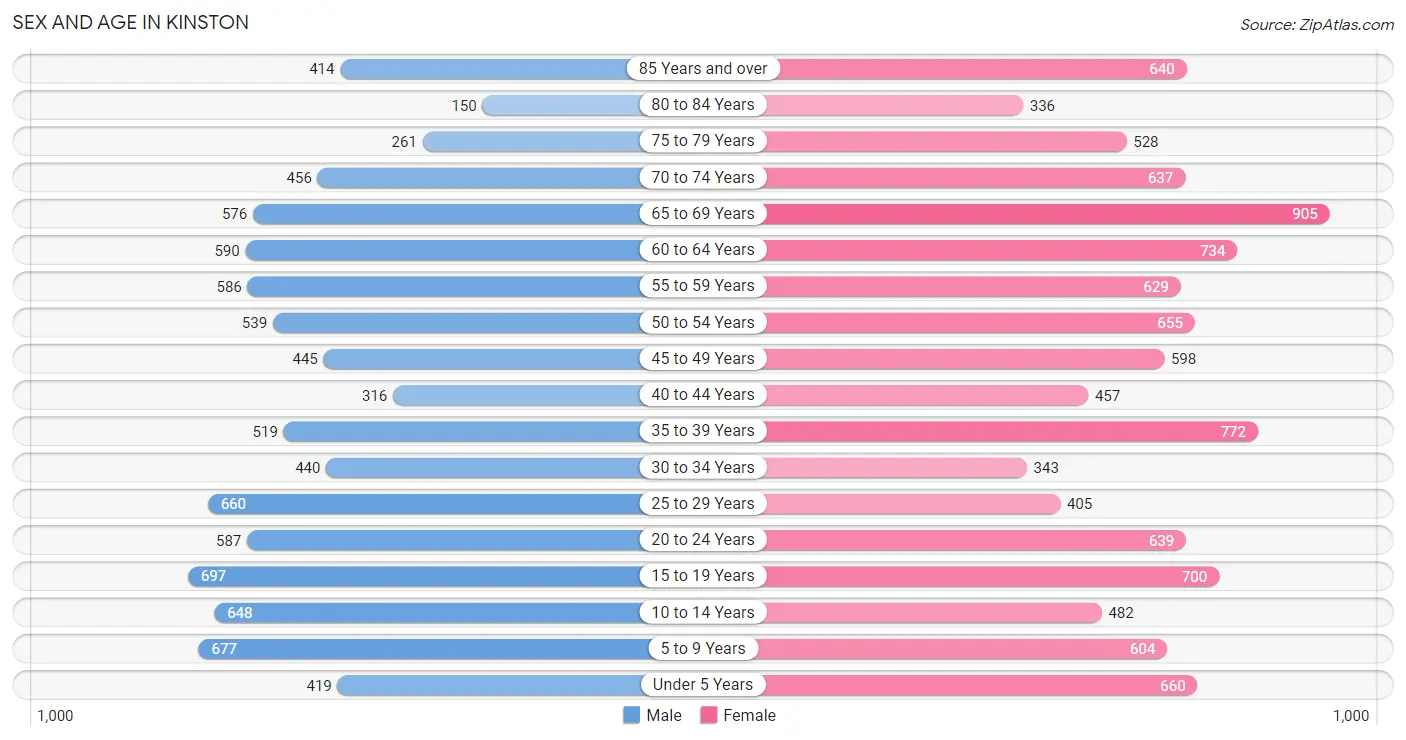
| Age Bracket | Male | Female |
| Under 5 Years | 419 (4.7%) | 660 (6.1%) |
| 5 to 9 Years | 677 (7.5%) | 604 (5.6%) |
| 10 to 14 Years | 648 (7.2%) | 482 (4.5%) |
| 15 to 19 Years | 697 (7.8%) | 700 (6.5%) |
| 20 to 24 Years | 587 (6.5%) | 639 (6.0%) |
| 25 to 29 Years | 660 (7.3%) | 405 (3.8%) |
| 30 to 34 Years | 440 (4.9%) | 343 (3.2%) |
| 35 to 39 Years | 519 (5.8%) | 772 (7.2%) |
| 40 to 44 Years | 316 (3.5%) | 457 (4.3%) |
| 45 to 49 Years | 445 (5.0%) | 598 (5.6%) |
| 50 to 54 Years | 539 (6.0%) | 655 (6.1%) |
| 55 to 59 Years | 586 (6.5%) | 629 (5.9%) |
| 60 to 64 Years | 590 (6.6%) | 734 (6.8%) |
| 65 to 69 Years | 576 (6.4%) | 905 (8.4%) |
| 70 to 74 Years | 456 (5.1%) | 637 (5.9%) |
| 75 to 79 Years | 261 (2.9%) | 528 (4.9%) |
| 80 to 84 Years | 150 (1.7%) | 336 (3.1%) |
| 85 Years and over | 414 (4.6%) | 640 (6.0%) |
| Total | 8,980 (100.0%) | 10,724 (100.0%) |
Families and Households in Kinston
Median Family Size in Kinston
The median family size in Kinston is 3.10 persons per family, with married-couple families (1,863 | 44.4%) accounting for the largest median family size of 3.19 persons per family. On the other hand, single male/father families (242 | 5.8%) represent the smallest median family size with 2.57 persons per family.
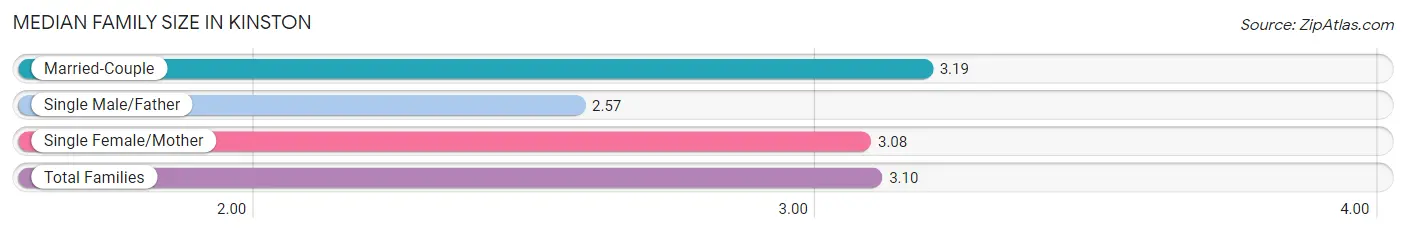
| Family Type | # Families | Family Size |
| Married-Couple | 1,863 (44.4%) | 3.19 |
| Single Male/Father | 242 (5.8%) | 2.57 |
| Single Female/Mother | 2,092 (49.8%) | 3.08 |
| Total Families | 4,197 (100.0%) | 3.10 |
Median Household Size in Kinston
The median household size in Kinston is 2.16 persons per household, with single female/mother households (2,092 | 24.0%) accounting for the largest median household size of 3.21 persons per household. non-family households (4,514 | 51.8%) represent the smallest median household size with 1.22 persons per household.
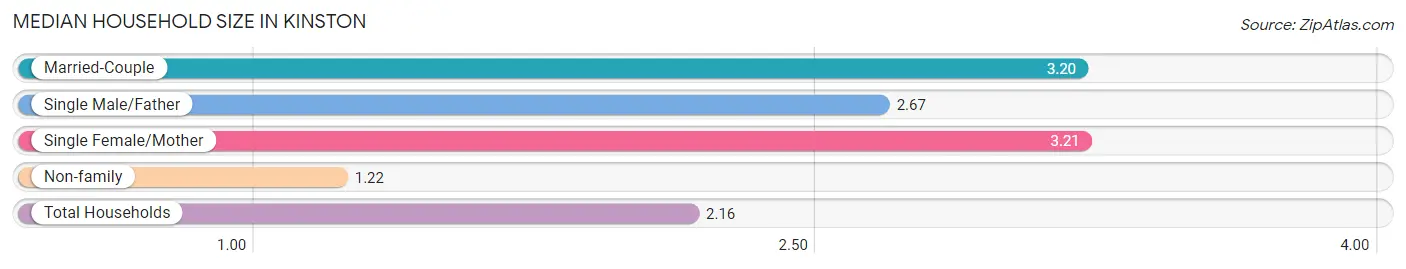
| Household Type | # Households | Household Size |
| Married-Couple | 1,863 (21.4%) | 3.20 |
| Single Male/Father | 242 (2.8%) | 2.67 |
| Single Female/Mother | 2,092 (24.0%) | 3.21 |
| Non-family | 4,514 (51.8%) | 1.22 |
| Total Households | 8,711 (100.0%) | 2.16 |
Household Size by Marriage Status in Kinston
Out of a total of 8,711 households in Kinston, 4,197 (48.2%) are family households, while 4,514 (51.8%) are nonfamily households. The most numerous type of family households are 2-person households, comprising 2,065, and the most common type of nonfamily households are 1-person households, comprising 3,967.
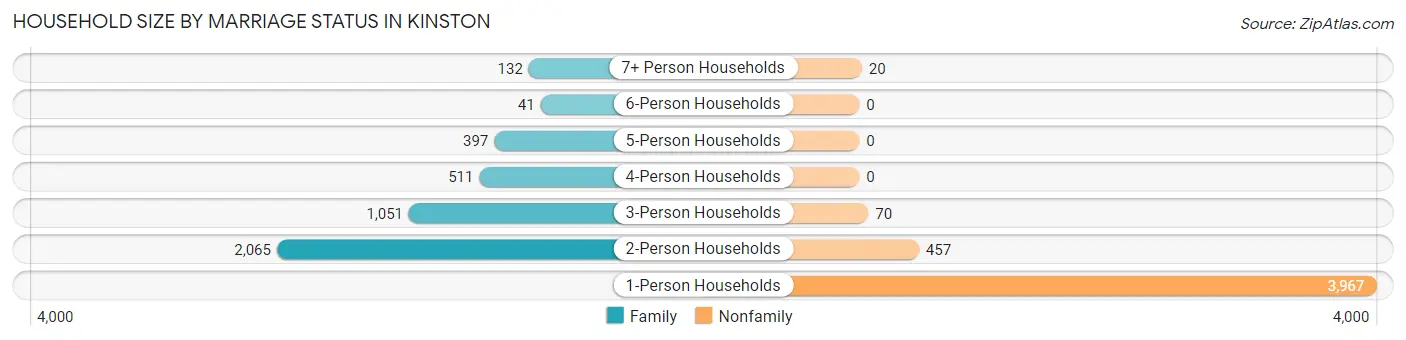
| Household Size | Family Households | Nonfamily Households |
| 1-Person Households | - | 3,967 (45.5%) |
| 2-Person Households | 2,065 (23.7%) | 457 (5.2%) |
| 3-Person Households | 1,051 (12.1%) | 70 (0.8%) |
| 4-Person Households | 511 (5.9%) | 0 (0.0%) |
| 5-Person Households | 397 (4.6%) | 0 (0.0%) |
| 6-Person Households | 41 (0.5%) | 0 (0.0%) |
| 7+ Person Households | 132 (1.5%) | 20 (0.2%) |
| Total | 4,197 (48.2%) | 4,514 (51.8%) |
Female Fertility in Kinston
Fertility by Age in Kinston
Average fertility rate in Kinston is 116.0 births per 1,000 women. Women in the age bracket of 20 to 34 years have the highest fertility rate with 301.0 births per 1,000 women. Women in the age bracket of 20 to 34 years acount for 87.4% of all women with births.
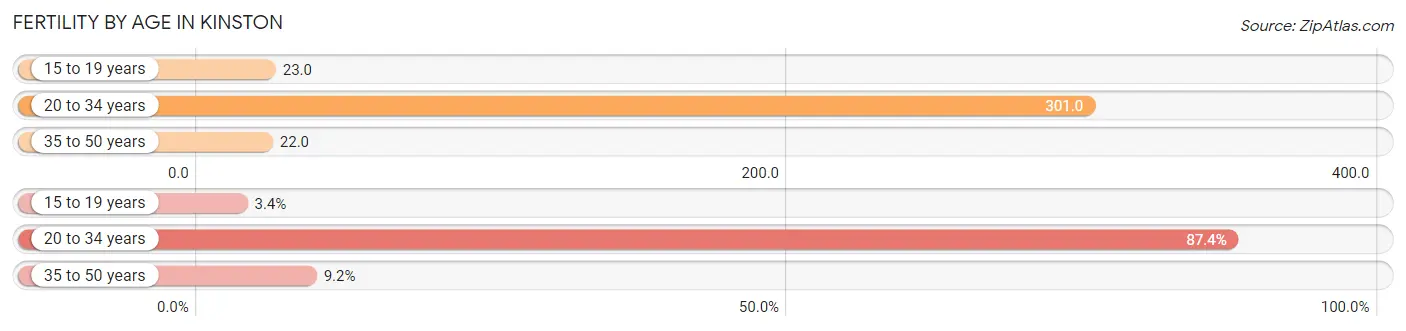
| Age Bracket | Women with Births | Births / 1,000 Women |
| 15 to 19 years | 16 (3.4%) | 23.0 |
| 20 to 34 years | 417 (87.4%) | 301.0 |
| 35 to 50 years | 44 (9.2%) | 22.0 |
| Total | 477 (100.0%) | 116.0 |
Fertility by Age by Marriage Status in Kinston
15.7% of women with births (477) in Kinston are married. The highest percentage of unmarried women with births falls into 15 to 19 years age bracket with 100.0% of them unmarried at the time of birth, while the lowest percentage of unmarried women with births belong to 35 to 50 years age bracket with 0.0% of them unmarried.
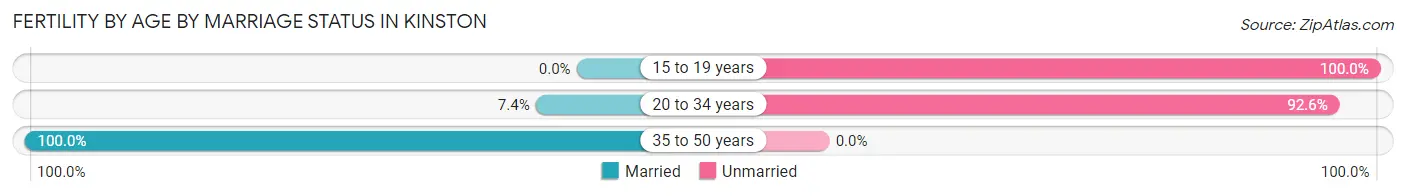
| Age Bracket | Married | Unmarried |
| 15 to 19 years | 0 (0.0%) | 16 (100.0%) |
| 20 to 34 years | 31 (7.4%) | 386 (92.6%) |
| 35 to 50 years | 44 (100.0%) | 0 (0.0%) |
| Total | 75 (15.7%) | 402 (84.3%) |
Fertility by Education in Kinston
Average fertility rate in Kinston is 116.0 births per 1,000 women. Women with the education attainment of high school diploma have the highest fertility rate of 159.0 births per 1,000 women, while women with the education attainment of less than high school have the lowest fertility at 40.0 births per 1,000 women. Women with the education attainment of high school diploma represent 44.0% of all women with births.
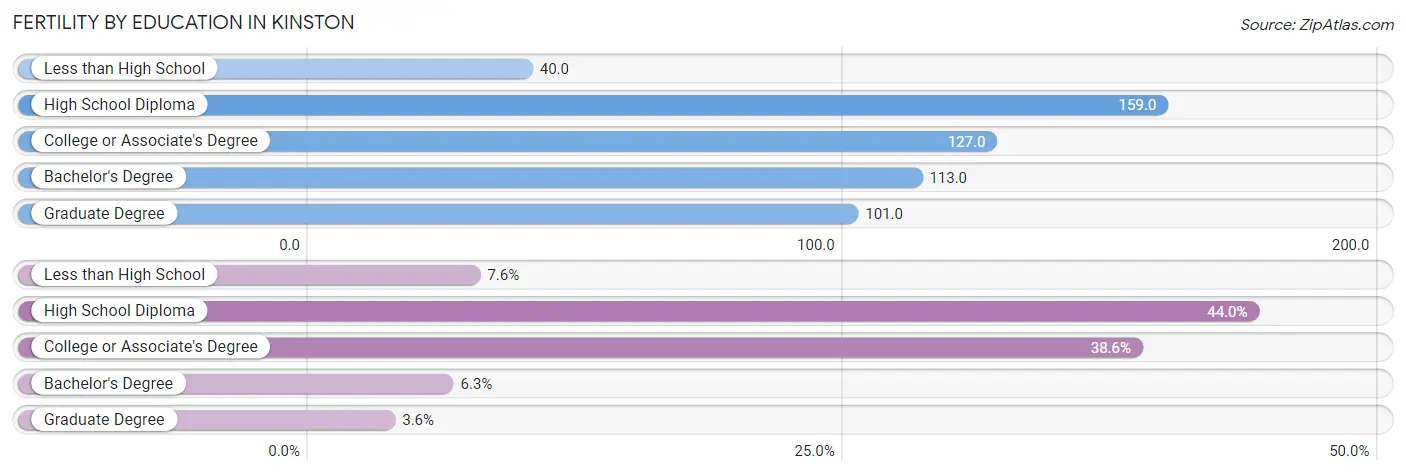
| Educational Attainment | Women with Births | Births / 1,000 Women |
| Less than High School | 36 (7.5%) | 40.0 |
| High School Diploma | 210 (44.0%) | 159.0 |
| College or Associate's Degree | 184 (38.6%) | 127.0 |
| Bachelor's Degree | 30 (6.3%) | 113.0 |
| Graduate Degree | 17 (3.6%) | 101.0 |
| Total | 477 (100.0%) | 116.0 |
Fertility by Education by Marriage Status in Kinston
84.3% of women with births in Kinston are unmarried. Women with the educational attainment of graduate degree are most likely to be married with 100.0% of them married at childbirth, while women with the educational attainment of less than high school are least likely to be married with 100.0% of them unmarried at childbirth.
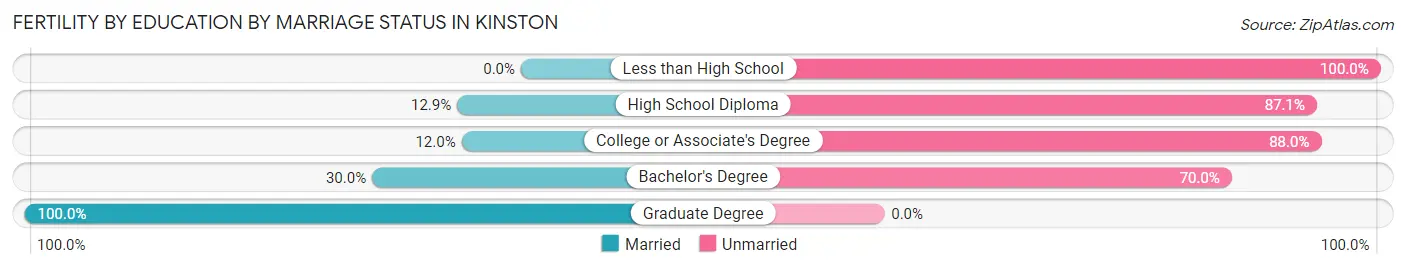
| Educational Attainment | Married | Unmarried |
| Less than High School | 0 (0.0%) | 36 (100.0%) |
| High School Diploma | 27 (12.9%) | 183 (87.1%) |
| College or Associate's Degree | 22 (12.0%) | 162 (88.0%) |
| Bachelor's Degree | 9 (30.0%) | 21 (70.0%) |
| Graduate Degree | 17 (100.0%) | 0 (0.0%) |
| Total | 75 (15.7%) | 402 (84.3%) |
Employment Characteristics in Kinston
Employment by Class of Employer in Kinston
Among the 6,304 employed individuals in Kinston, private company employees (4,187 | 66.4%), local government employees (591 | 9.4%), and state government employees (572 | 9.1%) make up the most common classes of employment.
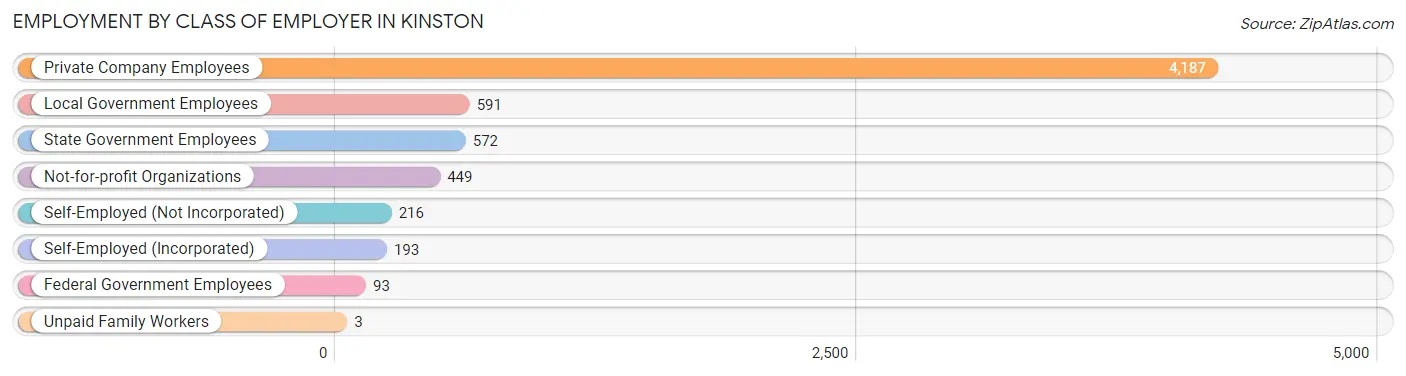
| Employer Class | # Employees | % Employees |
| Private Company Employees | 4,187 | 66.4% |
| Self-Employed (Incorporated) | 193 | 3.1% |
| Self-Employed (Not Incorporated) | 216 | 3.4% |
| Not-for-profit Organizations | 449 | 7.1% |
| Local Government Employees | 591 | 9.4% |
| State Government Employees | 572 | 9.1% |
| Federal Government Employees | 93 | 1.5% |
| Unpaid Family Workers | 3 | 0.1% |
| Total | 6,304 | 100.0% |
Employment Status by Age in Kinston
According to the labor force statistics for Kinston, out of the total population over 16 years of age (15,936), 49.0% or 7,809 individuals are in the labor force, with 13.6% or 1,062 of them unemployed. The age group with the highest labor force participation rate is 30 to 34 years, with 88.4% or 692 individuals in the labor force. Within the labor force, the 16 to 19 years age range has the highest percentage of unemployed individuals, with 33.5% or 144 of them being unemployed.
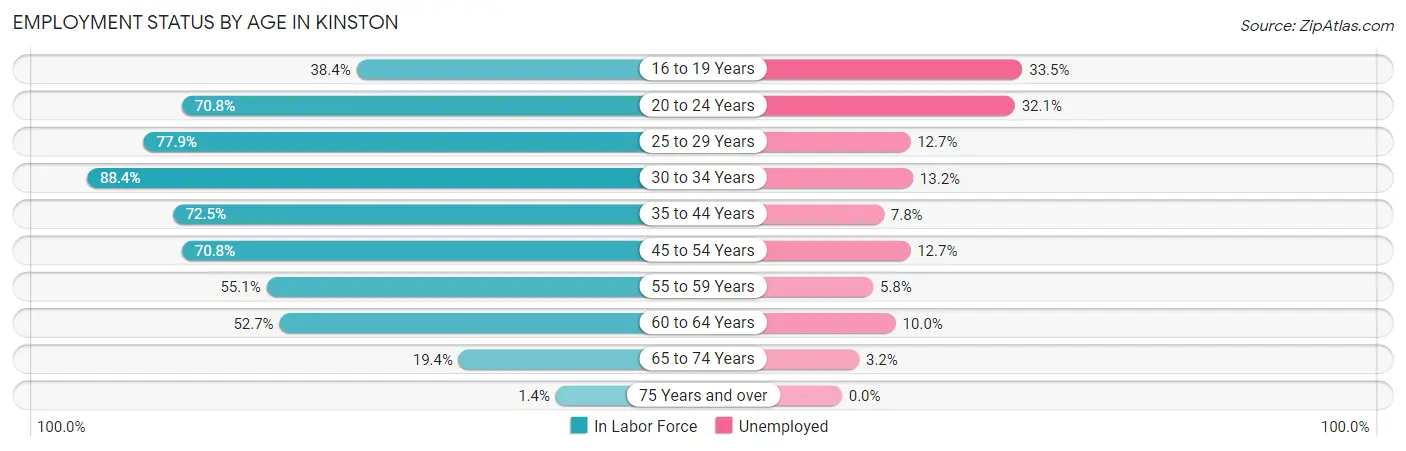
| Age Bracket | In Labor Force | Unemployed |
| 16 to 19 Years | 430 (38.4%) | 144 (33.5%) |
| 20 to 24 Years | 868 (70.8%) | 279 (32.1%) |
| 25 to 29 Years | 830 (77.9%) | 105 (12.7%) |
| 30 to 34 Years | 692 (88.4%) | 91 (13.2%) |
| 35 to 44 Years | 1,496 (72.5%) | 117 (7.8%) |
| 45 to 54 Years | 1,584 (70.8%) | 201 (12.7%) |
| 55 to 59 Years | 669 (55.1%) | 39 (5.8%) |
| 60 to 64 Years | 698 (52.7%) | 70 (10.0%) |
| 65 to 74 Years | 499 (19.4%) | 16 (3.2%) |
| 75 Years and over | 33 (1.4%) | 0 (0.0%) |
| Total | 7,809 (49.0%) | 1,062 (13.6%) |
Employment Status by Educational Attainment in Kinston
According to labor force statistics for Kinston, 68.7% of individuals (5,969) out of the total population between 25 and 64 years of age (8,688) are in the labor force, with 10.4% or 621 of them being unemployed. The group with the highest labor force participation rate are those with the educational attainment of bachelor's degree or higher, with 79.8% or 892 individuals in the labor force. Within the labor force, individuals with less than high school education have the highest percentage of unemployment, with 30.8% or 160 of them being unemployed.
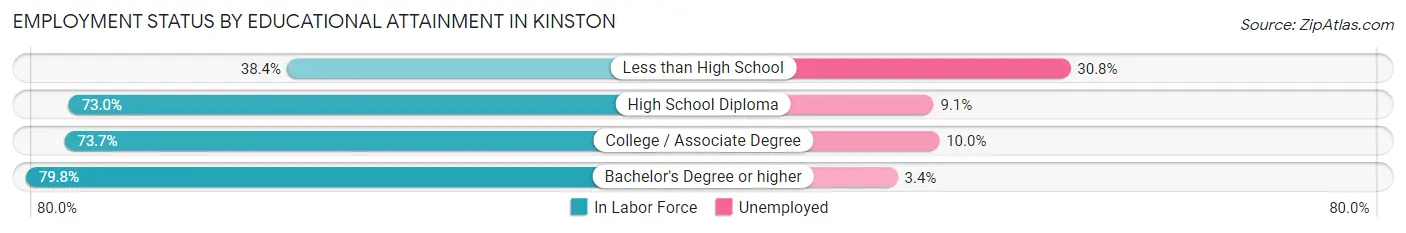
| Educational Attainment | In Labor Force | Unemployed |
| Less than High School | 519 (38.4%) | 416 (30.8%) |
| High School Diploma | 2,385 (73.0%) | 297 (9.1%) |
| College / Associate Degree | 2,176 (73.7%) | 295 (10.0%) |
| Bachelor's Degree or higher | 892 (79.8%) | 38 (3.4%) |
| Total | 5,969 (68.7%) | 904 (10.4%) |
Employment Occupations by Sex in Kinston
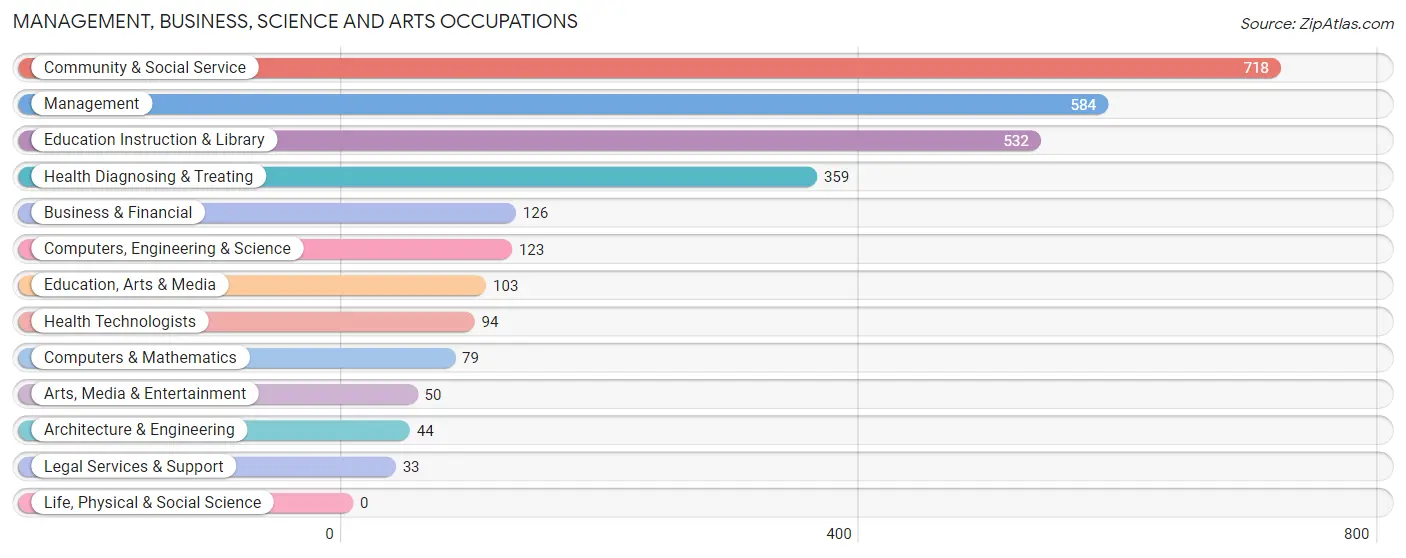
Management, Business, Science and Arts Occupations
The most common Management, Business, Science and Arts occupations in Kinston are Community & Social Service (718 | 10.6%), Management (584 | 8.7%), Education Instruction & Library (532 | 7.9%), Health Diagnosing & Treating (359 | 5.3%), and Business & Financial (126 | 1.9%).
Management, Business, Science and Arts Occupations by Sex
Within the Management, Business, Science and Arts occupations in Kinston, the most male-oriented occupations are Architecture & Engineering (97.7%), Management (66.9%), and Business & Financial (61.1%), while the most female-oriented occupations are Arts, Media & Entertainment (100.0%), Health Diagnosing & Treating (83.8%), and Legal Services & Support (78.8%).
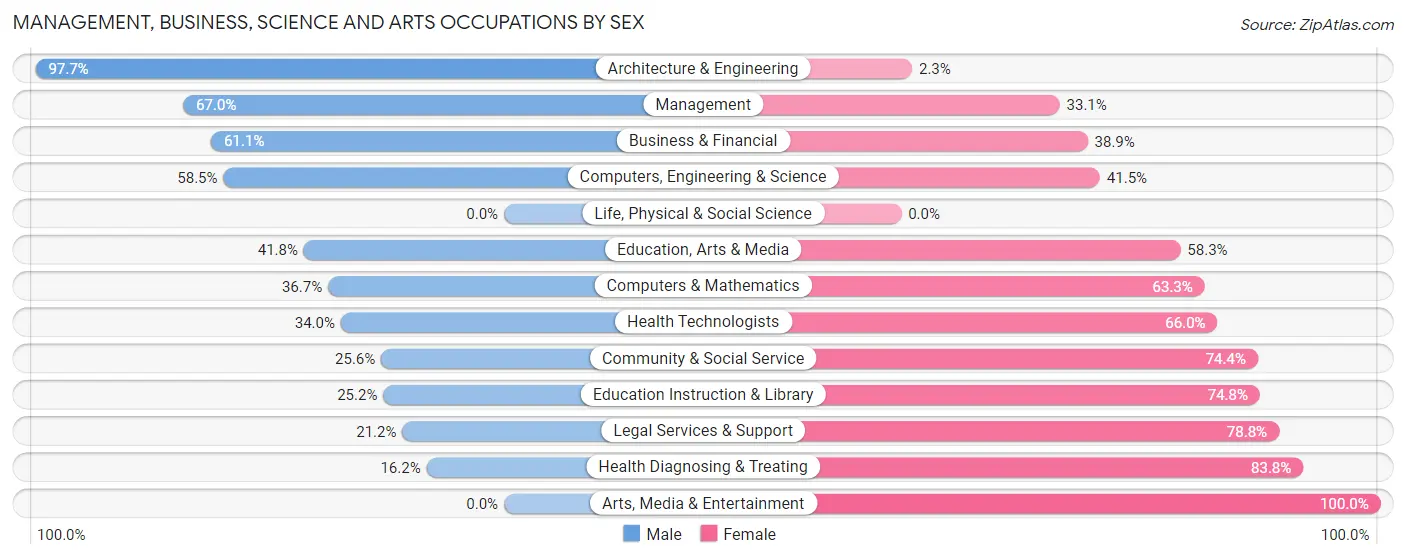
| Occupation | Male | Female |
| Management | 391 (66.9%) | 193 (33.1%) |
| Business & Financial | 77 (61.1%) | 49 (38.9%) |
| Computers, Engineering & Science | 72 (58.5%) | 51 (41.5%) |
| Computers & Mathematics | 29 (36.7%) | 50 (63.3%) |
| Architecture & Engineering | 43 (97.7%) | 1 (2.3%) |
| Life, Physical & Social Science | 0 (0.0%) | 0 (0.0%) |
| Community & Social Service | 184 (25.6%) | 534 (74.4%) |
| Education, Arts & Media | 43 (41.7%) | 60 (58.3%) |
| Legal Services & Support | 7 (21.2%) | 26 (78.8%) |
| Education Instruction & Library | 134 (25.2%) | 398 (74.8%) |
| Arts, Media & Entertainment | 0 (0.0%) | 50 (100.0%) |
| Health Diagnosing & Treating | 58 (16.2%) | 301 (83.8%) |
| Health Technologists | 32 (34.0%) | 62 (66.0%) |
| Total (Category) | 782 (40.9%) | 1,128 (59.1%) |
| Total (Overall) | 3,164 (46.9%) | 3,575 (53.0%) |
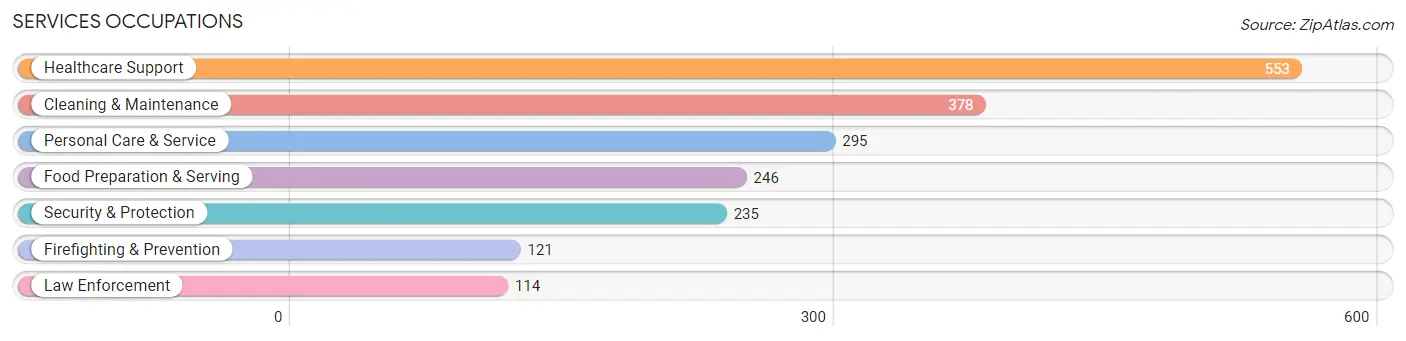
Services Occupations
The most common Services occupations in Kinston are Healthcare Support (553 | 8.2%), Cleaning & Maintenance (378 | 5.6%), Personal Care & Service (295 | 4.4%), Food Preparation & Serving (246 | 3.6%), and Security & Protection (235 | 3.5%).
Services Occupations by Sex
Within the Services occupations in Kinston, the most male-oriented occupations are Law Enforcement (93.9%), Security & Protection (74.5%), and Firefighting & Prevention (56.2%), while the most female-oriented occupations are Personal Care & Service (90.5%), Healthcare Support (83.9%), and Food Preparation & Serving (76.4%).
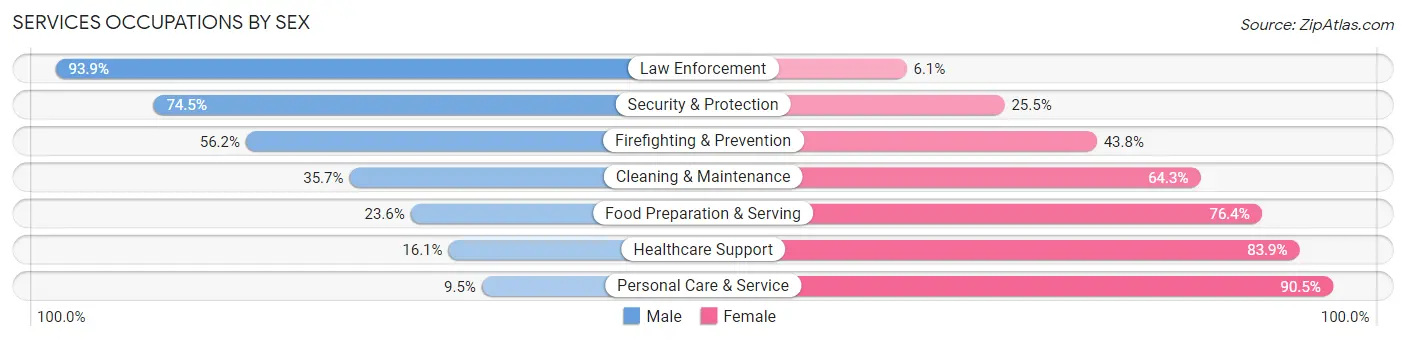
| Occupation | Male | Female |
| Healthcare Support | 89 (16.1%) | 464 (83.9%) |
| Security & Protection | 175 (74.5%) | 60 (25.5%) |
| Firefighting & Prevention | 68 (56.2%) | 53 (43.8%) |
| Law Enforcement | 107 (93.9%) | 7 (6.1%) |
| Food Preparation & Serving | 58 (23.6%) | 188 (76.4%) |
| Cleaning & Maintenance | 135 (35.7%) | 243 (64.3%) |
| Personal Care & Service | 28 (9.5%) | 267 (90.5%) |
| Total (Category) | 485 (28.4%) | 1,222 (71.6%) |
| Total (Overall) | 3,164 (46.9%) | 3,575 (53.0%) |
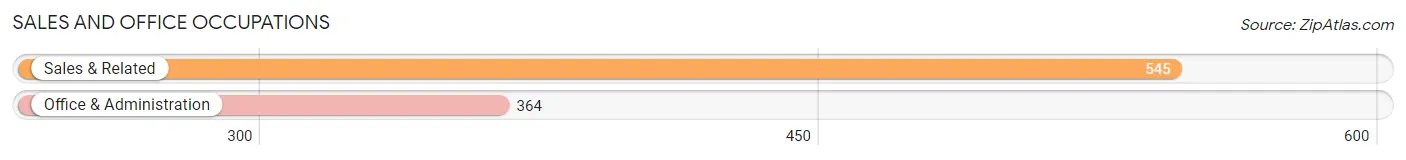
Sales and Office Occupations
The most common Sales and Office occupations in Kinston are Sales & Related (545 | 8.1%), and Office & Administration (364 | 5.4%).
Sales and Office Occupations by Sex
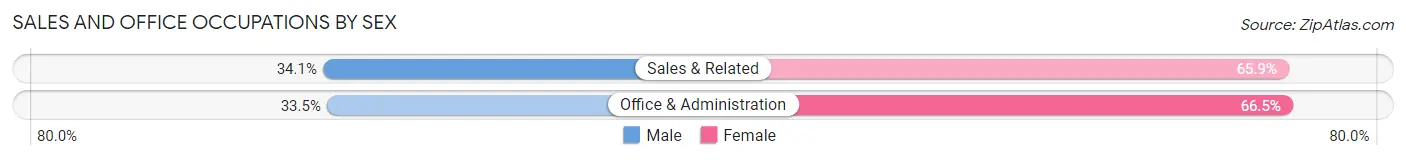
| Occupation | Male | Female |
| Sales & Related | 186 (34.1%) | 359 (65.9%) |
| Office & Administration | 122 (33.5%) | 242 (66.5%) |
| Total (Category) | 308 (33.9%) | 601 (66.1%) |
| Total (Overall) | 3,164 (46.9%) | 3,575 (53.0%) |
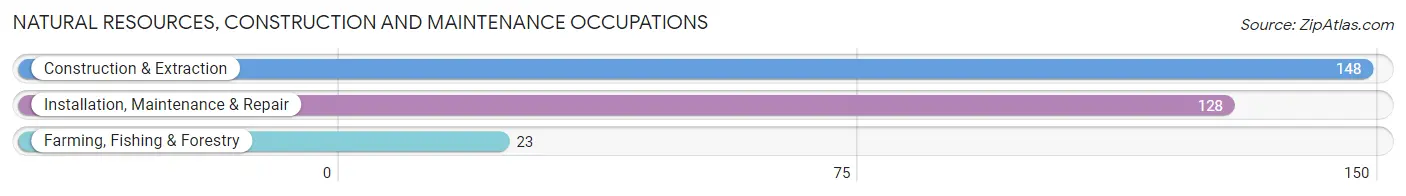
Natural Resources, Construction and Maintenance Occupations
The most common Natural Resources, Construction and Maintenance occupations in Kinston are Construction & Extraction (148 | 2.2%), Installation, Maintenance & Repair (128 | 1.9%), and Farming, Fishing & Forestry (23 | 0.3%).
Natural Resources, Construction and Maintenance Occupations by Sex
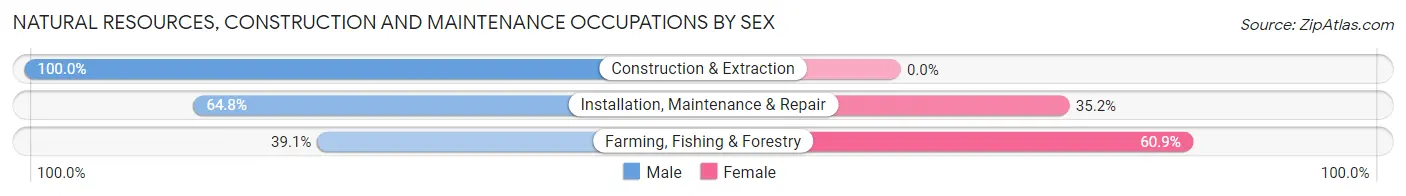
| Occupation | Male | Female |
| Farming, Fishing & Forestry | 9 (39.1%) | 14 (60.9%) |
| Construction & Extraction | 148 (100.0%) | 0 (0.0%) |
| Installation, Maintenance & Repair | 83 (64.8%) | 45 (35.2%) |
| Total (Category) | 240 (80.3%) | 59 (19.7%) |
| Total (Overall) | 3,164 (46.9%) | 3,575 (53.0%) |
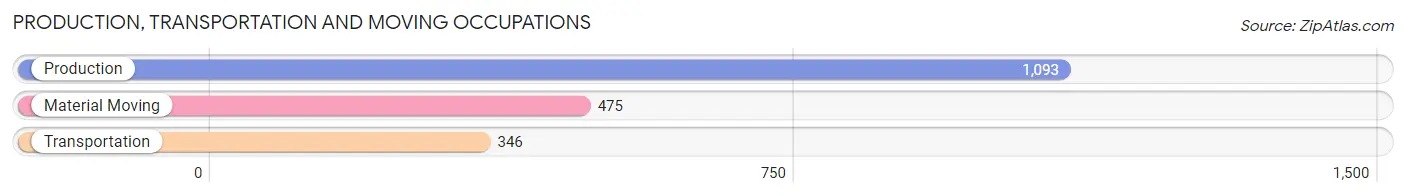
Production, Transportation and Moving Occupations
The most common Production, Transportation and Moving occupations in Kinston are Production (1,093 | 16.2%), Material Moving (475 | 7.0%), and Transportation (346 | 5.1%).
Production, Transportation and Moving Occupations by Sex
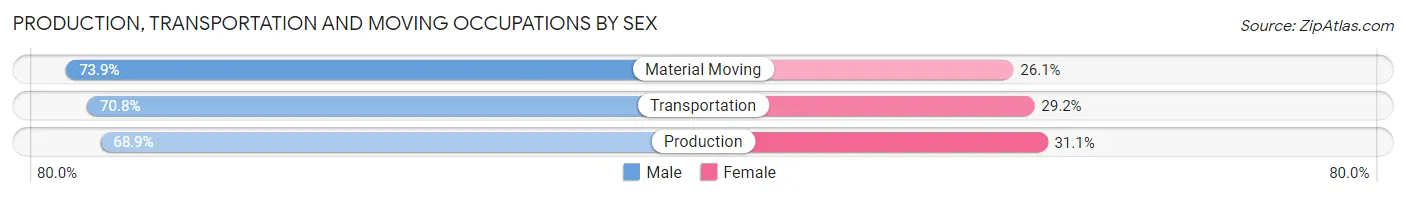
| Occupation | Male | Female |
| Production | 753 (68.9%) | 340 (31.1%) |
| Transportation | 245 (70.8%) | 101 (29.2%) |
| Material Moving | 351 (73.9%) | 124 (26.1%) |
| Total (Category) | 1,349 (70.5%) | 565 (29.5%) |
| Total (Overall) | 3,164 (46.9%) | 3,575 (53.0%) |
Employment Industries by Sex in Kinston
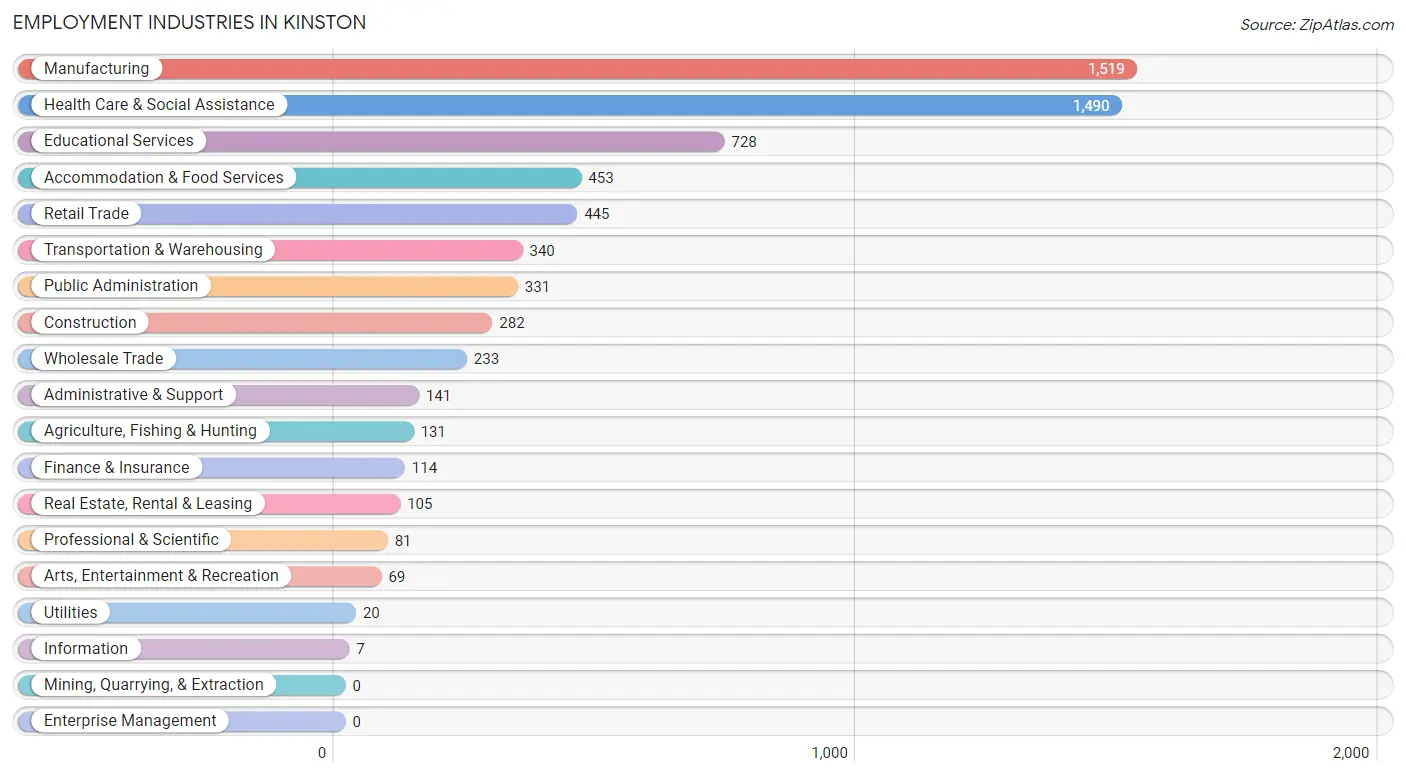
Employment Industries in Kinston
The major employment industries in Kinston include Manufacturing (1,519 | 22.5%), Health Care & Social Assistance (1,490 | 22.1%), Educational Services (728 | 10.8%), Accommodation & Food Services (453 | 6.7%), and Retail Trade (445 | 6.6%).
Employment Industries by Sex in Kinston
The Kinston industries that see more men than women are Construction (100.0%), Information (100.0%), and Arts, Entertainment & Recreation (92.7%), whereas the industries that tend to have a higher number of women are Professional & Scientific (95.1%), Health Care & Social Assistance (81.3%), and Accommodation & Food Services (79.2%).
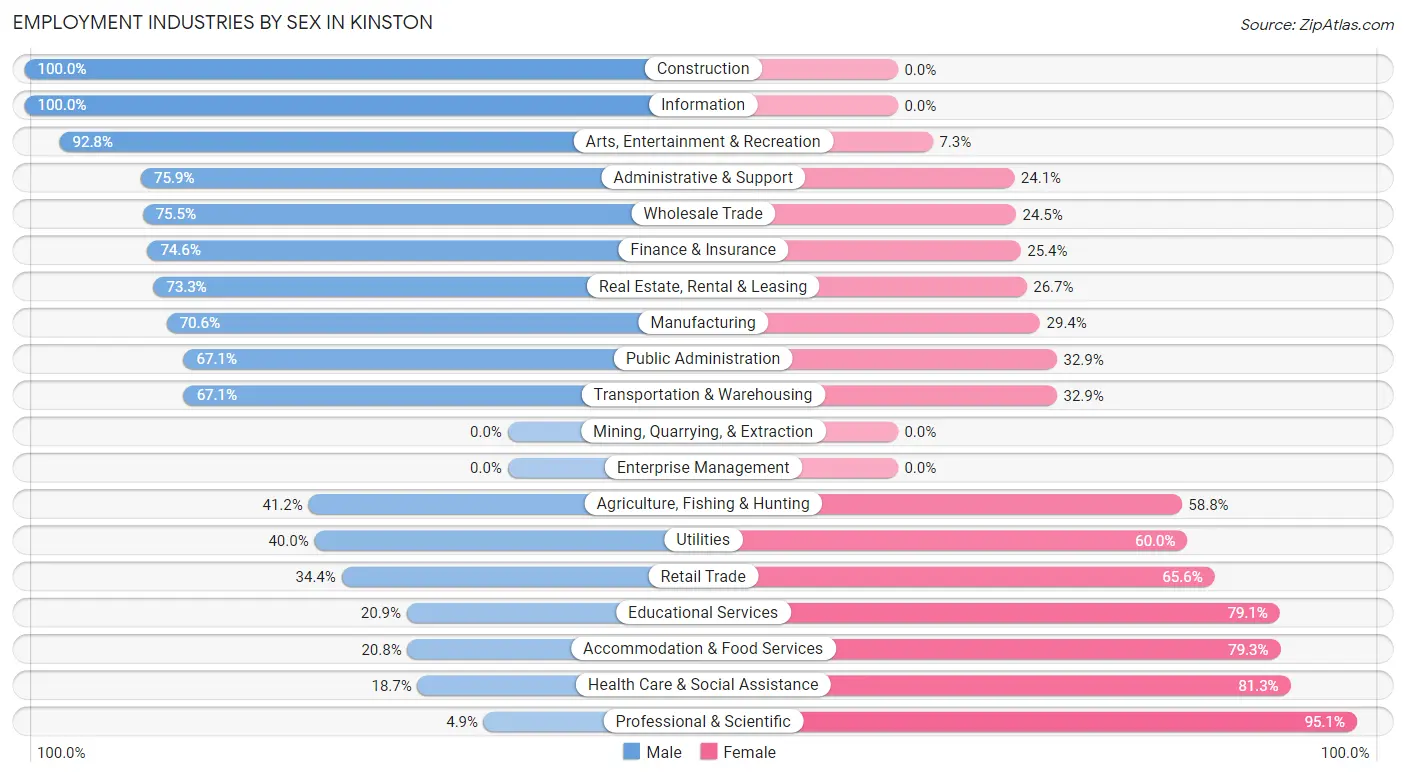
| Industry | Male | Female |
| Agriculture, Fishing & Hunting | 54 (41.2%) | 77 (58.8%) |
| Mining, Quarrying, & Extraction | 0 (0.0%) | 0 (0.0%) |
| Construction | 282 (100.0%) | 0 (0.0%) |
| Manufacturing | 1,072 (70.6%) | 447 (29.4%) |
| Wholesale Trade | 176 (75.5%) | 57 (24.5%) |
| Retail Trade | 153 (34.4%) | 292 (65.6%) |
| Transportation & Warehousing | 228 (67.1%) | 112 (32.9%) |
| Utilities | 8 (40.0%) | 12 (60.0%) |
| Information | 7 (100.0%) | 0 (0.0%) |
| Finance & Insurance | 85 (74.6%) | 29 (25.4%) |
| Real Estate, Rental & Leasing | 77 (73.3%) | 28 (26.7%) |
| Professional & Scientific | 4 (4.9%) | 77 (95.1%) |
| Enterprise Management | 0 (0.0%) | 0 (0.0%) |
| Administrative & Support | 107 (75.9%) | 34 (24.1%) |
| Educational Services | 152 (20.9%) | 576 (79.1%) |
| Health Care & Social Assistance | 278 (18.7%) | 1,212 (81.3%) |
| Arts, Entertainment & Recreation | 64 (92.7%) | 5 (7.2%) |
| Accommodation & Food Services | 94 (20.7%) | 359 (79.2%) |
| Public Administration | 222 (67.1%) | 109 (32.9%) |
| Total | 3,164 (46.9%) | 3,575 (53.0%) |
Education in Kinston
School Enrollment in Kinston
The most common levels of schooling among the 4,476 students in Kinston are high school (1,242 | 27.8%), elementary school (976 | 21.8%), and middle school (912 | 20.4%).
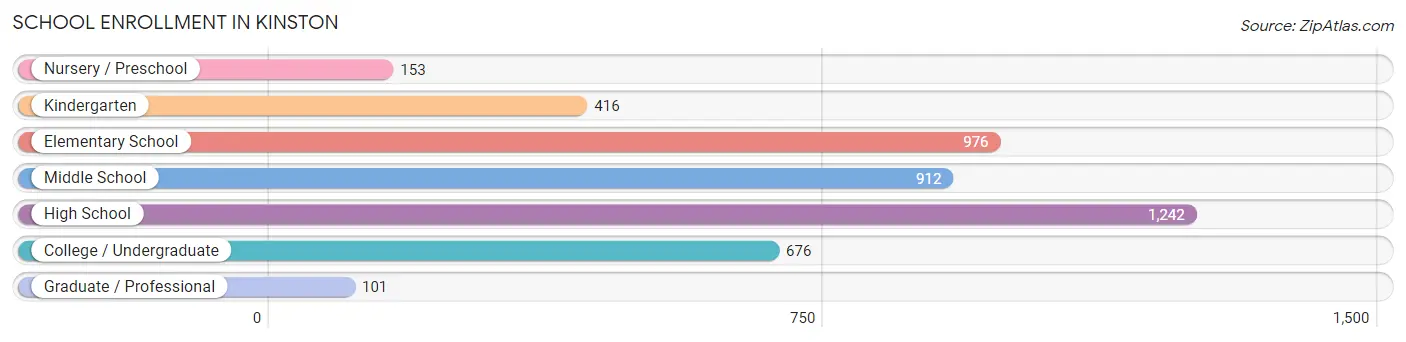
| School Level | # Students | % Students |
| Nursery / Preschool | 153 | 3.4% |
| Kindergarten | 416 | 9.3% |
| Elementary School | 976 | 21.8% |
| Middle School | 912 | 20.4% |
| High School | 1,242 | 27.8% |
| College / Undergraduate | 676 | 15.1% |
| Graduate / Professional | 101 | 2.3% |
| Total | 4,476 | 100.0% |
School Enrollment by Age by Funding Source in Kinston
Out of a total of 4,476 students who are enrolled in schools in Kinston, 452 (10.1%) attend a private institution, while the remaining 4,024 (89.9%) are enrolled in public schools. The age group of 20 to 24 year olds has the highest likelihood of being enrolled in private schools, with 98 (26.7% in the age bracket) enrolled. Conversely, the age group of 25 to 34 year olds has the lowest likelihood of being enrolled in a private school, with 207 (98.6% in the age bracket) attending a public institution.
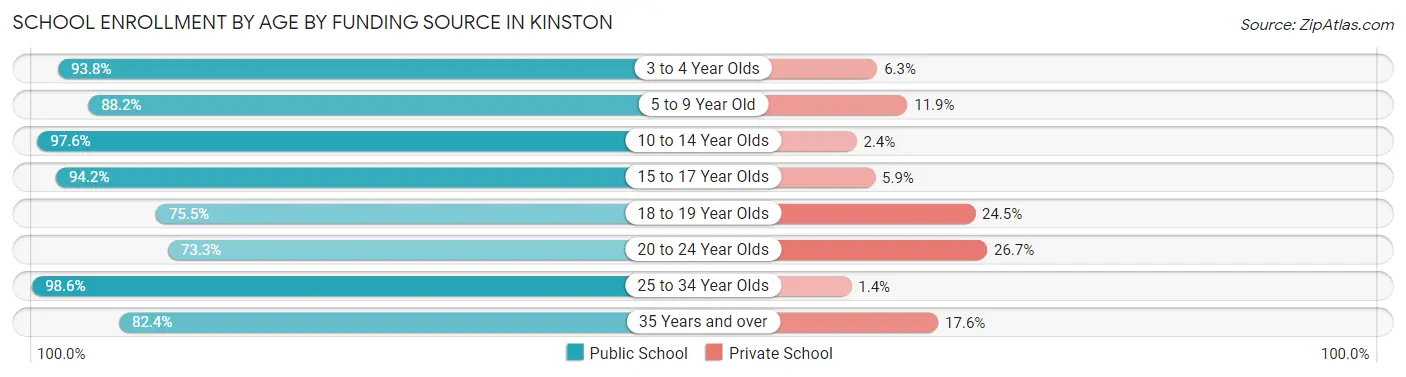
| Age Bracket | Public School | Private School |
| 3 to 4 Year Olds | 135 (93.8%) | 9 (6.2%) |
| 5 to 9 Year Old | 1,079 (88.1%) | 145 (11.8%) |
| 10 to 14 Year Olds | 1,103 (97.6%) | 27 (2.4%) |
| 15 to 17 Year Olds | 788 (94.2%) | 49 (5.9%) |
| 18 to 19 Year Olds | 250 (75.5%) | 81 (24.5%) |
| 20 to 24 Year Olds | 269 (73.3%) | 98 (26.7%) |
| 25 to 34 Year Olds | 207 (98.6%) | 3 (1.4%) |
| 35 Years and over | 192 (82.4%) | 41 (17.6%) |
| Total | 4,024 (89.9%) | 452 (10.1%) |
Educational Attainment by Field of Study in Kinston
Education (491 | 23.1%), social sciences (265 | 12.4%), business (251 | 11.8%), arts & humanities (234 | 11.0%), and science & technology (215 | 10.1%) are the most common fields of study among 2,130 individuals in Kinston who have obtained a bachelor's degree or higher.
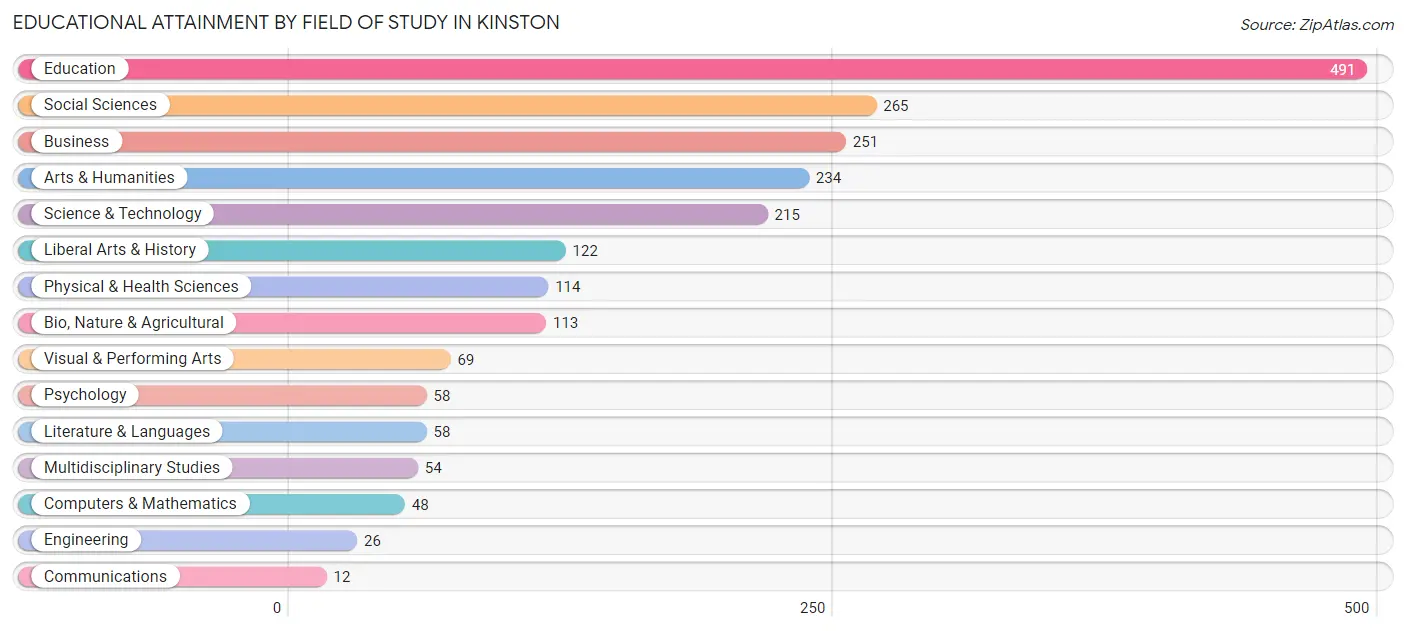
| Field of Study | # Graduates | % Graduates |
| Computers & Mathematics | 48 | 2.2% |
| Bio, Nature & Agricultural | 113 | 5.3% |
| Physical & Health Sciences | 114 | 5.3% |
| Psychology | 58 | 2.7% |
| Social Sciences | 265 | 12.4% |
| Engineering | 26 | 1.2% |
| Multidisciplinary Studies | 54 | 2.5% |
| Science & Technology | 215 | 10.1% |
| Business | 251 | 11.8% |
| Education | 491 | 23.1% |
| Literature & Languages | 58 | 2.7% |
| Liberal Arts & History | 122 | 5.7% |
| Visual & Performing Arts | 69 | 3.2% |
| Communications | 12 | 0.6% |
| Arts & Humanities | 234 | 11.0% |
| Total | 2,130 | 100.0% |
Transportation & Commute in Kinston
Vehicle Availability by Sex in Kinston
The most prevalent vehicle ownership categories in Kinston are males with 2 vehicles (1,112, accounting for 37.9%) and females with 2 vehicles (974, making up 33.1%).

| Vehicles Available | Male | Female |
| No Vehicle | 187 (6.4%) | 473 (14.1%) |
| 1 Vehicle | 887 (30.2%) | 1,175 (35.0%) |
| 2 Vehicles | 1,112 (37.9%) | 974 (29.0%) |
| 3 Vehicles | 596 (20.3%) | 477 (14.2%) |
| 4 Vehicles | 147 (5.0%) | 246 (7.3%) |
| 5 or more Vehicles | 9 (0.3%) | 13 (0.4%) |
| Total | 2,938 (100.0%) | 3,358 (100.0%) |
Commute Time in Kinston
The most frequently occuring commute durations in Kinston are 10 to 14 minutes (1,498 commuters, 24.1%), 5 to 9 minutes (1,344 commuters, 21.6%), and 15 to 19 minutes (911 commuters, 14.7%).
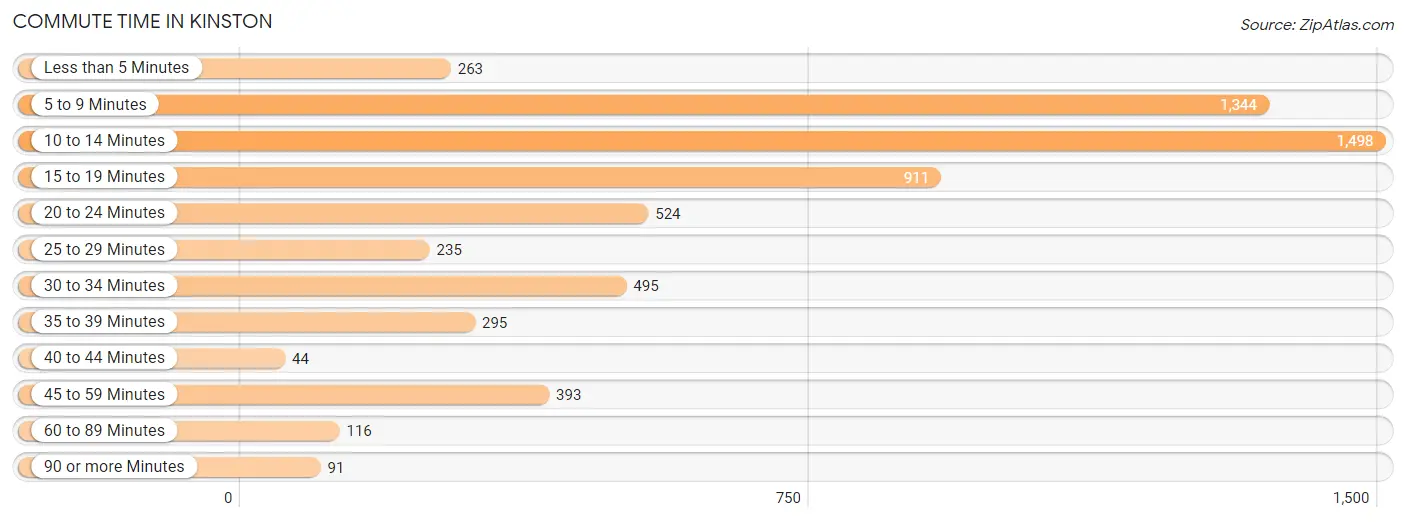
| Commute Time | # Commuters | % Commuters |
| Less than 5 Minutes | 263 | 4.2% |
| 5 to 9 Minutes | 1,344 | 21.6% |
| 10 to 14 Minutes | 1,498 | 24.1% |
| 15 to 19 Minutes | 911 | 14.7% |
| 20 to 24 Minutes | 524 | 8.4% |
| 25 to 29 Minutes | 235 | 3.8% |
| 30 to 34 Minutes | 495 | 8.0% |
| 35 to 39 Minutes | 295 | 4.8% |
| 40 to 44 Minutes | 44 | 0.7% |
| 45 to 59 Minutes | 393 | 6.3% |
| 60 to 89 Minutes | 116 | 1.9% |
| 90 or more Minutes | 91 | 1.5% |
Commute Time by Sex in Kinston
The most common commute times in Kinston are 10 to 14 minutes (798 commuters, 27.3%) for males and 5 to 9 minutes (980 commuters, 29.8%) for females.
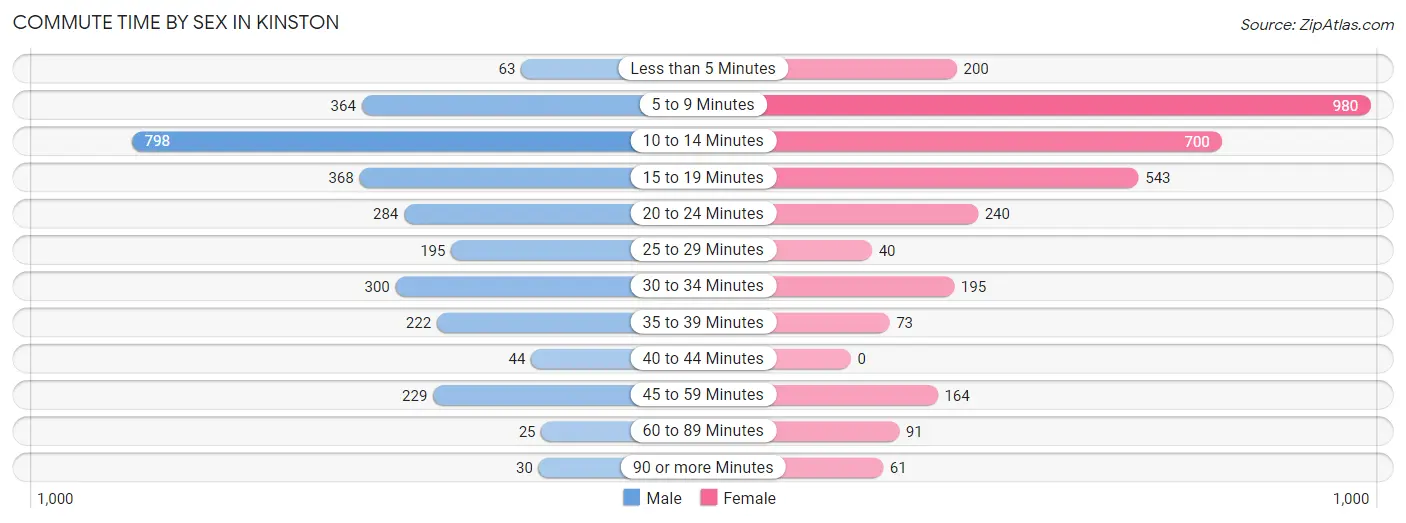
| Commute Time | Male | Female |
| Less than 5 Minutes | 63 (2.2%) | 200 (6.1%) |
| 5 to 9 Minutes | 364 (12.5%) | 980 (29.8%) |
| 10 to 14 Minutes | 798 (27.3%) | 700 (21.3%) |
| 15 to 19 Minutes | 368 (12.6%) | 543 (16.5%) |
| 20 to 24 Minutes | 284 (9.7%) | 240 (7.3%) |
| 25 to 29 Minutes | 195 (6.7%) | 40 (1.2%) |
| 30 to 34 Minutes | 300 (10.3%) | 195 (5.9%) |
| 35 to 39 Minutes | 222 (7.6%) | 73 (2.2%) |
| 40 to 44 Minutes | 44 (1.5%) | 0 (0.0%) |
| 45 to 59 Minutes | 229 (7.8%) | 164 (5.0%) |
| 60 to 89 Minutes | 25 (0.9%) | 91 (2.8%) |
| 90 or more Minutes | 30 (1.0%) | 61 (1.9%) |
Time of Departure to Work by Sex in Kinston
The most frequent times of departure to work in Kinston are 6:30 AM to 6:59 AM (551, 18.9%) for males and 7:00 AM to 7:29 AM (527, 16.0%) for females.
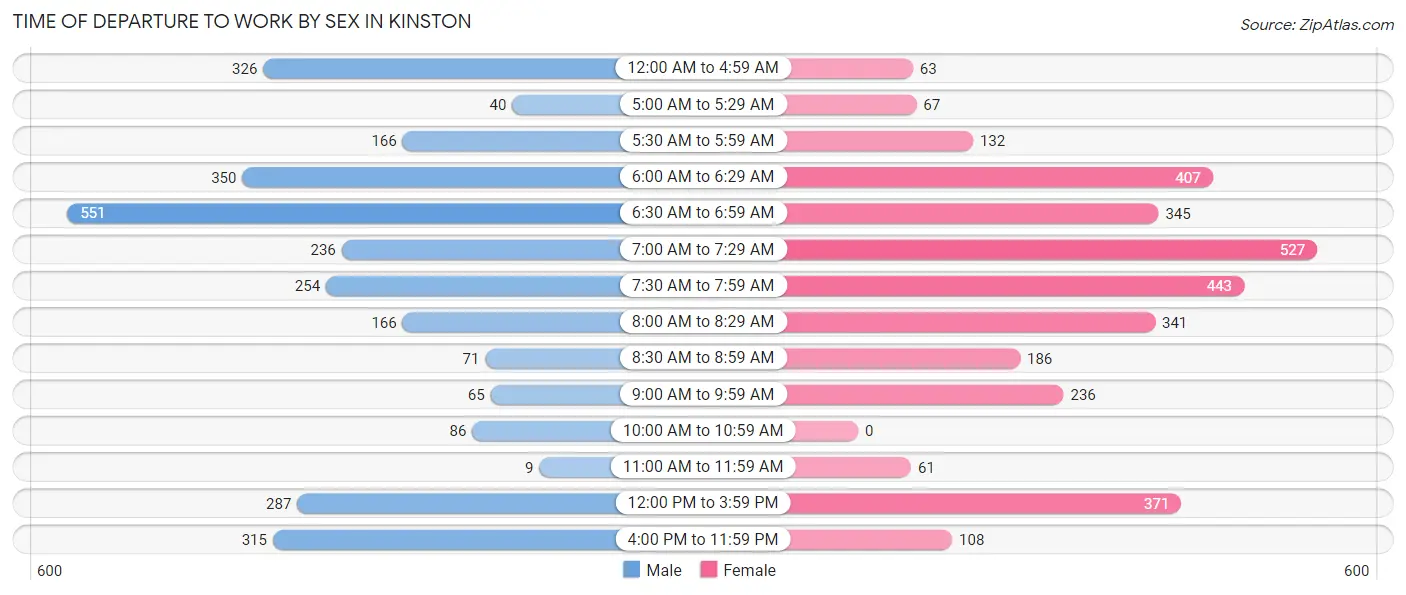
| Time of Departure | Male | Female |
| 12:00 AM to 4:59 AM | 326 (11.2%) | 63 (1.9%) |
| 5:00 AM to 5:29 AM | 40 (1.4%) | 67 (2.0%) |
| 5:30 AM to 5:59 AM | 166 (5.7%) | 132 (4.0%) |
| 6:00 AM to 6:29 AM | 350 (12.0%) | 407 (12.4%) |
| 6:30 AM to 6:59 AM | 551 (18.9%) | 345 (10.5%) |
| 7:00 AM to 7:29 AM | 236 (8.1%) | 527 (16.0%) |
| 7:30 AM to 7:59 AM | 254 (8.7%) | 443 (13.5%) |
| 8:00 AM to 8:29 AM | 166 (5.7%) | 341 (10.4%) |
| 8:30 AM to 8:59 AM | 71 (2.4%) | 186 (5.7%) |
| 9:00 AM to 9:59 AM | 65 (2.2%) | 236 (7.2%) |
| 10:00 AM to 10:59 AM | 86 (2.9%) | 0 (0.0%) |
| 11:00 AM to 11:59 AM | 9 (0.3%) | 61 (1.9%) |
| 12:00 PM to 3:59 PM | 287 (9.8%) | 371 (11.3%) |
| 4:00 PM to 11:59 PM | 315 (10.8%) | 108 (3.3%) |
| Total | 2,922 (100.0%) | 3,287 (100.0%) |
Housing Occupancy in Kinston
Occupancy by Ownership in Kinston
Of the total 8,711 dwellings in Kinston, owner-occupied units account for 3,577 (41.1%), while renter-occupied units make up 5,134 (58.9%).
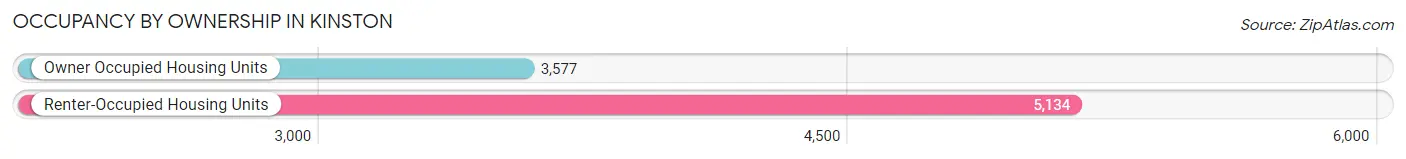
| Occupancy | # Housing Units | % Housing Units |
| Owner Occupied Housing Units | 3,577 | 41.1% |
| Renter-Occupied Housing Units | 5,134 | 58.9% |
| Total Occupied Housing Units | 8,711 | 100.0% |
Occupancy by Household Size in Kinston
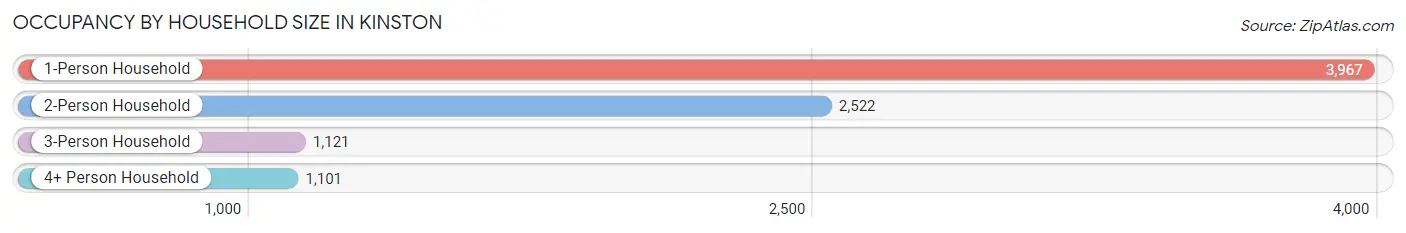
| Household Size | # Housing Units | % Housing Units |
| 1-Person Household | 3,967 | 45.5% |
| 2-Person Household | 2,522 | 28.9% |
| 3-Person Household | 1,121 | 12.9% |
| 4+ Person Household | 1,101 | 12.6% |
| Total Housing Units | 8,711 | 100.0% |
Occupancy by Ownership by Household Size in Kinston
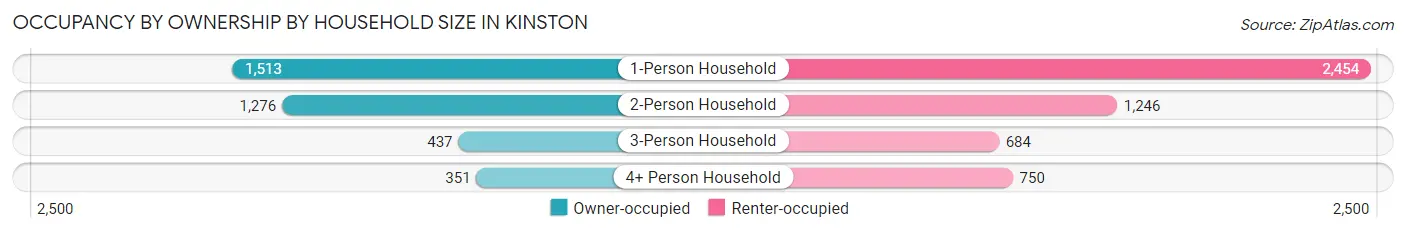
| Household Size | Owner-occupied | Renter-occupied |
| 1-Person Household | 1,513 (38.1%) | 2,454 (61.9%) |
| 2-Person Household | 1,276 (50.6%) | 1,246 (49.4%) |
| 3-Person Household | 437 (39.0%) | 684 (61.0%) |
| 4+ Person Household | 351 (31.9%) | 750 (68.1%) |
| Total Housing Units | 3,577 (41.1%) | 5,134 (58.9%) |
Occupancy by Educational Attainment in Kinston
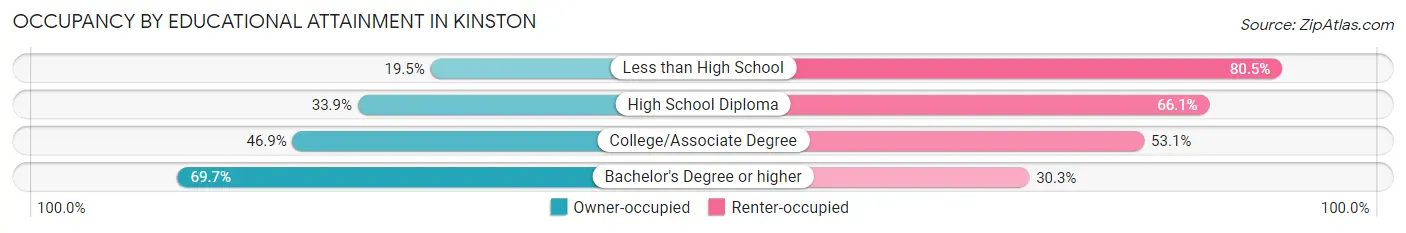
| Household Size | Owner-occupied | Renter-occupied |
| Less than High School | 283 (19.5%) | 1,167 (80.5%) |
| High School Diploma | 1,053 (33.9%) | 2,050 (66.1%) |
| College/Associate Degree | 1,348 (46.9%) | 1,528 (53.1%) |
| Bachelor's Degree or higher | 893 (69.7%) | 389 (30.3%) |
Occupancy by Age of Householder in Kinston
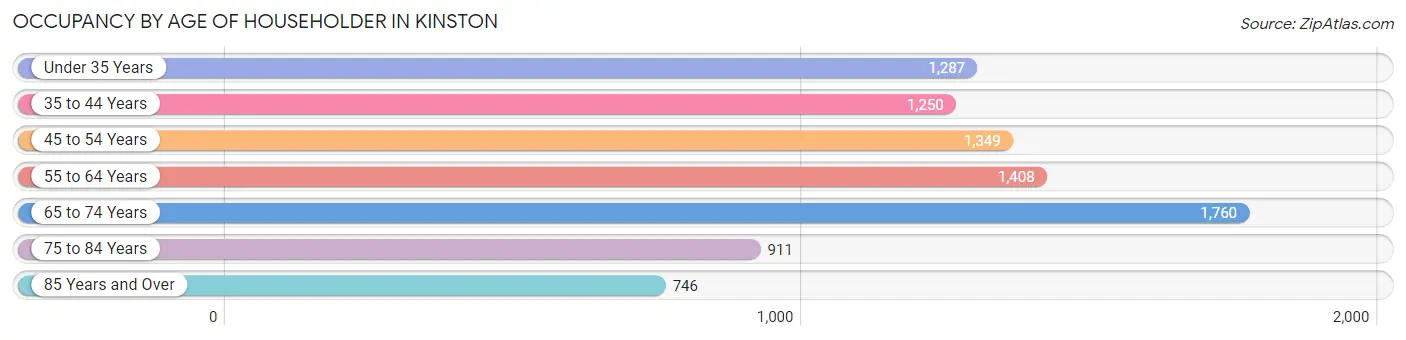
| Age Bracket | # Households | % Households |
| Under 35 Years | 1,287 | 14.8% |
| 35 to 44 Years | 1,250 | 14.3% |
| 45 to 54 Years | 1,349 | 15.5% |
| 55 to 64 Years | 1,408 | 16.2% |
| 65 to 74 Years | 1,760 | 20.2% |
| 75 to 84 Years | 911 | 10.5% |
| 85 Years and Over | 746 | 8.6% |
| Total | 8,711 | 100.0% |
Housing Finances in Kinston
Median Income by Occupancy in Kinston
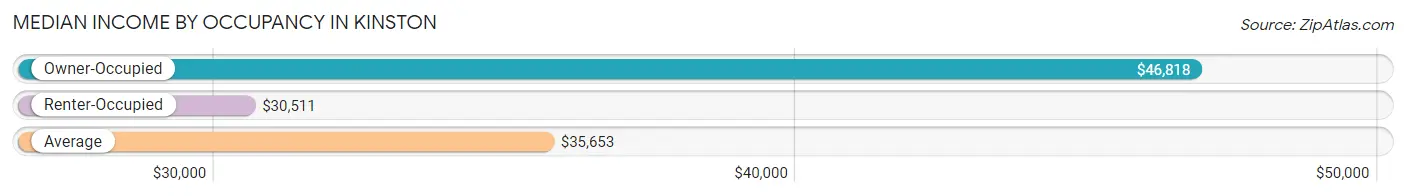
| Occupancy Type | # Households | Median Income |
| Owner-Occupied | 3,577 (41.1%) | $46,818 |
| Renter-Occupied | 5,134 (58.9%) | $30,511 |
| Average | 8,711 (100.0%) | $35,653 |
Occupancy by Householder Income Bracket in Kinston
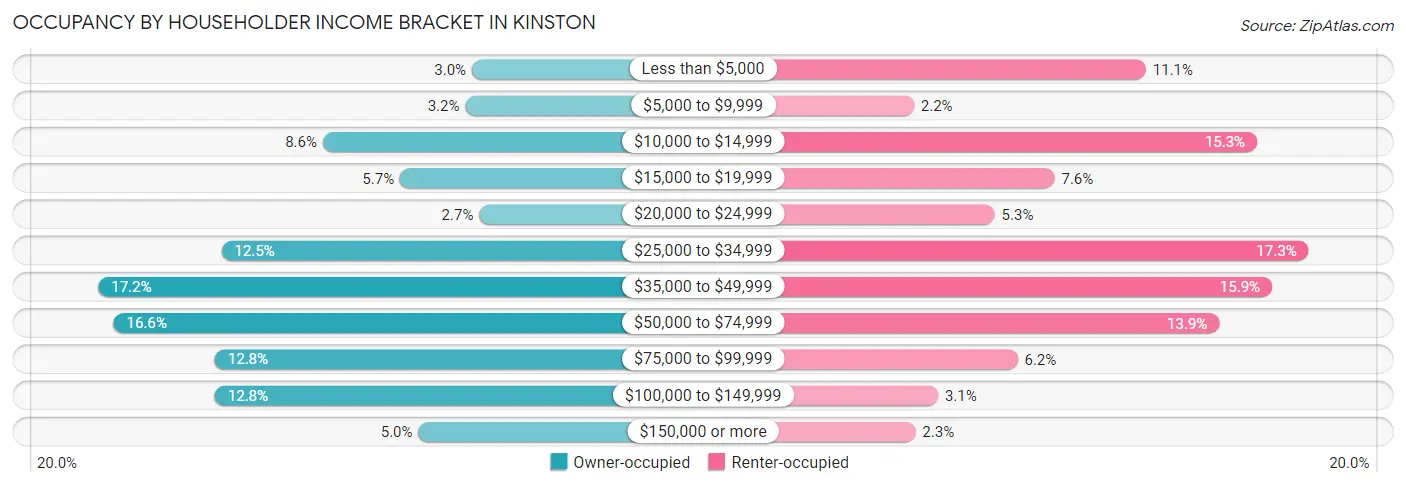
| Income Bracket | Owner-occupied | Renter-occupied |
| Less than $5,000 | 106 (3.0%) | 568 (11.1%) |
| $5,000 to $9,999 | 115 (3.2%) | 114 (2.2%) |
| $10,000 to $14,999 | 309 (8.6%) | 785 (15.3%) |
| $15,000 to $19,999 | 204 (5.7%) | 389 (7.6%) |
| $20,000 to $24,999 | 96 (2.7%) | 272 (5.3%) |
| $25,000 to $34,999 | 447 (12.5%) | 886 (17.3%) |
| $35,000 to $49,999 | 615 (17.2%) | 814 (15.9%) |
| $50,000 to $74,999 | 594 (16.6%) | 711 (13.9%) |
| $75,000 to $99,999 | 456 (12.8%) | 317 (6.2%) |
| $100,000 to $149,999 | 456 (12.8%) | 161 (3.1%) |
| $150,000 or more | 179 (5.0%) | 117 (2.3%) |
| Total | 3,577 (100.0%) | 5,134 (100.0%) |
Monthly Housing Cost Tiers in Kinston
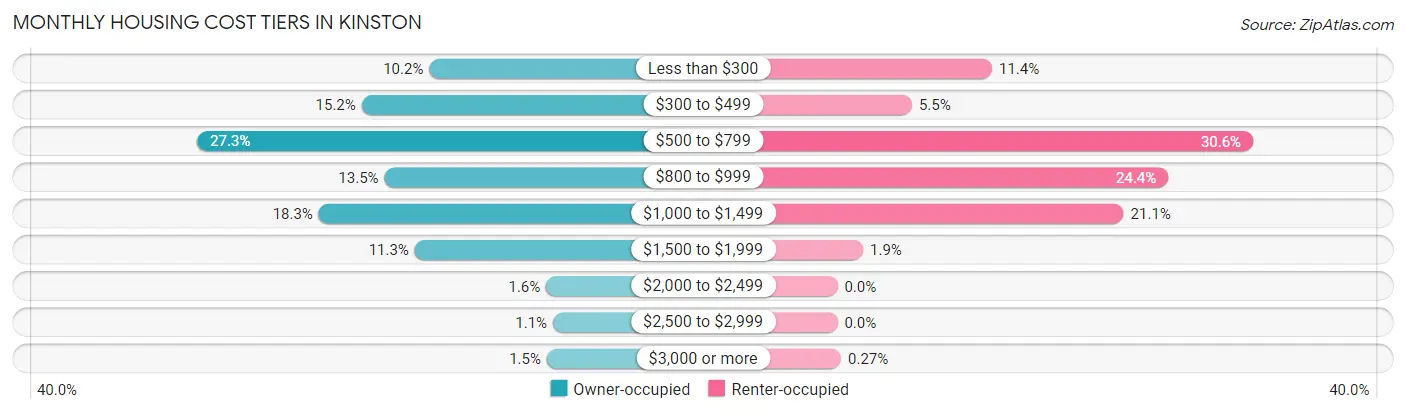
| Monthly Cost | Owner-occupied | Renter-occupied |
| Less than $300 | 365 (10.2%) | 585 (11.4%) |
| $300 to $499 | 543 (15.2%) | 282 (5.5%) |
| $500 to $799 | 976 (27.3%) | 1,571 (30.6%) |
| $800 to $999 | 483 (13.5%) | 1,250 (24.3%) |
| $1,000 to $1,499 | 656 (18.3%) | 1,082 (21.1%) |
| $1,500 to $1,999 | 403 (11.3%) | 97 (1.9%) |
| $2,000 to $2,499 | 57 (1.6%) | 0 (0.0%) |
| $2,500 to $2,999 | 39 (1.1%) | 0 (0.0%) |
| $3,000 or more | 55 (1.5%) | 14 (0.3%) |
| Total | 3,577 (100.0%) | 5,134 (100.0%) |
Physical Housing Characteristics in Kinston
Housing Structures in Kinston
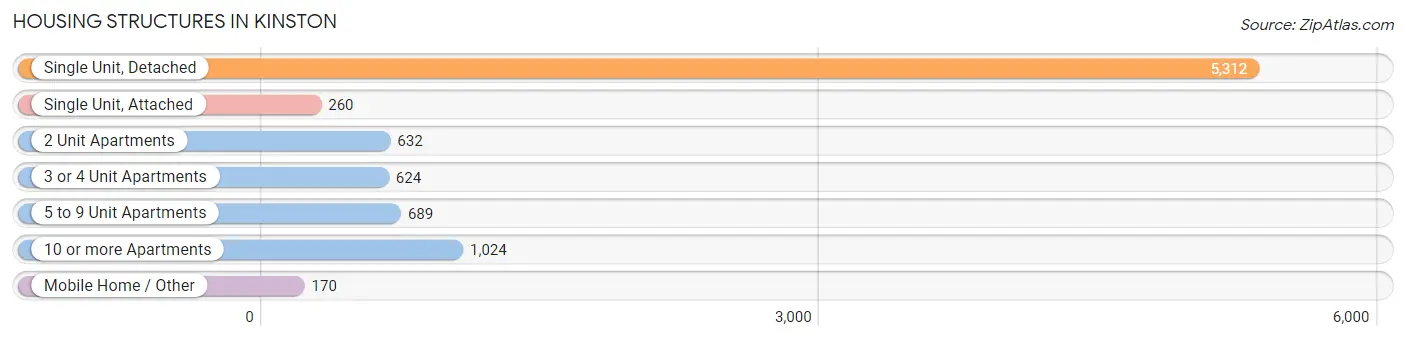
| Structure Type | # Housing Units | % Housing Units |
| Single Unit, Detached | 5,312 | 61.0% |
| Single Unit, Attached | 260 | 3.0% |
| 2 Unit Apartments | 632 | 7.3% |
| 3 or 4 Unit Apartments | 624 | 7.2% |
| 5 to 9 Unit Apartments | 689 | 7.9% |
| 10 or more Apartments | 1,024 | 11.8% |
| Mobile Home / Other | 170 | 1.9% |
| Total | 8,711 | 100.0% |
Housing Structures by Occupancy in Kinston
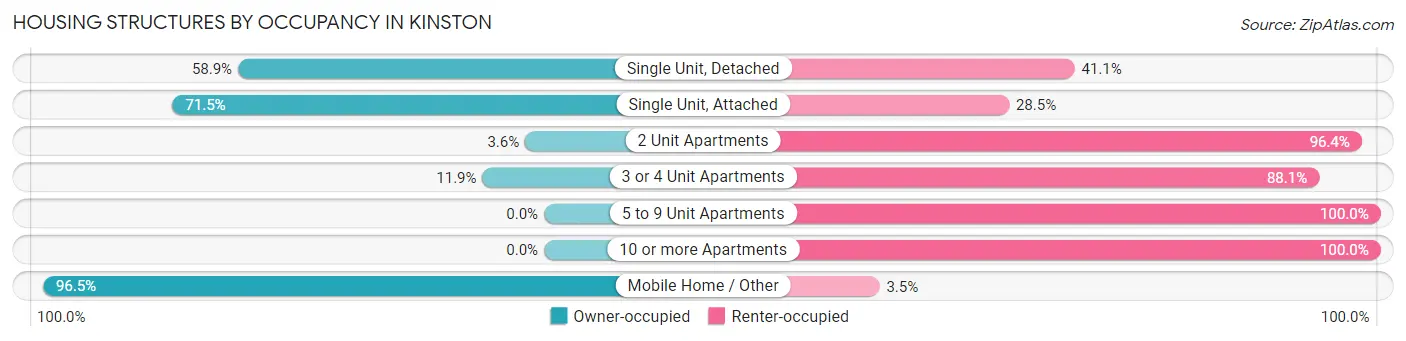
| Structure Type | Owner-occupied | Renter-occupied |
| Single Unit, Detached | 3,130 (58.9%) | 2,182 (41.1%) |
| Single Unit, Attached | 186 (71.5%) | 74 (28.5%) |
| 2 Unit Apartments | 23 (3.6%) | 609 (96.4%) |
| 3 or 4 Unit Apartments | 74 (11.9%) | 550 (88.1%) |
| 5 to 9 Unit Apartments | 0 (0.0%) | 689 (100.0%) |
| 10 or more Apartments | 0 (0.0%) | 1,024 (100.0%) |
| Mobile Home / Other | 164 (96.5%) | 6 (3.5%) |
| Total | 3,577 (41.1%) | 5,134 (58.9%) |
Housing Structures by Number of Rooms in Kinston
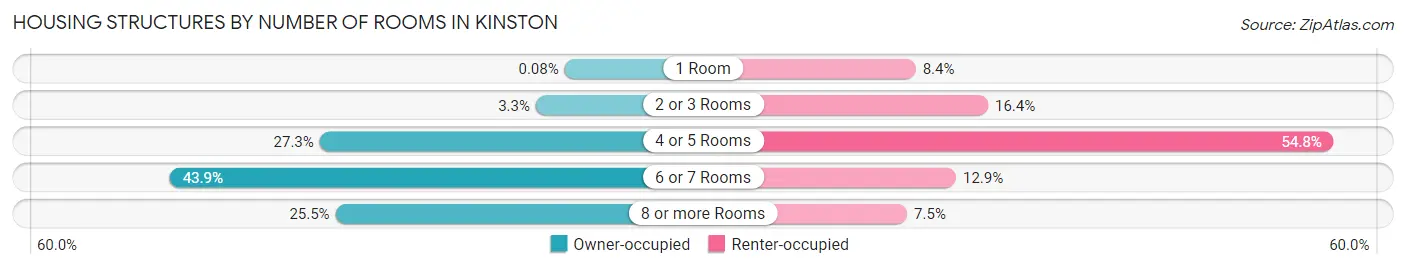
| Number of Rooms | Owner-occupied | Renter-occupied |
| 1 Room | 3 (0.1%) | 432 (8.4%) |
| 2 or 3 Rooms | 117 (3.3%) | 844 (16.4%) |
| 4 or 5 Rooms | 975 (27.3%) | 2,813 (54.8%) |
| 6 or 7 Rooms | 1,570 (43.9%) | 662 (12.9%) |
| 8 or more Rooms | 912 (25.5%) | 383 (7.5%) |
| Total | 3,577 (100.0%) | 5,134 (100.0%) |
Housing Structure by Heating Type in Kinston
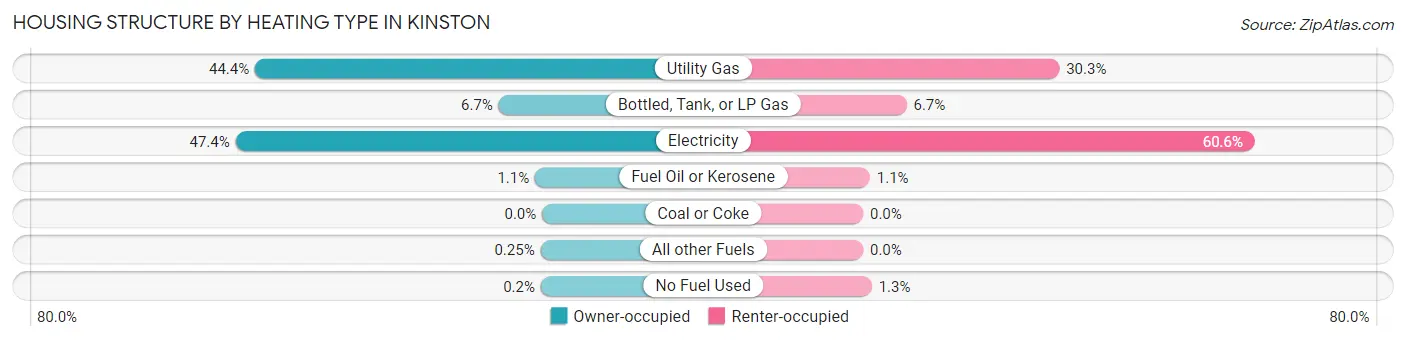
| Heating Type | Owner-occupied | Renter-occupied |
| Utility Gas | 1,587 (44.4%) | 1,557 (30.3%) |
| Bottled, Tank, or LP Gas | 240 (6.7%) | 345 (6.7%) |
| Electricity | 1,695 (47.4%) | 3,109 (60.6%) |
| Fuel Oil or Kerosene | 39 (1.1%) | 54 (1.1%) |
| Coal or Coke | 0 (0.0%) | 0 (0.0%) |
| All other Fuels | 9 (0.3%) | 0 (0.0%) |
| No Fuel Used | 7 (0.2%) | 69 (1.3%) |
| Total | 3,577 (100.0%) | 5,134 (100.0%) |
Household Vehicle Usage in Kinston
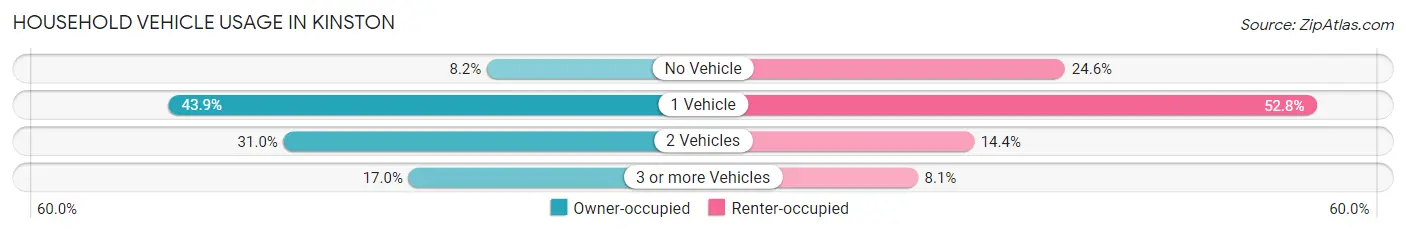
| Vehicles per Household | Owner-occupied | Renter-occupied |
| No Vehicle | 293 (8.2%) | 1,265 (24.6%) |
| 1 Vehicle | 1,569 (43.9%) | 2,710 (52.8%) |
| 2 Vehicles | 1,108 (31.0%) | 741 (14.4%) |
| 3 or more Vehicles | 607 (17.0%) | 418 (8.1%) |
| Total | 3,577 (100.0%) | 5,134 (100.0%) |
Real Estate & Mortgages in Kinston
Real Estate and Mortgage Overview in Kinston
| Characteristic | Without Mortgage | With Mortgage |
| Housing Units | 2,065 | 1,512 |
| Median Property Value | $92,900 | $115,800 |
| Median Household Income | $42,809 | $125 |
| Monthly Housing Costs | $559 | $55 |
| Real Estate Taxes | $1,156 | $86 |
Property Value by Mortgage Status in Kinston
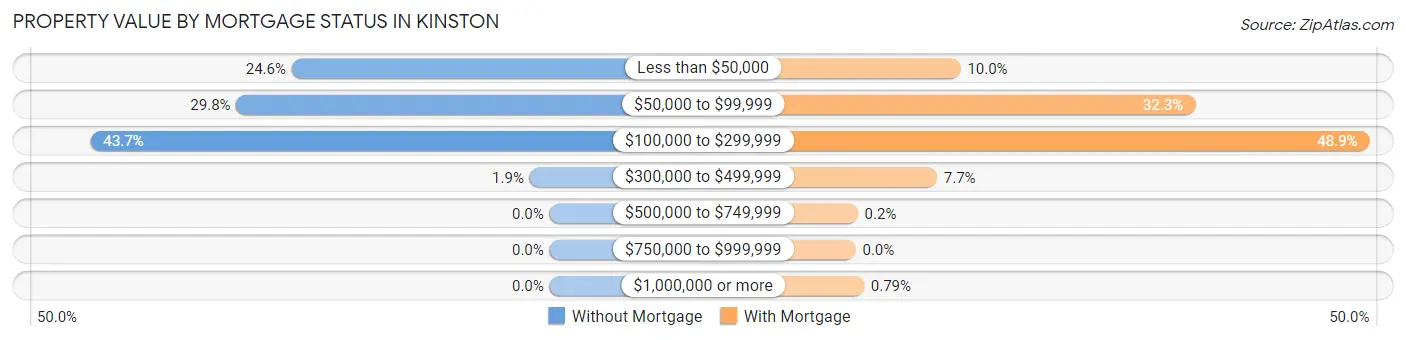
| Property Value | Without Mortgage | With Mortgage |
| Less than $50,000 | 507 (24.5%) | 151 (10.0%) |
| $50,000 to $99,999 | 616 (29.8%) | 489 (32.3%) |
| $100,000 to $299,999 | 903 (43.7%) | 740 (48.9%) |
| $300,000 to $499,999 | 39 (1.9%) | 117 (7.7%) |
| $500,000 to $749,999 | 0 (0.0%) | 3 (0.2%) |
| $750,000 to $999,999 | 0 (0.0%) | 0 (0.0%) |
| $1,000,000 or more | 0 (0.0%) | 12 (0.8%) |
| Total | 2,065 (100.0%) | 1,512 (100.0%) |
Household Income by Mortgage Status in Kinston
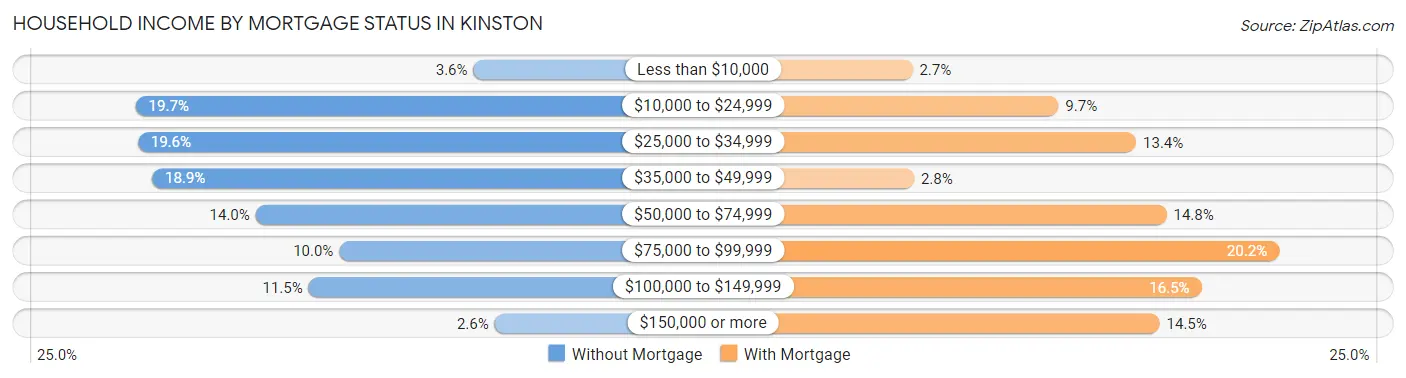
| Household Income | Without Mortgage | With Mortgage |
| Less than $10,000 | 75 (3.6%) | 41 (2.7%) |
| $10,000 to $24,999 | 407 (19.7%) | 146 (9.7%) |
| $25,000 to $34,999 | 405 (19.6%) | 202 (13.4%) |
| $35,000 to $49,999 | 391 (18.9%) | 42 (2.8%) |
| $50,000 to $74,999 | 289 (14.0%) | 224 (14.8%) |
| $75,000 to $99,999 | 207 (10.0%) | 305 (20.2%) |
| $100,000 to $149,999 | 237 (11.5%) | 249 (16.5%) |
| $150,000 or more | 54 (2.6%) | 219 (14.5%) |
| Total | 2,065 (100.0%) | 1,512 (100.0%) |
Property Value to Household Income Ratio in Kinston
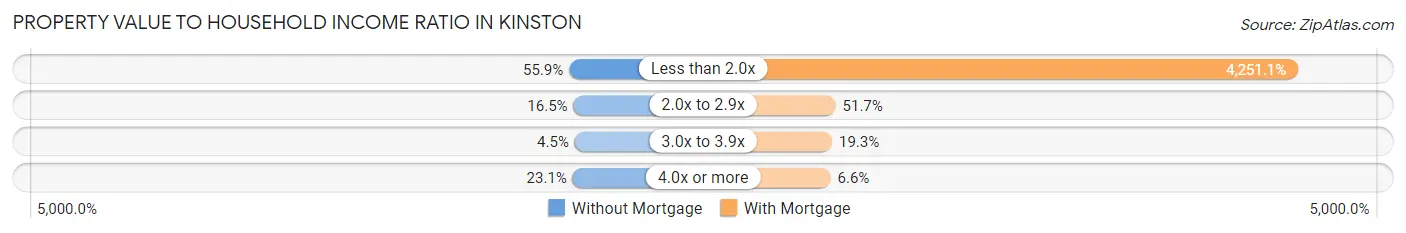
| Value-to-Income Ratio | Without Mortgage | With Mortgage |
| Less than 2.0x | 1,154 (55.9%) | 64,276 (4,251.1%) |
| 2.0x to 2.9x | 341 (16.5%) | 782 (51.7%) |
| 3.0x to 3.9x | 93 (4.5%) | 291 (19.3%) |
| 4.0x or more | 477 (23.1%) | 99 (6.6%) |
| Total | 2,065 (100.0%) | 1,512 (100.0%) |
Real Estate Taxes by Mortgage Status in Kinston
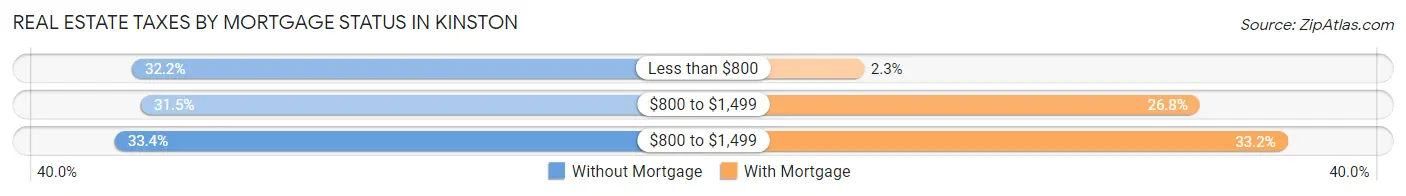
| Property Taxes | Without Mortgage | With Mortgage |
| Less than $800 | 664 (32.2%) | 34 (2.2%) |
| $800 to $1,499 | 650 (31.5%) | 405 (26.8%) |
| $800 to $1,499 | 690 (33.4%) | 502 (33.2%) |
| Total | 2,065 (100.0%) | 1,512 (100.0%) |
Health & Disability in Kinston
Health Insurance Coverage by Age in Kinston
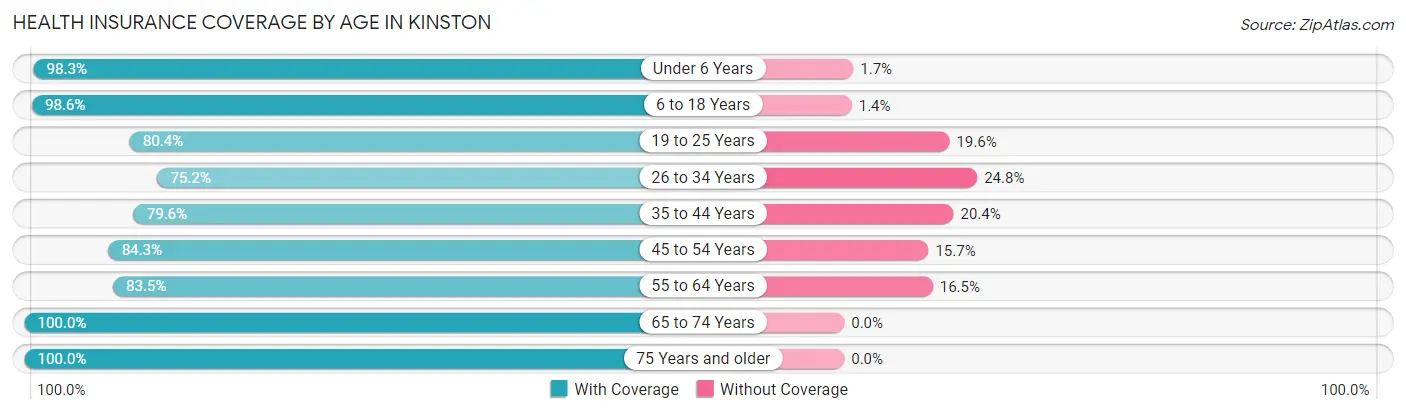
| Age Bracket | With Coverage | Without Coverage |
| Under 6 Years | 1,450 (98.3%) | 25 (1.7%) |
| 6 to 18 Years | 3,027 (98.6%) | 43 (1.4%) |
| 19 to 25 Years | 1,233 (80.4%) | 301 (19.6%) |
| 26 to 34 Years | 1,080 (75.2%) | 356 (24.8%) |
| 35 to 44 Years | 1,594 (79.6%) | 408 (20.4%) |
| 45 to 54 Years | 1,858 (84.3%) | 346 (15.7%) |
| 55 to 64 Years | 2,109 (83.5%) | 417 (16.5%) |
| 65 to 74 Years | 2,562 (100.0%) | 0 (0.0%) |
| 75 Years and older | 2,231 (100.0%) | 0 (0.0%) |
| Total | 17,144 (90.0%) | 1,896 (10.0%) |
Health Insurance Coverage by Citizenship Status in Kinston
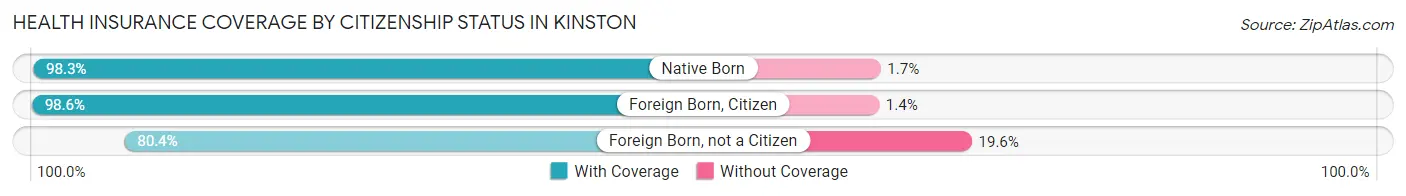
| Citizenship Status | With Coverage | Without Coverage |
| Native Born | 1,450 (98.3%) | 25 (1.7%) |
| Foreign Born, Citizen | 3,027 (98.6%) | 43 (1.4%) |
| Foreign Born, not a Citizen | 1,233 (80.4%) | 301 (19.6%) |
Health Insurance Coverage by Household Income in Kinston
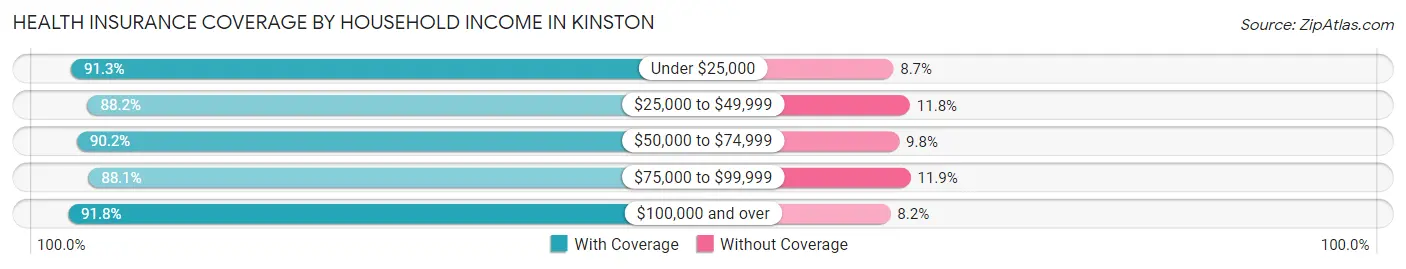
| Household Income | With Coverage | Without Coverage |
| Under $25,000 | 4,593 (91.3%) | 438 (8.7%) |
| $25,000 to $49,999 | 4,269 (88.2%) | 572 (11.8%) |
| $50,000 to $74,999 | 2,612 (90.2%) | 284 (9.8%) |
| $75,000 to $99,999 | 2,184 (88.1%) | 296 (11.9%) |
| $100,000 and over | 3,272 (91.8%) | 291 (8.2%) |
Public vs Private Health Insurance Coverage by Age in Kinston
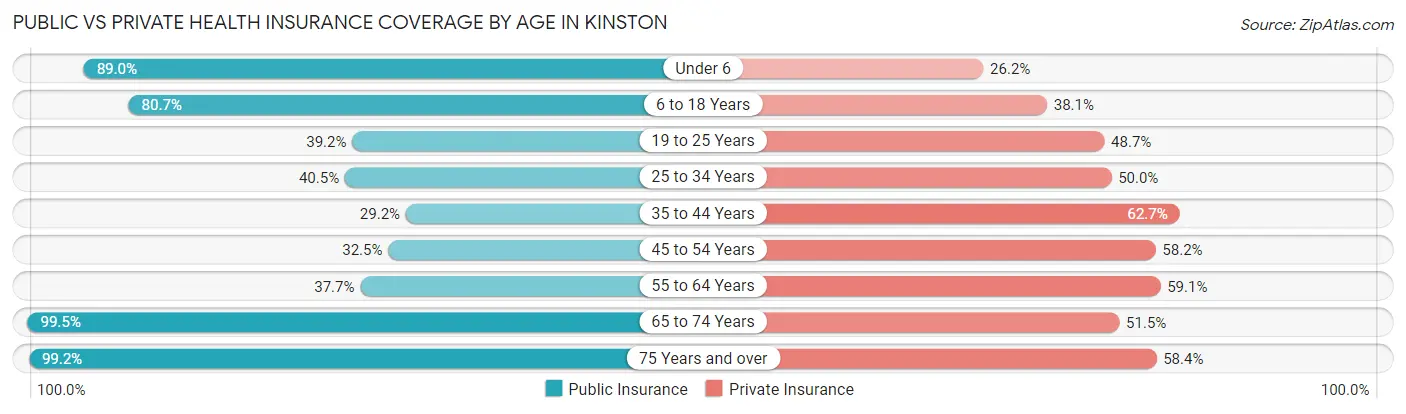
| Age Bracket | Public Insurance | Private Insurance |
| Under 6 | 1,313 (89.0%) | 387 (26.2%) |
| 6 to 18 Years | 2,477 (80.7%) | 1,168 (38.1%) |
| 19 to 25 Years | 601 (39.2%) | 747 (48.7%) |
| 25 to 34 Years | 582 (40.5%) | 718 (50.0%) |
| 35 to 44 Years | 585 (29.2%) | 1,255 (62.7%) |
| 45 to 54 Years | 716 (32.5%) | 1,283 (58.2%) |
| 55 to 64 Years | 952 (37.7%) | 1,493 (59.1%) |
| 65 to 74 Years | 2,548 (99.5%) | 1,319 (51.5%) |
| 75 Years and over | 2,213 (99.2%) | 1,302 (58.4%) |
| Total | 11,987 (63.0%) | 9,672 (50.8%) |
Disability Status by Sex by Age in Kinston
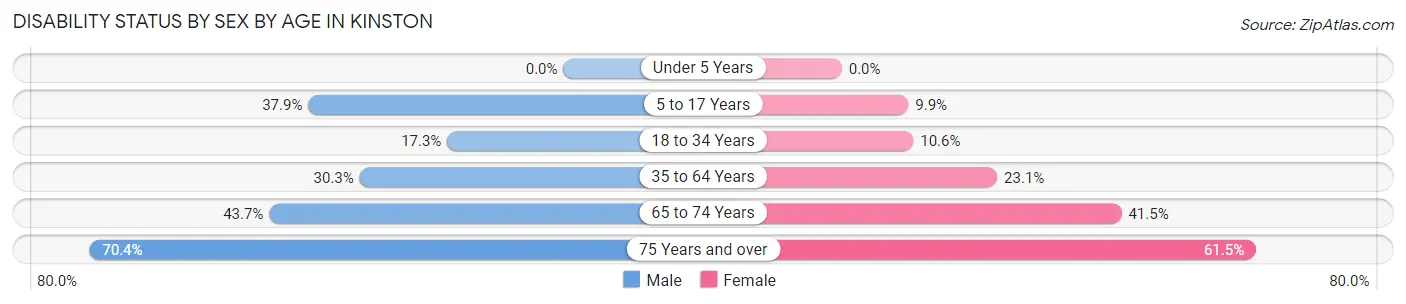
| Age Bracket | Male | Female |
| Under 5 Years | 0 (0.0%) | 0 (0.0%) |
| 5 to 17 Years | 642 (37.9%) | 150 (9.9%) |
| 18 to 34 Years | 283 (17.2%) | 168 (10.6%) |
| 35 to 64 Years | 880 (30.2%) | 882 (23.1%) |
| 65 to 74 Years | 449 (43.7%) | 637 (41.5%) |
| 75 Years and over | 563 (70.4%) | 880 (61.5%) |
Disability Class by Sex by Age in Kinston
Disability Class: Hearing Difficulty
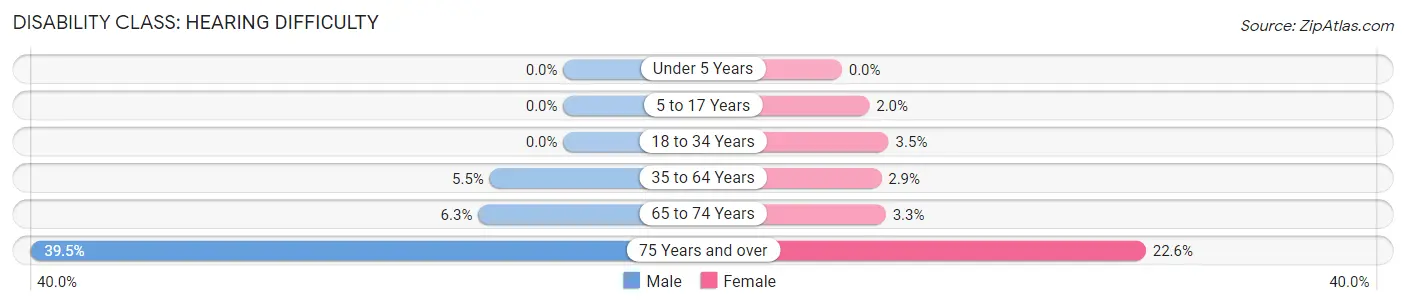
| Age Bracket | Male | Female |
| Under 5 Years | 0 (0.0%) | 0 (0.0%) |
| 5 to 17 Years | 0 (0.0%) | 31 (2.0%) |
| 18 to 34 Years | 0 (0.0%) | 55 (3.5%) |
| 35 to 64 Years | 159 (5.5%) | 112 (2.9%) |
| 65 to 74 Years | 65 (6.3%) | 50 (3.3%) |
| 75 Years and over | 316 (39.5%) | 323 (22.6%) |
Disability Class: Vision Difficulty
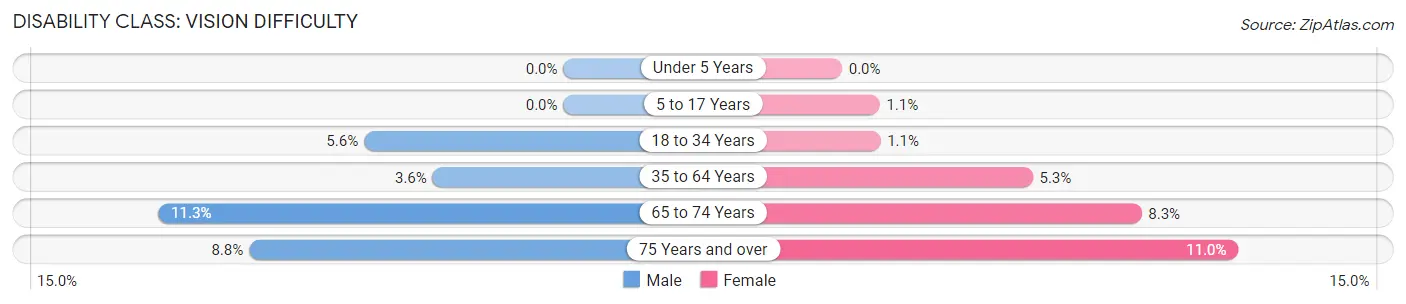
| Age Bracket | Male | Female |
| Under 5 Years | 0 (0.0%) | 0 (0.0%) |
| 5 to 17 Years | 0 (0.0%) | 16 (1.1%) |
| 18 to 34 Years | 91 (5.6%) | 17 (1.1%) |
| 35 to 64 Years | 106 (3.6%) | 203 (5.3%) |
| 65 to 74 Years | 116 (11.3%) | 128 (8.3%) |
| 75 Years and over | 70 (8.7%) | 158 (11.0%) |
Disability Class: Cognitive Difficulty
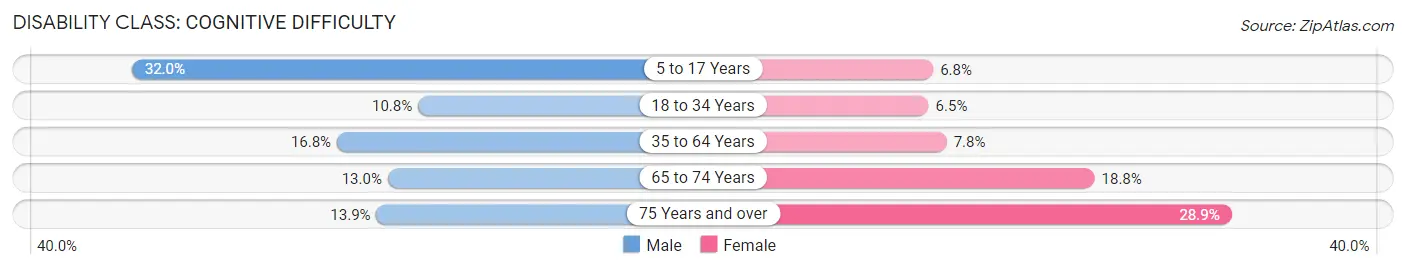
| Age Bracket | Male | Female |
| 5 to 17 Years | 543 (32.0%) | 103 (6.8%) |
| 18 to 34 Years | 177 (10.8%) | 102 (6.5%) |
| 35 to 64 Years | 489 (16.8%) | 298 (7.8%) |
| 65 to 74 Years | 134 (13.0%) | 288 (18.8%) |
| 75 Years and over | 111 (13.9%) | 414 (28.9%) |
Disability Class: Ambulatory Difficulty
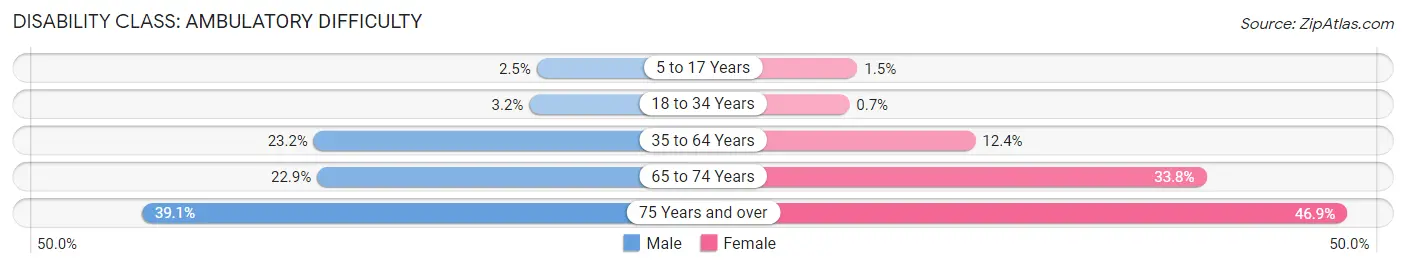
| Age Bracket | Male | Female |
| 5 to 17 Years | 42 (2.5%) | 22 (1.5%) |
| 18 to 34 Years | 52 (3.2%) | 11 (0.7%) |
| 35 to 64 Years | 674 (23.2%) | 474 (12.4%) |
| 65 to 74 Years | 235 (22.9%) | 519 (33.8%) |
| 75 Years and over | 313 (39.1%) | 671 (46.9%) |
Disability Class: Self-Care Difficulty
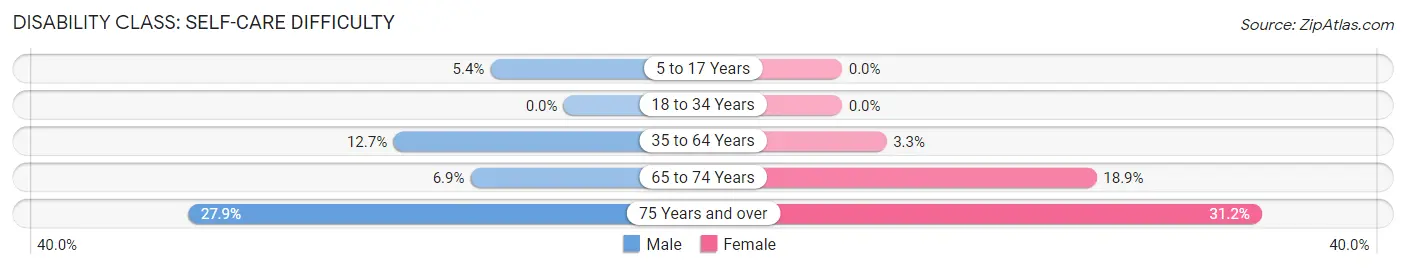
| Age Bracket | Male | Female |
| 5 to 17 Years | 92 (5.4%) | 0 (0.0%) |
| 18 to 34 Years | 0 (0.0%) | 0 (0.0%) |
| 35 to 64 Years | 368 (12.7%) | 126 (3.3%) |
| 65 to 74 Years | 71 (6.9%) | 290 (18.9%) |
| 75 Years and over | 223 (27.9%) | 446 (31.2%) |
Technology Access in Kinston
Computing Device Access in Kinston
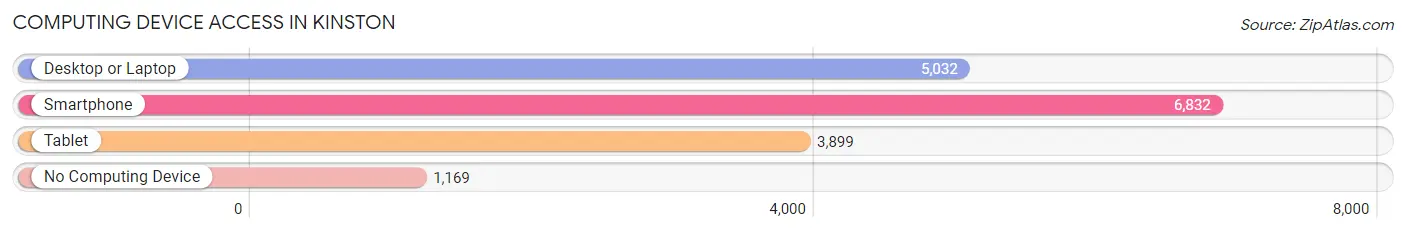
| Device Type | # Households | % Households |
| Desktop or Laptop | 5,032 | 57.8% |
| Smartphone | 6,832 | 78.4% |
| Tablet | 3,899 | 44.8% |
| No Computing Device | 1,169 | 13.4% |
| Total | 8,711 | 100.0% |
Internet Access in Kinston
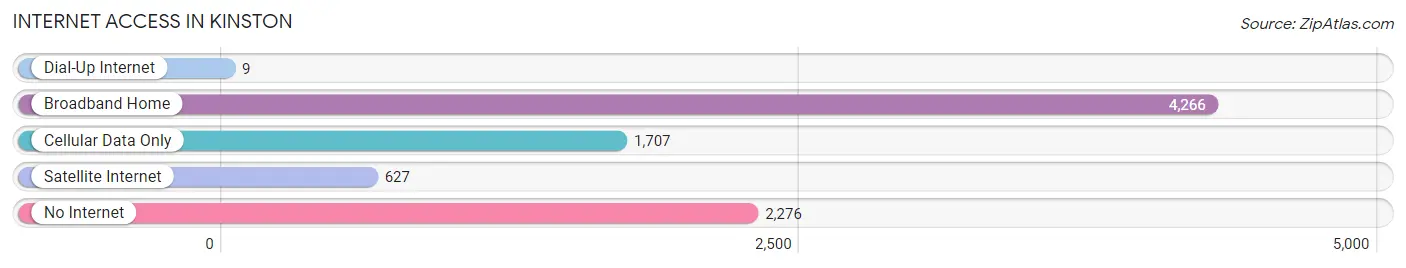
| Internet Type | # Households | % Households |
| Dial-Up Internet | 9 | 0.1% |
| Broadband Home | 4,266 | 49.0% |
| Cellular Data Only | 1,707 | 19.6% |
| Satellite Internet | 627 | 7.2% |
| No Internet | 2,276 | 26.1% |
| Total | 8,711 | 100.0% |
Kinston Summary
Kinston, North Carolina is a small city located in Lenoir County in the eastern part of the state. It is situated on the Neuse River, about halfway between the cities of Greenville and New Bern. The city has a population of approximately 21,677 people, according to the 2010 census.
History
Kinston was founded in 1762 by British settlers, who named it Kingston after King George III. The city was an important trading center during the Revolutionary War, and was the site of several battles. After the war, Kinston became a major port for the export of cotton and other goods. The city was also the site of a major Civil War battle in 1865, which resulted in the Union victory.
In the late 19th century, Kinston became an important industrial center, with several factories and mills located in the city. The city was also home to a large African-American population, and was the site of several civil rights protests in the 1960s.
Geography
Kinston is located in the Coastal Plain region of North Carolina, about halfway between the cities of Greenville and New Bern. The city is situated on the Neuse River, and is surrounded by several small towns and villages. The city has a total area of 11.3 square miles, of which 11.2 square miles is land and 0.1 square miles is water.
Economy
Kinston’s economy is largely based on agriculture and manufacturing. The city is home to several large agricultural operations, including a large hog farm and several poultry farms. The city is also home to several manufacturing companies, including a furniture factory, a paper mill, and a textile mill.
The city is also home to several retail stores, restaurants, and other businesses. The city is served by the Kinston Regional Airport, which provides air service to several major cities in the region.
Demographics
According to the 2010 census, Kinston has a population of 21,677 people. The racial makeup of the city is 57.3% African American, 37.2% White, 1.2% Asian, 0.3% Native American, and 4.0% from other races. The median household income in the city is $30,945, and the median age is 36.7 years.
Conclusion
Kinston, North Carolina is a small city located in Lenoir County in the eastern part of the state. It is situated on the Neuse River, about halfway between the cities of Greenville and New Bern. The city has a population of approximately 21,677 people, according to the 2010 census. The city’s economy is largely based on agriculture and manufacturing, and the city is home to several retail stores, restaurants, and other businesses. The racial makeup of the city is 57.3% African American, 37.2% White, 1.2% Asian, 0.3% Native American, and 4.0% from other races. The median household income in the city is $30,945, and the median age is 36.7 years.
Common Questions
What is Per Capita Income in Kinston?
Per Capita income in Kinston is $27,127.
What is the Median Family Income in Kinston?
Median Family Income in Kinston is $46,840.
What is the Median Household income in Kinston?
Median Household Income in Kinston is $35,653.
What is Income or Wage Gap in Kinston?
Income or Wage Gap in Kinston is 28.7%.
Women in Kinston earn 71.3 cents for every dollar earned by a man.
What is Inequality or Gini Index in Kinston?
Inequality or Gini Index in Kinston is 0.52.
What is the Total Population of Kinston?
Total Population of Kinston is 19,704.
What is the Total Male Population of Kinston?
Total Male Population of Kinston is 8,980.
What is the Total Female Population of Kinston?
Total Female Population of Kinston is 10,724.
What is the Ratio of Males per 100 Females in Kinston?
There are 83.74 Males per 100 Females in Kinston.
What is the Ratio of Females per 100 Males in Kinston?
There are 119.42 Females per 100 Males in Kinston.
What is the Median Population Age in Kinston?
Median Population Age in Kinston is 44.1 Years.
What is the Average Family Size in Kinston
Average Family Size in Kinston is 3.1 People.
What is the Average Household Size in Kinston
Average Household Size in Kinston is 2.2 People.
How Large is the Labor Force in Kinston?
There are 7,809 People in the Labor Forcein in Kinston.
What is the Percentage of People in the Labor Force in Kinston?
49.0% of People are in the Labor Force in Kinston.
What is the Unemployment Rate in Kinston?
Unemployment Rate in Kinston is 13.6%.