Clemmons, NC Map & Demographics
Clemmons Map
Clemmons Overview
$44,978
PER CAPITA INCOME
$111,113
AVG FAMILY INCOME
$75,667
AVG HOUSEHOLD INCOME
32.0%
WAGE / INCOME GAP [ % ]
68.0¢/ $1
WAGE / INCOME GAP [ $ ]
$13,181
FAMILY INCOME DEFICIT
0.44
INEQUALITY / GINI INDEX
21,281
TOTAL POPULATION
10,332
MALE POPULATION
10,949
FEMALE POPULATION
94.36
MALES / 100 FEMALES
105.97
FEMALES / 100 MALES
42.4
MEDIAN AGE
3.0
AVG FAMILY SIZE
2.4
AVG HOUSEHOLD SIZE
10,513
LABOR FORCE [ PEOPLE ]
61.3%
PERCENT IN LABOR FORCE
5.0%
UNEMPLOYMENT RATE
Clemmons Zip Codes
Clemmons Area Codes
Income in Clemmons
Income Overview in Clemmons
Per Capita Income in Clemmons is $44,978, while median incomes of families and households are $111,113 and $75,667 respectively.
| Characteristic | Number | Measure |
| Per Capita Income | 21,281 | $44,978 |
| Median Family Income | 5,820 | $111,113 |
| Mean Family Income | 5,820 | $131,100 |
| Median Household Income | 8,748 | $75,667 |
| Mean Household Income | 8,748 | $106,556 |
| Income Deficit | 5,820 | $13,181 |
| Wage / Income Gap (%) | 21,281 | 32.04% |
| Wage / Income Gap ($) | 21,281 | 67.96¢ per $1 |
| Gini / Inequality Index | 21,281 | 0.44 |
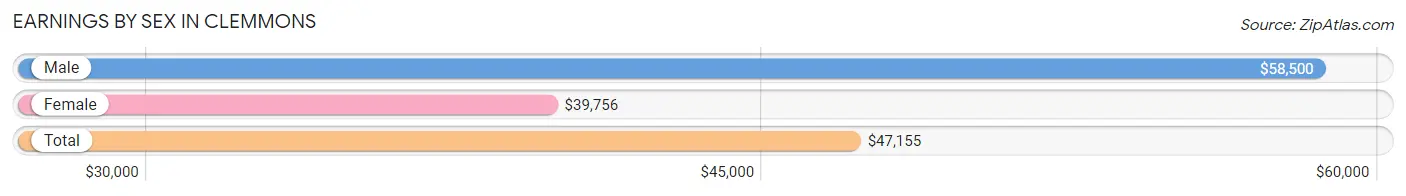
Earnings by Sex in Clemmons
Average Earnings in Clemmons are $47,155, $58,500 for men and $39,756 for women, a difference of 32.0%.
| Sex | Number | Average Earnings |
| Male | 5,816 (53.5%) | $58,500 |
| Female | 5,063 (46.5%) | $39,756 |
| Total | 10,879 (100.0%) | $47,155 |
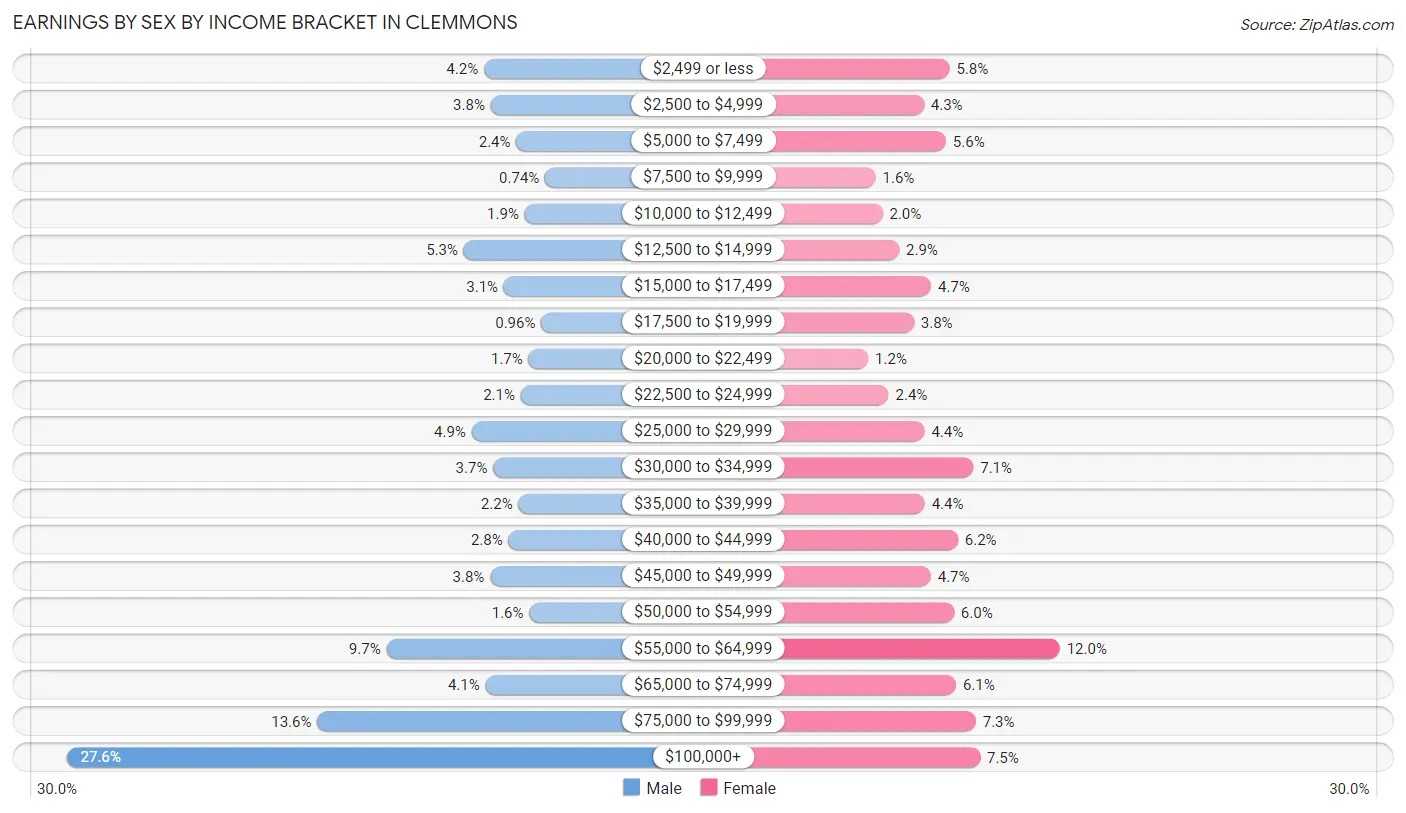
Earnings by Sex by Income Bracket in Clemmons
The most common earnings brackets in Clemmons are $100,000+ for men (1,604 | 27.6%) and $55,000 to $64,999 for women (606 | 12.0%).
| Income | Male | Female |
| $2,499 or less | 243 (4.2%) | 292 (5.8%) |
| $2,500 to $4,999 | 221 (3.8%) | 219 (4.3%) |
| $5,000 to $7,499 | 137 (2.4%) | 282 (5.6%) |
| $7,500 to $9,999 | 43 (0.7%) | 82 (1.6%) |
| $10,000 to $12,499 | 110 (1.9%) | 102 (2.0%) |
| $12,500 to $14,999 | 309 (5.3%) | 149 (2.9%) |
| $15,000 to $17,499 | 178 (3.1%) | 240 (4.7%) |
| $17,500 to $19,999 | 56 (1.0%) | 191 (3.8%) |
| $20,000 to $22,499 | 97 (1.7%) | 61 (1.2%) |
| $22,500 to $24,999 | 123 (2.1%) | 119 (2.4%) |
| $25,000 to $29,999 | 283 (4.9%) | 221 (4.4%) |
| $30,000 to $34,999 | 213 (3.7%) | 360 (7.1%) |
| $35,000 to $39,999 | 130 (2.2%) | 222 (4.4%) |
| $40,000 to $44,999 | 163 (2.8%) | 316 (6.2%) |
| $45,000 to $49,999 | 223 (3.8%) | 239 (4.7%) |
| $50,000 to $54,999 | 95 (1.6%) | 305 (6.0%) |
| $55,000 to $64,999 | 562 (9.7%) | 606 (12.0%) |
| $65,000 to $74,999 | 238 (4.1%) | 311 (6.1%) |
| $75,000 to $99,999 | 788 (13.6%) | 367 (7.2%) |
| $100,000+ | 1,604 (27.6%) | 379 (7.5%) |
| Total | 5,816 (100.0%) | 5,063 (100.0%) |
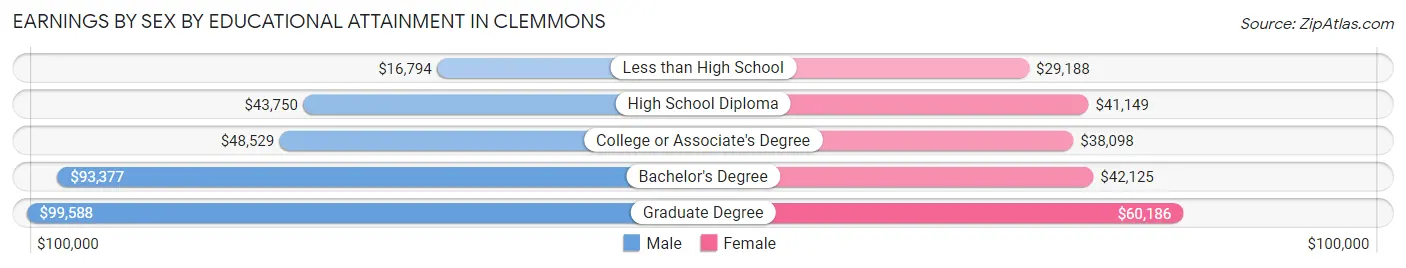
Earnings by Sex by Educational Attainment in Clemmons
Average earnings in Clemmons are $69,220 for men and $43,924 for women, a difference of 36.5%. Men with an educational attainment of graduate degree enjoy the highest average annual earnings of $99,588, while those with less than high school education earn the least with $16,794. Women with an educational attainment of graduate degree earn the most with the average annual earnings of $60,186, while those with less than high school education have the smallest earnings of $29,188.
| Educational Attainment | Male Income | Female Income |
| Less than High School | $16,794 | $29,188 |
| High School Diploma | $43,750 | $41,149 |
| College or Associate's Degree | $48,529 | $38,098 |
| Bachelor's Degree | $93,377 | $42,125 |
| Graduate Degree | $99,588 | $60,186 |
| Total | $69,220 | $43,924 |
Family Income in Clemmons
Family Income Brackets in Clemmons
According to the Clemmons family income data, there are 1,216 families falling into the $100,000 to $149,999 income range, which is the most common income bracket and makes up 20.9% of all families. Conversely, the $10,000 to $14,999 income bracket is the least frequent group with only 52 families (0.9%) belonging to this category.
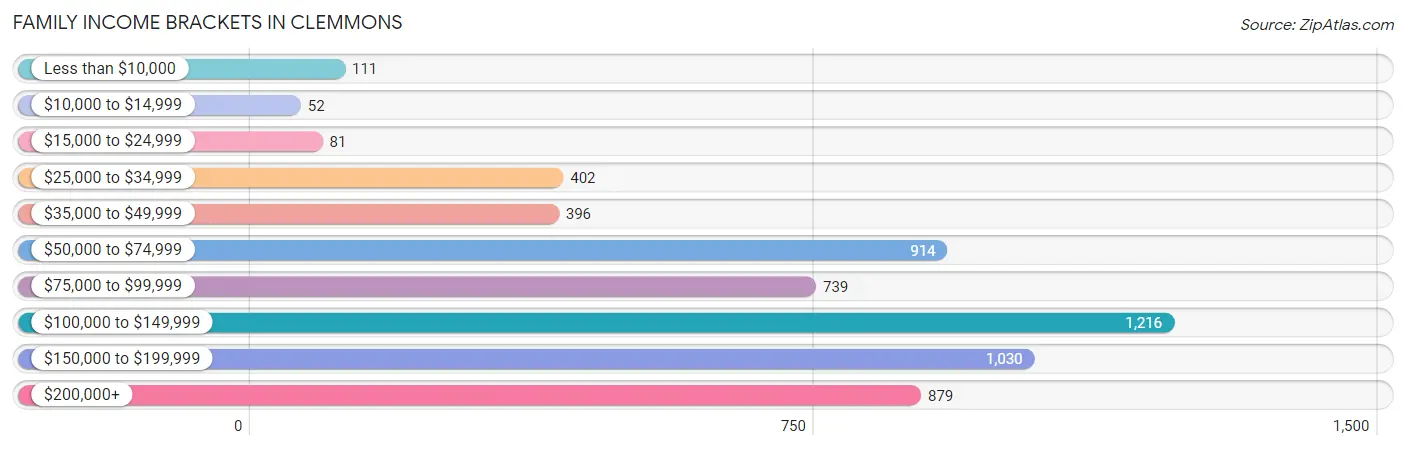
| Income Bracket | # Families | % Families |
| Less than $10,000 | 111 | 1.9% |
| $10,000 to $14,999 | 52 | 0.9% |
| $15,000 to $24,999 | 81 | 1.4% |
| $25,000 to $34,999 | 402 | 6.9% |
| $35,000 to $49,999 | 396 | 6.8% |
| $50,000 to $74,999 | 914 | 15.7% |
| $75,000 to $99,999 | 739 | 12.7% |
| $100,000 to $149,999 | 1,216 | 20.9% |
| $150,000 to $199,999 | 1,030 | 17.7% |
| $200,000+ | 879 | 15.1% |
Family Income by Famaliy Size in Clemmons
4-person families (1,096 | 18.8%) account for the highest median family income in Clemmons with $138,214 per family, while 2-person families (2,976 | 51.1%) have the highest median income of $46,654 per family member.
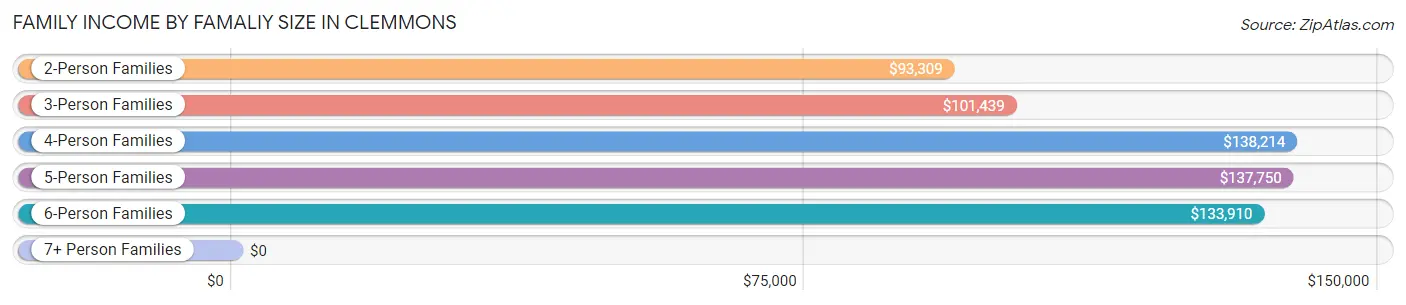
| Income Bracket | # Families | Median Income |
| 2-Person Families | 2,976 (51.1%) | $93,309 |
| 3-Person Families | 1,190 (20.4%) | $101,439 |
| 4-Person Families | 1,096 (18.8%) | $138,214 |
| 5-Person Families | 350 (6.0%) | $137,750 |
| 6-Person Families | 152 (2.6%) | $133,910 |
| 7+ Person Families | 56 (1.0%) | $0 |
| Total | 5,820 (100.0%) | $111,113 |
Family Income by Number of Earners in Clemmons
The median family income in Clemmons is $111,113, with families comprising 3+ earners (634) having the highest median family income of $182,500, while families with no earners (1,119) have the lowest median family income of $58,646, accounting for 10.9% and 19.2% of families, respectively.
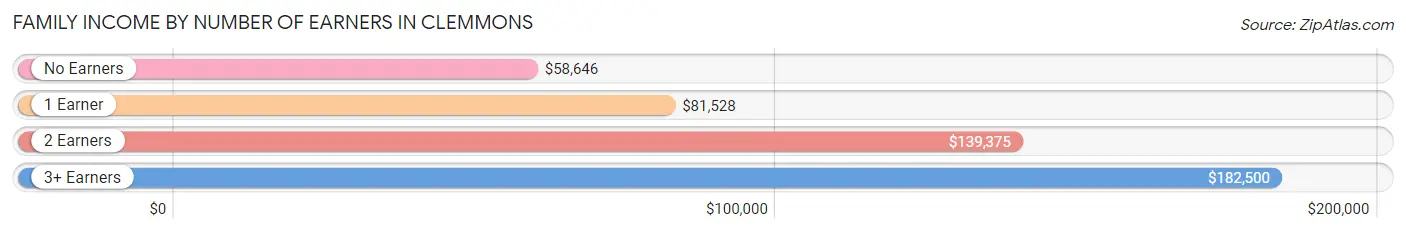
| Number of Earners | # Families | Median Income |
| No Earners | 1,119 (19.2%) | $58,646 |
| 1 Earner | 1,733 (29.8%) | $81,528 |
| 2 Earners | 2,334 (40.1%) | $139,375 |
| 3+ Earners | 634 (10.9%) | $182,500 |
| Total | 5,820 (100.0%) | $111,113 |
Household Income in Clemmons
Household Income Brackets in Clemmons
With 1,610 households falling in the category, the $50,000 to $74,999 income range is the most frequent in Clemmons, accounting for 18.4% of all households. In contrast, only 210 households (2.4%) fall into the $10,000 to $14,999 income bracket, making it the least populous group.
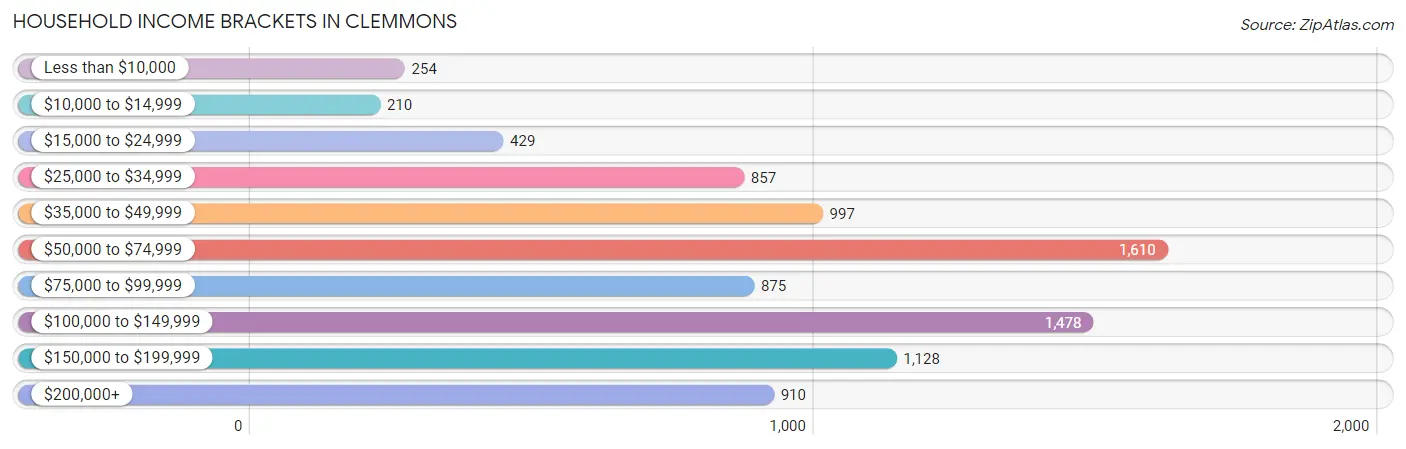
| Income Bracket | # Households | % Households |
| Less than $10,000 | 254 | 2.9% |
| $10,000 to $14,999 | 210 | 2.4% |
| $15,000 to $24,999 | 429 | 4.9% |
| $25,000 to $34,999 | 857 | 9.8% |
| $35,000 to $49,999 | 997 | 11.4% |
| $50,000 to $74,999 | 1,610 | 18.4% |
| $75,000 to $99,999 | 875 | 10.0% |
| $100,000 to $149,999 | 1,478 | 16.9% |
| $150,000 to $199,999 | 1,128 | 12.9% |
| $200,000+ | 910 | 10.4% |
Household Income by Householder Age in Clemmons
The median household income in Clemmons is $75,667, with the highest median household income of $95,395 found in the 45 to 64 years age bracket for the primary householder. A total of 3,336 households (38.1%) fall into this category. Meanwhile, the 15 to 24 years age bracket for the primary householder has the lowest median household income of $0, with 176 households (2.0%) in this group.
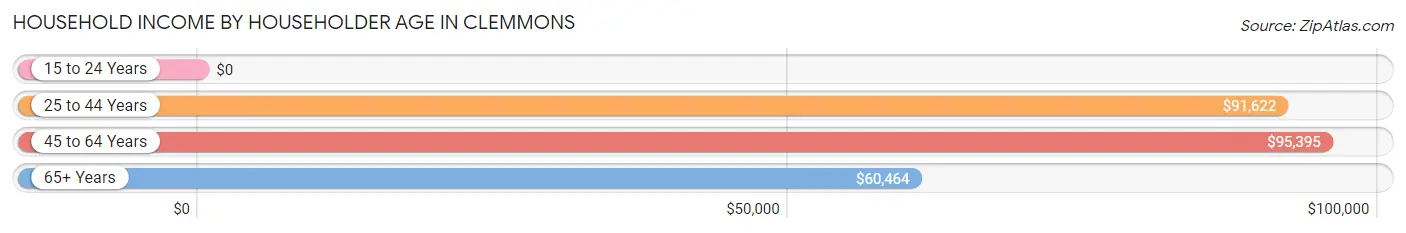
| Income Bracket | # Households | Median Income |
| 15 to 24 Years | 176 (2.0%) | $0 |
| 25 to 44 Years | 2,735 (31.3%) | $91,622 |
| 45 to 64 Years | 3,336 (38.1%) | $95,395 |
| 65+ Years | 2,501 (28.6%) | $60,464 |
| Total | 8,748 (100.0%) | $75,667 |
Poverty in Clemmons
Income Below Poverty by Sex and Age in Clemmons
With 5.3% poverty level for males and 8.1% for females among the residents of Clemmons, 16 and 17 year old males and 15 year old females are the most vulnerable to poverty, with 29 males (11.6%) and 82 females (64.1%) in their respective age groups living below the poverty level.
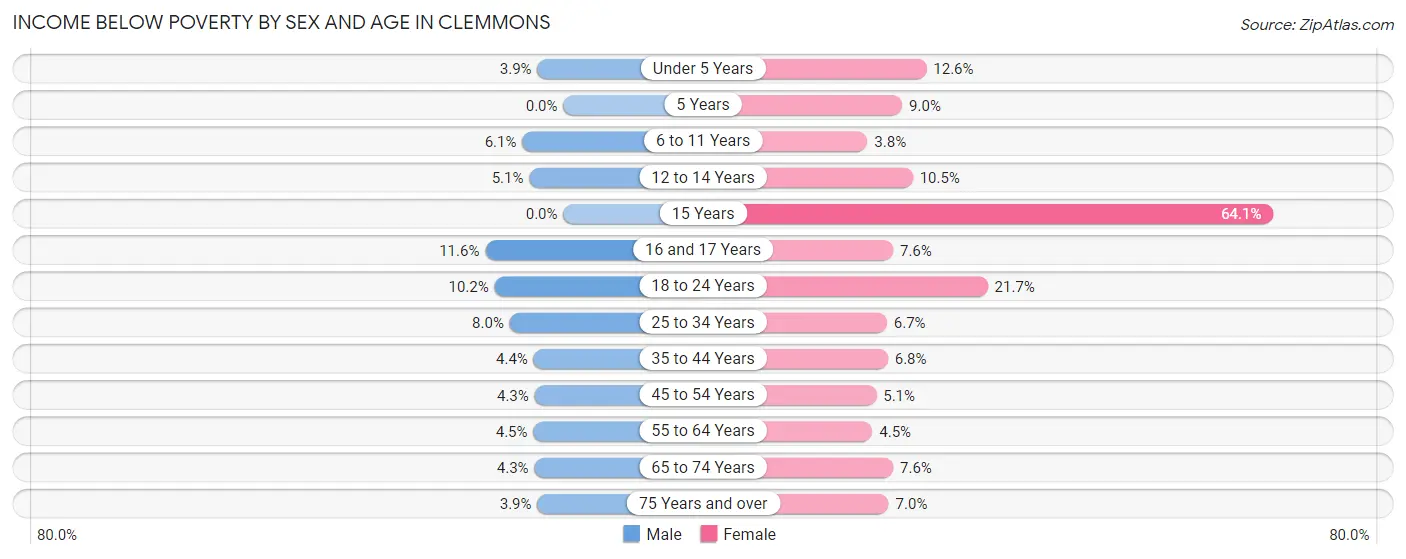
| Age Bracket | Male | Female |
| Under 5 Years | 25 (3.8%) | 55 (12.6%) |
| 5 Years | 0 (0.0%) | 6 (9.0%) |
| 6 to 11 Years | 55 (6.1%) | 28 (3.8%) |
| 12 to 14 Years | 19 (5.1%) | 52 (10.5%) |
| 15 Years | 0 (0.0%) | 82 (64.1%) |
| 16 and 17 Years | 29 (11.6%) | 14 (7.6%) |
| 18 to 24 Years | 92 (10.2%) | 138 (21.7%) |
| 25 to 34 Years | 71 (8.0%) | 86 (6.7%) |
| 35 to 44 Years | 66 (4.4%) | 97 (6.8%) |
| 45 to 54 Years | 60 (4.3%) | 65 (5.1%) |
| 55 to 64 Years | 58 (4.4%) | 79 (4.5%) |
| 65 to 74 Years | 42 (4.3%) | 92 (7.6%) |
| 75 Years and over | 31 (3.9%) | 86 (7.0%) |
| Total | 548 (5.3%) | 880 (8.1%) |
Income Above Poverty by Sex and Age in Clemmons
According to the poverty statistics in Clemmons, males aged 5 years and females aged 6 to 11 years are the age groups that are most secure financially, with 100.0% of males and 96.2% of females in these age groups living above the poverty line.
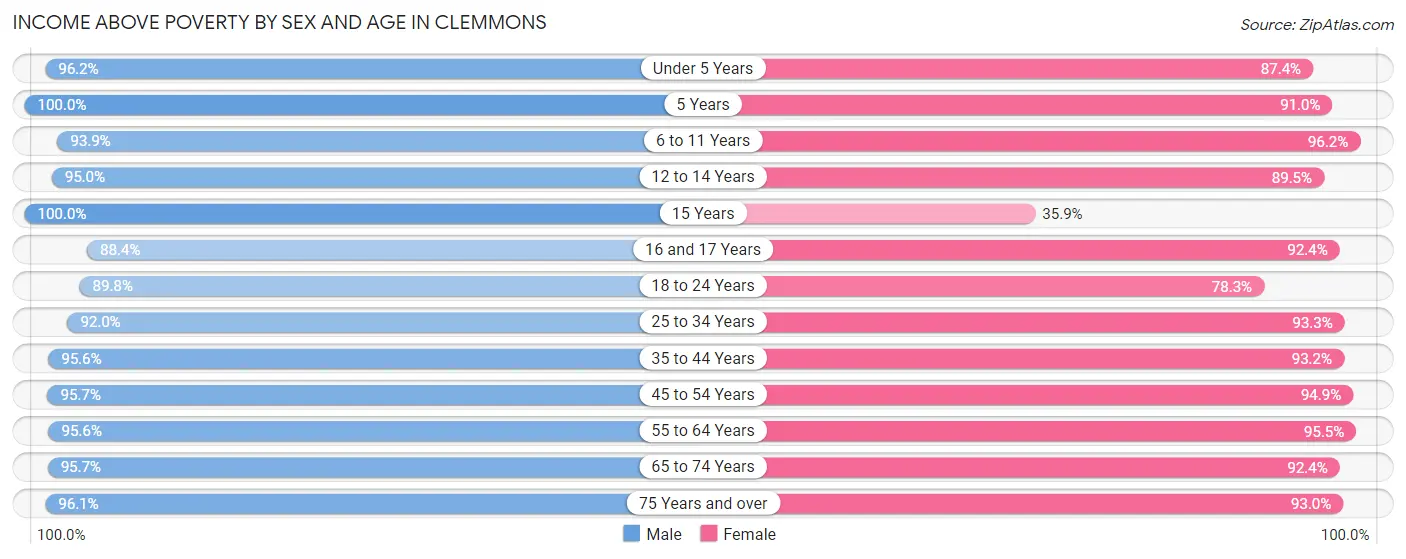
| Age Bracket | Male | Female |
| Under 5 Years | 625 (96.2%) | 383 (87.4%) |
| 5 Years | 239 (100.0%) | 61 (91.0%) |
| 6 to 11 Years | 847 (93.9%) | 709 (96.2%) |
| 12 to 14 Years | 357 (95.0%) | 442 (89.5%) |
| 15 Years | 92 (100.0%) | 46 (35.9%) |
| 16 and 17 Years | 221 (88.4%) | 170 (92.4%) |
| 18 to 24 Years | 808 (89.8%) | 499 (78.3%) |
| 25 to 34 Years | 821 (92.0%) | 1,199 (93.3%) |
| 35 to 44 Years | 1,432 (95.6%) | 1,324 (93.2%) |
| 45 to 54 Years | 1,346 (95.7%) | 1,204 (94.9%) |
| 55 to 64 Years | 1,246 (95.6%) | 1,662 (95.5%) |
| 65 to 74 Years | 938 (95.7%) | 1,115 (92.4%) |
| 75 Years and over | 772 (96.1%) | 1,150 (93.0%) |
| Total | 9,744 (94.7%) | 9,964 (91.9%) |
Income Below Poverty Among Married-Couple Families in Clemmons
The poverty statistics for married-couple families in Clemmons show that 3.0% or 139 of the total 4,637 families live below the poverty line. Families with 3 or 4 children have the highest poverty rate of 11.0%, comprising of 40 families. On the other hand, families with 1 or 2 children have the lowest poverty rate of 0.8%, which includes 11 families.
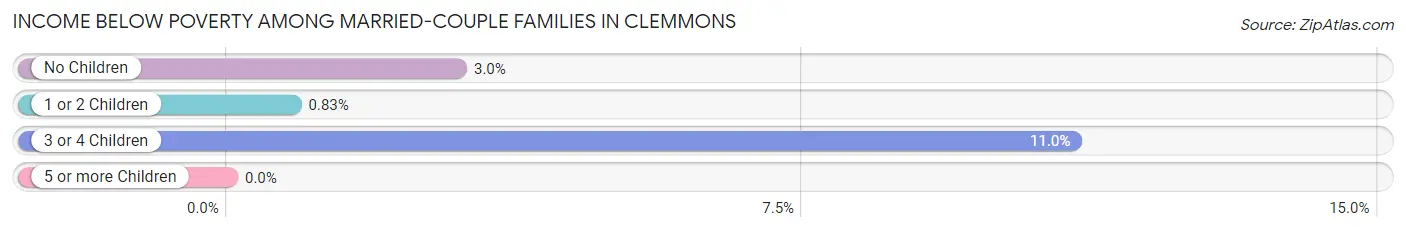
| Children | Above Poverty | Below Poverty |
| No Children | 2,859 (97.0%) | 88 (3.0%) |
| 1 or 2 Children | 1,316 (99.2%) | 11 (0.8%) |
| 3 or 4 Children | 323 (89.0%) | 40 (11.0%) |
| 5 or more Children | 0 (0.0%) | 0 (0.0%) |
| Total | 4,498 (97.0%) | 139 (3.0%) |
Income Below Poverty Among Single-Parent Households in Clemmons
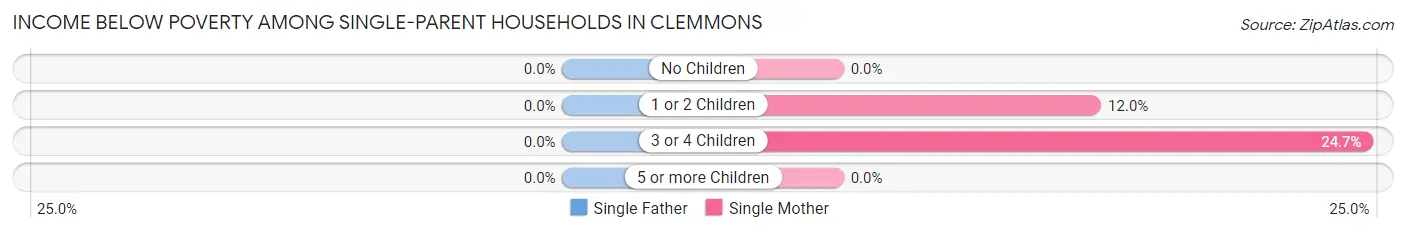
| Children | Single Father | Single Mother |
| No Children | 0 (0.0%) | 0 (0.0%) |
| 1 or 2 Children | 0 (0.0%) | 74 (12.0%) |
| 3 or 4 Children | 0 (0.0%) | 18 (24.7%) |
| 5 or more Children | 0 (0.0%) | 0 (0.0%) |
| Total | 0 (0.0%) | 92 (10.7%) |
Income Below Poverty Among Married-Couple vs Single-Parent Households in Clemmons
The poverty data for Clemmons shows that 139 of the married-couple family households (3.0%) and 92 of the single-parent households (7.8%) are living below the poverty level. Within the married-couple family households, those with 3 or 4 children have the highest poverty rate, with 40 households (11.0%) falling below the poverty line. Among the single-parent households, those with 3 or 4 children have the highest poverty rate, with 18 household (11.9%) living below poverty.
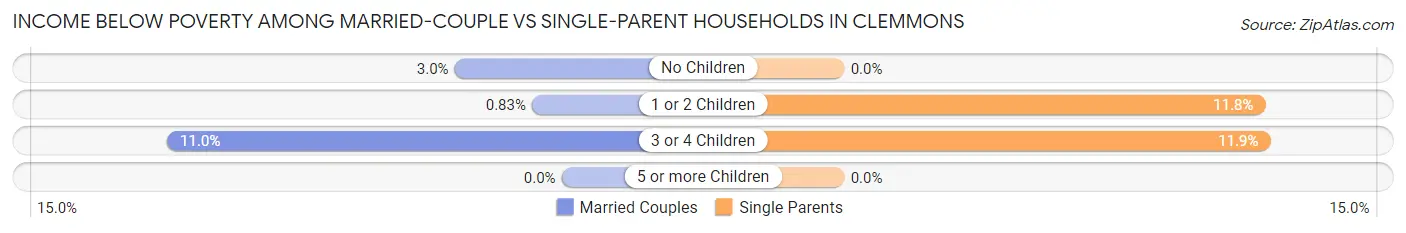
| Children | Married-Couple Families | Single-Parent Households |
| No Children | 88 (3.0%) | 0 (0.0%) |
| 1 or 2 Children | 11 (0.8%) | 74 (11.8%) |
| 3 or 4 Children | 40 (11.0%) | 18 (11.9%) |
| 5 or more Children | 0 (0.0%) | 0 (0.0%) |
| Total | 139 (3.0%) | 92 (7.8%) |
Race in Clemmons
The most populous races in Clemmons are White / Caucasian (17,028 | 80.0%), Black / African American (1,382 | 6.5%), and Two or more Races (1,288 | 6.0%).
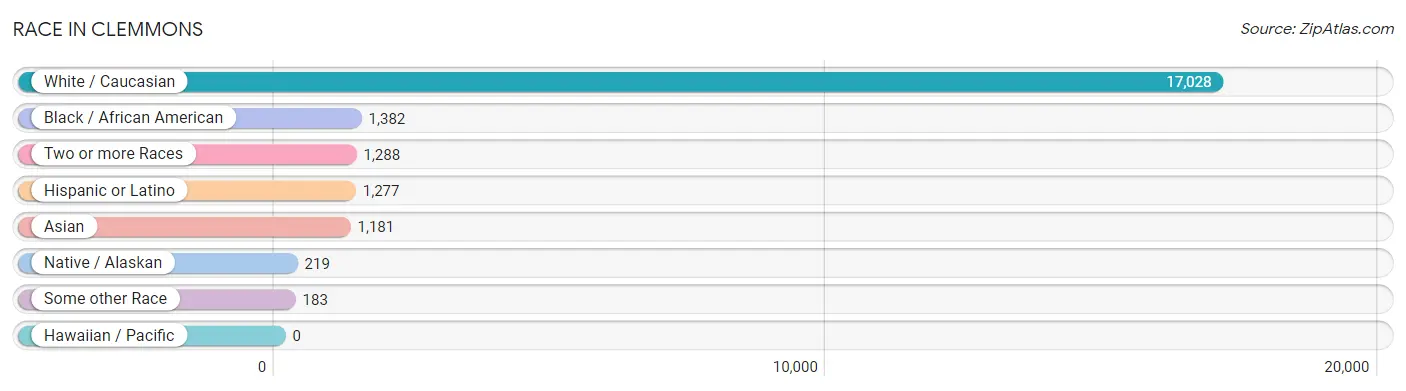
| Race | # Population | % Population |
| Asian | 1,181 | 5.6% |
| Black / African American | 1,382 | 6.5% |
| Hawaiian / Pacific | 0 | 0.0% |
| Hispanic or Latino | 1,277 | 6.0% |
| Native / Alaskan | 219 | 1.0% |
| White / Caucasian | 17,028 | 80.0% |
| Two or more Races | 1,288 | 6.0% |
| Some other Race | 183 | 0.9% |
| Total | 21,281 | 100.0% |
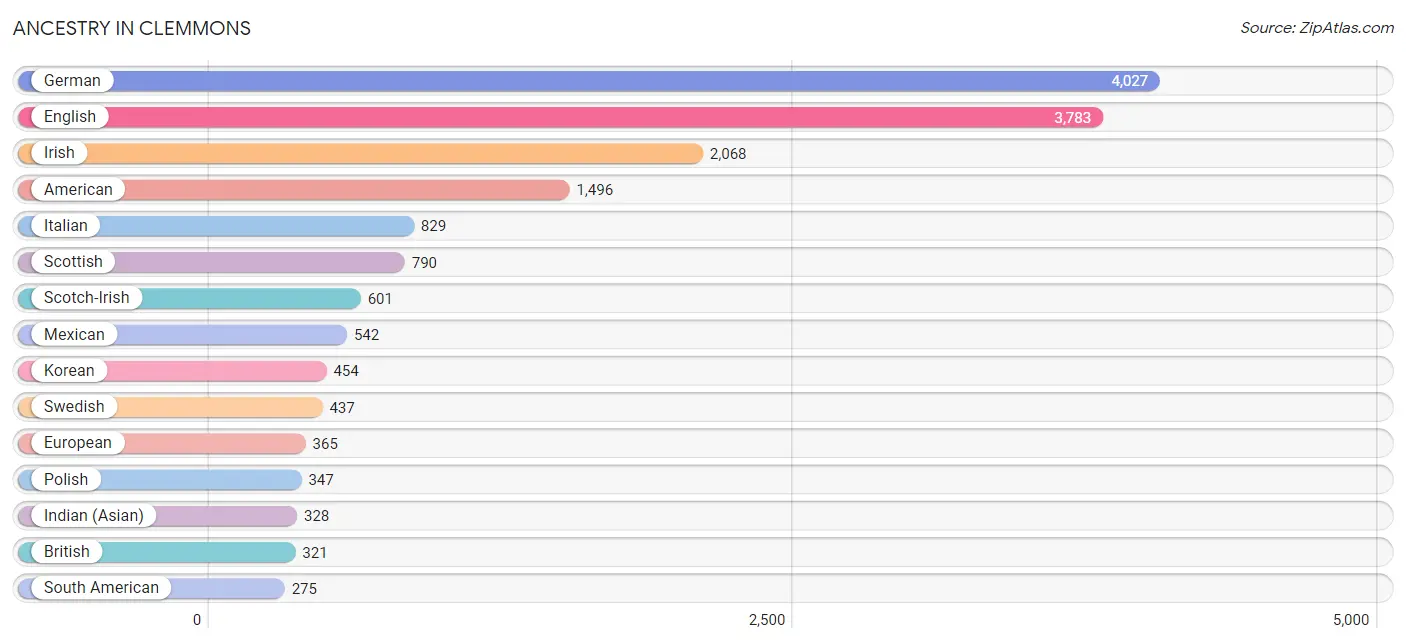
Ancestry in Clemmons
The most populous ancestries reported in Clemmons are German (4,027 | 18.9%), English (3,783 | 17.8%), Irish (2,068 | 9.7%), American (1,496 | 7.0%), and Italian (829 | 3.9%), together accounting for 57.4% of all Clemmons residents.
| Ancestry | # Population | % Population |
| African | 9 | 0.0% |
| Albanian | 33 | 0.2% |
| American | 1,496 | 7.0% |
| Arab | 151 | 0.7% |
| Armenian | 10 | 0.1% |
| Bhutanese | 42 | 0.2% |
| Blackfeet | 5 | 0.0% |
| British | 321 | 1.5% |
| Burmese | 11 | 0.1% |
| Canadian | 72 | 0.3% |
| Central American | 75 | 0.4% |
| Central American Indian | 203 | 0.9% |
| Cherokee | 104 | 0.5% |
| Colombian | 71 | 0.3% |
| Cuban | 127 | 0.6% |
| Czech | 50 | 0.2% |
| Czechoslovakian | 49 | 0.2% |
| Danish | 69 | 0.3% |
| Dutch | 204 | 1.0% |
| Eastern European | 44 | 0.2% |
| Egyptian | 69 | 0.3% |
| English | 3,783 | 17.8% |
| Estonian | 12 | 0.1% |
| European | 365 | 1.7% |
| Filipino | 238 | 1.1% |
| Finnish | 81 | 0.4% |
| French | 245 | 1.1% |
| French Canadian | 98 | 0.5% |
| German | 4,027 | 18.9% |
| Greek | 196 | 0.9% |
| Guatemalan | 29 | 0.1% |
| Haitian | 9 | 0.0% |
| Hungarian | 9 | 0.0% |
| Indian (Asian) | 328 | 1.5% |
| Irish | 2,068 | 9.7% |
| Italian | 829 | 3.9% |
| Jamaican | 27 | 0.1% |
| Japanese | 22 | 0.1% |
| Korean | 454 | 2.1% |
| Lebanese | 25 | 0.1% |
| Lithuanian | 38 | 0.2% |
| Lumbee | 34 | 0.2% |
| Mexican | 542 | 2.5% |
| Moroccan | 11 | 0.1% |
| Native Hawaiian | 33 | 0.2% |
| Nicaraguan | 19 | 0.1% |
| Nigerian | 9 | 0.0% |
| Northern European | 24 | 0.1% |
| Norwegian | 142 | 0.7% |
| Pakistani | 99 | 0.5% |
| Peruvian | 84 | 0.4% |
| Polish | 347 | 1.6% |
| Puerto Rican | 62 | 0.3% |
| Russian | 70 | 0.3% |
| Salvadoran | 27 | 0.1% |
| Scandinavian | 18 | 0.1% |
| Scotch-Irish | 601 | 2.8% |
| Scottish | 790 | 3.7% |
| Slovak | 62 | 0.3% |
| South American | 275 | 1.3% |
| Spaniard | 100 | 0.5% |
| Spanish | 85 | 0.4% |
| Sri Lankan | 55 | 0.3% |
| Subsaharan African | 33 | 0.2% |
| Swedish | 437 | 2.1% |
| Swiss | 48 | 0.2% |
| Thai | 209 | 1.0% |
| Ukrainian | 41 | 0.2% |
| Uruguayan | 45 | 0.2% |
| Venezuelan | 75 | 0.4% |
| Welsh | 151 | 0.7% |
| Yugoslavian | 8 | 0.0% | View All 72 Rows |
Immigrants in Clemmons
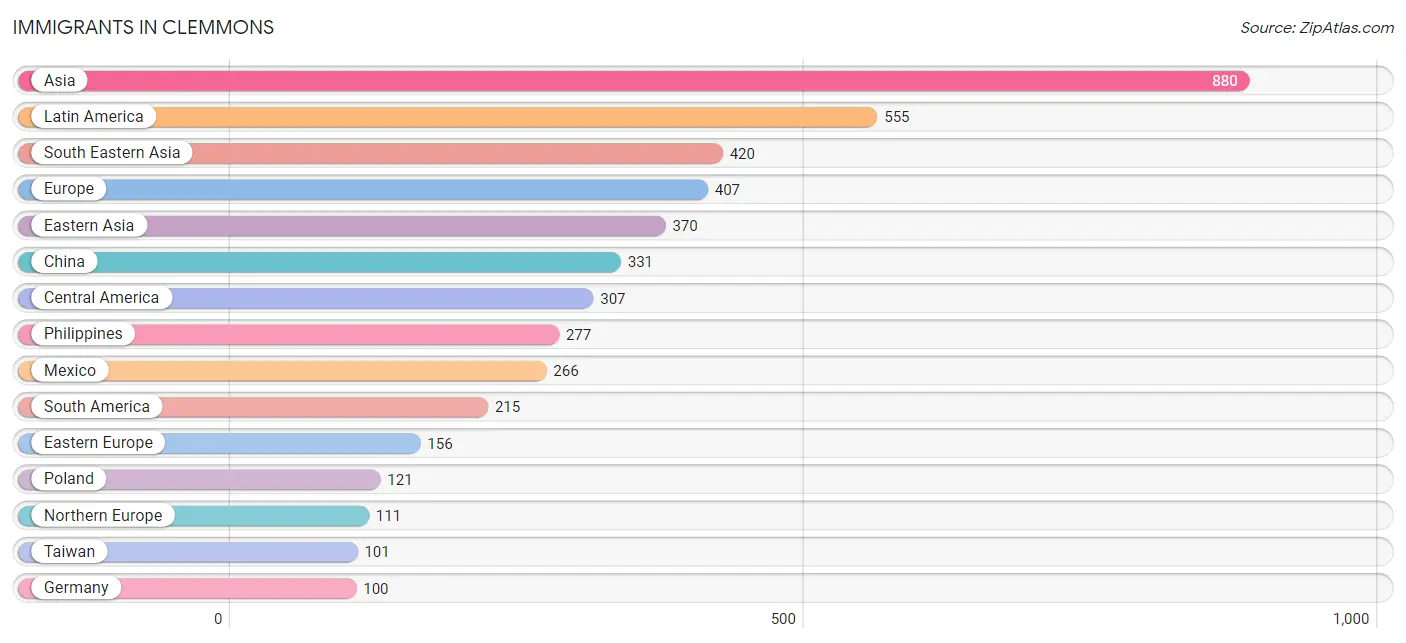
The most numerous immigrant groups reported in Clemmons came from Asia (880 | 4.1%), Latin America (555 | 2.6%), South Eastern Asia (420 | 2.0%), Europe (407 | 1.9%), and Eastern Asia (370 | 1.7%), together accounting for 12.4% of all Clemmons residents.
| Immigration Origin | # Population | % Population |
| Africa | 85 | 0.4% |
| Albania | 27 | 0.1% |
| Asia | 880 | 4.1% |
| Bosnia and Herzegovina | 8 | 0.0% |
| Cambodia | 22 | 0.1% |
| Canada | 50 | 0.2% |
| Caribbean | 33 | 0.2% |
| Central America | 307 | 1.4% |
| China | 331 | 1.6% |
| Colombia | 65 | 0.3% |
| Cuba | 24 | 0.1% |
| Eastern Asia | 370 | 1.7% |
| Eastern Europe | 156 | 0.7% |
| Egypt | 69 | 0.3% |
| El Salvador | 15 | 0.1% |
| England | 5 | 0.0% |
| Europe | 407 | 1.9% |
| Germany | 100 | 0.5% |
| Greece | 40 | 0.2% |
| Guatemala | 26 | 0.1% |
| Haiti | 9 | 0.0% |
| Hong Kong | 13 | 0.1% |
| India | 45 | 0.2% |
| Iraq | 16 | 0.1% |
| Japan | 28 | 0.1% |
| Jordan | 4 | 0.0% |
| Korea | 11 | 0.1% |
| Latin America | 555 | 2.6% |
| Mexico | 266 | 1.3% |
| Northern Africa | 69 | 0.3% |
| Northern Europe | 111 | 0.5% |
| Pakistan | 25 | 0.1% |
| Peru | 30 | 0.1% |
| Philippines | 277 | 1.3% |
| Poland | 121 | 0.6% |
| Scotland | 30 | 0.1% |
| South Africa | 16 | 0.1% |
| South America | 215 | 1.0% |
| South Central Asia | 70 | 0.3% |
| South Eastern Asia | 420 | 2.0% |
| Southern Europe | 40 | 0.2% |
| Taiwan | 101 | 0.5% |
| Thailand | 99 | 0.5% |
| Uruguay | 45 | 0.2% |
| Venezuela | 75 | 0.4% |
| Vietnam | 22 | 0.1% |
| Western Asia | 20 | 0.1% |
| Western Europe | 100 | 0.5% | View All 48 Rows |
Sex and Age in Clemmons
Sex and Age in Clemmons
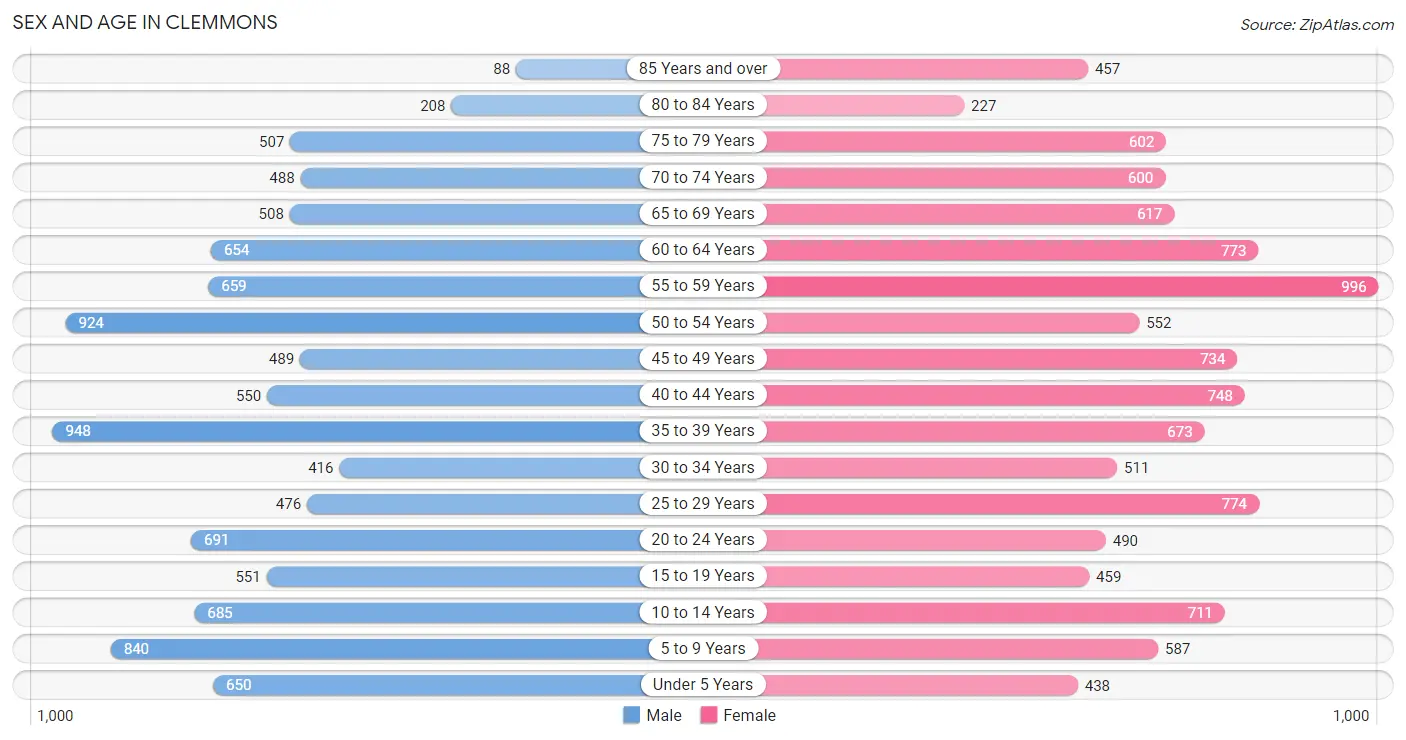
The most populous age groups in Clemmons are 35 to 39 Years (948 | 9.2%) for men and 55 to 59 Years (996 | 9.1%) for women.
| Age Bracket | Male | Female |
| Under 5 Years | 650 (6.3%) | 438 (4.0%) |
| 5 to 9 Years | 840 (8.1%) | 587 (5.4%) |
| 10 to 14 Years | 685 (6.6%) | 711 (6.5%) |
| 15 to 19 Years | 551 (5.3%) | 459 (4.2%) |
| 20 to 24 Years | 691 (6.7%) | 490 (4.5%) |
| 25 to 29 Years | 476 (4.6%) | 774 (7.1%) |
| 30 to 34 Years | 416 (4.0%) | 511 (4.7%) |
| 35 to 39 Years | 948 (9.2%) | 673 (6.1%) |
| 40 to 44 Years | 550 (5.3%) | 748 (6.8%) |
| 45 to 49 Years | 489 (4.7%) | 734 (6.7%) |
| 50 to 54 Years | 924 (8.9%) | 552 (5.0%) |
| 55 to 59 Years | 659 (6.4%) | 996 (9.1%) |
| 60 to 64 Years | 654 (6.3%) | 773 (7.1%) |
| 65 to 69 Years | 508 (4.9%) | 617 (5.6%) |
| 70 to 74 Years | 488 (4.7%) | 600 (5.5%) |
| 75 to 79 Years | 507 (4.9%) | 602 (5.5%) |
| 80 to 84 Years | 208 (2.0%) | 227 (2.1%) |
| 85 Years and over | 88 (0.9%) | 457 (4.2%) |
| Total | 10,332 (100.0%) | 10,949 (100.0%) |
Families and Households in Clemmons
Median Family Size in Clemmons
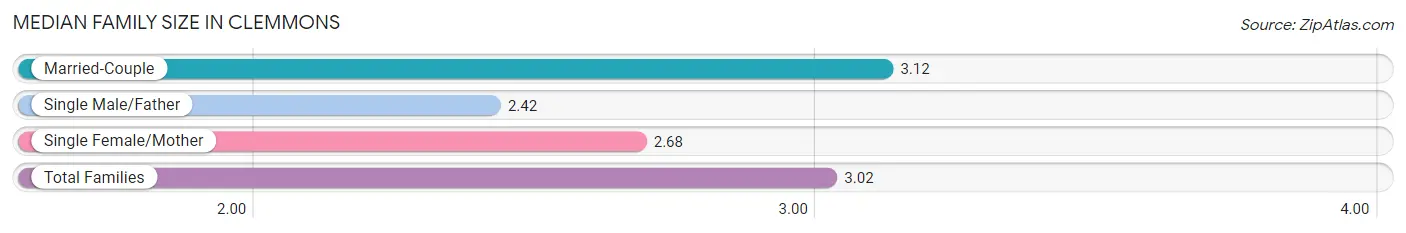
The median family size in Clemmons is 3.02 persons per family, with married-couple families (4,637 | 79.7%) accounting for the largest median family size of 3.12 persons per family. On the other hand, single male/father families (325 | 5.6%) represent the smallest median family size with 2.42 persons per family.
| Family Type | # Families | Family Size |
| Married-Couple | 4,637 (79.7%) | 3.12 |
| Single Male/Father | 325 (5.6%) | 2.42 |
| Single Female/Mother | 858 (14.7%) | 2.68 |
| Total Families | 5,820 (100.0%) | 3.02 |
Median Household Size in Clemmons
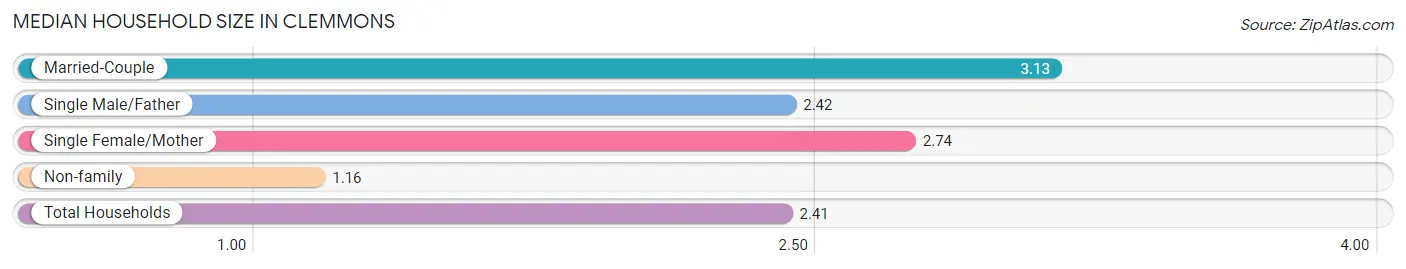
The median household size in Clemmons is 2.41 persons per household, with married-couple households (4,637 | 53.0%) accounting for the largest median household size of 3.13 persons per household. non-family households (2,928 | 33.5%) represent the smallest median household size with 1.16 persons per household.
| Household Type | # Households | Household Size |
| Married-Couple | 4,637 (53.0%) | 3.13 |
| Single Male/Father | 325 (3.7%) | 2.42 |
| Single Female/Mother | 858 (9.8%) | 2.74 |
| Non-family | 2,928 (33.5%) | 1.16 |
| Total Households | 8,748 (100.0%) | 2.41 |
Household Size by Marriage Status in Clemmons
Out of a total of 8,748 households in Clemmons, 5,820 (66.5%) are family households, while 2,928 (33.5%) are nonfamily households. The most numerous type of family households are 2-person households, comprising 2,913, and the most common type of nonfamily households are 1-person households, comprising 2,570.
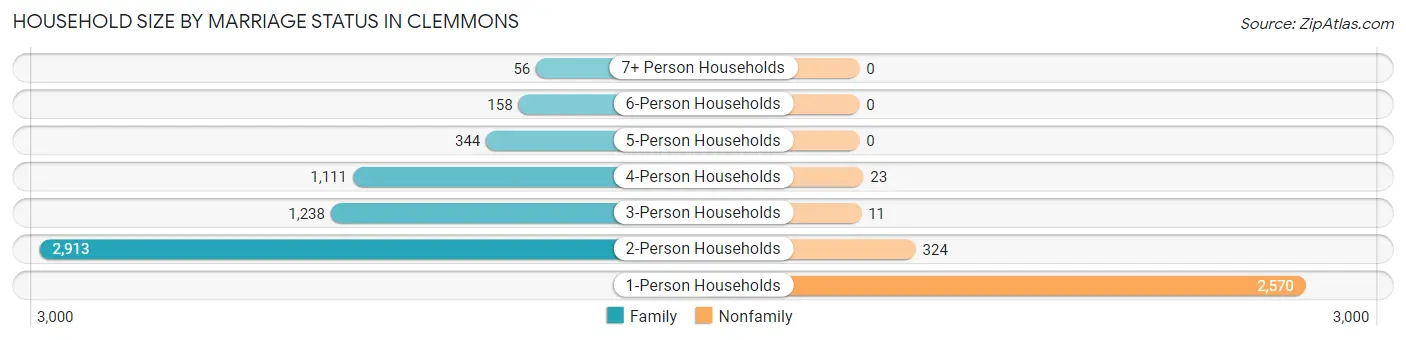
| Household Size | Family Households | Nonfamily Households |
| 1-Person Households | - | 2,570 (29.4%) |
| 2-Person Households | 2,913 (33.3%) | 324 (3.7%) |
| 3-Person Households | 1,238 (14.1%) | 11 (0.1%) |
| 4-Person Households | 1,111 (12.7%) | 23 (0.3%) |
| 5-Person Households | 344 (3.9%) | 0 (0.0%) |
| 6-Person Households | 158 (1.8%) | 0 (0.0%) |
| 7+ Person Households | 56 (0.6%) | 0 (0.0%) |
| Total | 5,820 (66.5%) | 2,928 (33.5%) |
Female Fertility in Clemmons
Fertility by Age in Clemmons
Average fertility rate in Clemmons is 36.0 births per 1,000 women. Women in the age bracket of 20 to 34 years have the highest fertility rate with 72.0 births per 1,000 women. Women in the age bracket of 20 to 34 years acount for 81.0% of all women with births.
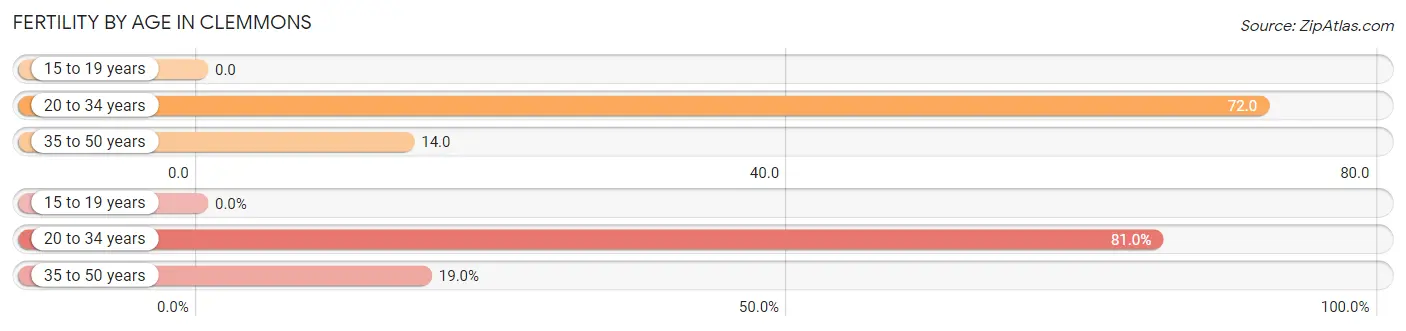
| Age Bracket | Women with Births | Births / 1,000 Women |
| 15 to 19 years | 0 (0.0%) | 0.0 |
| 20 to 34 years | 128 (81.0%) | 72.0 |
| 35 to 50 years | 30 (19.0%) | 14.0 |
| Total | 158 (100.0%) | 36.0 |
Fertility by Age by Marriage Status in Clemmons
62.7% of women with births (158) in Clemmons are married. The highest percentage of unmarried women with births falls into 20 to 34 years age bracket with 46.1% of them unmarried at the time of birth, while the lowest percentage of unmarried women with births belong to 35 to 50 years age bracket with 0.0% of them unmarried.
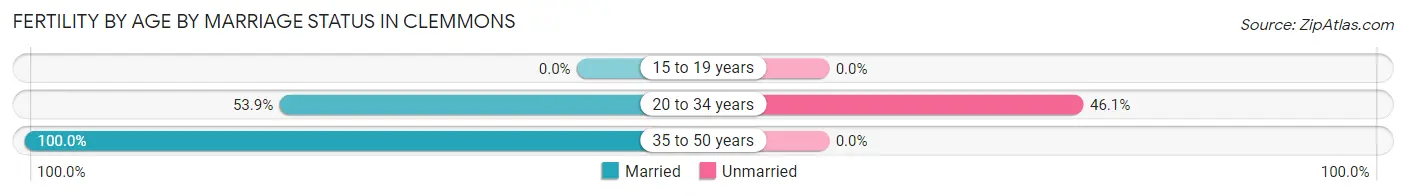
| Age Bracket | Married | Unmarried |
| 15 to 19 years | 0 (0.0%) | 0 (0.0%) |
| 20 to 34 years | 69 (53.9%) | 59 (46.1%) |
| 35 to 50 years | 30 (100.0%) | 0 (0.0%) |
| Total | 99 (62.7%) | 59 (37.3%) |
Fertility by Education in Clemmons
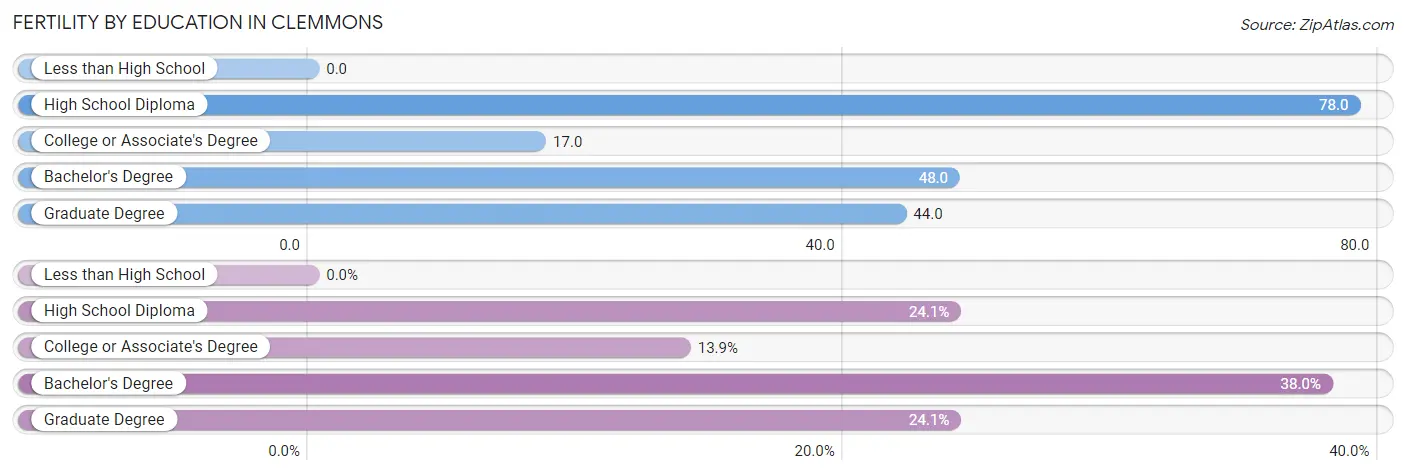
| Educational Attainment | Women with Births | Births / 1,000 Women |
| Less than High School | 0 (0.0%) | 0.0 |
| High School Diploma | 38 (24.0%) | 78.0 |
| College or Associate's Degree | 22 (13.9%) | 17.0 |
| Bachelor's Degree | 60 (38.0%) | 48.0 |
| Graduate Degree | 38 (24.0%) | 44.0 |
| Total | 158 (100.0%) | 36.0 |
Fertility by Education by Marriage Status in Clemmons
37.3% of women with births in Clemmons are unmarried. Women with the educational attainment of bachelor's degree are most likely to be married with 100.0% of them married at childbirth, while women with the educational attainment of high school diploma are least likely to be married with 100.0% of them unmarried at childbirth.
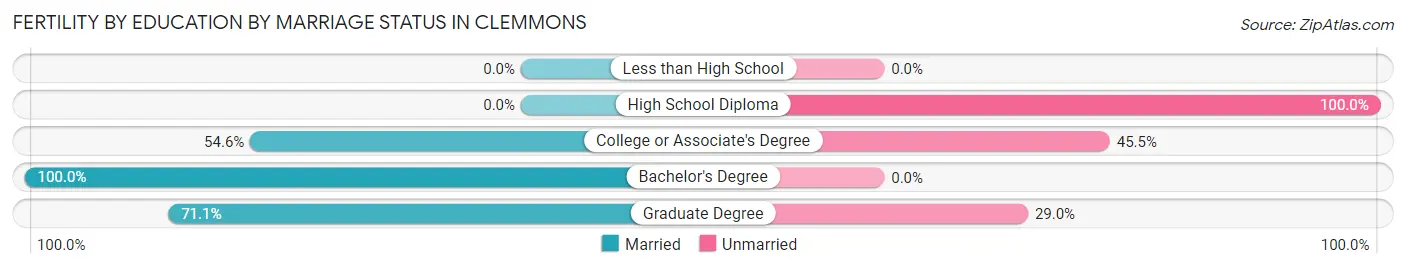
| Educational Attainment | Married | Unmarried |
| Less than High School | 0 (0.0%) | 0 (0.0%) |
| High School Diploma | 0 (0.0%) | 38 (100.0%) |
| College or Associate's Degree | 12 (54.5%) | 10 (45.5%) |
| Bachelor's Degree | 60 (100.0%) | 0 (0.0%) |
| Graduate Degree | 27 (71.1%) | 11 (28.9%) |
| Total | 99 (62.7%) | 59 (37.3%) |
Employment Characteristics in Clemmons
Employment by Class of Employer in Clemmons
Among the 9,797 employed individuals in Clemmons, private company employees (6,378 | 65.1%), not-for-profit organizations (1,487 | 15.2%), and state government employees (544 | 5.6%) make up the most common classes of employment.
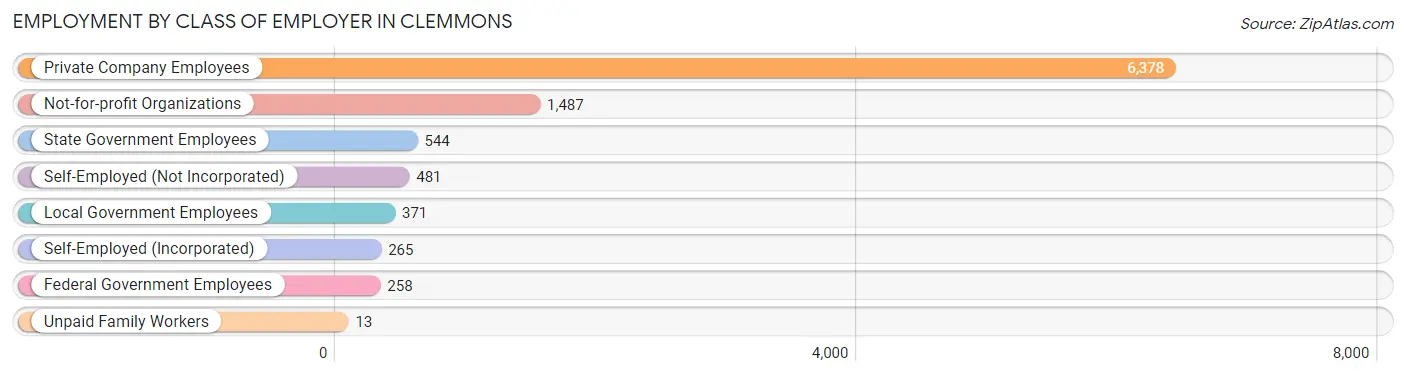
| Employer Class | # Employees | % Employees |
| Private Company Employees | 6,378 | 65.1% |
| Self-Employed (Incorporated) | 265 | 2.7% |
| Self-Employed (Not Incorporated) | 481 | 4.9% |
| Not-for-profit Organizations | 1,487 | 15.2% |
| Local Government Employees | 371 | 3.8% |
| State Government Employees | 544 | 5.6% |
| Federal Government Employees | 258 | 2.6% |
| Unpaid Family Workers | 13 | 0.1% |
| Total | 9,797 | 100.0% |
Employment Status by Age in Clemmons
According to the labor force statistics for Clemmons, out of the total population over 16 years of age (17,150), 61.3% or 10,513 individuals are in the labor force, with 5.0% or 526 of them unemployed. The age group with the highest labor force participation rate is 45 to 54 years, with 87.3% or 2,356 individuals in the labor force. Within the labor force, the 20 to 24 years age range has the highest percentage of unemployed individuals, with 13.8% or 114 of them being unemployed.
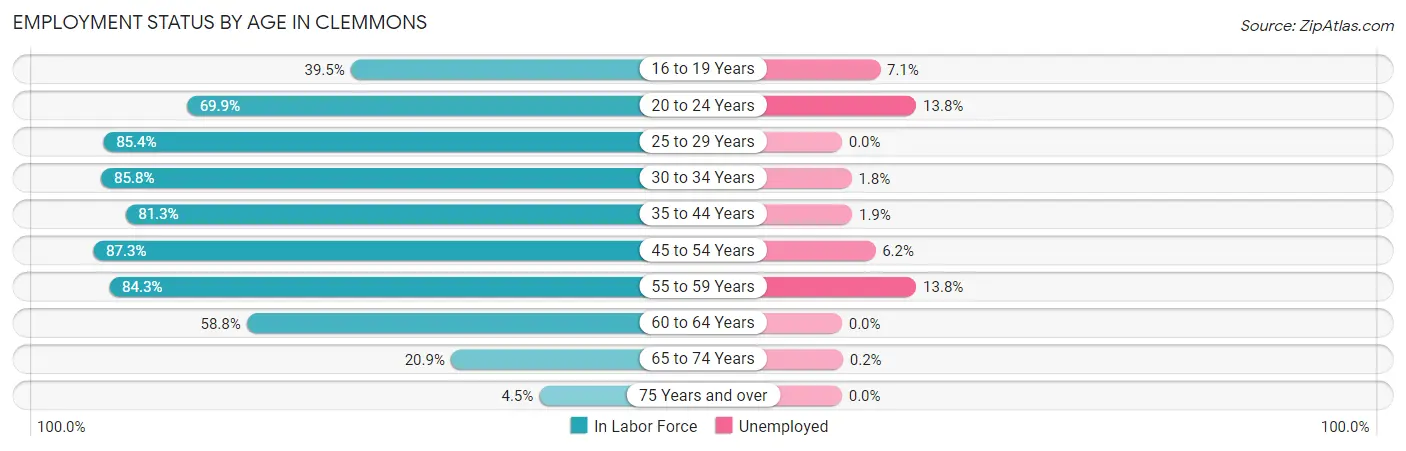
| Age Bracket | In Labor Force | Unemployed |
| 16 to 19 Years | 312 (39.5%) | 22 (7.1%) |
| 20 to 24 Years | 826 (69.9%) | 114 (13.8%) |
| 25 to 29 Years | 1,068 (85.4%) | 0 (0.0%) |
| 30 to 34 Years | 795 (85.8%) | 14 (1.8%) |
| 35 to 44 Years | 2,373 (81.3%) | 45 (1.9%) |
| 45 to 54 Years | 2,356 (87.3%) | 146 (6.2%) |
| 55 to 59 Years | 1,395 (84.3%) | 193 (13.8%) |
| 60 to 64 Years | 839 (58.8%) | 0 (0.0%) |
| 65 to 74 Years | 463 (20.9%) | 1 (0.2%) |
| 75 Years and over | 94 (4.5%) | 0 (0.0%) |
| Total | 10,513 (61.3%) | 526 (5.0%) |
Employment Status by Educational Attainment in Clemmons
According to labor force statistics for Clemmons, 81.1% of individuals (8,821) out of the total population between 25 and 64 years of age (10,877) are in the labor force, with 4.5% or 397 of them being unemployed. The group with the highest labor force participation rate are those with the educational attainment of bachelor's degree or higher, with 86.3% or 5,101 individuals in the labor force. Within the labor force, individuals with bachelor's degree or higher education have the highest percentage of unemployment, with 5.5% or 281 of them being unemployed.
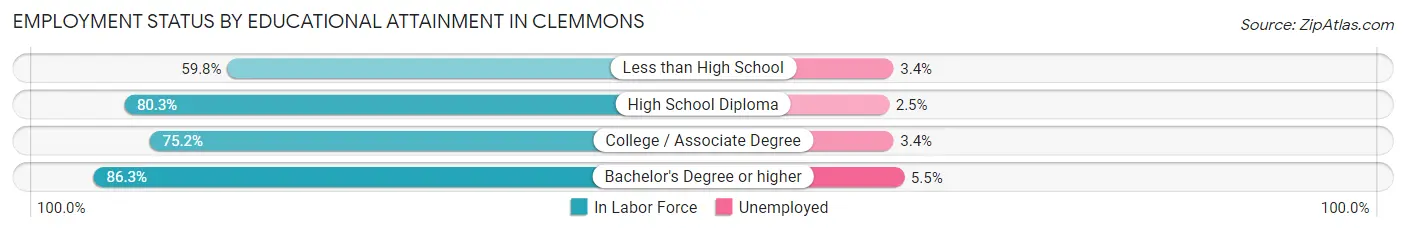
| Educational Attainment | In Labor Force | Unemployed |
| Less than High School | 292 (59.8%) | 17 (3.4%) |
| High School Diploma | 1,017 (80.3%) | 32 (2.5%) |
| College / Associate Degree | 2,415 (75.2%) | 109 (3.4%) |
| Bachelor's Degree or higher | 5,101 (86.3%) | 325 (5.5%) |
| Total | 8,821 (81.1%) | 489 (4.5%) |
Employment Occupations by Sex in Clemmons
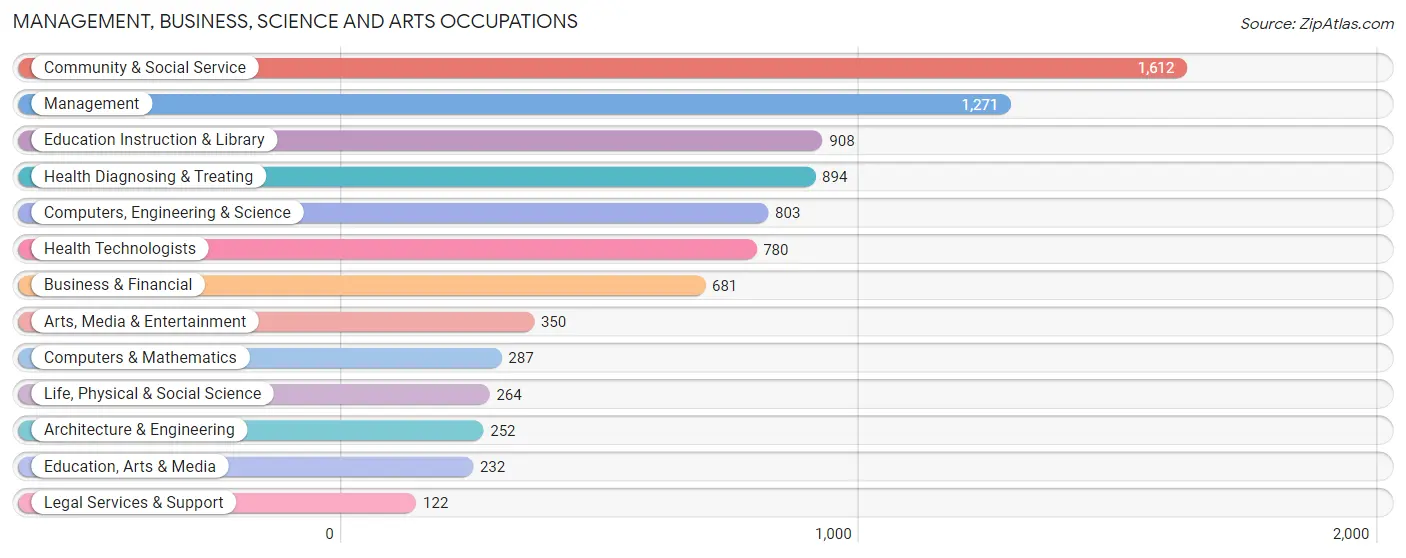
Management, Business, Science and Arts Occupations
The most common Management, Business, Science and Arts occupations in Clemmons are Community & Social Service (1,612 | 16.2%), Management (1,271 | 12.8%), Education Instruction & Library (908 | 9.1%), Health Diagnosing & Treating (894 | 9.0%), and Computers, Engineering & Science (803 | 8.1%).
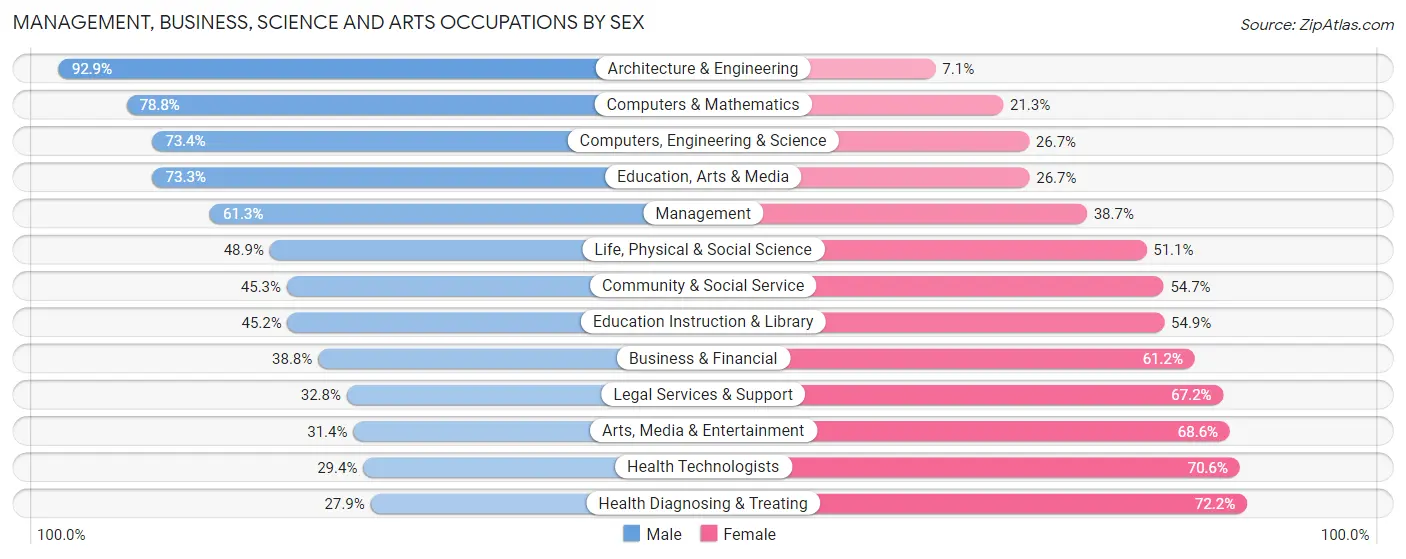
Management, Business, Science and Arts Occupations by Sex
Within the Management, Business, Science and Arts occupations in Clemmons, the most male-oriented occupations are Architecture & Engineering (92.9%), Computers & Mathematics (78.7%), and Computers, Engineering & Science (73.4%), while the most female-oriented occupations are Health Diagnosing & Treating (72.2%), Health Technologists (70.6%), and Arts, Media & Entertainment (68.6%).
| Occupation | Male | Female |
| Management | 779 (61.3%) | 492 (38.7%) |
| Business & Financial | 264 (38.8%) | 417 (61.2%) |
| Computers, Engineering & Science | 589 (73.4%) | 214 (26.7%) |
| Computers & Mathematics | 226 (78.7%) | 61 (21.2%) |
| Architecture & Engineering | 234 (92.9%) | 18 (7.1%) |
| Life, Physical & Social Science | 129 (48.9%) | 135 (51.1%) |
| Community & Social Service | 730 (45.3%) | 882 (54.7%) |
| Education, Arts & Media | 170 (73.3%) | 62 (26.7%) |
| Legal Services & Support | 40 (32.8%) | 82 (67.2%) |
| Education Instruction & Library | 410 (45.2%) | 498 (54.8%) |
| Arts, Media & Entertainment | 110 (31.4%) | 240 (68.6%) |
| Health Diagnosing & Treating | 249 (27.9%) | 645 (72.2%) |
| Health Technologists | 229 (29.4%) | 551 (70.6%) |
| Total (Category) | 2,611 (49.6%) | 2,650 (50.4%) |
| Total (Overall) | 5,352 (53.9%) | 4,578 (46.1%) |
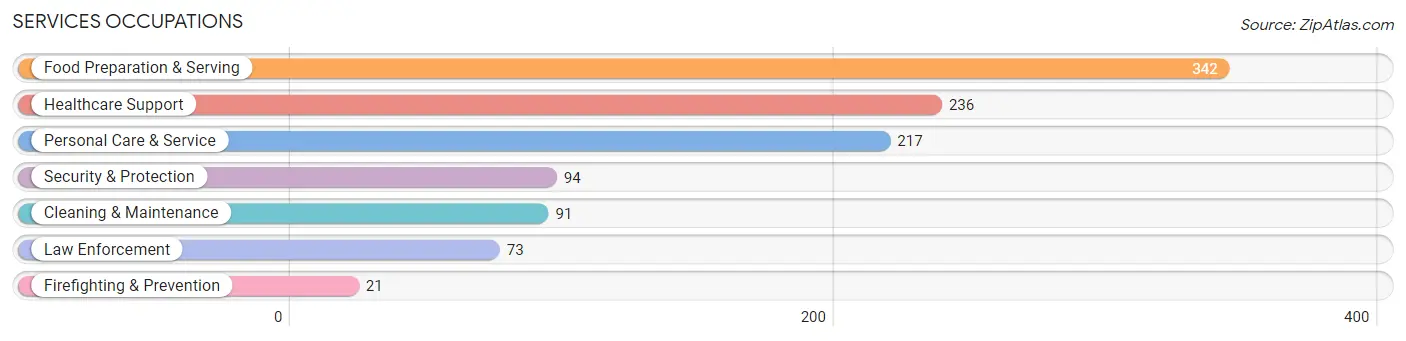
Services Occupations
The most common Services occupations in Clemmons are Food Preparation & Serving (342 | 3.4%), Healthcare Support (236 | 2.4%), Personal Care & Service (217 | 2.2%), Security & Protection (94 | 0.9%), and Cleaning & Maintenance (91 | 0.9%).
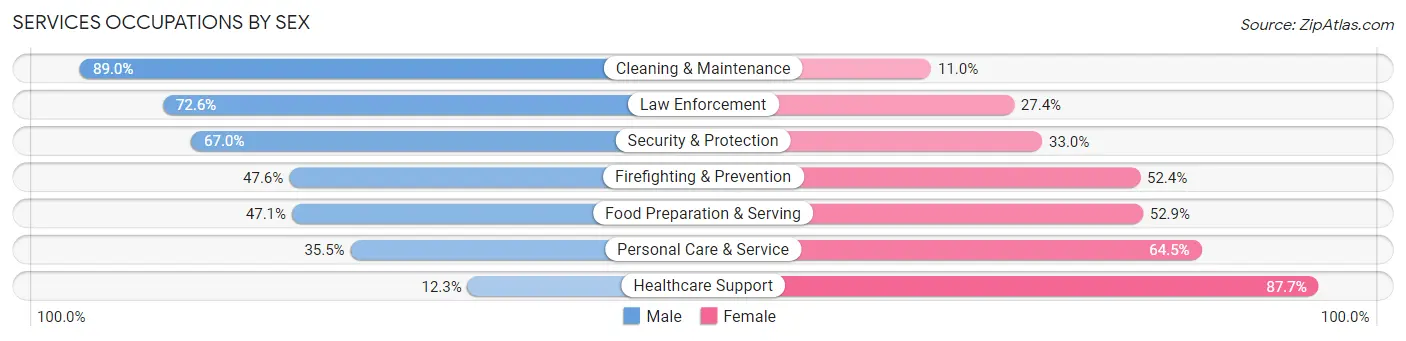
Services Occupations by Sex
Within the Services occupations in Clemmons, the most male-oriented occupations are Cleaning & Maintenance (89.0%), Law Enforcement (72.6%), and Security & Protection (67.0%), while the most female-oriented occupations are Healthcare Support (87.7%), Personal Care & Service (64.5%), and Food Preparation & Serving (52.9%).
| Occupation | Male | Female |
| Healthcare Support | 29 (12.3%) | 207 (87.7%) |
| Security & Protection | 63 (67.0%) | 31 (33.0%) |
| Firefighting & Prevention | 10 (47.6%) | 11 (52.4%) |
| Law Enforcement | 53 (72.6%) | 20 (27.4%) |
| Food Preparation & Serving | 161 (47.1%) | 181 (52.9%) |
| Cleaning & Maintenance | 81 (89.0%) | 10 (11.0%) |
| Personal Care & Service | 77 (35.5%) | 140 (64.5%) |
| Total (Category) | 411 (41.9%) | 569 (58.1%) |
| Total (Overall) | 5,352 (53.9%) | 4,578 (46.1%) |
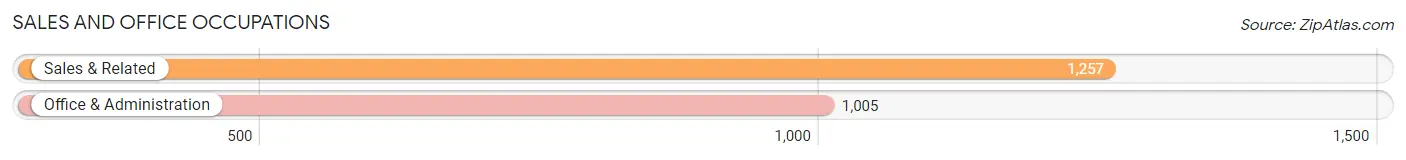
Sales and Office Occupations
The most common Sales and Office occupations in Clemmons are Sales & Related (1,257 | 12.7%), and Office & Administration (1,005 | 10.1%).
Sales and Office Occupations by Sex
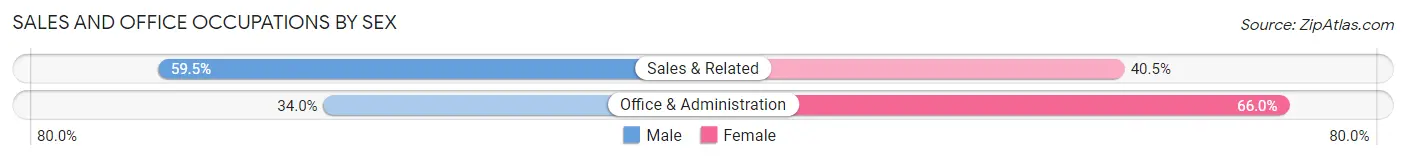
| Occupation | Male | Female |
| Sales & Related | 748 (59.5%) | 509 (40.5%) |
| Office & Administration | 342 (34.0%) | 663 (66.0%) |
| Total (Category) | 1,090 (48.2%) | 1,172 (51.8%) |
| Total (Overall) | 5,352 (53.9%) | 4,578 (46.1%) |
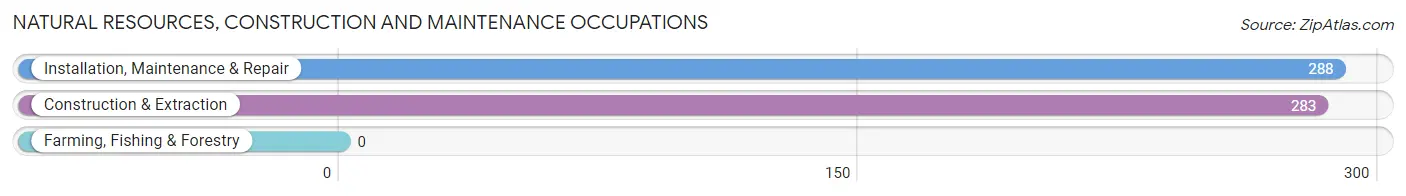
Natural Resources, Construction and Maintenance Occupations
The most common Natural Resources, Construction and Maintenance occupations in Clemmons are Installation, Maintenance & Repair (288 | 2.9%), and Construction & Extraction (283 | 2.9%).
Natural Resources, Construction and Maintenance Occupations by Sex
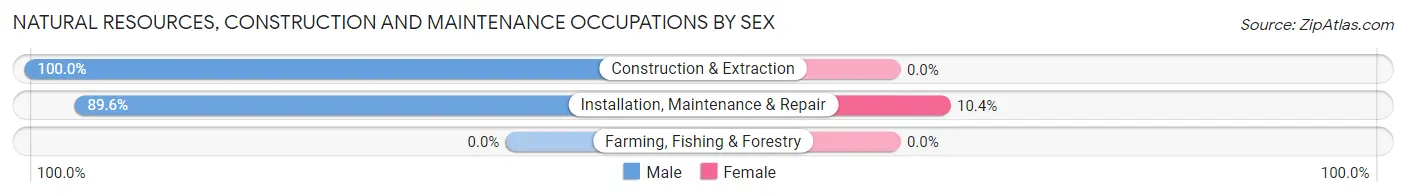
| Occupation | Male | Female |
| Farming, Fishing & Forestry | 0 (0.0%) | 0 (0.0%) |
| Construction & Extraction | 283 (100.0%) | 0 (0.0%) |
| Installation, Maintenance & Repair | 258 (89.6%) | 30 (10.4%) |
| Total (Category) | 541 (94.8%) | 30 (5.2%) |
| Total (Overall) | 5,352 (53.9%) | 4,578 (46.1%) |
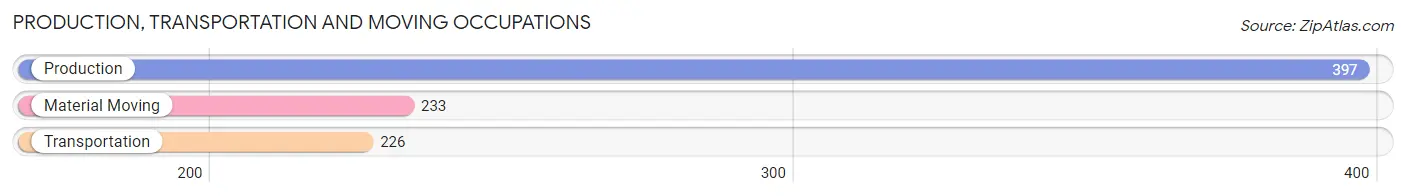
Production, Transportation and Moving Occupations
The most common Production, Transportation and Moving occupations in Clemmons are Production (397 | 4.0%), Material Moving (233 | 2.4%), and Transportation (226 | 2.3%).
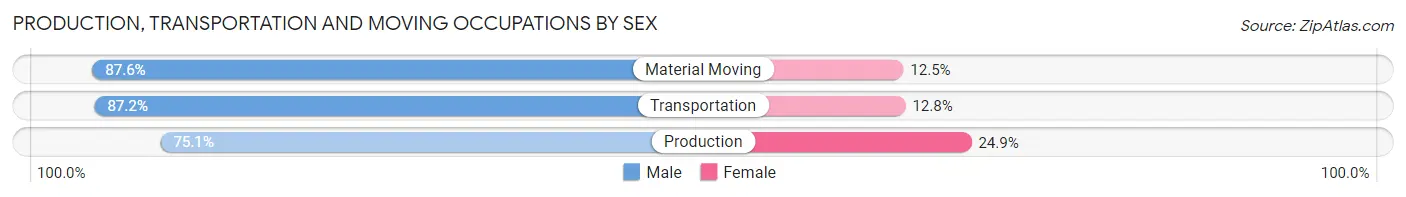
Production, Transportation and Moving Occupations by Sex
| Occupation | Male | Female |
| Production | 298 (75.1%) | 99 (24.9%) |
| Transportation | 197 (87.2%) | 29 (12.8%) |
| Material Moving | 204 (87.5%) | 29 (12.4%) |
| Total (Category) | 699 (81.7%) | 157 (18.3%) |
| Total (Overall) | 5,352 (53.9%) | 4,578 (46.1%) |
Employment Industries by Sex in Clemmons
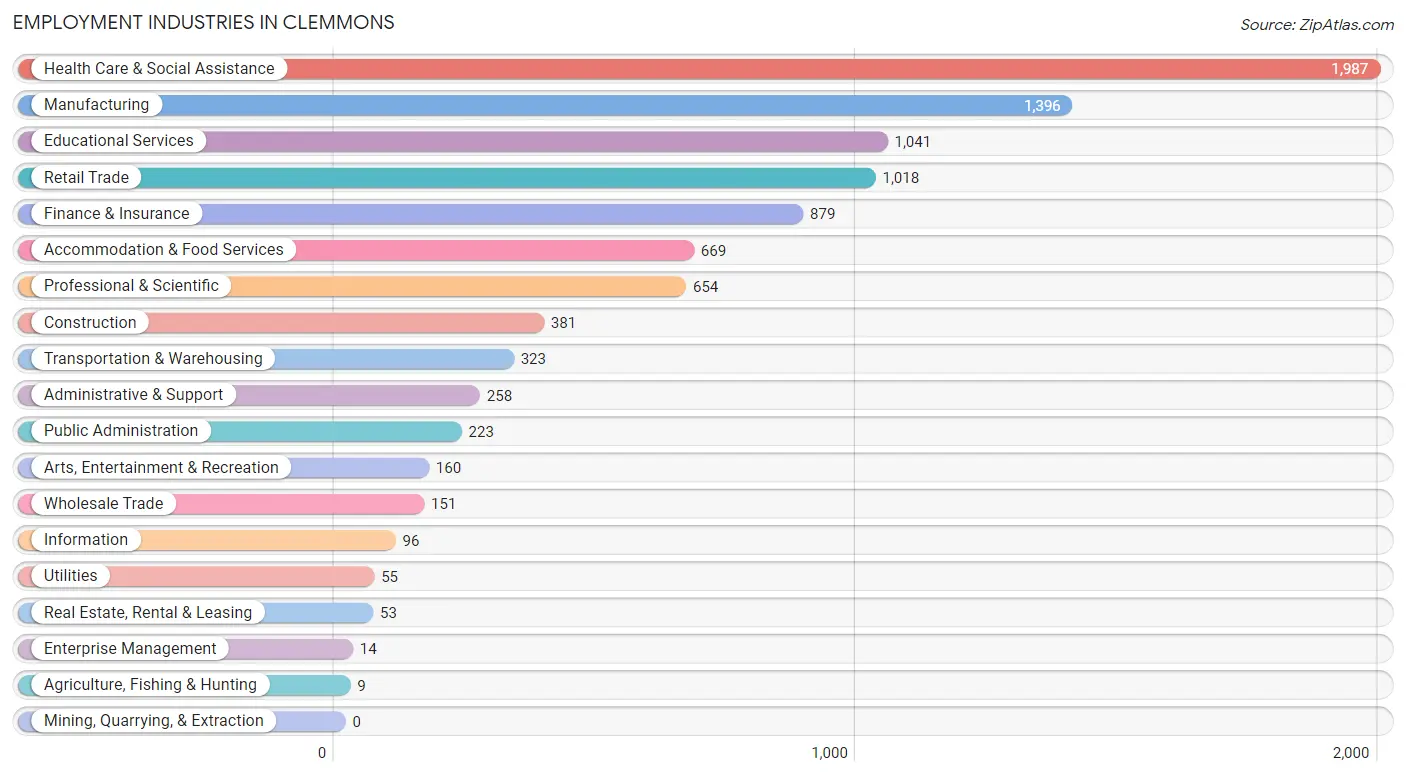
Employment Industries in Clemmons
The major employment industries in Clemmons include Health Care & Social Assistance (1,987 | 20.0%), Manufacturing (1,396 | 14.1%), Educational Services (1,041 | 10.5%), Retail Trade (1,018 | 10.2%), and Finance & Insurance (879 | 8.8%).
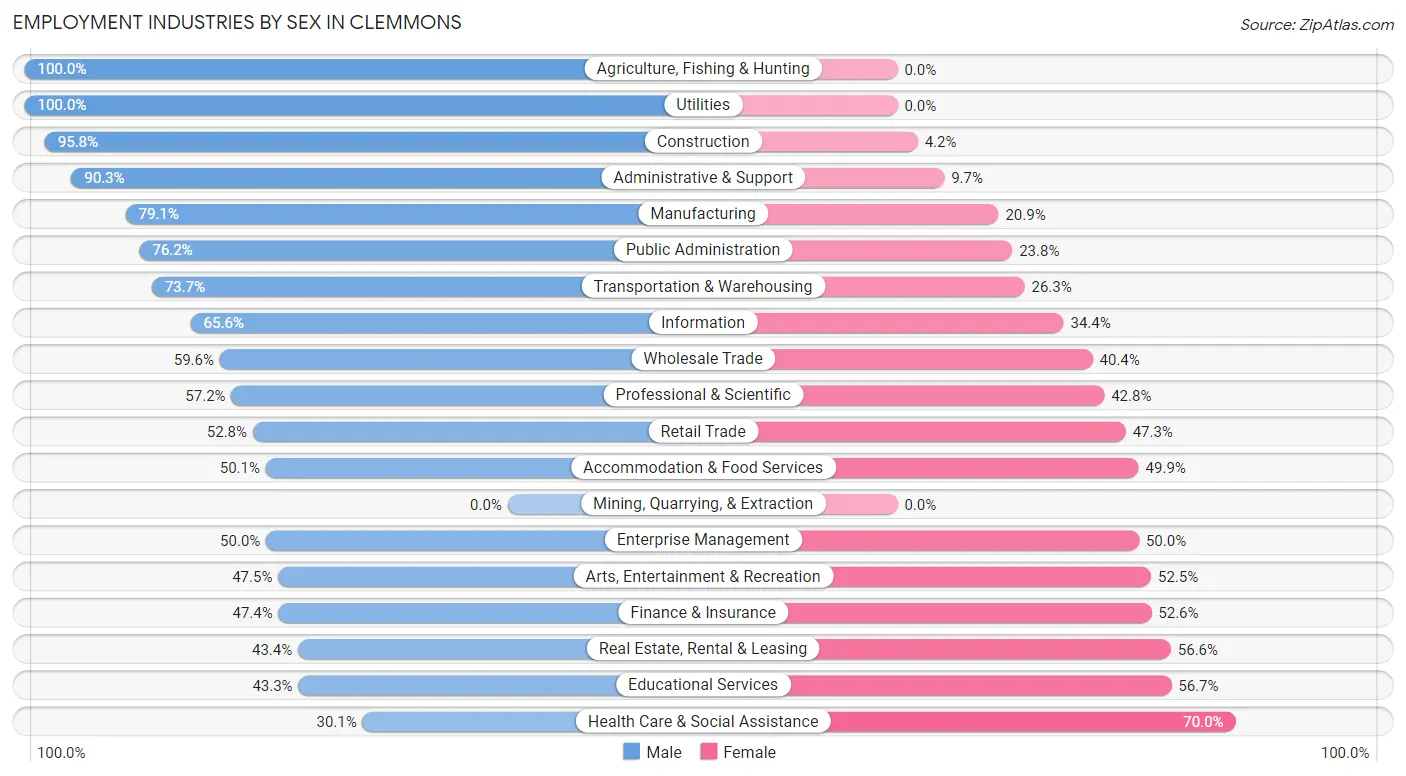
Employment Industries by Sex in Clemmons
The Clemmons industries that see more men than women are Agriculture, Fishing & Hunting (100.0%), Utilities (100.0%), and Construction (95.8%), whereas the industries that tend to have a higher number of women are Health Care & Social Assistance (70.0%), Educational Services (56.7%), and Real Estate, Rental & Leasing (56.6%).
| Industry | Male | Female |
| Agriculture, Fishing & Hunting | 9 (100.0%) | 0 (0.0%) |
| Mining, Quarrying, & Extraction | 0 (0.0%) | 0 (0.0%) |
| Construction | 365 (95.8%) | 16 (4.2%) |
| Manufacturing | 1,104 (79.1%) | 292 (20.9%) |
| Wholesale Trade | 90 (59.6%) | 61 (40.4%) |
| Retail Trade | 537 (52.7%) | 481 (47.2%) |
| Transportation & Warehousing | 238 (73.7%) | 85 (26.3%) |
| Utilities | 55 (100.0%) | 0 (0.0%) |
| Information | 63 (65.6%) | 33 (34.4%) |
| Finance & Insurance | 417 (47.4%) | 462 (52.6%) |
| Real Estate, Rental & Leasing | 23 (43.4%) | 30 (56.6%) |
| Professional & Scientific | 374 (57.2%) | 280 (42.8%) |
| Enterprise Management | 7 (50.0%) | 7 (50.0%) |
| Administrative & Support | 233 (90.3%) | 25 (9.7%) |
| Educational Services | 451 (43.3%) | 590 (56.7%) |
| Health Care & Social Assistance | 597 (30.0%) | 1,390 (70.0%) |
| Arts, Entertainment & Recreation | 76 (47.5%) | 84 (52.5%) |
| Accommodation & Food Services | 335 (50.1%) | 334 (49.9%) |
| Public Administration | 170 (76.2%) | 53 (23.8%) |
| Total | 5,352 (53.9%) | 4,578 (46.1%) |
Education in Clemmons
School Enrollment in Clemmons
The most common levels of schooling among the 4,845 students in Clemmons are middle school (1,176 | 24.3%), elementary school (1,152 | 23.8%), and college / undergraduate (890 | 18.4%).
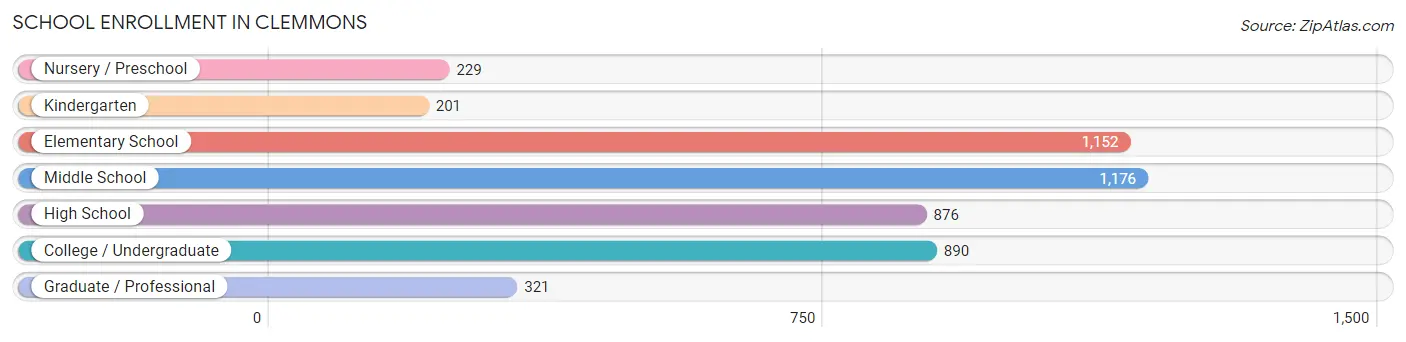
| School Level | # Students | % Students |
| Nursery / Preschool | 229 | 4.7% |
| Kindergarten | 201 | 4.2% |
| Elementary School | 1,152 | 23.8% |
| Middle School | 1,176 | 24.3% |
| High School | 876 | 18.1% |
| College / Undergraduate | 890 | 18.4% |
| Graduate / Professional | 321 | 6.6% |
| Total | 4,845 | 100.0% |
School Enrollment by Age by Funding Source in Clemmons
Out of a total of 4,845 students who are enrolled in schools in Clemmons, 1,061 (21.9%) attend a private institution, while the remaining 3,784 (78.1%) are enrolled in public schools. The age group of 3 to 4 year olds has the highest likelihood of being enrolled in private schools, with 152 (81.3% in the age bracket) enrolled. Conversely, the age group of 18 to 19 year olds has the lowest likelihood of being enrolled in a private school, with 318 (97.0% in the age bracket) attending a public institution.
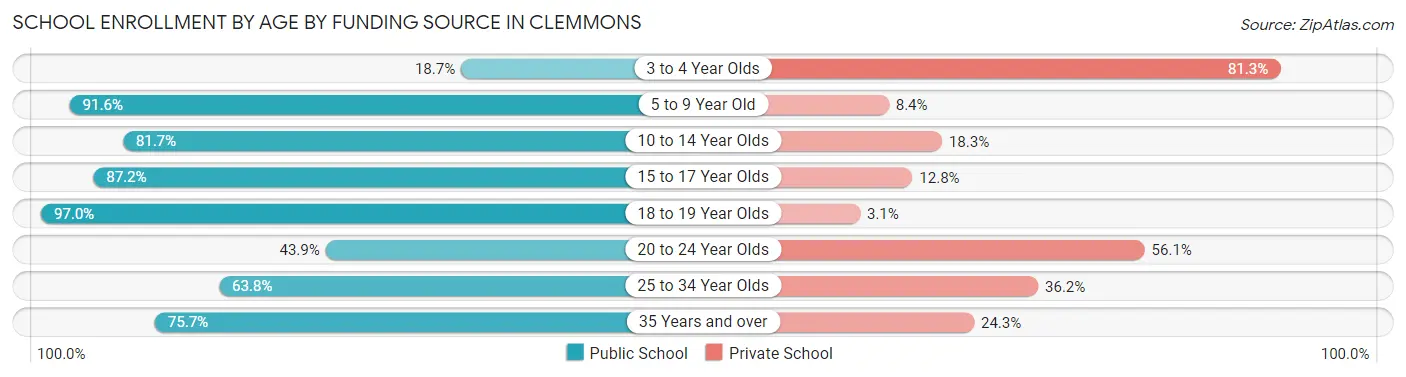
| Age Bracket | Public School | Private School |
| 3 to 4 Year Olds | 35 (18.7%) | 152 (81.3%) |
| 5 to 9 Year Old | 1,123 (91.6%) | 103 (8.4%) |
| 10 to 14 Year Olds | 1,120 (81.7%) | 251 (18.3%) |
| 15 to 17 Year Olds | 552 (87.2%) | 81 (12.8%) |
| 18 to 19 Year Olds | 318 (97.0%) | 10 (3.0%) |
| 20 to 24 Year Olds | 214 (43.9%) | 273 (56.1%) |
| 25 to 34 Year Olds | 236 (63.8%) | 134 (36.2%) |
| 35 Years and over | 184 (75.7%) | 59 (24.3%) |
| Total | 3,784 (78.1%) | 1,061 (21.9%) |
Educational Attainment by Field of Study in Clemmons
Business (1,915 | 23.6%), science & technology (997 | 12.3%), education (904 | 11.2%), engineering (637 | 7.9%), and arts & humanities (605 | 7.5%) are the most common fields of study among 8,102 individuals in Clemmons who have obtained a bachelor's degree or higher.
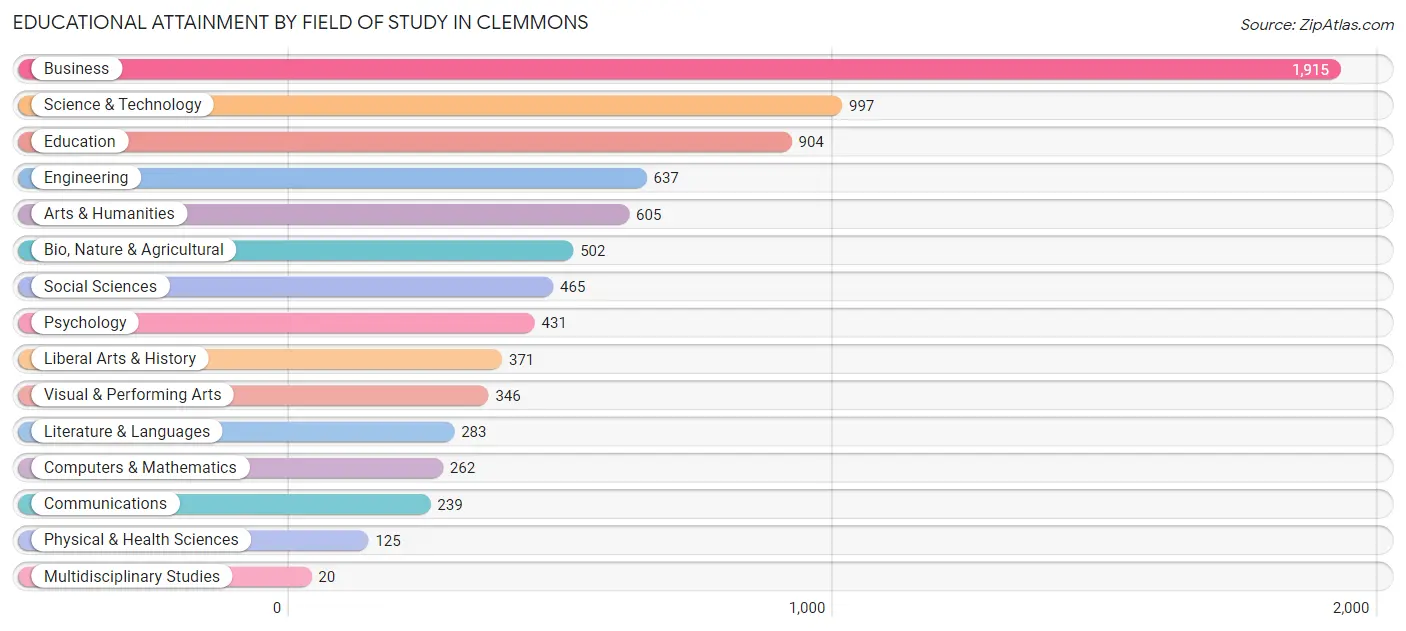
| Field of Study | # Graduates | % Graduates |
| Computers & Mathematics | 262 | 3.2% |
| Bio, Nature & Agricultural | 502 | 6.2% |
| Physical & Health Sciences | 125 | 1.5% |
| Psychology | 431 | 5.3% |
| Social Sciences | 465 | 5.7% |
| Engineering | 637 | 7.9% |
| Multidisciplinary Studies | 20 | 0.3% |
| Science & Technology | 997 | 12.3% |
| Business | 1,915 | 23.6% |
| Education | 904 | 11.2% |
| Literature & Languages | 283 | 3.5% |
| Liberal Arts & History | 371 | 4.6% |
| Visual & Performing Arts | 346 | 4.3% |
| Communications | 239 | 2.9% |
| Arts & Humanities | 605 | 7.5% |
| Total | 8,102 | 100.0% |
Transportation & Commute in Clemmons
Vehicle Availability by Sex in Clemmons
The most prevalent vehicle ownership categories in Clemmons are males with 2 vehicles (2,111, accounting for 40.5%) and females with 2 vehicles (1,762, making up 46.2%).
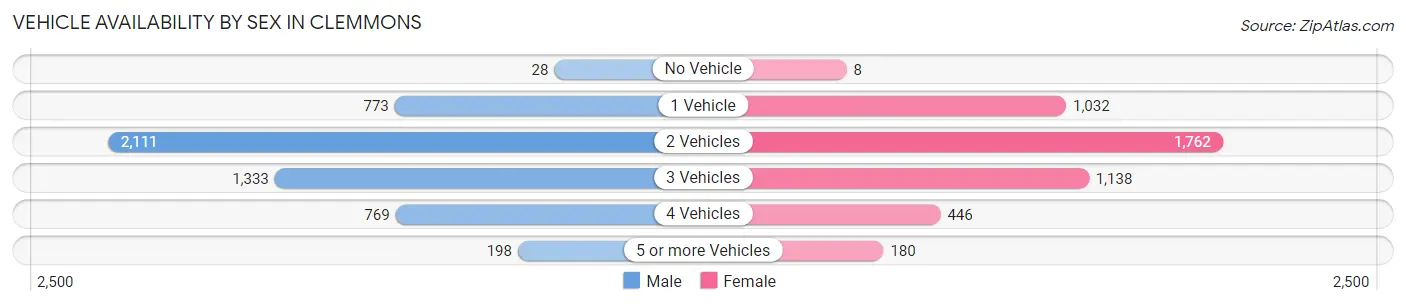
| Vehicles Available | Male | Female |
| No Vehicle | 28 (0.5%) | 8 (0.2%) |
| 1 Vehicle | 773 (14.8%) | 1,032 (22.6%) |
| 2 Vehicles | 2,111 (40.5%) | 1,762 (38.6%) |
| 3 Vehicles | 1,333 (25.6%) | 1,138 (24.9%) |
| 4 Vehicles | 769 (14.7%) | 446 (9.8%) |
| 5 or more Vehicles | 198 (3.8%) | 180 (3.9%) |
| Total | 5,212 (100.0%) | 4,566 (100.0%) |
Commute Time in Clemmons
The most frequently occuring commute durations in Clemmons are 20 to 24 minutes (1,966 commuters, 23.7%), 15 to 19 minutes (1,561 commuters, 18.8%), and 30 to 34 minutes (1,175 commuters, 14.2%).
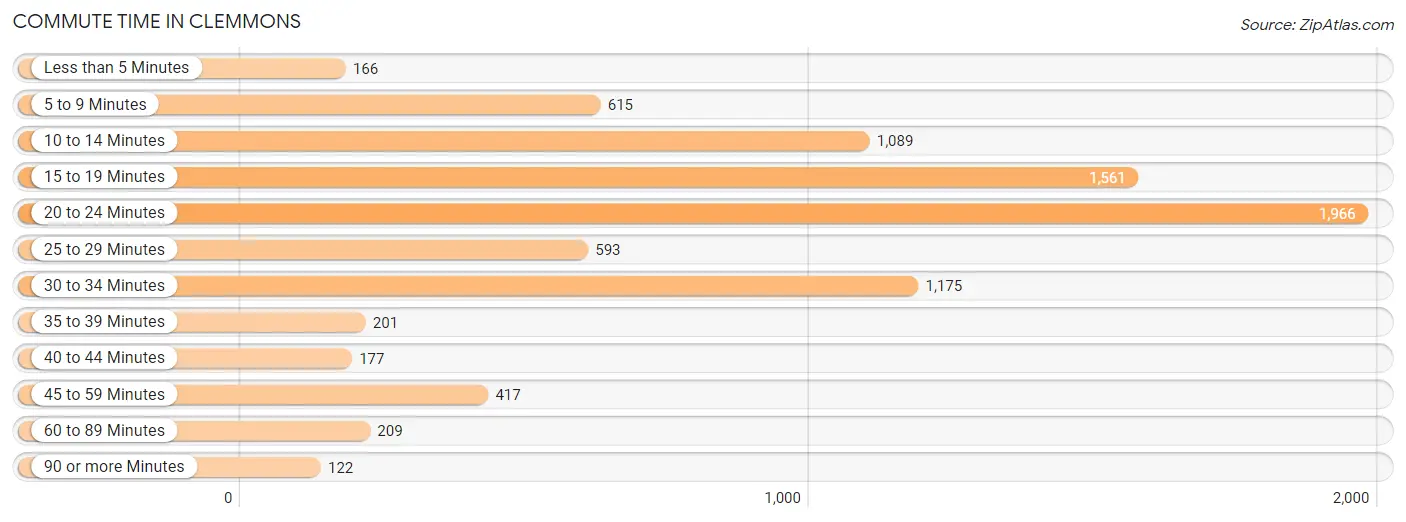
| Commute Time | # Commuters | % Commuters |
| Less than 5 Minutes | 166 | 2.0% |
| 5 to 9 Minutes | 615 | 7.4% |
| 10 to 14 Minutes | 1,089 | 13.1% |
| 15 to 19 Minutes | 1,561 | 18.8% |
| 20 to 24 Minutes | 1,966 | 23.7% |
| 25 to 29 Minutes | 593 | 7.1% |
| 30 to 34 Minutes | 1,175 | 14.2% |
| 35 to 39 Minutes | 201 | 2.4% |
| 40 to 44 Minutes | 177 | 2.1% |
| 45 to 59 Minutes | 417 | 5.0% |
| 60 to 89 Minutes | 209 | 2.5% |
| 90 or more Minutes | 122 | 1.5% |
Commute Time by Sex in Clemmons
The most common commute times in Clemmons are 20 to 24 minutes (1,217 commuters, 27.4%) for males and 15 to 19 minutes (763 commuters, 19.8%) for females.
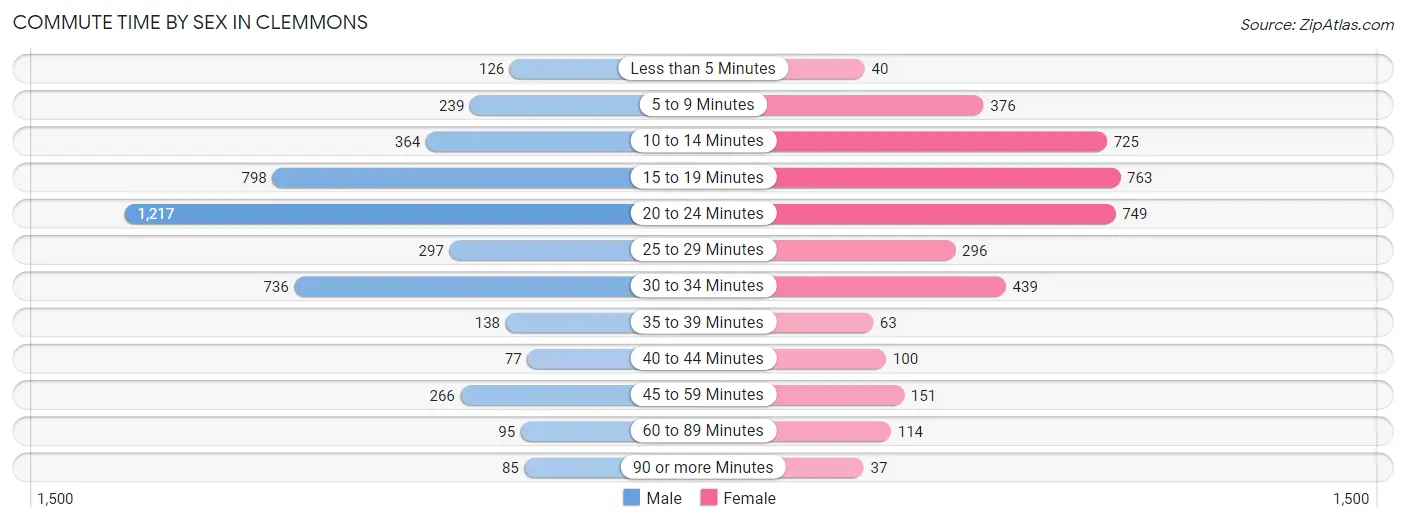
| Commute Time | Male | Female |
| Less than 5 Minutes | 126 (2.8%) | 40 (1.0%) |
| 5 to 9 Minutes | 239 (5.4%) | 376 (9.8%) |
| 10 to 14 Minutes | 364 (8.2%) | 725 (18.8%) |
| 15 to 19 Minutes | 798 (18.0%) | 763 (19.8%) |
| 20 to 24 Minutes | 1,217 (27.4%) | 749 (19.4%) |
| 25 to 29 Minutes | 297 (6.7%) | 296 (7.7%) |
| 30 to 34 Minutes | 736 (16.6%) | 439 (11.4%) |
| 35 to 39 Minutes | 138 (3.1%) | 63 (1.6%) |
| 40 to 44 Minutes | 77 (1.7%) | 100 (2.6%) |
| 45 to 59 Minutes | 266 (6.0%) | 151 (3.9%) |
| 60 to 89 Minutes | 95 (2.1%) | 114 (3.0%) |
| 90 or more Minutes | 85 (1.9%) | 37 (1.0%) |
Time of Departure to Work by Sex in Clemmons
The most frequent times of departure to work in Clemmons are 7:00 AM to 7:29 AM (710, 16.0%) for males and 7:00 AM to 7:29 AM (798, 20.7%) for females.
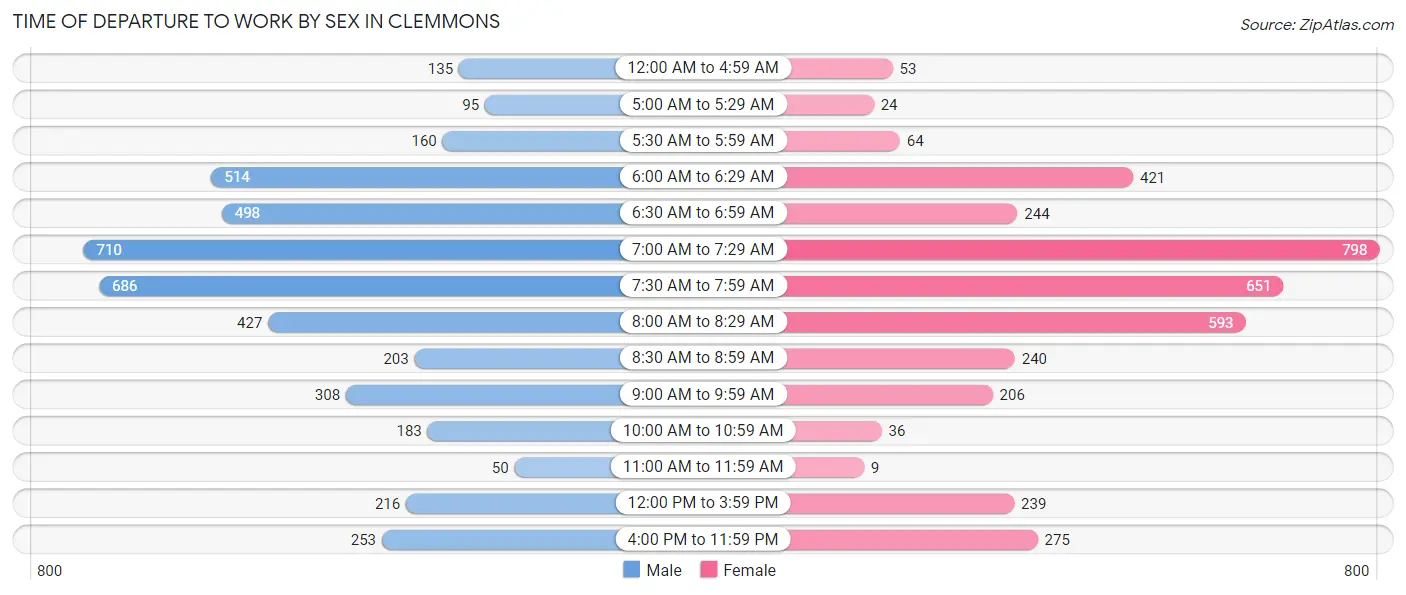
| Time of Departure | Male | Female |
| 12:00 AM to 4:59 AM | 135 (3.0%) | 53 (1.4%) |
| 5:00 AM to 5:29 AM | 95 (2.1%) | 24 (0.6%) |
| 5:30 AM to 5:59 AM | 160 (3.6%) | 64 (1.7%) |
| 6:00 AM to 6:29 AM | 514 (11.6%) | 421 (10.9%) |
| 6:30 AM to 6:59 AM | 498 (11.2%) | 244 (6.3%) |
| 7:00 AM to 7:29 AM | 710 (16.0%) | 798 (20.7%) |
| 7:30 AM to 7:59 AM | 686 (15.5%) | 651 (16.9%) |
| 8:00 AM to 8:29 AM | 427 (9.6%) | 593 (15.4%) |
| 8:30 AM to 8:59 AM | 203 (4.6%) | 240 (6.2%) |
| 9:00 AM to 9:59 AM | 308 (6.9%) | 206 (5.3%) |
| 10:00 AM to 10:59 AM | 183 (4.1%) | 36 (0.9%) |
| 11:00 AM to 11:59 AM | 50 (1.1%) | 9 (0.2%) |
| 12:00 PM to 3:59 PM | 216 (4.9%) | 239 (6.2%) |
| 4:00 PM to 11:59 PM | 253 (5.7%) | 275 (7.1%) |
| Total | 4,438 (100.0%) | 3,853 (100.0%) |
Housing Occupancy in Clemmons
Occupancy by Ownership in Clemmons
Of the total 8,748 dwellings in Clemmons, owner-occupied units account for 6,376 (72.9%), while renter-occupied units make up 2,372 (27.1%).
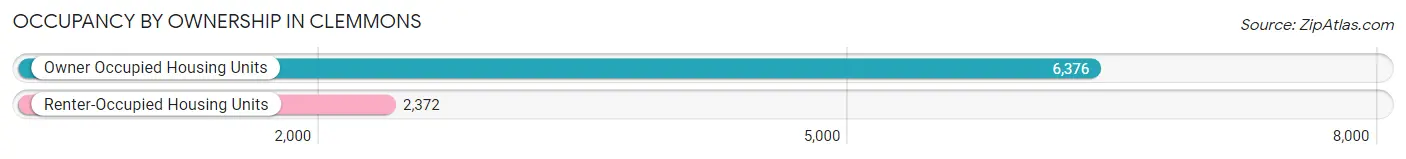
| Occupancy | # Housing Units | % Housing Units |
| Owner Occupied Housing Units | 6,376 | 72.9% |
| Renter-Occupied Housing Units | 2,372 | 27.1% |
| Total Occupied Housing Units | 8,748 | 100.0% |
Occupancy by Household Size in Clemmons
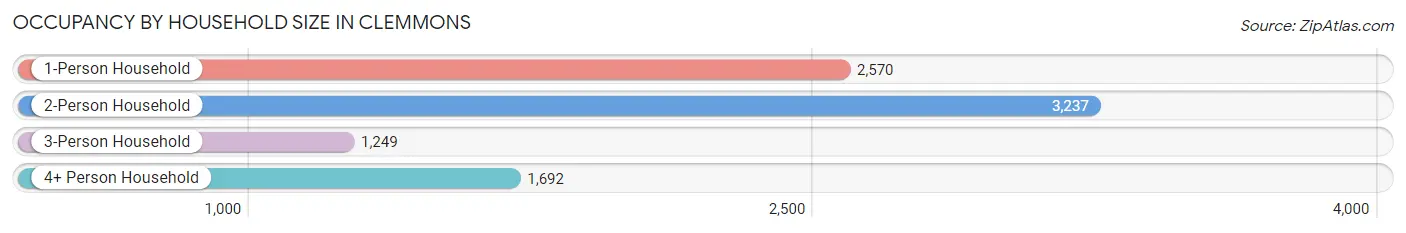
| Household Size | # Housing Units | % Housing Units |
| 1-Person Household | 2,570 | 29.4% |
| 2-Person Household | 3,237 | 37.0% |
| 3-Person Household | 1,249 | 14.3% |
| 4+ Person Household | 1,692 | 19.3% |
| Total Housing Units | 8,748 | 100.0% |
Occupancy by Ownership by Household Size in Clemmons
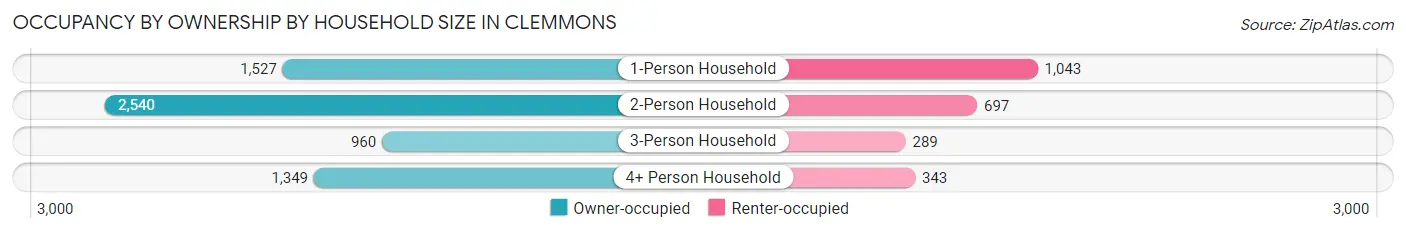
| Household Size | Owner-occupied | Renter-occupied |
| 1-Person Household | 1,527 (59.4%) | 1,043 (40.6%) |
| 2-Person Household | 2,540 (78.5%) | 697 (21.5%) |
| 3-Person Household | 960 (76.9%) | 289 (23.1%) |
| 4+ Person Household | 1,349 (79.7%) | 343 (20.3%) |
| Total Housing Units | 6,376 (72.9%) | 2,372 (27.1%) |
Occupancy by Educational Attainment in Clemmons
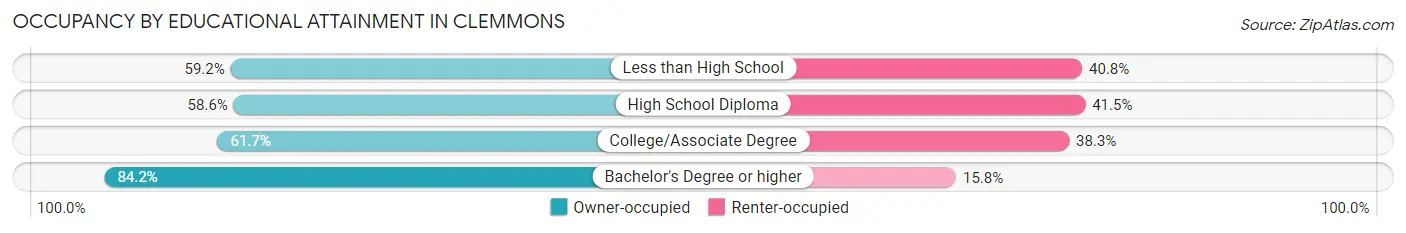
| Household Size | Owner-occupied | Renter-occupied |
| Less than High School | 100 (59.2%) | 69 (40.8%) |
| High School Diploma | 805 (58.6%) | 570 (41.4%) |
| College/Associate Degree | 1,630 (61.7%) | 1,010 (38.3%) |
| Bachelor's Degree or higher | 3,841 (84.2%) | 723 (15.8%) |
Occupancy by Age of Householder in Clemmons
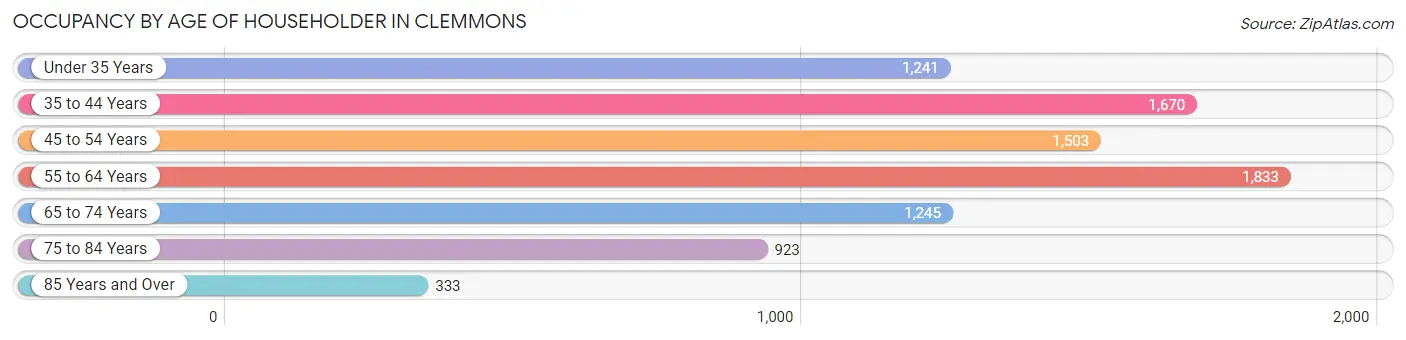
| Age Bracket | # Households | % Households |
| Under 35 Years | 1,241 | 14.2% |
| 35 to 44 Years | 1,670 | 19.1% |
| 45 to 54 Years | 1,503 | 17.2% |
| 55 to 64 Years | 1,833 | 20.9% |
| 65 to 74 Years | 1,245 | 14.2% |
| 75 to 84 Years | 923 | 10.5% |
| 85 Years and Over | 333 | 3.8% |
| Total | 8,748 | 100.0% |
Housing Finances in Clemmons
Median Income by Occupancy in Clemmons
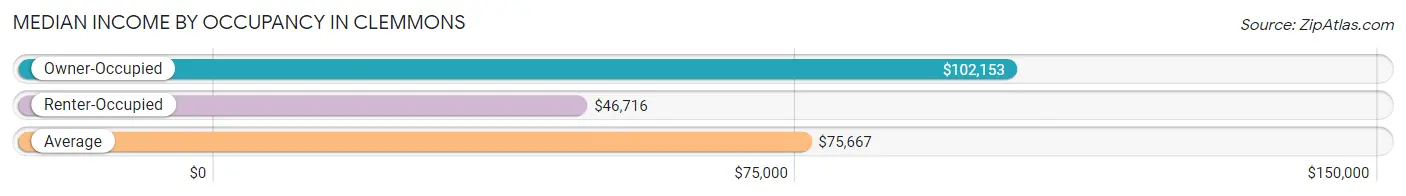
| Occupancy Type | # Households | Median Income |
| Owner-Occupied | 6,376 (72.9%) | $102,153 |
| Renter-Occupied | 2,372 (27.1%) | $46,716 |
| Average | 8,748 (100.0%) | $75,667 |
Occupancy by Householder Income Bracket in Clemmons
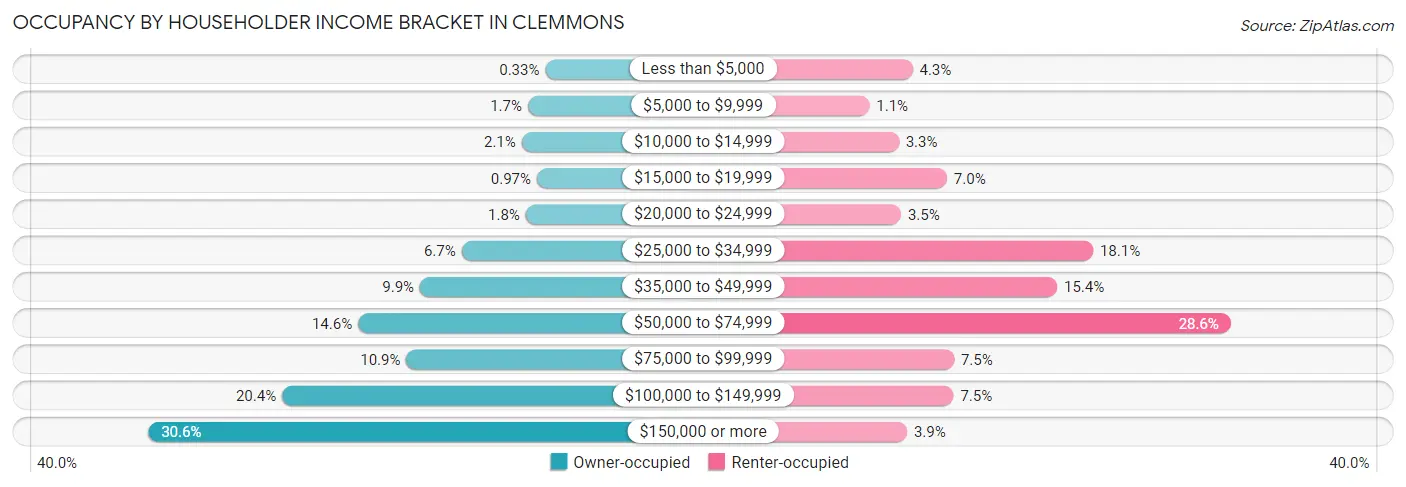
| Income Bracket | Owner-occupied | Renter-occupied |
| Less than $5,000 | 21 (0.3%) | 103 (4.3%) |
| $5,000 to $9,999 | 106 (1.7%) | 25 (1.1%) |
| $10,000 to $14,999 | 136 (2.1%) | 78 (3.3%) |
| $15,000 to $19,999 | 62 (1.0%) | 165 (7.0%) |
| $20,000 to $24,999 | 116 (1.8%) | 82 (3.5%) |
| $25,000 to $34,999 | 428 (6.7%) | 429 (18.1%) |
| $35,000 to $49,999 | 630 (9.9%) | 364 (15.3%) |
| $50,000 to $74,999 | 931 (14.6%) | 678 (28.6%) |
| $75,000 to $99,999 | 696 (10.9%) | 178 (7.5%) |
| $100,000 to $149,999 | 1,300 (20.4%) | 177 (7.5%) |
| $150,000 or more | 1,950 (30.6%) | 93 (3.9%) |
| Total | 6,376 (100.0%) | 2,372 (100.0%) |
Monthly Housing Cost Tiers in Clemmons
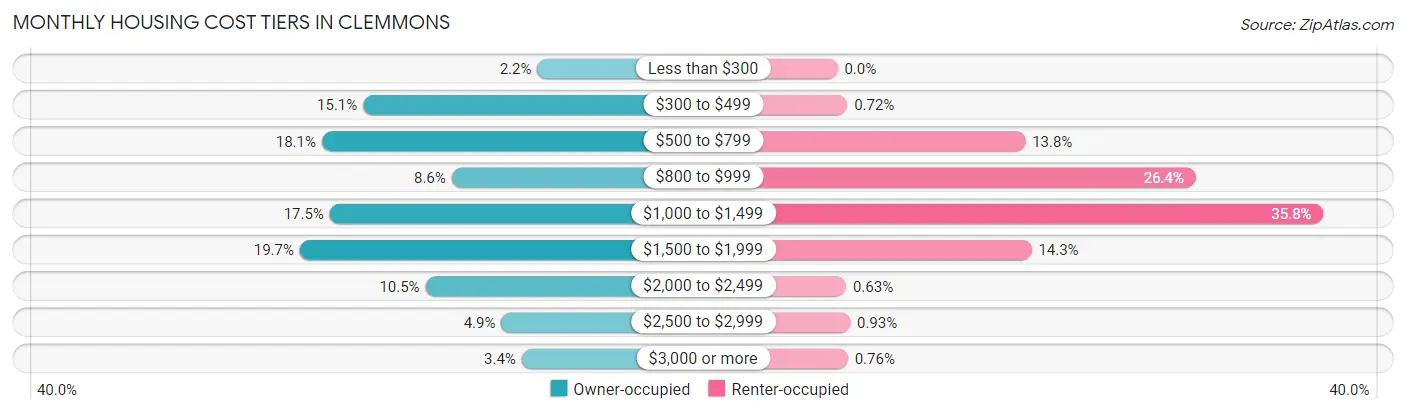
| Monthly Cost | Owner-occupied | Renter-occupied |
| Less than $300 | 143 (2.2%) | 0 (0.0%) |
| $300 to $499 | 961 (15.1%) | 17 (0.7%) |
| $500 to $799 | 1,155 (18.1%) | 328 (13.8%) |
| $800 to $999 | 545 (8.6%) | 626 (26.4%) |
| $1,000 to $1,499 | 1,118 (17.5%) | 849 (35.8%) |
| $1,500 to $1,999 | 1,258 (19.7%) | 339 (14.3%) |
| $2,000 to $2,499 | 668 (10.5%) | 15 (0.6%) |
| $2,500 to $2,999 | 312 (4.9%) | 22 (0.9%) |
| $3,000 or more | 216 (3.4%) | 18 (0.8%) |
| Total | 6,376 (100.0%) | 2,372 (100.0%) |
Physical Housing Characteristics in Clemmons
Housing Structures in Clemmons
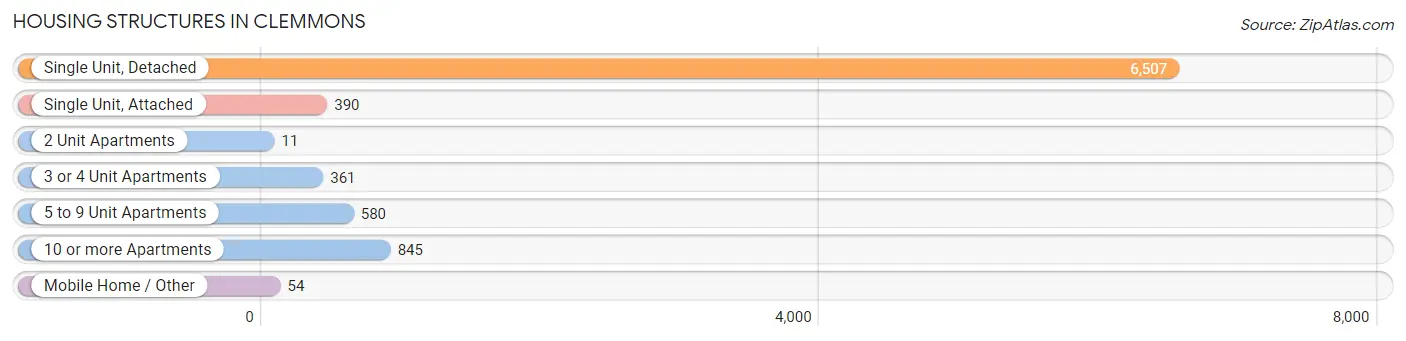
| Structure Type | # Housing Units | % Housing Units |
| Single Unit, Detached | 6,507 | 74.4% |
| Single Unit, Attached | 390 | 4.5% |
| 2 Unit Apartments | 11 | 0.1% |
| 3 or 4 Unit Apartments | 361 | 4.1% |
| 5 to 9 Unit Apartments | 580 | 6.6% |
| 10 or more Apartments | 845 | 9.7% |
| Mobile Home / Other | 54 | 0.6% |
| Total | 8,748 | 100.0% |
Housing Structures by Occupancy in Clemmons
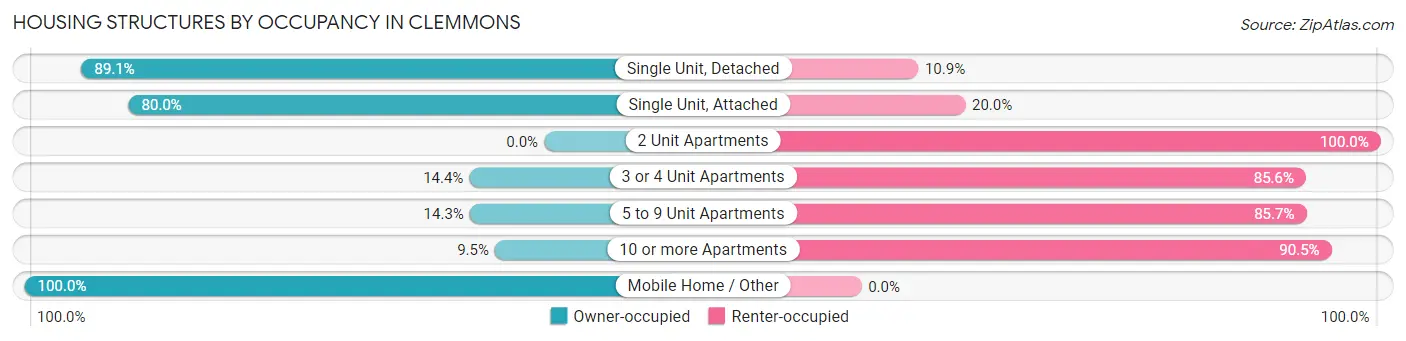
| Structure Type | Owner-occupied | Renter-occupied |
| Single Unit, Detached | 5,795 (89.1%) | 712 (10.9%) |
| Single Unit, Attached | 312 (80.0%) | 78 (20.0%) |
| 2 Unit Apartments | 0 (0.0%) | 11 (100.0%) |
| 3 or 4 Unit Apartments | 52 (14.4%) | 309 (85.6%) |
| 5 to 9 Unit Apartments | 83 (14.3%) | 497 (85.7%) |
| 10 or more Apartments | 80 (9.5%) | 765 (90.5%) |
| Mobile Home / Other | 54 (100.0%) | 0 (0.0%) |
| Total | 6,376 (72.9%) | 2,372 (27.1%) |
Housing Structures by Number of Rooms in Clemmons
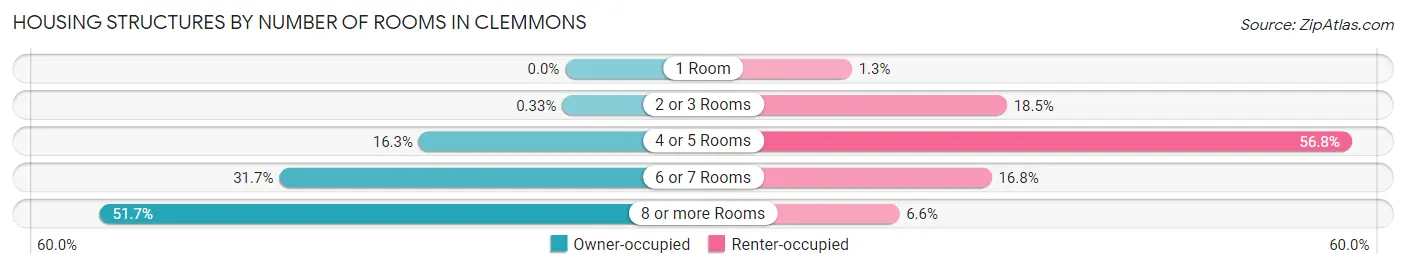
| Number of Rooms | Owner-occupied | Renter-occupied |
| 1 Room | 0 (0.0%) | 31 (1.3%) |
| 2 or 3 Rooms | 21 (0.3%) | 439 (18.5%) |
| 4 or 5 Rooms | 1,036 (16.3%) | 1,347 (56.8%) |
| 6 or 7 Rooms | 2,024 (31.7%) | 399 (16.8%) |
| 8 or more Rooms | 3,295 (51.7%) | 156 (6.6%) |
| Total | 6,376 (100.0%) | 2,372 (100.0%) |
Housing Structure by Heating Type in Clemmons
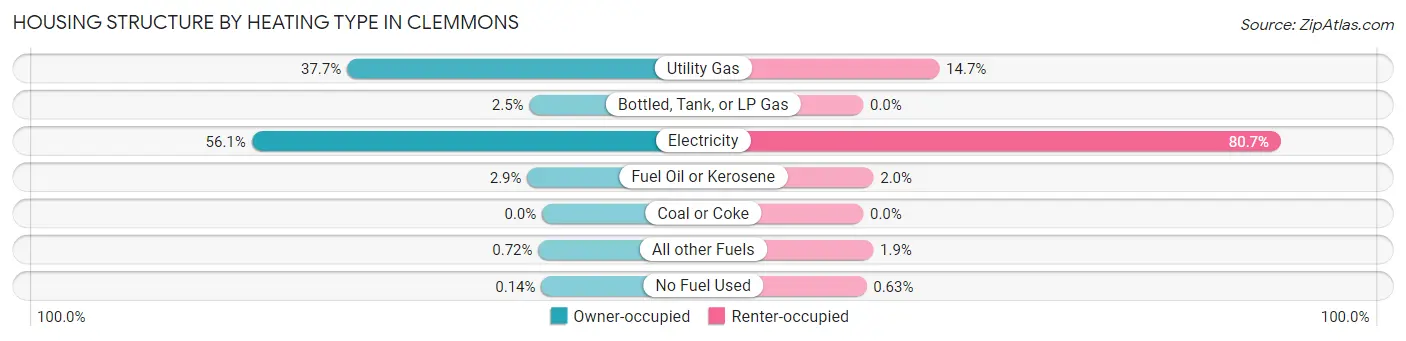
| Heating Type | Owner-occupied | Renter-occupied |
| Utility Gas | 2,404 (37.7%) | 349 (14.7%) |
| Bottled, Tank, or LP Gas | 156 (2.5%) | 0 (0.0%) |
| Electricity | 3,579 (56.1%) | 1,915 (80.7%) |
| Fuel Oil or Kerosene | 182 (2.9%) | 47 (2.0%) |
| Coal or Coke | 0 (0.0%) | 0 (0.0%) |
| All other Fuels | 46 (0.7%) | 46 (1.9%) |
| No Fuel Used | 9 (0.1%) | 15 (0.6%) |
| Total | 6,376 (100.0%) | 2,372 (100.0%) |
Household Vehicle Usage in Clemmons
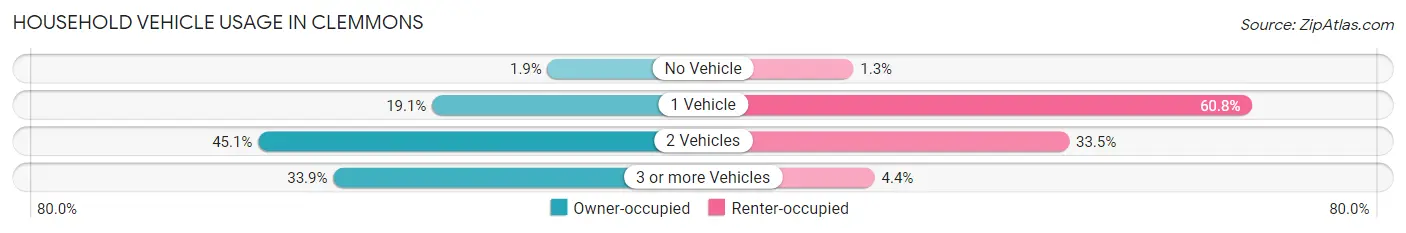
| Vehicles per Household | Owner-occupied | Renter-occupied |
| No Vehicle | 120 (1.9%) | 30 (1.3%) |
| 1 Vehicle | 1,219 (19.1%) | 1,443 (60.8%) |
| 2 Vehicles | 2,876 (45.1%) | 794 (33.5%) |
| 3 or more Vehicles | 2,161 (33.9%) | 105 (4.4%) |
| Total | 6,376 (100.0%) | 2,372 (100.0%) |
Real Estate & Mortgages in Clemmons
Real Estate and Mortgage Overview in Clemmons
| Characteristic | Without Mortgage | With Mortgage |
| Housing Units | 2,291 | 4,085 |
| Median Property Value | $258,900 | $297,800 |
| Median Household Income | $76,801 | $1,410 |
| Monthly Housing Costs | $509 | $216 |
| Real Estate Taxes | $2,176 | $11 |
Property Value by Mortgage Status in Clemmons
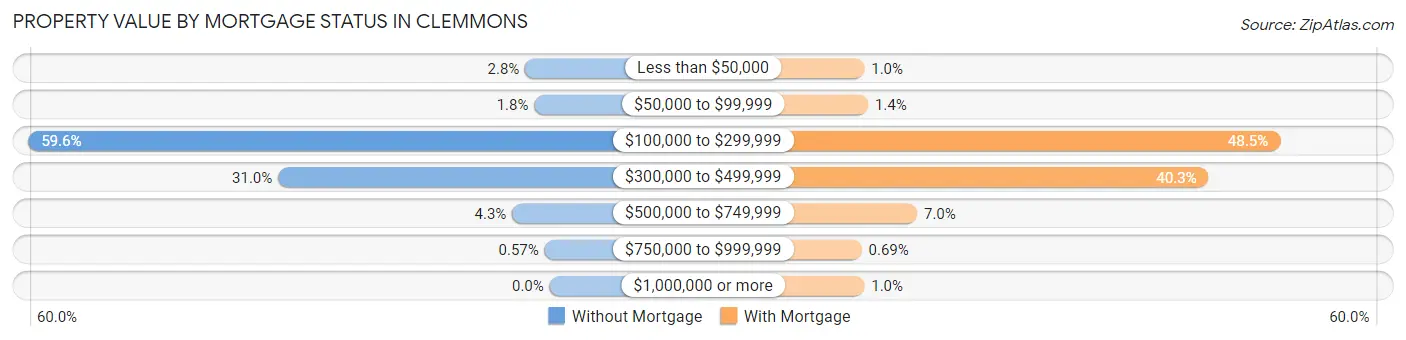
| Property Value | Without Mortgage | With Mortgage |
| Less than $50,000 | 64 (2.8%) | 41 (1.0%) |
| $50,000 to $99,999 | 40 (1.8%) | 58 (1.4%) |
| $100,000 to $299,999 | 1,365 (59.6%) | 1,982 (48.5%) |
| $300,000 to $499,999 | 711 (31.0%) | 1,648 (40.3%) |
| $500,000 to $749,999 | 98 (4.3%) | 287 (7.0%) |
| $750,000 to $999,999 | 13 (0.6%) | 28 (0.7%) |
| $1,000,000 or more | 0 (0.0%) | 41 (1.0%) |
| Total | 2,291 (100.0%) | 4,085 (100.0%) |
Household Income by Mortgage Status in Clemmons
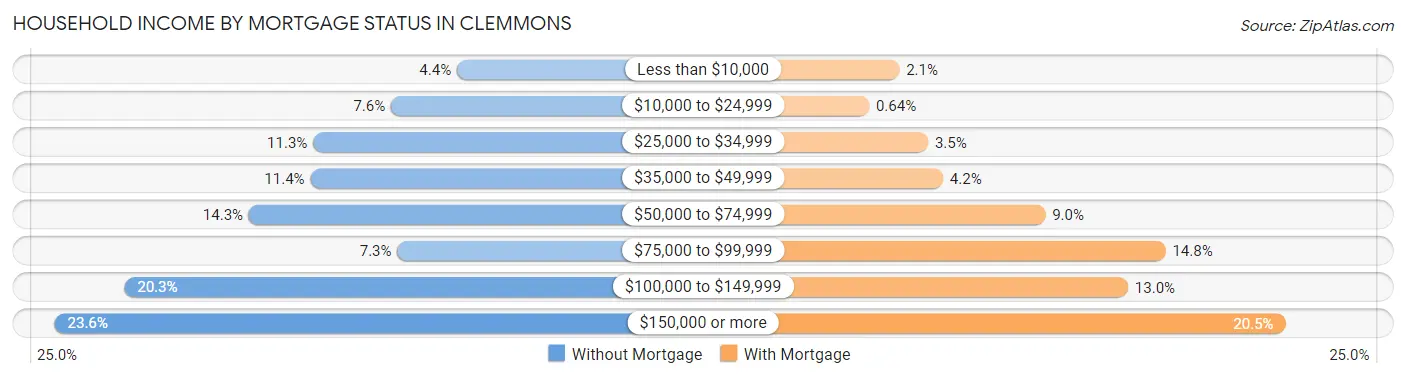
| Household Income | Without Mortgage | With Mortgage |
| Less than $10,000 | 101 (4.4%) | 85 (2.1%) |
| $10,000 to $24,999 | 173 (7.5%) | 26 (0.6%) |
| $25,000 to $34,999 | 258 (11.3%) | 141 (3.5%) |
| $35,000 to $49,999 | 261 (11.4%) | 170 (4.2%) |
| $50,000 to $74,999 | 328 (14.3%) | 369 (9.0%) |
| $75,000 to $99,999 | 166 (7.2%) | 603 (14.8%) |
| $100,000 to $149,999 | 464 (20.3%) | 530 (13.0%) |
| $150,000 or more | 540 (23.6%) | 836 (20.5%) |
| Total | 2,291 (100.0%) | 4,085 (100.0%) |
Property Value to Household Income Ratio in Clemmons
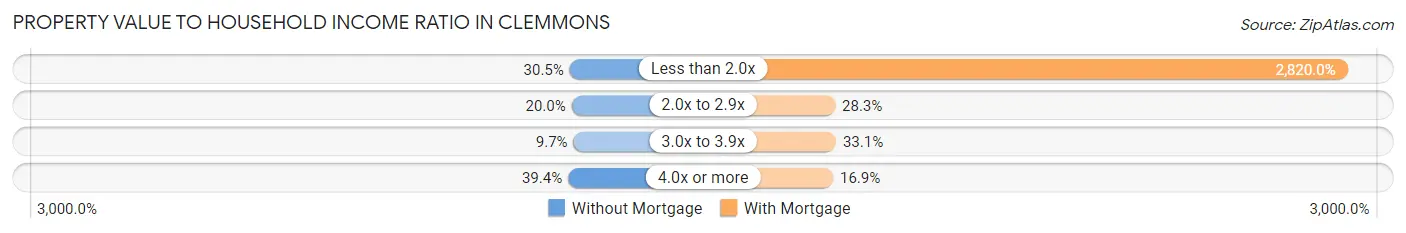
| Value-to-Income Ratio | Without Mortgage | With Mortgage |
| Less than 2.0x | 698 (30.5%) | 115,195 (2,820.0%) |
| 2.0x to 2.9x | 458 (20.0%) | 1,157 (28.3%) |
| 3.0x to 3.9x | 223 (9.7%) | 1,353 (33.1%) |
| 4.0x or more | 903 (39.4%) | 690 (16.9%) |
| Total | 2,291 (100.0%) | 4,085 (100.0%) |
Real Estate Taxes by Mortgage Status in Clemmons
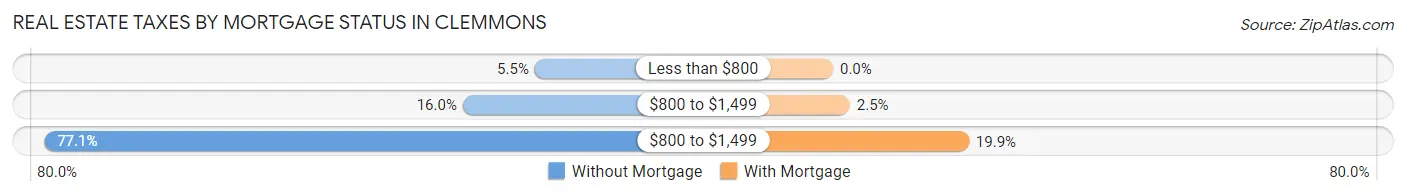
| Property Taxes | Without Mortgage | With Mortgage |
| Less than $800 | 125 (5.5%) | 0 (0.0%) |
| $800 to $1,499 | 366 (16.0%) | 100 (2.5%) |
| $800 to $1,499 | 1,767 (77.1%) | 811 (19.9%) |
| Total | 2,291 (100.0%) | 4,085 (100.0%) |
Health & Disability in Clemmons
Health Insurance Coverage by Age in Clemmons
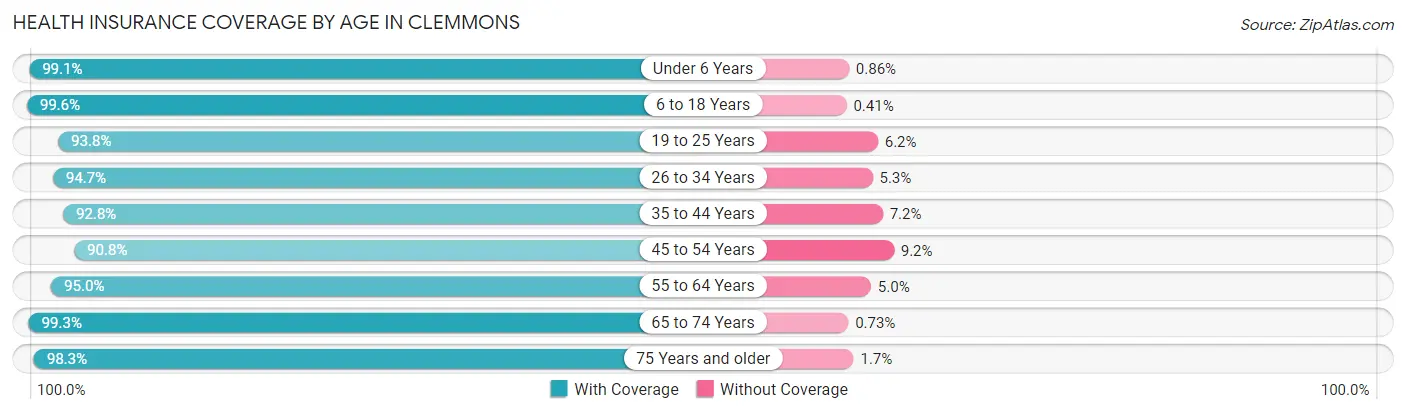
| Age Bracket | With Coverage | Without Coverage |
| Under 6 Years | 1,382 (99.1%) | 12 (0.9%) |
| 6 to 18 Years | 3,394 (99.6%) | 14 (0.4%) |
| 19 to 25 Years | 1,579 (93.8%) | 105 (6.2%) |
| 26 to 34 Years | 1,637 (94.7%) | 91 (5.3%) |
| 35 to 44 Years | 2,710 (92.8%) | 209 (7.2%) |
| 45 to 54 Years | 2,428 (90.8%) | 247 (9.2%) |
| 55 to 64 Years | 2,894 (95.0%) | 151 (5.0%) |
| 65 to 74 Years | 2,171 (99.3%) | 16 (0.7%) |
| 75 Years and older | 2,004 (98.3%) | 35 (1.7%) |
| Total | 20,199 (95.8%) | 880 (4.2%) |
Health Insurance Coverage by Citizenship Status in Clemmons
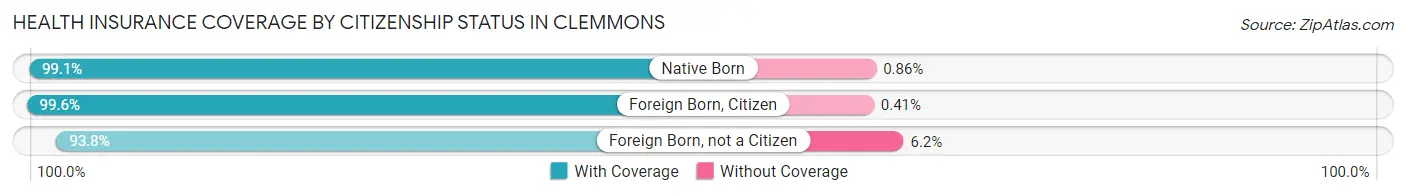
| Citizenship Status | With Coverage | Without Coverage |
| Native Born | 1,382 (99.1%) | 12 (0.9%) |
| Foreign Born, Citizen | 3,394 (99.6%) | 14 (0.4%) |
| Foreign Born, not a Citizen | 1,579 (93.8%) | 105 (6.2%) |
Health Insurance Coverage by Household Income in Clemmons
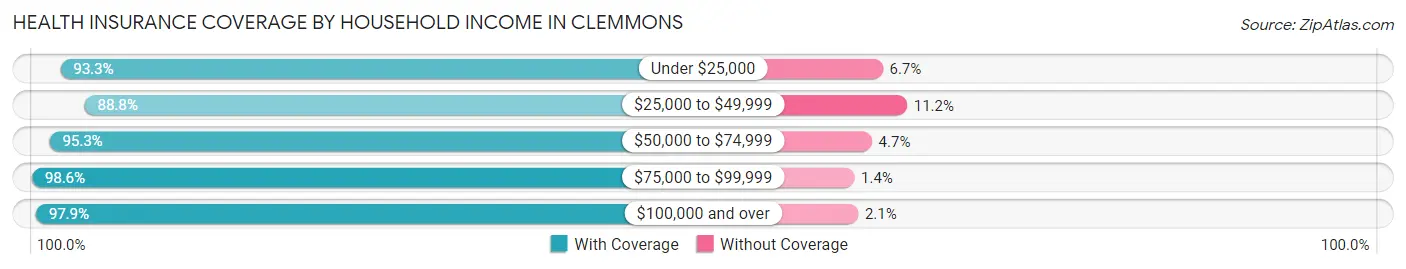
| Household Income | With Coverage | Without Coverage |
| Under $25,000 | 1,308 (93.3%) | 94 (6.7%) |
| $25,000 to $49,999 | 2,755 (88.8%) | 349 (11.2%) |
| $50,000 to $74,999 | 3,556 (95.3%) | 174 (4.7%) |
| $75,000 to $99,999 | 2,237 (98.6%) | 31 (1.4%) |
| $100,000 and over | 10,291 (97.9%) | 221 (2.1%) |
Public vs Private Health Insurance Coverage by Age in Clemmons
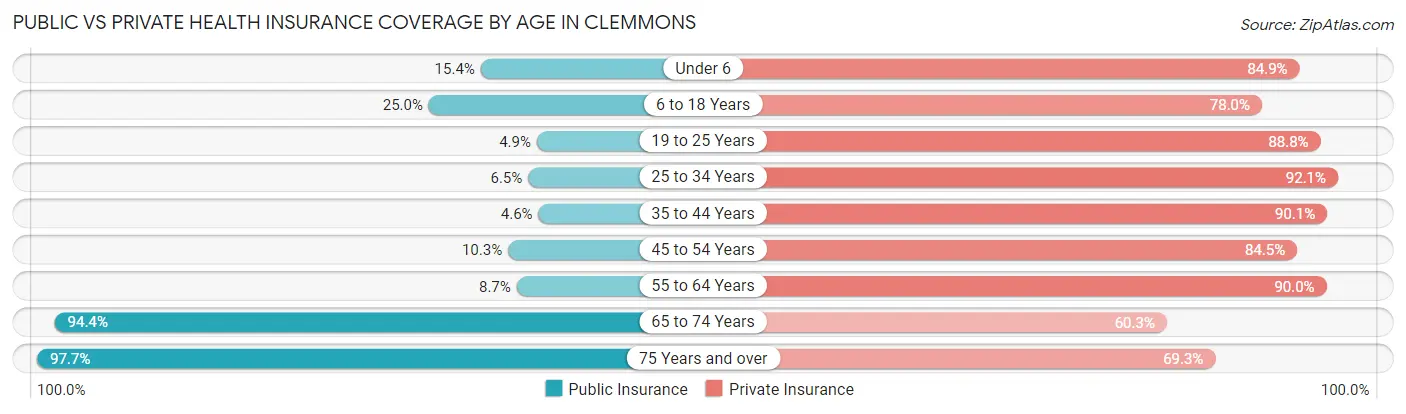
| Age Bracket | Public Insurance | Private Insurance |
| Under 6 | 214 (15.3%) | 1,184 (84.9%) |
| 6 to 18 Years | 851 (25.0%) | 2,657 (78.0%) |
| 19 to 25 Years | 83 (4.9%) | 1,496 (88.8%) |
| 25 to 34 Years | 113 (6.5%) | 1,591 (92.1%) |
| 35 to 44 Years | 135 (4.6%) | 2,629 (90.1%) |
| 45 to 54 Years | 275 (10.3%) | 2,260 (84.5%) |
| 55 to 64 Years | 264 (8.7%) | 2,739 (89.9%) |
| 65 to 74 Years | 2,065 (94.4%) | 1,319 (60.3%) |
| 75 Years and over | 1,992 (97.7%) | 1,413 (69.3%) |
| Total | 5,992 (28.4%) | 17,288 (82.0%) |
Disability Status by Sex by Age in Clemmons
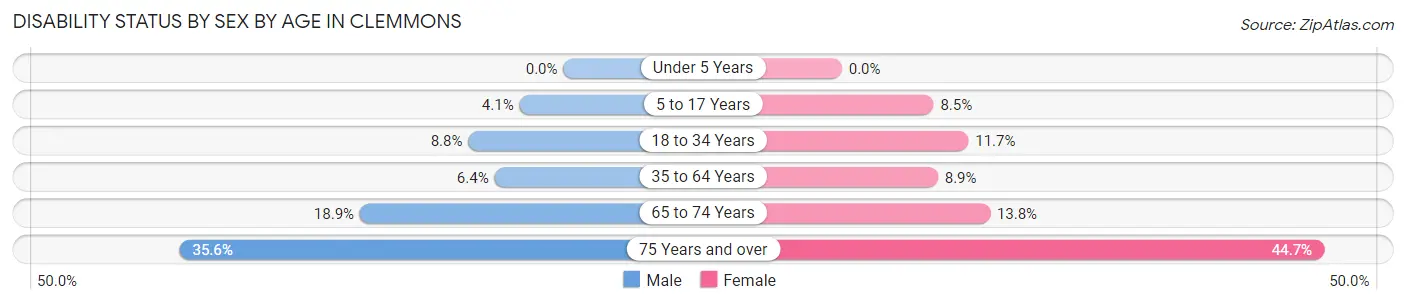
| Age Bracket | Male | Female |
| Under 5 Years | 0 (0.0%) | 0 (0.0%) |
| 5 to 17 Years | 76 (4.1%) | 137 (8.5%) |
| 18 to 34 Years | 158 (8.8%) | 218 (11.7%) |
| 35 to 64 Years | 269 (6.4%) | 395 (8.9%) |
| 65 to 74 Years | 185 (18.9%) | 166 (13.8%) |
| 75 Years and over | 286 (35.6%) | 553 (44.7%) |
Disability Class by Sex by Age in Clemmons
Disability Class: Hearing Difficulty
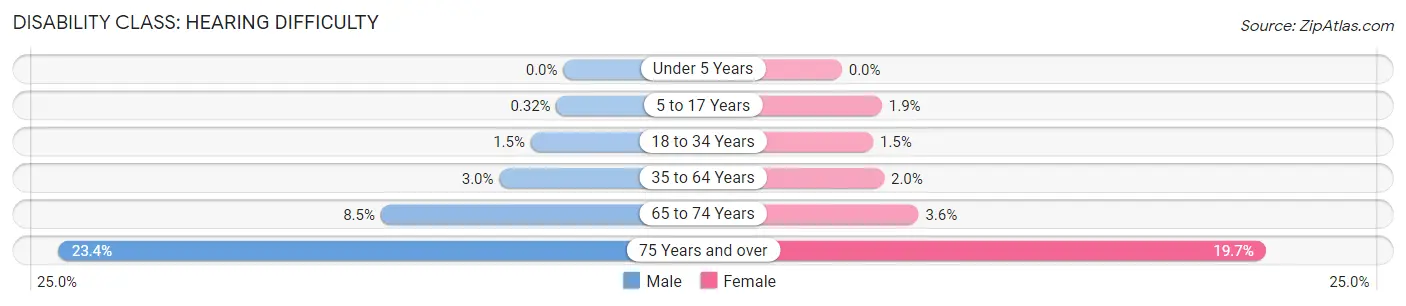
| Age Bracket | Male | Female |
| Under 5 Years | 0 (0.0%) | 0 (0.0%) |
| 5 to 17 Years | 6 (0.3%) | 30 (1.9%) |
| 18 to 34 Years | 27 (1.5%) | 27 (1.5%) |
| 35 to 64 Years | 125 (3.0%) | 87 (2.0%) |
| 65 to 74 Years | 83 (8.5%) | 43 (3.6%) |
| 75 Years and over | 188 (23.4%) | 243 (19.7%) |
Disability Class: Vision Difficulty
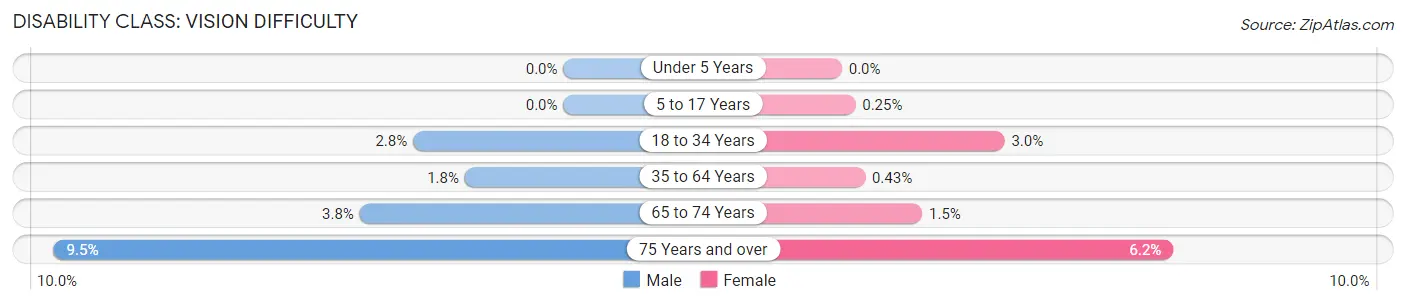
| Age Bracket | Male | Female |
| Under 5 Years | 0 (0.0%) | 0 (0.0%) |
| 5 to 17 Years | 0 (0.0%) | 4 (0.3%) |
| 18 to 34 Years | 50 (2.8%) | 56 (3.0%) |
| 35 to 64 Years | 77 (1.8%) | 19 (0.4%) |
| 65 to 74 Years | 37 (3.8%) | 18 (1.5%) |
| 75 Years and over | 76 (9.5%) | 76 (6.1%) |
Disability Class: Cognitive Difficulty
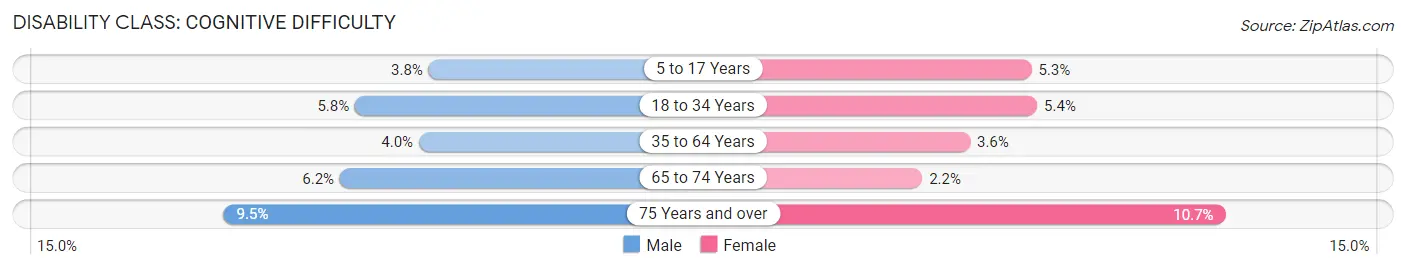
| Age Bracket | Male | Female |
| 5 to 17 Years | 70 (3.7%) | 85 (5.3%) |
| 18 to 34 Years | 104 (5.8%) | 101 (5.4%) |
| 35 to 64 Years | 169 (4.0%) | 158 (3.6%) |
| 65 to 74 Years | 61 (6.2%) | 27 (2.2%) |
| 75 Years and over | 76 (9.5%) | 132 (10.7%) |
Disability Class: Ambulatory Difficulty
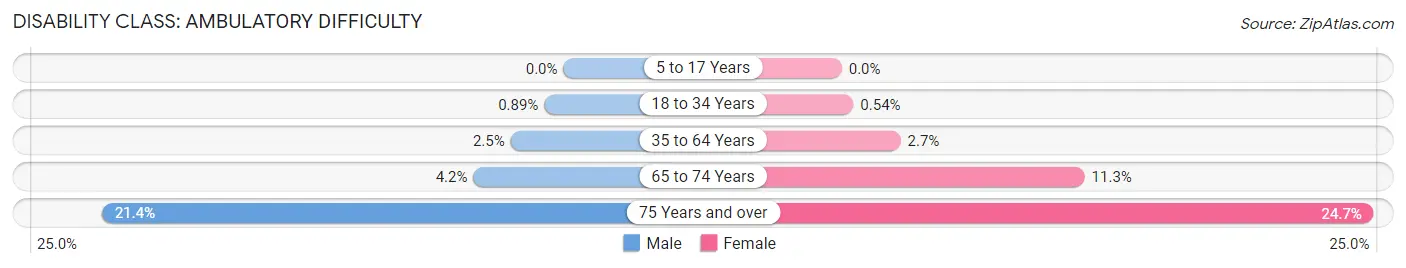
| Age Bracket | Male | Female |
| 5 to 17 Years | 0 (0.0%) | 0 (0.0%) |
| 18 to 34 Years | 16 (0.9%) | 10 (0.5%) |
| 35 to 64 Years | 103 (2.5%) | 121 (2.7%) |
| 65 to 74 Years | 41 (4.2%) | 136 (11.3%) |
| 75 Years and over | 172 (21.4%) | 305 (24.7%) |
Disability Class: Self-Care Difficulty
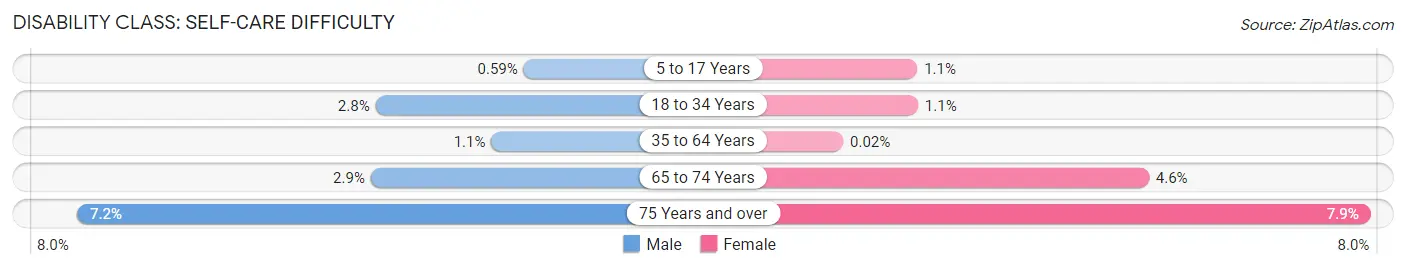
| Age Bracket | Male | Female |
| 5 to 17 Years | 11 (0.6%) | 18 (1.1%) |
| 18 to 34 Years | 50 (2.8%) | 21 (1.1%) |
| 35 to 64 Years | 45 (1.1%) | 1 (0.0%) |
| 65 to 74 Years | 28 (2.9%) | 55 (4.6%) |
| 75 Years and over | 58 (7.2%) | 97 (7.9%) |
Technology Access in Clemmons
Computing Device Access in Clemmons
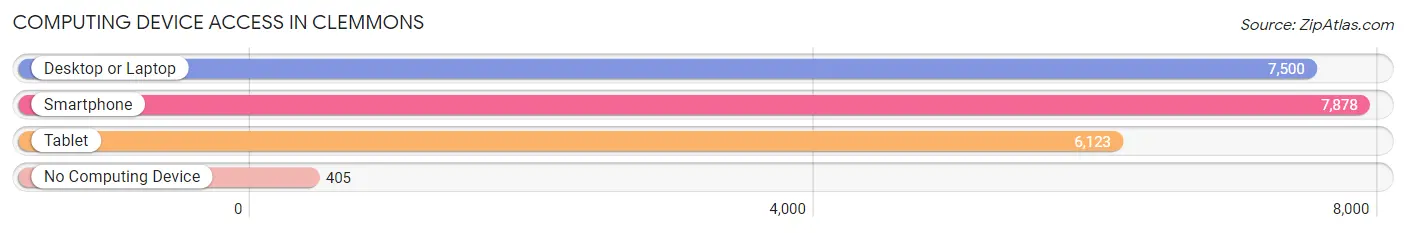
| Device Type | # Households | % Households |
| Desktop or Laptop | 7,500 | 85.7% |
| Smartphone | 7,878 | 90.0% |
| Tablet | 6,123 | 70.0% |
| No Computing Device | 405 | 4.6% |
| Total | 8,748 | 100.0% |
Internet Access in Clemmons
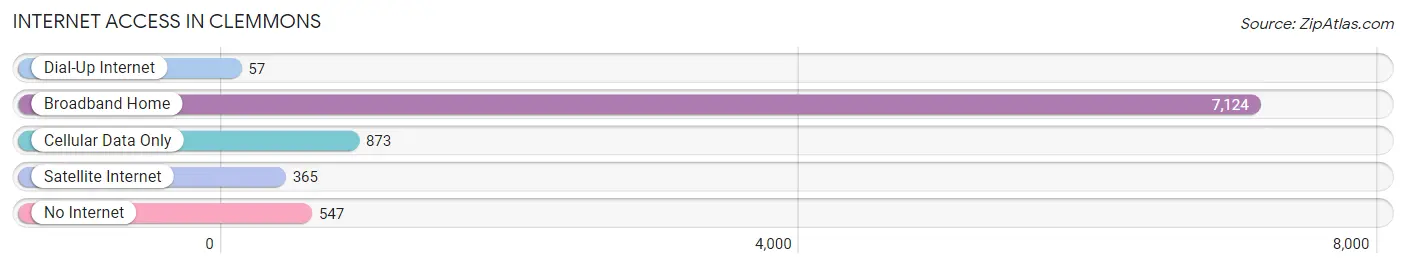
| Internet Type | # Households | % Households |
| Dial-Up Internet | 57 | 0.6% |
| Broadband Home | 7,124 | 81.4% |
| Cellular Data Only | 873 | 10.0% |
| Satellite Internet | 365 | 4.2% |
| No Internet | 547 | 6.2% |
| Total | 8,748 | 100.0% |
Clemmons Summary
Clemmons is a village located in Forsyth County, North Carolina. It is situated in the Piedmont Triad region of the state, and is part of the Winston-Salem metropolitan area. The village has a population of approximately 18,000 people, and is located just west of Winston-Salem.
Geography
Clemmons is located in the Piedmont Triad region of North Carolina, and is situated in the foothills of the Blue Ridge Mountains. The village is located in the Yadkin Valley, and is bordered by the towns of Lewisville, Advance, and Bermuda Run. The village is located just west of Winston-Salem, and is approximately 15 miles from the city. The village is located at an elevation of 890 feet above sea level.
The village is located in a humid subtropical climate zone, and experiences hot, humid summers and mild winters. The average annual temperature is around 60 degrees Fahrenheit, and the average annual precipitation is around 45 inches.
History
The area that is now Clemmons was first settled in the late 1700s by German immigrants. The village was originally known as Clemmonsville, and was named after the Clemmons family, who were among the first settlers in the area. The village was officially incorporated in 1802, and was initially a farming community.
In the late 1800s, the village began to grow and develop, and by the early 1900s, it had become a popular tourist destination. The village was home to several resorts, and was known for its mineral springs. The village also became a popular destination for wealthy families from the nearby cities of Winston-Salem and Greensboro.
In the mid-1900s, the village began to experience rapid growth, and by the late 1970s, it had become a bedroom community for the nearby cities of Winston-Salem and Greensboro. The village has continued to grow and develop since then, and is now home to a variety of businesses and industries.
Economy
The economy of Clemmons is largely based on the service industry. The village is home to a variety of retail stores, restaurants, and other businesses. The village is also home to several manufacturing companies, including a furniture manufacturer, a plastics manufacturer, and a printing company.
The village is also home to several educational institutions, including a community college, a technical college, and a private university. The village is also home to a variety of healthcare facilities, including a hospital and several medical clinics.
Demographics
As of the 2010 census, the population of Clemmons was 17,945. The racial makeup of the village was 87.3% White, 8.2% African American, 0.7% Native American, 1.2% Asian, 0.1% Pacific Islander, and 2.5% from other races. Hispanic or Latino of any race were 4.2% of the population.
The median household income in Clemmons was $60,945, and the median family income was $71,945. The per capita income in the village was $30,945. The village has a poverty rate of 8.2%.
Conclusion
Clemmons is a village located in Forsyth County, North Carolina. It is situated in the Piedmont Triad region of the state, and is part of the Winston-Salem metropolitan area. The village has a population of approximately 18,000 people, and is located just west of Winston-Salem. The village is located in a humid subtropical climate zone, and experiences hot, humid summers and mild winters. The economy of Clemmons is largely based on the service industry, and the village is home to a variety of retail stores, restaurants, and other businesses. The racial makeup of the village is 87.3% White, 8.2% African American, 0.7% Native American, 1.2% Asian, 0.1% Pacific Islander, and 2.5% from other races. The median household income in Clemmons was $60,945, and the median family income was $71,945. The per capita income in the village was $30,945. The village has a poverty rate of 8.2%.
Common Questions
What is Per Capita Income in Clemmons?
Per Capita income in Clemmons is $44,978.
What is the Median Family Income in Clemmons?
Median Family Income in Clemmons is $111,113.
What is the Median Household income in Clemmons?
Median Household Income in Clemmons is $75,667.
What is Income or Wage Gap in Clemmons?
Income or Wage Gap in Clemmons is 32.0%.
Women in Clemmons earn 68.0 cents for every dollar earned by a man.
What is Family Income Deficit in Clemmons?
Family Income Deficit in Clemmons is $13,181.
Families that are below poverty line in Clemmons earn $13,181 less on average than the poverty threshold level.
What is Inequality or Gini Index in Clemmons?
Inequality or Gini Index in Clemmons is 0.44.
What is the Total Population of Clemmons?
Total Population of Clemmons is 21,281.
What is the Total Male Population of Clemmons?
Total Male Population of Clemmons is 10,332.
What is the Total Female Population of Clemmons?
Total Female Population of Clemmons is 10,949.
What is the Ratio of Males per 100 Females in Clemmons?
There are 94.36 Males per 100 Females in Clemmons.
What is the Ratio of Females per 100 Males in Clemmons?
There are 105.97 Females per 100 Males in Clemmons.
What is the Median Population Age in Clemmons?
Median Population Age in Clemmons is 42.4 Years.
What is the Average Family Size in Clemmons
Average Family Size in Clemmons is 3.0 People.
What is the Average Household Size in Clemmons
Average Household Size in Clemmons is 2.4 People.
How Large is the Labor Force in Clemmons?
There are 10,513 People in the Labor Forcein in Clemmons.
What is the Percentage of People in the Labor Force in Clemmons?
61.3% of People are in the Labor Force in Clemmons.
What is the Unemployment Rate in Clemmons?
Unemployment Rate in Clemmons is 5.0%.