Belmont, NC Map & Demographics
Belmont Map
Belmont Overview
$52,690
PER CAPITA INCOME
$123,415
AVG FAMILY INCOME
$84,274
AVG HOUSEHOLD INCOME
23.9%
WAGE / INCOME GAP [ % ]
76.1¢/ $1
WAGE / INCOME GAP [ $ ]
$8,203
FAMILY INCOME DEFICIT
0.52
INEQUALITY / GINI INDEX
14,842
TOTAL POPULATION
6,562
MALE POPULATION
8,280
FEMALE POPULATION
79.25
MALES / 100 FEMALES
126.18
FEMALES / 100 MALES
37.9
MEDIAN AGE
3.0
AVG FAMILY SIZE
2.3
AVG HOUSEHOLD SIZE
7,964
LABOR FORCE [ PEOPLE ]
65.7%
PERCENT IN LABOR FORCE
4.4%
UNEMPLOYMENT RATE
Belmont Zip Codes
Income in Belmont
Income Overview in Belmont
Per Capita Income in Belmont is $52,690, while median incomes of families and households are $123,415 and $84,274 respectively.
| Characteristic | Number | Measure |
| Per Capita Income | 14,842 | $52,690 |
| Median Family Income | 3,532 | $123,415 |
| Mean Family Income | 3,532 | $162,279 |
| Median Household Income | 6,049 | $84,274 |
| Mean Household Income | 6,049 | $129,729 |
| Income Deficit | 3,532 | $8,203 |
| Wage / Income Gap (%) | 14,842 | 23.92% |
| Wage / Income Gap ($) | 14,842 | 76.08¢ per $1 |
| Gini / Inequality Index | 14,842 | 0.52 |
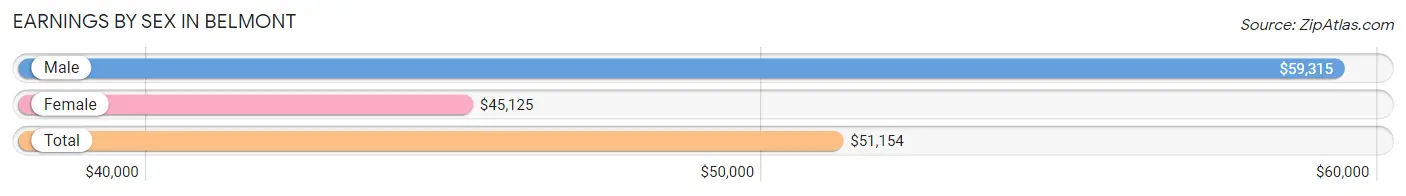
Earnings by Sex in Belmont
Average Earnings in Belmont are $51,154, $59,315 for men and $45,125 for women, a difference of 23.9%.
| Sex | Number | Average Earnings |
| Male | 4,252 (51.4%) | $59,315 |
| Female | 4,020 (48.6%) | $45,125 |
| Total | 8,272 (100.0%) | $51,154 |
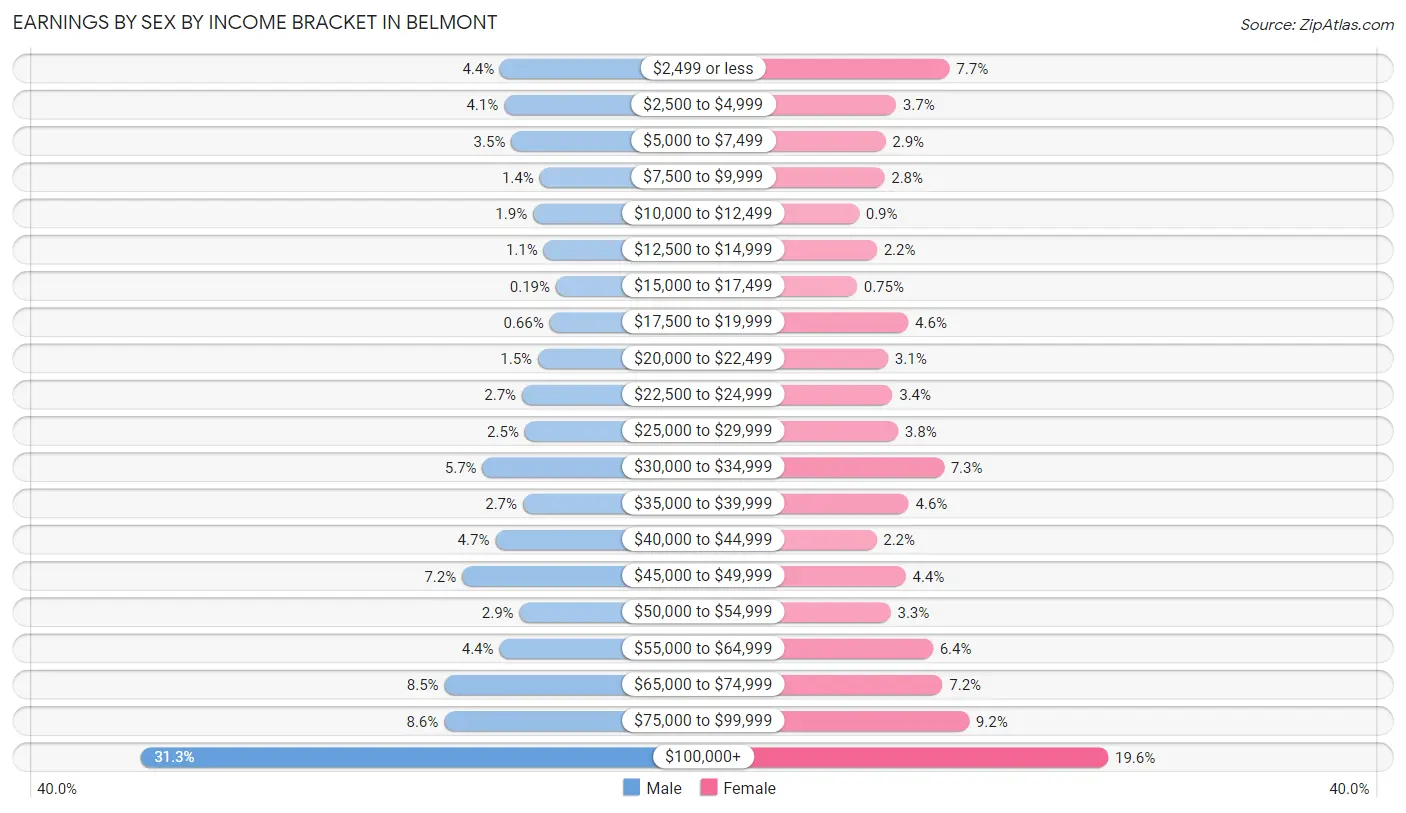
Earnings by Sex by Income Bracket in Belmont
The most common earnings brackets in Belmont are $100,000+ for men (1,329 | 31.3%) and $100,000+ for women (787 | 19.6%).
| Income | Male | Female |
| $2,499 or less | 186 (4.4%) | 309 (7.7%) |
| $2,500 to $4,999 | 173 (4.1%) | 148 (3.7%) |
| $5,000 to $7,499 | 150 (3.5%) | 116 (2.9%) |
| $7,500 to $9,999 | 60 (1.4%) | 113 (2.8%) |
| $10,000 to $12,499 | 81 (1.9%) | 36 (0.9%) |
| $12,500 to $14,999 | 47 (1.1%) | 90 (2.2%) |
| $15,000 to $17,499 | 8 (0.2%) | 30 (0.7%) |
| $17,500 to $19,999 | 28 (0.7%) | 185 (4.6%) |
| $20,000 to $22,499 | 65 (1.5%) | 124 (3.1%) |
| $22,500 to $24,999 | 116 (2.7%) | 137 (3.4%) |
| $25,000 to $29,999 | 107 (2.5%) | 154 (3.8%) |
| $30,000 to $34,999 | 242 (5.7%) | 292 (7.3%) |
| $35,000 to $39,999 | 113 (2.7%) | 186 (4.6%) |
| $40,000 to $44,999 | 201 (4.7%) | 89 (2.2%) |
| $45,000 to $49,999 | 307 (7.2%) | 177 (4.4%) |
| $50,000 to $54,999 | 124 (2.9%) | 132 (3.3%) |
| $55,000 to $64,999 | 188 (4.4%) | 259 (6.4%) |
| $65,000 to $74,999 | 363 (8.5%) | 288 (7.2%) |
| $75,000 to $99,999 | 364 (8.6%) | 368 (9.1%) |
| $100,000+ | 1,329 (31.3%) | 787 (19.6%) |
| Total | 4,252 (100.0%) | 4,020 (100.0%) |
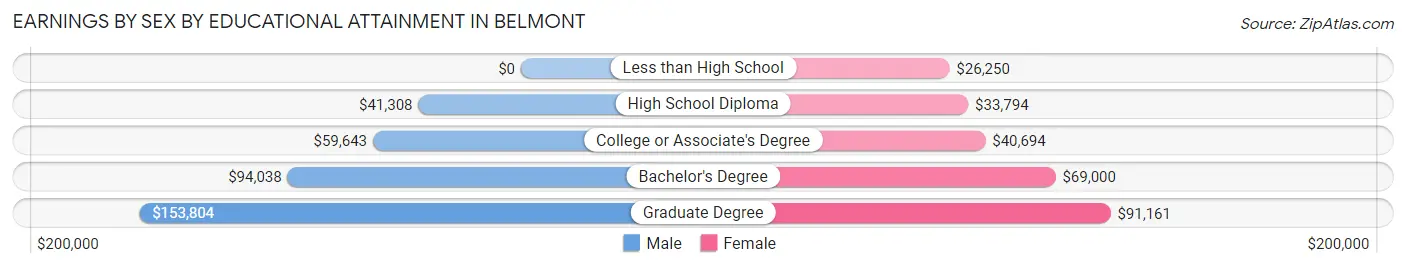
Earnings by Sex by Educational Attainment in Belmont
Average earnings in Belmont are $72,685 for men and $53,564 for women, a difference of 26.3%. Men with an educational attainment of graduate degree enjoy the highest average annual earnings of $153,804, while those with high school diploma education earn the least with $41,308. Women with an educational attainment of graduate degree earn the most with the average annual earnings of $91,161, while those with less than high school education have the smallest earnings of $26,250.
| Educational Attainment | Male Income | Female Income |
| Less than High School | - | - |
| High School Diploma | $41,308 | $33,794 |
| College or Associate's Degree | $59,643 | $40,694 |
| Bachelor's Degree | $94,038 | $69,000 |
| Graduate Degree | $153,804 | $91,161 |
| Total | $72,685 | $53,564 |
Family Income in Belmont
Family Income Brackets in Belmont
According to the Belmont family income data, there are 795 families falling into the $200,000+ income range, which is the most common income bracket and makes up 22.5% of all families. Conversely, the $10,000 to $14,999 income bracket is the least frequent group with only 18 families (0.5%) belonging to this category.
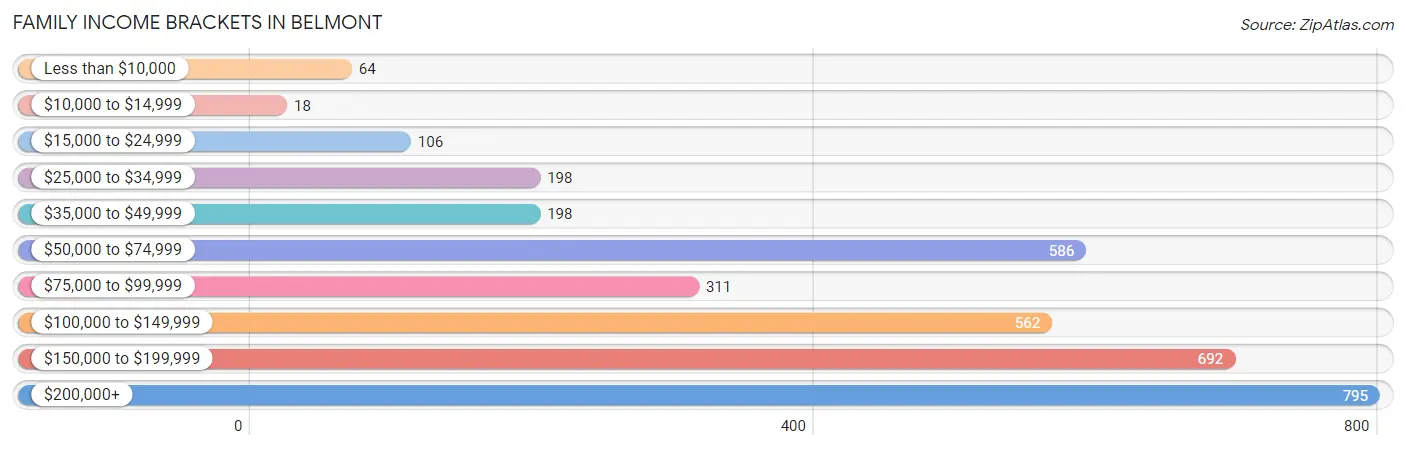
| Income Bracket | # Families | % Families |
| Less than $10,000 | 64 | 1.8% |
| $10,000 to $14,999 | 18 | 0.5% |
| $15,000 to $24,999 | 106 | 3.0% |
| $25,000 to $34,999 | 198 | 5.6% |
| $35,000 to $49,999 | 198 | 5.6% |
| $50,000 to $74,999 | 586 | 16.6% |
| $75,000 to $99,999 | 311 | 8.8% |
| $100,000 to $149,999 | 562 | 15.9% |
| $150,000 to $199,999 | 692 | 19.6% |
| $200,000+ | 795 | 22.5% |
Family Income by Famaliy Size in Belmont
6-person families (75 | 2.1%) account for the highest median family income in Belmont with $228,406 per family, while 4-person families (747 | 21.1%) have the highest median income of $44,986 per family member.
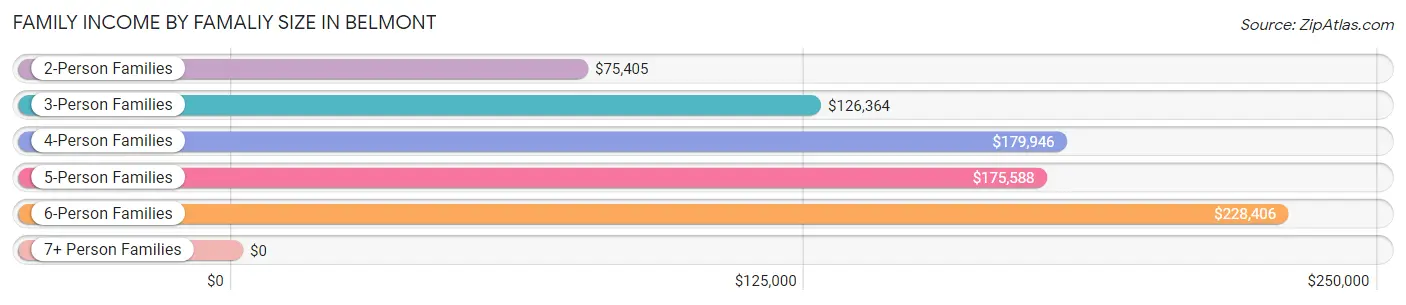
| Income Bracket | # Families | Median Income |
| 2-Person Families | 1,636 (46.3%) | $75,405 |
| 3-Person Families | 814 (23.1%) | $126,364 |
| 4-Person Families | 747 (21.1%) | $179,946 |
| 5-Person Families | 250 (7.1%) | $175,588 |
| 6-Person Families | 75 (2.1%) | $228,406 |
| 7+ Person Families | 10 (0.3%) | $0 |
| Total | 3,532 (100.0%) | $123,415 |
Family Income by Number of Earners in Belmont
The median family income in Belmont is $123,415, with families comprising 3+ earners (486) having the highest median family income of $192,746, while families with no earners (340) have the lowest median family income of $62,656, accounting for 13.8% and 9.6% of families, respectively.
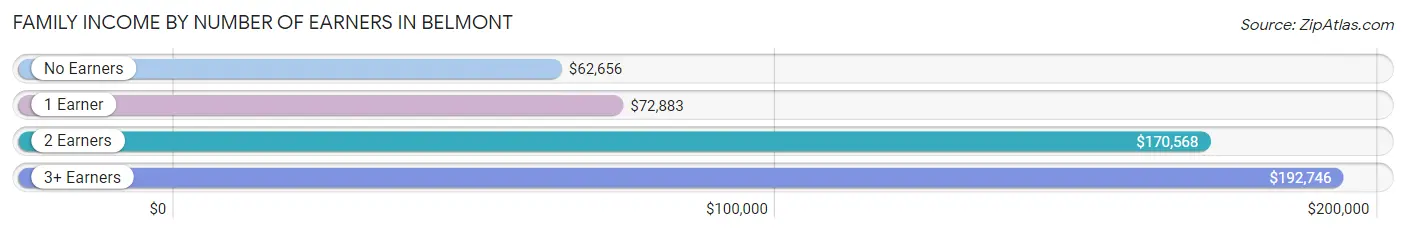
| Number of Earners | # Families | Median Income |
| No Earners | 340 (9.6%) | $62,656 |
| 1 Earner | 1,255 (35.5%) | $72,883 |
| 2 Earners | 1,451 (41.1%) | $170,568 |
| 3+ Earners | 486 (13.8%) | $192,746 |
| Total | 3,532 (100.0%) | $123,415 |
Household Income in Belmont
Household Income Brackets in Belmont
With 1,004 households falling in the category, the $200,000+ income range is the most frequent in Belmont, accounting for 16.6% of all households. In contrast, only 169 households (2.8%) fall into the $10,000 to $14,999 income bracket, making it the least populous group.
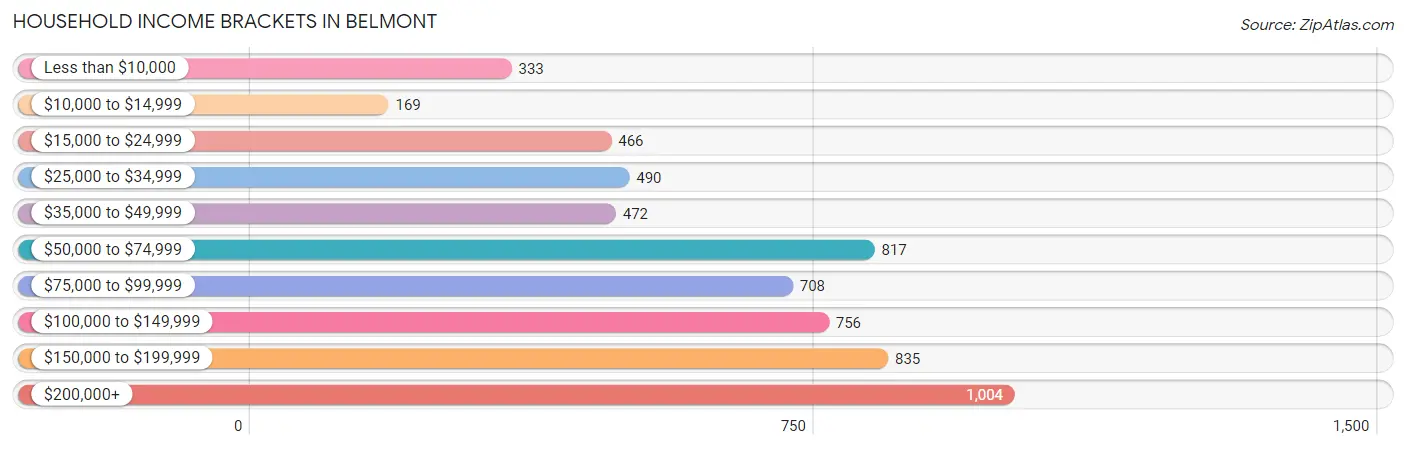
| Income Bracket | # Households | % Households |
| Less than $10,000 | 333 | 5.5% |
| $10,000 to $14,999 | 169 | 2.8% |
| $15,000 to $24,999 | 466 | 7.7% |
| $25,000 to $34,999 | 490 | 8.1% |
| $35,000 to $49,999 | 472 | 7.8% |
| $50,000 to $74,999 | 817 | 13.5% |
| $75,000 to $99,999 | 708 | 11.7% |
| $100,000 to $149,999 | 756 | 12.5% |
| $150,000 to $199,999 | 835 | 13.8% |
| $200,000+ | 1,004 | 16.6% |
Household Income by Householder Age in Belmont
The median household income in Belmont is $84,274, with the highest median household income of $120,000 found in the 25 to 44 years age bracket for the primary householder. A total of 2,090 households (34.5%) fall into this category. Meanwhile, the 15 to 24 years age bracket for the primary householder has the lowest median household income of $0, with 144 households (2.4%) in this group.
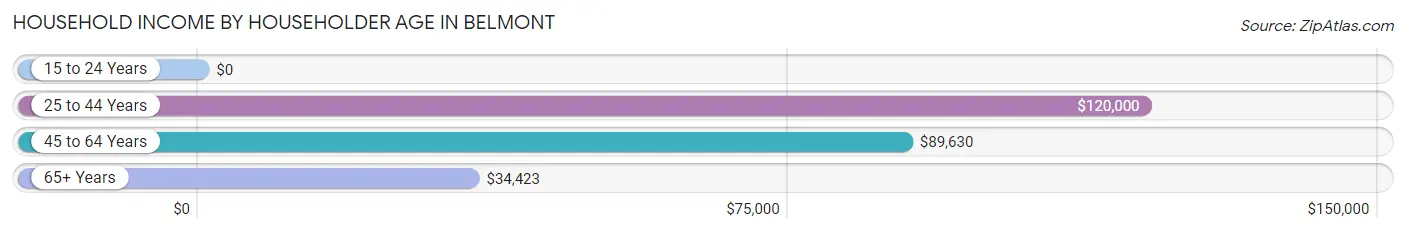
| Income Bracket | # Households | Median Income |
| 15 to 24 Years | 144 (2.4%) | $0 |
| 25 to 44 Years | 2,090 (34.5%) | $120,000 |
| 45 to 64 Years | 2,203 (36.4%) | $89,630 |
| 65+ Years | 1,612 (26.7%) | $34,423 |
| Total | 6,049 (100.0%) | $84,274 |
Poverty in Belmont
Income Below Poverty by Sex and Age in Belmont
With 5.9% poverty level for males and 13.9% for females among the residents of Belmont, 45 to 54 year old males and 18 to 24 year old females are the most vulnerable to poverty, with 121 males (12.1%) and 116 females (29.0%) in their respective age groups living below the poverty level.
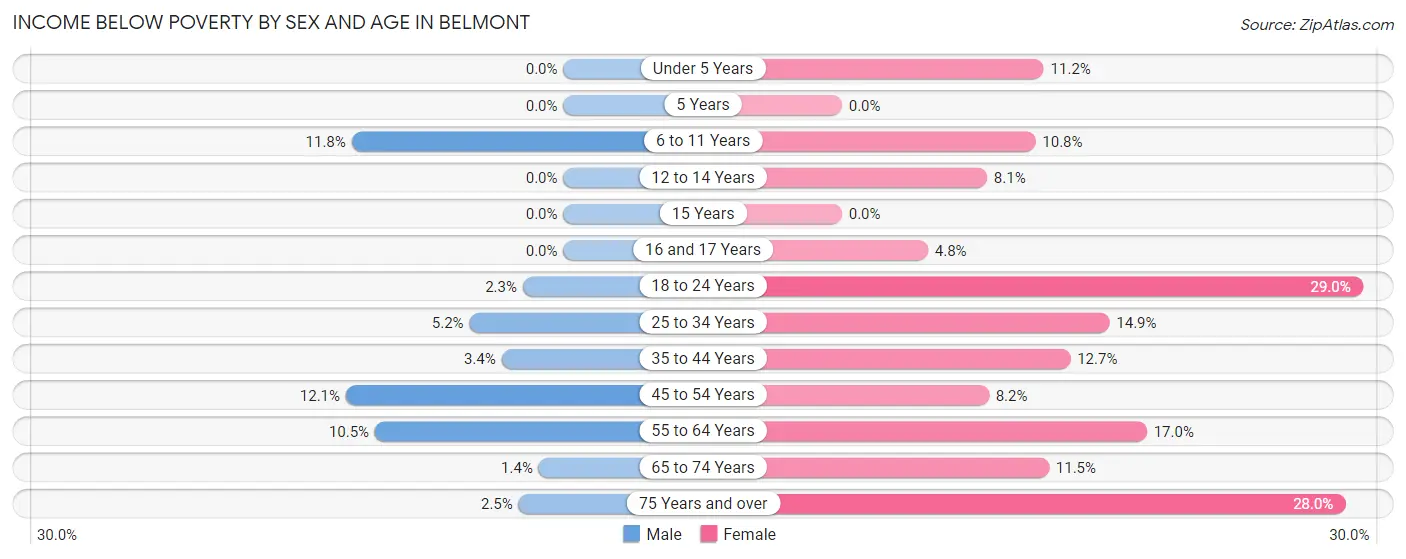
| Age Bracket | Male | Female |
| Under 5 Years | 0 (0.0%) | 58 (11.2%) |
| 5 Years | 0 (0.0%) | 0 (0.0%) |
| 6 to 11 Years | 48 (11.8%) | 77 (10.8%) |
| 12 to 14 Years | 0 (0.0%) | 34 (8.1%) |
| 15 Years | 0 (0.0%) | 0 (0.0%) |
| 16 and 17 Years | 0 (0.0%) | 9 (4.8%) |
| 18 to 24 Years | 10 (2.3%) | 116 (29.0%) |
| 25 to 34 Years | 58 (5.2%) | 171 (14.9%) |
| 35 to 44 Years | 34 (3.4%) | 118 (12.7%) |
| 45 to 54 Years | 121 (12.1%) | 91 (8.2%) |
| 55 to 64 Years | 83 (10.5%) | 161 (17.0%) |
| 65 to 74 Years | 8 (1.4%) | 102 (11.5%) |
| 75 Years and over | 6 (2.5%) | 155 (28.0%) |
| Total | 368 (5.9%) | 1,092 (13.9%) |
Income Above Poverty by Sex and Age in Belmont
According to the poverty statistics in Belmont, males aged under 5 years and females aged 5 years are the age groups that are most secure financially, with 100.0% of males and 100.0% of females in these age groups living above the poverty line.
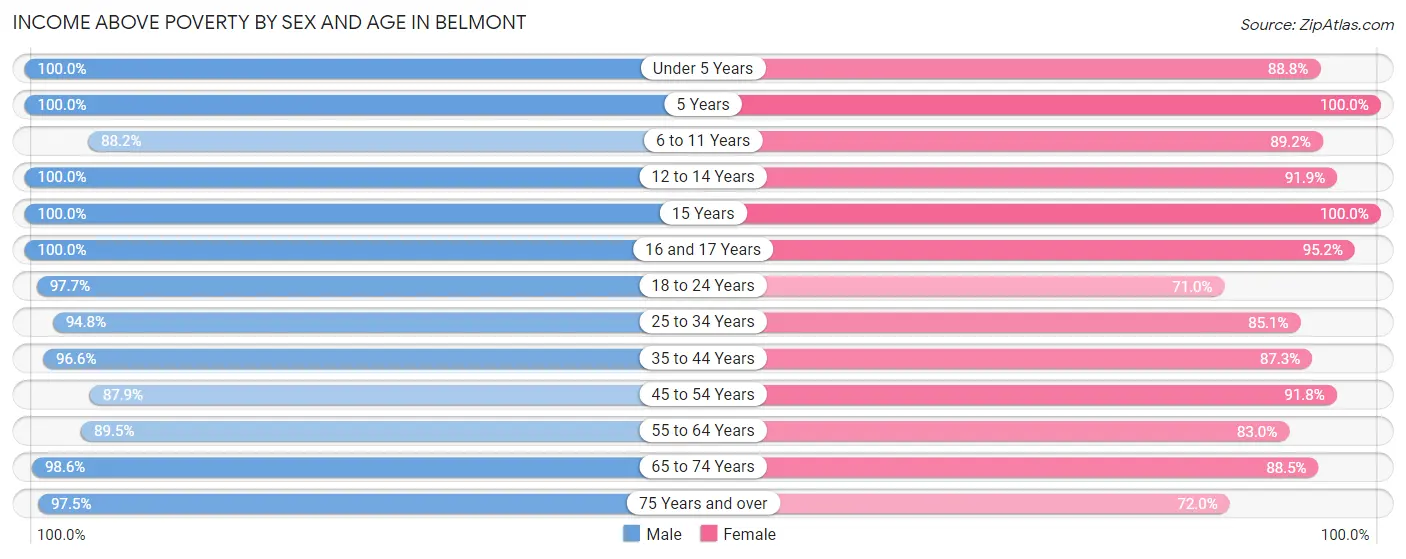
| Age Bracket | Male | Female |
| Under 5 Years | 157 (100.0%) | 458 (88.8%) |
| 5 Years | 134 (100.0%) | 4 (100.0%) |
| 6 to 11 Years | 359 (88.2%) | 637 (89.2%) |
| 12 to 14 Years | 151 (100.0%) | 387 (91.9%) |
| 15 Years | 114 (100.0%) | 67 (100.0%) |
| 16 and 17 Years | 160 (100.0%) | 179 (95.2%) |
| 18 to 24 Years | 432 (97.7%) | 284 (71.0%) |
| 25 to 34 Years | 1,050 (94.8%) | 977 (85.1%) |
| 35 to 44 Years | 955 (96.6%) | 810 (87.3%) |
| 45 to 54 Years | 878 (87.9%) | 1,021 (91.8%) |
| 55 to 64 Years | 708 (89.5%) | 787 (83.0%) |
| 65 to 74 Years | 578 (98.6%) | 783 (88.5%) |
| 75 Years and over | 235 (97.5%) | 398 (72.0%) |
| Total | 5,911 (94.1%) | 6,792 (86.2%) |
Income Below Poverty Among Married-Couple Families in Belmont
The poverty statistics for married-couple families in Belmont show that 0.8% or 20 of the total 2,617 families live below the poverty line. Families with no children have the highest poverty rate of 1.4%, comprising of 20 families. On the other hand, families with 1 or 2 children have the lowest poverty rate of 0.0%, which includes 0 families.
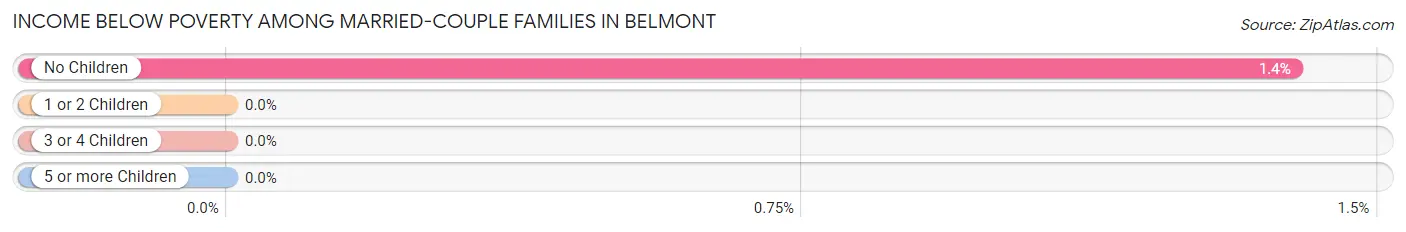
| Children | Above Poverty | Below Poverty |
| No Children | 1,424 (98.6%) | 20 (1.4%) |
| 1 or 2 Children | 941 (100.0%) | 0 (0.0%) |
| 3 or 4 Children | 222 (100.0%) | 0 (0.0%) |
| 5 or more Children | 10 (100.0%) | 0 (0.0%) |
| Total | 2,597 (99.2%) | 20 (0.8%) |
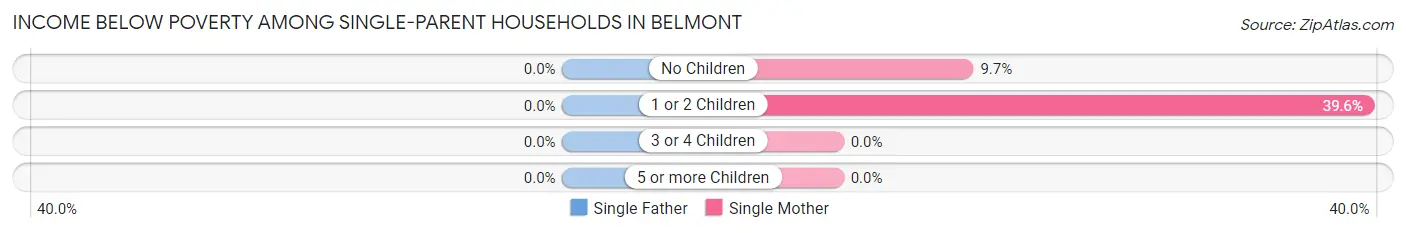
Income Below Poverty Among Single-Parent Households in Belmont
| Children | Single Father | Single Mother |
| No Children | 0 (0.0%) | 26 (9.7%) |
| 1 or 2 Children | 0 (0.0%) | 148 (39.6%) |
| 3 or 4 Children | 0 (0.0%) | 0 (0.0%) |
| 5 or more Children | 0 (0.0%) | 0 (0.0%) |
| Total | 0 (0.0%) | 174 (26.2%) |
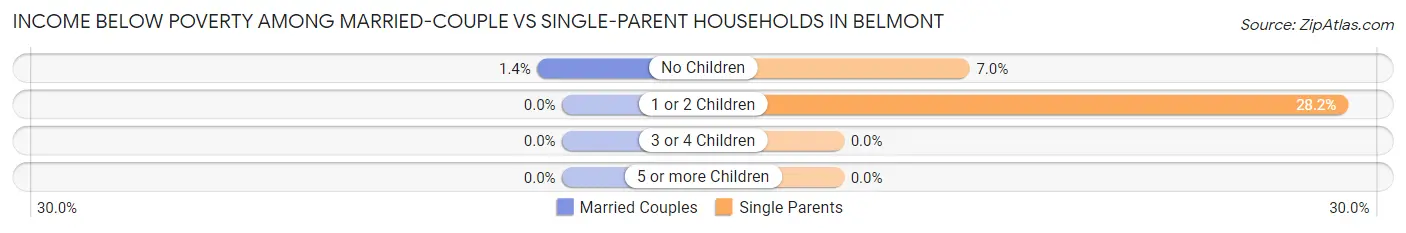
Income Below Poverty Among Married-Couple vs Single-Parent Households in Belmont
The poverty data for Belmont shows that 20 of the married-couple family households (0.8%) and 174 of the single-parent households (19.0%) are living below the poverty level. Within the married-couple family households, those with no children have the highest poverty rate, with 20 households (1.4%) falling below the poverty line. Among the single-parent households, those with 1 or 2 children have the highest poverty rate, with 148 household (28.2%) living below poverty.
| Children | Married-Couple Families | Single-Parent Households |
| No Children | 20 (1.4%) | 26 (7.0%) |
| 1 or 2 Children | 0 (0.0%) | 148 (28.2%) |
| 3 or 4 Children | 0 (0.0%) | 0 (0.0%) |
| 5 or more Children | 0 (0.0%) | 0 (0.0%) |
| Total | 20 (0.8%) | 174 (19.0%) |
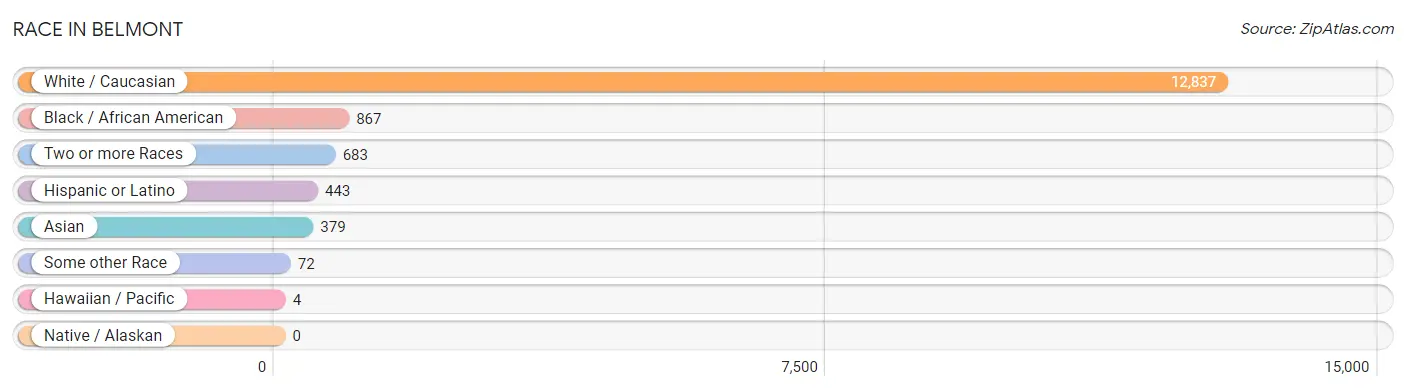
Race in Belmont
The most populous races in Belmont are White / Caucasian (12,837 | 86.5%), Black / African American (867 | 5.8%), and Two or more Races (683 | 4.6%).
| Race | # Population | % Population |
| Asian | 379 | 2.5% |
| Black / African American | 867 | 5.8% |
| Hawaiian / Pacific | 4 | 0.0% |
| Hispanic or Latino | 443 | 3.0% |
| Native / Alaskan | 0 | 0.0% |
| White / Caucasian | 12,837 | 86.5% |
| Two or more Races | 683 | 4.6% |
| Some other Race | 72 | 0.5% |
| Total | 14,842 | 100.0% |
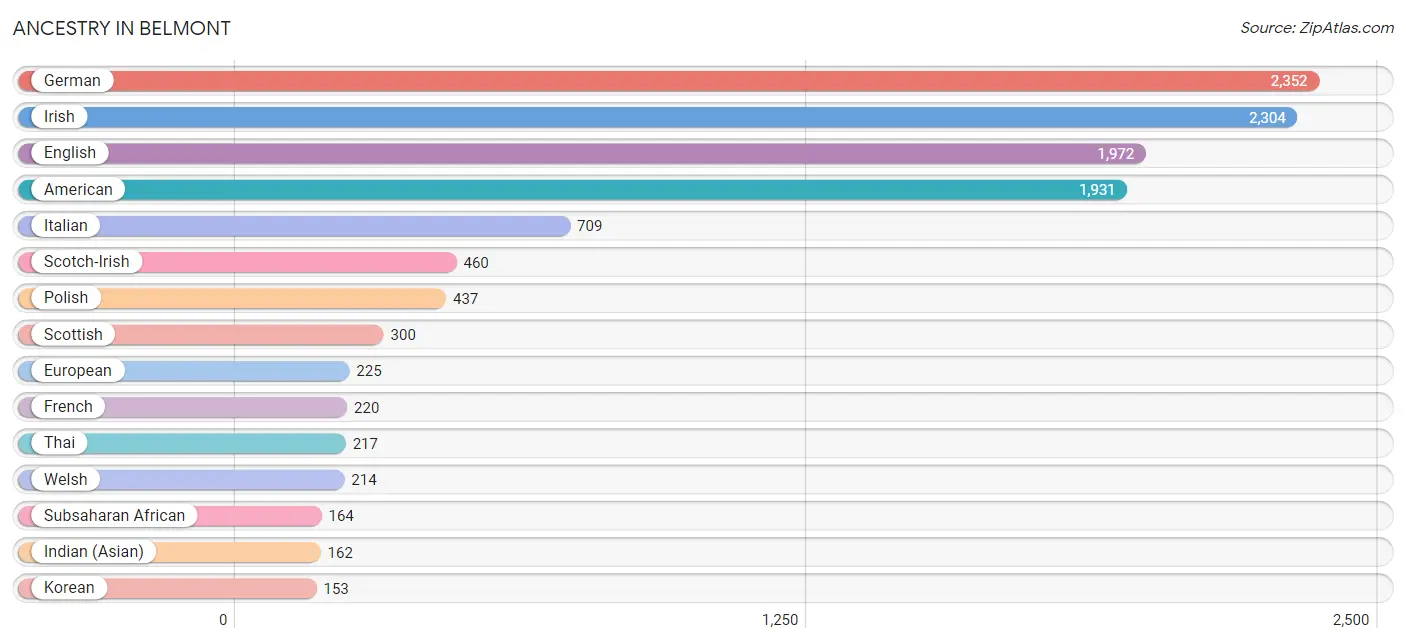
Ancestry in Belmont
The most populous ancestries reported in Belmont are German (2,352 | 15.9%), Irish (2,304 | 15.5%), English (1,972 | 13.3%), American (1,931 | 13.0%), and Italian (709 | 4.8%), together accounting for 62.4% of all Belmont residents.
| Ancestry | # Population | % Population |
| African | 13 | 0.1% |
| American | 1,931 | 13.0% |
| Arab | 15 | 0.1% |
| Armenian | 8 | 0.1% |
| Australian | 2 | 0.0% |
| Austrian | 15 | 0.1% |
| Blackfeet | 37 | 0.3% |
| Bolivian | 23 | 0.2% |
| British | 139 | 0.9% |
| Burmese | 21 | 0.1% |
| Central American | 9 | 0.1% |
| Cherokee | 80 | 0.5% |
| Cheyenne | 7 | 0.1% |
| Colombian | 6 | 0.0% |
| Cuban | 85 | 0.6% |
| Czech | 52 | 0.4% |
| Czechoslovakian | 17 | 0.1% |
| Danish | 26 | 0.2% |
| Dutch | 143 | 1.0% |
| Egyptian | 15 | 0.1% |
| English | 1,972 | 13.3% |
| European | 225 | 1.5% |
| Finnish | 39 | 0.3% |
| French | 220 | 1.5% |
| French Canadian | 72 | 0.5% |
| German | 2,352 | 15.9% |
| Greek | 43 | 0.3% |
| Guamanian / Chamorro | 1 | 0.0% |
| Haitian | 17 | 0.1% |
| Hungarian | 21 | 0.1% |
| Indian (Asian) | 162 | 1.1% |
| Indonesian | 3 | 0.0% |
| Irish | 2,304 | 15.5% |
| Italian | 709 | 4.8% |
| Japanese | 120 | 0.8% |
| Korean | 153 | 1.0% |
| Mexican | 25 | 0.2% |
| Norwegian | 58 | 0.4% |
| Okinawan | 2 | 0.0% |
| Peruvian | 11 | 0.1% |
| Polish | 437 | 2.9% |
| Portuguese | 3 | 0.0% |
| Puerto Rican | 151 | 1.0% |
| Romanian | 29 | 0.2% |
| Russian | 55 | 0.4% |
| Salvadoran | 9 | 0.1% |
| Scandinavian | 80 | 0.5% |
| Scotch-Irish | 460 | 3.1% |
| Scottish | 300 | 2.0% |
| Slovak | 81 | 0.5% |
| South African | 86 | 0.6% |
| South American | 152 | 1.0% |
| Sri Lankan | 144 | 1.0% |
| Subsaharan African | 164 | 1.1% |
| Swedish | 29 | 0.2% |
| Thai | 217 | 1.5% |
| Ukrainian | 27 | 0.2% |
| Venezuelan | 112 | 0.7% |
| Welsh | 214 | 1.4% | View All 59 Rows |
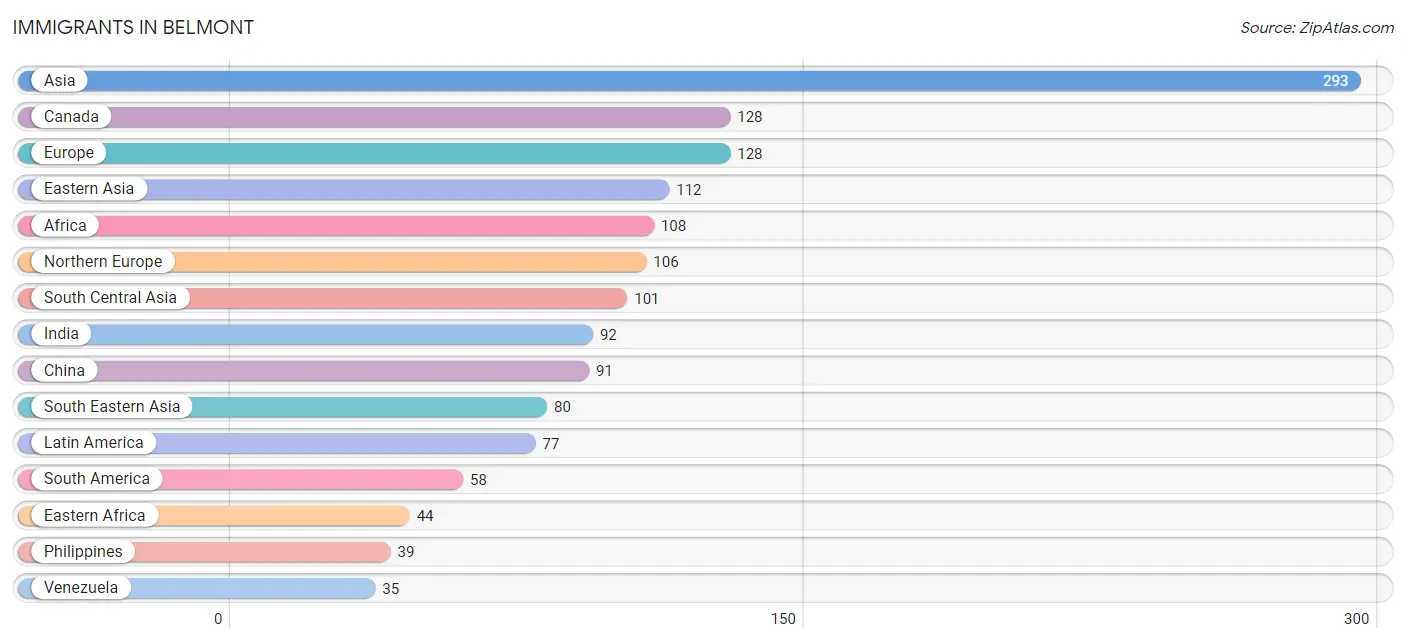
Immigrants in Belmont
The most numerous immigrant groups reported in Belmont came from Asia (293 | 2.0%), Canada (128 | 0.9%), Europe (128 | 0.9%), Eastern Asia (112 | 0.7%), and Africa (108 | 0.7%), together accounting for 5.2% of all Belmont residents.
| Immigration Origin | # Population | % Population |
| Africa | 108 | 0.7% |
| Asia | 293 | 2.0% |
| Bolivia | 23 | 0.2% |
| Canada | 128 | 0.9% |
| Central America | 19 | 0.1% |
| China | 91 | 0.6% |
| Congo | 8 | 0.1% |
| Eastern Africa | 44 | 0.3% |
| Eastern Asia | 112 | 0.7% |
| Eastern Europe | 10 | 0.1% |
| El Salvador | 9 | 0.1% |
| England | 21 | 0.1% |
| Ethiopia | 13 | 0.1% |
| Europe | 128 | 0.9% |
| Germany | 10 | 0.1% |
| India | 92 | 0.6% |
| Ireland | 4 | 0.0% |
| Italy | 2 | 0.0% |
| Korea | 21 | 0.1% |
| Latin America | 77 | 0.5% |
| Mexico | 10 | 0.1% |
| Middle Africa | 31 | 0.2% |
| Northern Europe | 106 | 0.7% |
| Oceania | 3 | 0.0% |
| Pakistan | 9 | 0.1% |
| Philippines | 39 | 0.3% |
| Poland | 10 | 0.1% |
| Singapore | 2 | 0.0% |
| South Africa | 23 | 0.2% |
| South America | 58 | 0.4% |
| South Central Asia | 101 | 0.7% |
| South Eastern Asia | 80 | 0.5% |
| Southern Europe | 2 | 0.0% |
| Thailand | 17 | 0.1% |
| Venezuela | 35 | 0.2% |
| Vietnam | 19 | 0.1% |
| Western Africa | 10 | 0.1% |
| Western Europe | 10 | 0.1% |
| Zaire | 23 | 0.2% |
| Zimbabwe | 20 | 0.1% | View All 40 Rows |
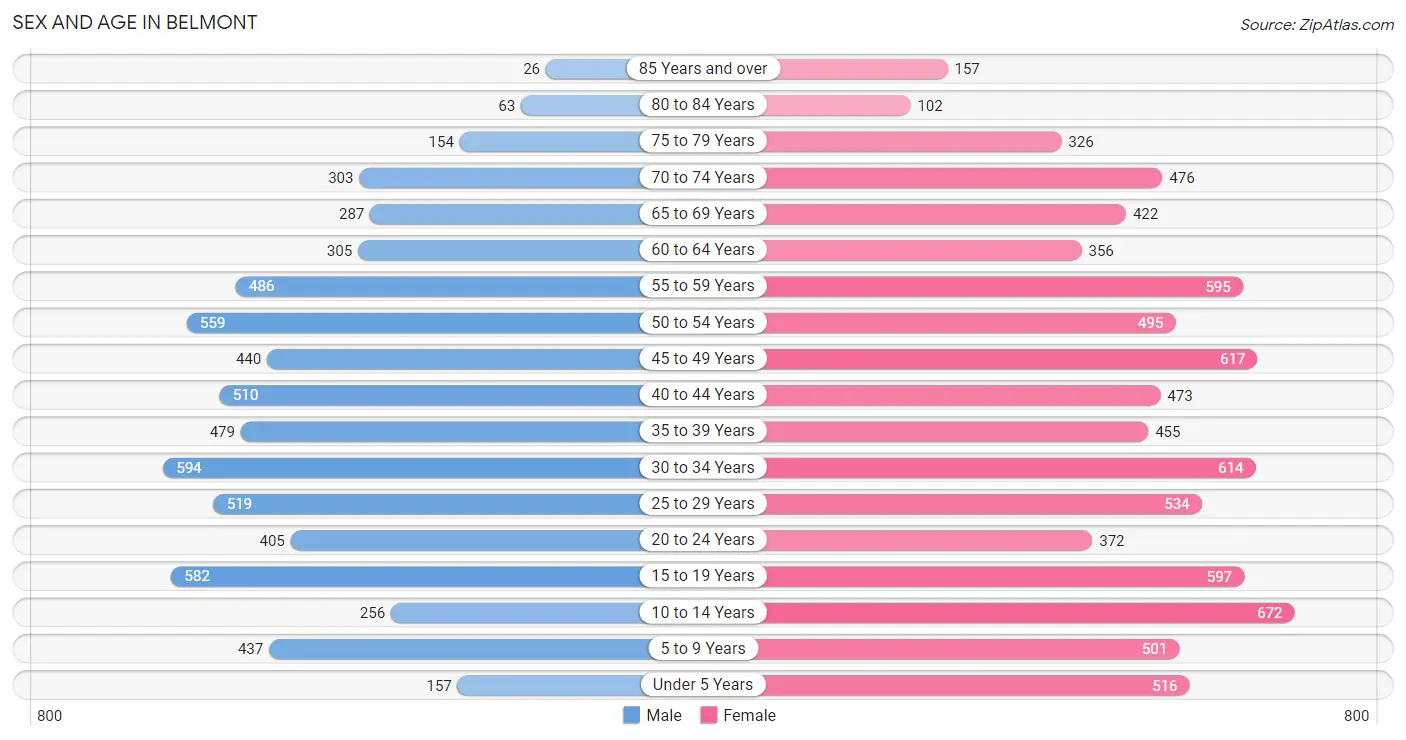
Sex and Age in Belmont
Sex and Age in Belmont
The most populous age groups in Belmont are 30 to 34 Years (594 | 9.0%) for men and 10 to 14 Years (672 | 8.1%) for women.
| Age Bracket | Male | Female |
| Under 5 Years | 157 (2.4%) | 516 (6.2%) |
| 5 to 9 Years | 437 (6.7%) | 501 (6.0%) |
| 10 to 14 Years | 256 (3.9%) | 672 (8.1%) |
| 15 to 19 Years | 582 (8.9%) | 597 (7.2%) |
| 20 to 24 Years | 405 (6.2%) | 372 (4.5%) |
| 25 to 29 Years | 519 (7.9%) | 534 (6.5%) |
| 30 to 34 Years | 594 (9.0%) | 614 (7.4%) |
| 35 to 39 Years | 479 (7.3%) | 455 (5.5%) |
| 40 to 44 Years | 510 (7.8%) | 473 (5.7%) |
| 45 to 49 Years | 440 (6.7%) | 617 (7.4%) |
| 50 to 54 Years | 559 (8.5%) | 495 (6.0%) |
| 55 to 59 Years | 486 (7.4%) | 595 (7.2%) |
| 60 to 64 Years | 305 (4.6%) | 356 (4.3%) |
| 65 to 69 Years | 287 (4.4%) | 422 (5.1%) |
| 70 to 74 Years | 303 (4.6%) | 476 (5.8%) |
| 75 to 79 Years | 154 (2.4%) | 326 (3.9%) |
| 80 to 84 Years | 63 (1.0%) | 102 (1.2%) |
| 85 Years and over | 26 (0.4%) | 157 (1.9%) |
| Total | 6,562 (100.0%) | 8,280 (100.0%) |
Families and Households in Belmont
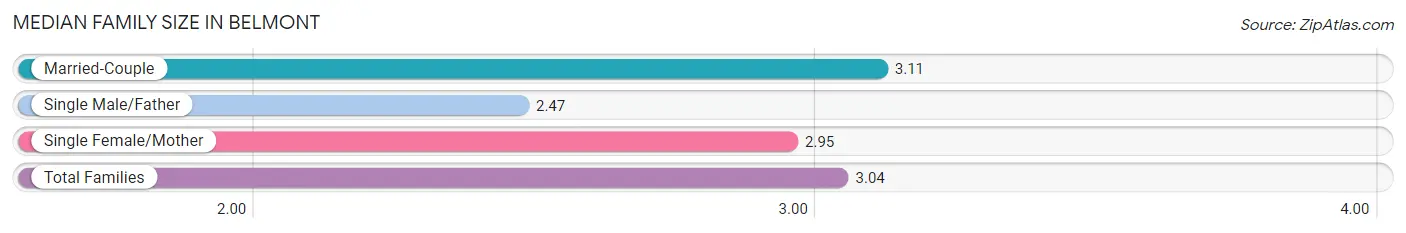
Median Family Size in Belmont
The median family size in Belmont is 3.04 persons per family, with married-couple families (2,617 | 74.1%) accounting for the largest median family size of 3.11 persons per family. On the other hand, single male/father families (252 | 7.1%) represent the smallest median family size with 2.47 persons per family.
| Family Type | # Families | Family Size |
| Married-Couple | 2,617 (74.1%) | 3.11 |
| Single Male/Father | 252 (7.1%) | 2.47 |
| Single Female/Mother | 663 (18.8%) | 2.95 |
| Total Families | 3,532 (100.0%) | 3.04 |
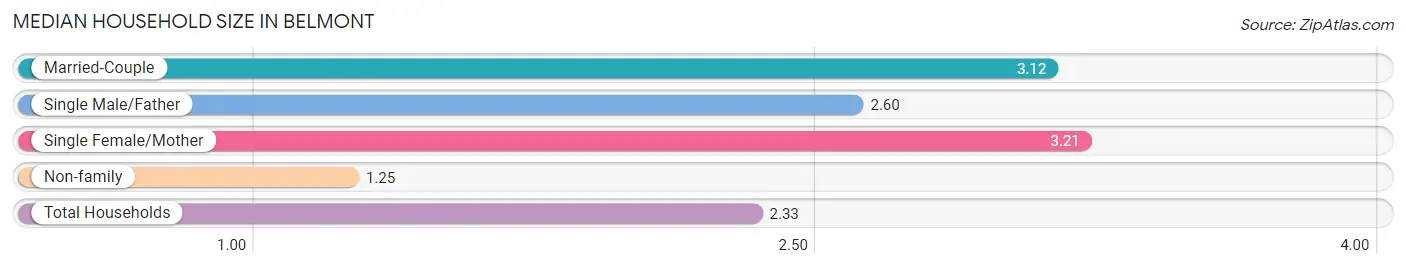
Median Household Size in Belmont
The median household size in Belmont is 2.33 persons per household, with single female/mother households (663 | 11.0%) accounting for the largest median household size of 3.21 persons per household. non-family households (2,517 | 41.6%) represent the smallest median household size with 1.25 persons per household.
| Household Type | # Households | Household Size |
| Married-Couple | 2,617 (43.3%) | 3.12 |
| Single Male/Father | 252 (4.2%) | 2.60 |
| Single Female/Mother | 663 (11.0%) | 3.21 |
| Non-family | 2,517 (41.6%) | 1.25 |
| Total Households | 6,049 (100.0%) | 2.33 |
Household Size by Marriage Status in Belmont
Out of a total of 6,049 households in Belmont, 3,532 (58.4%) are family households, while 2,517 (41.6%) are nonfamily households. The most numerous type of family households are 2-person households, comprising 1,502, and the most common type of nonfamily households are 1-person households, comprising 1,942.
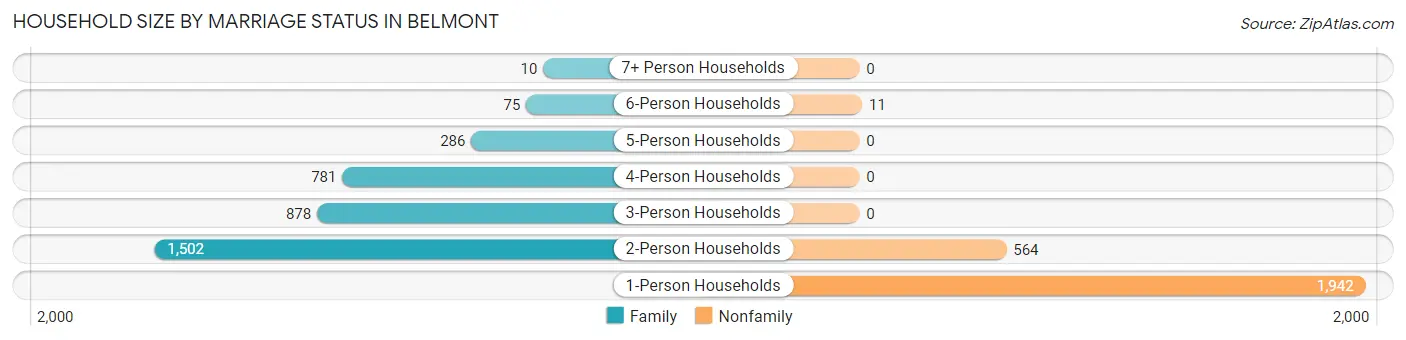
| Household Size | Family Households | Nonfamily Households |
| 1-Person Households | - | 1,942 (32.1%) |
| 2-Person Households | 1,502 (24.8%) | 564 (9.3%) |
| 3-Person Households | 878 (14.5%) | 0 (0.0%) |
| 4-Person Households | 781 (12.9%) | 0 (0.0%) |
| 5-Person Households | 286 (4.7%) | 0 (0.0%) |
| 6-Person Households | 75 (1.2%) | 11 (0.2%) |
| 7+ Person Households | 10 (0.2%) | 0 (0.0%) |
| Total | 3,532 (58.4%) | 2,517 (41.6%) |
Female Fertility in Belmont
Fertility by Age in Belmont
Average fertility rate in Belmont is 51.0 births per 1,000 women. Women in the age bracket of 20 to 34 years have the highest fertility rate with 113.0 births per 1,000 women. Women in the age bracket of 20 to 34 years acount for 91.0% of all women with births.
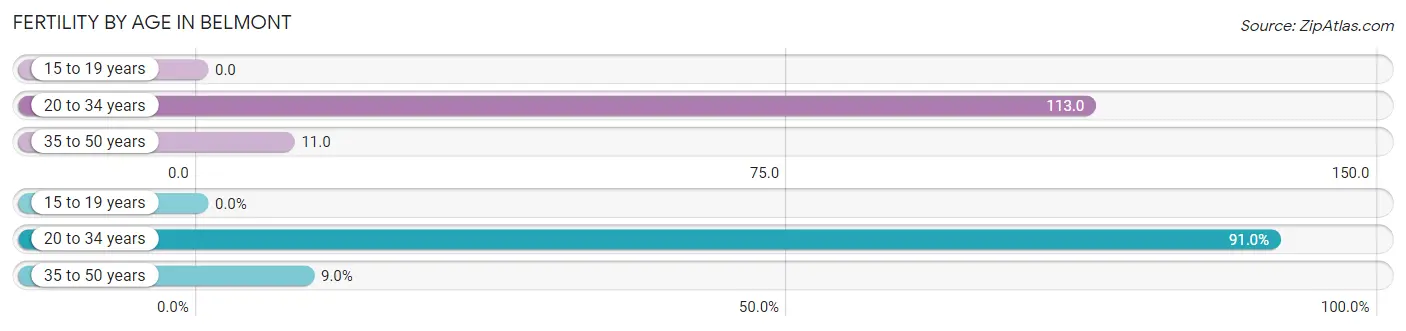
| Age Bracket | Women with Births | Births / 1,000 Women |
| 15 to 19 years | 0 (0.0%) | 0.0 |
| 20 to 34 years | 172 (91.0%) | 113.0 |
| 35 to 50 years | 17 (9.0%) | 11.0 |
| Total | 189 (100.0%) | 51.0 |
Fertility by Age by Marriage Status in Belmont
87.3% of women with births (189) in Belmont are married. The highest percentage of unmarried women with births falls into 20 to 34 years age bracket with 14.0% of them unmarried at the time of birth, while the lowest percentage of unmarried women with births belong to 35 to 50 years age bracket with 0.0% of them unmarried.
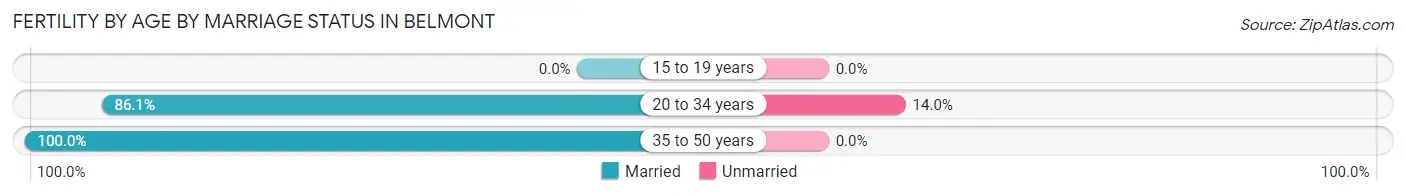
| Age Bracket | Married | Unmarried |
| 15 to 19 years | 0 (0.0%) | 0 (0.0%) |
| 20 to 34 years | 148 (86.1%) | 24 (14.0%) |
| 35 to 50 years | 17 (100.0%) | 0 (0.0%) |
| Total | 165 (87.3%) | 24 (12.7%) |
Fertility by Education in Belmont
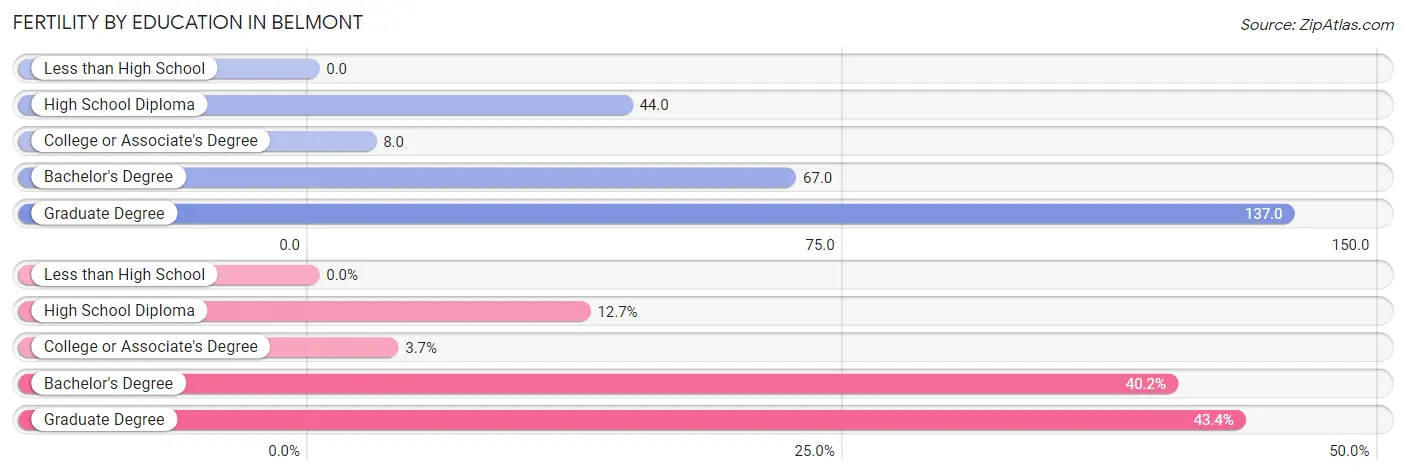
| Educational Attainment | Women with Births | Births / 1,000 Women |
| Less than High School | 0 (0.0%) | 0.0 |
| High School Diploma | 24 (12.7%) | 44.0 |
| College or Associate's Degree | 7 (3.7%) | 8.0 |
| Bachelor's Degree | 76 (40.2%) | 67.0 |
| Graduate Degree | 82 (43.4%) | 137.0 |
| Total | 189 (100.0%) | 51.0 |
Fertility by Education by Marriage Status in Belmont
12.7% of women with births in Belmont are unmarried. Women with the educational attainment of college or associate's degree are most likely to be married with 100.0% of them married at childbirth, while women with the educational attainment of high school diploma are least likely to be married with 100.0% of them unmarried at childbirth.
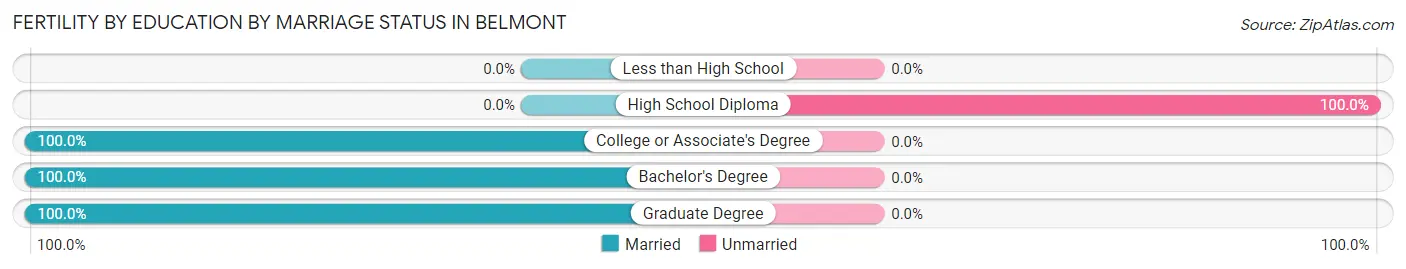
| Educational Attainment | Married | Unmarried |
| Less than High School | 0 (0.0%) | 0 (0.0%) |
| High School Diploma | 0 (0.0%) | 24 (100.0%) |
| College or Associate's Degree | 7 (100.0%) | 0 (0.0%) |
| Bachelor's Degree | 76 (100.0%) | 0 (0.0%) |
| Graduate Degree | 82 (100.0%) | 0 (0.0%) |
| Total | 165 (87.3%) | 24 (12.7%) |
Employment Characteristics in Belmont
Employment by Class of Employer in Belmont
Among the 7,510 employed individuals in Belmont, private company employees (5,530 | 73.6%), not-for-profit organizations (749 | 10.0%), and self-employed (not incorporated) (451 | 6.0%) make up the most common classes of employment.
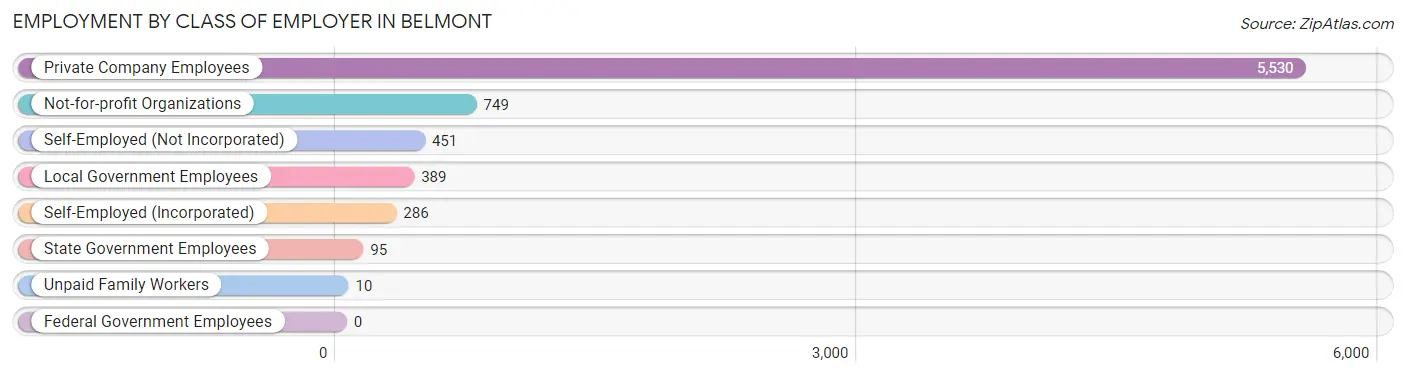
| Employer Class | # Employees | % Employees |
| Private Company Employees | 5,530 | 73.6% |
| Self-Employed (Incorporated) | 286 | 3.8% |
| Self-Employed (Not Incorporated) | 451 | 6.0% |
| Not-for-profit Organizations | 749 | 10.0% |
| Local Government Employees | 389 | 5.2% |
| State Government Employees | 95 | 1.3% |
| Federal Government Employees | 0 | 0.0% |
| Unpaid Family Workers | 10 | 0.1% |
| Total | 7,510 | 100.0% |
Employment Status by Age in Belmont
According to the labor force statistics for Belmont, out of the total population over 16 years of age (12,122), 65.7% or 7,964 individuals are in the labor force, with 4.4% or 350 of them unemployed. The age group with the highest labor force participation rate is 25 to 29 years, with 98.3% or 1,035 individuals in the labor force. Within the labor force, the 16 to 19 years age range has the highest percentage of unemployed individuals, with 18.3% or 61 of them being unemployed.
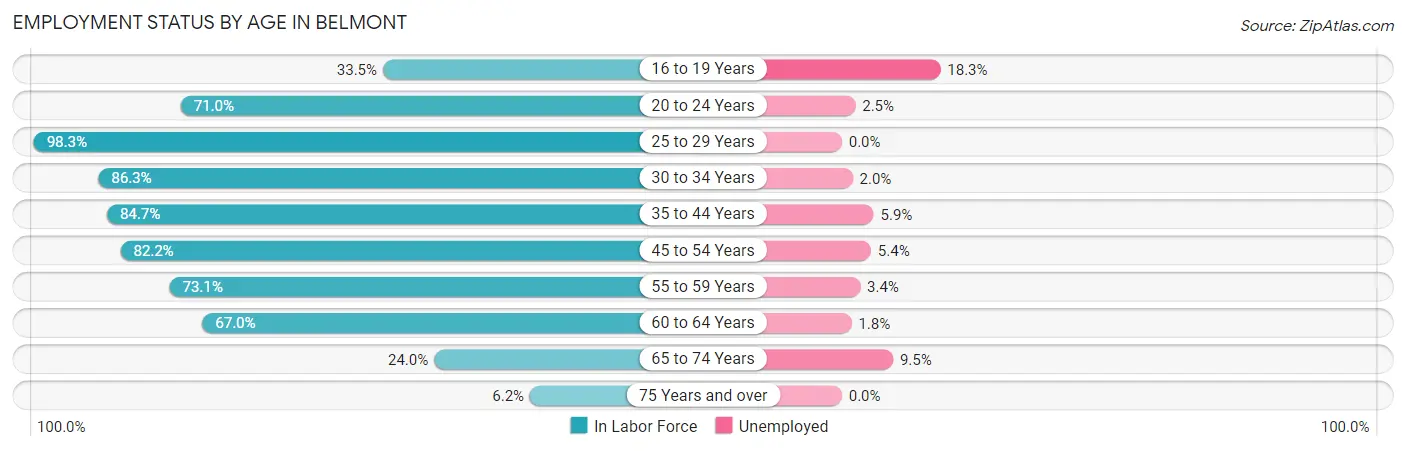
| Age Bracket | In Labor Force | Unemployed |
| 16 to 19 Years | 334 (33.5%) | 61 (18.3%) |
| 20 to 24 Years | 552 (71.0%) | 14 (2.5%) |
| 25 to 29 Years | 1,035 (98.3%) | 0 (0.0%) |
| 30 to 34 Years | 1,043 (86.3%) | 21 (2.0%) |
| 35 to 44 Years | 1,624 (84.7%) | 96 (5.9%) |
| 45 to 54 Years | 1,735 (82.2%) | 94 (5.4%) |
| 55 to 59 Years | 790 (73.1%) | 27 (3.4%) |
| 60 to 64 Years | 443 (67.0%) | 8 (1.8%) |
| 65 to 74 Years | 357 (24.0%) | 34 (9.5%) |
| 75 Years and over | 51 (6.2%) | 0 (0.0%) |
| Total | 7,964 (65.7%) | 350 (4.4%) |
Employment Status by Educational Attainment in Belmont
According to labor force statistics for Belmont, 83.0% of individuals (6,666) out of the total population between 25 and 64 years of age (8,031) are in the labor force, with 3.7% or 247 of them being unemployed. The group with the highest labor force participation rate are those with the educational attainment of college / associate degree, with 87.1% or 1,774 individuals in the labor force. Within the labor force, individuals with less than high school education have the highest percentage of unemployment, with 30.4% or 89 of them being unemployed.
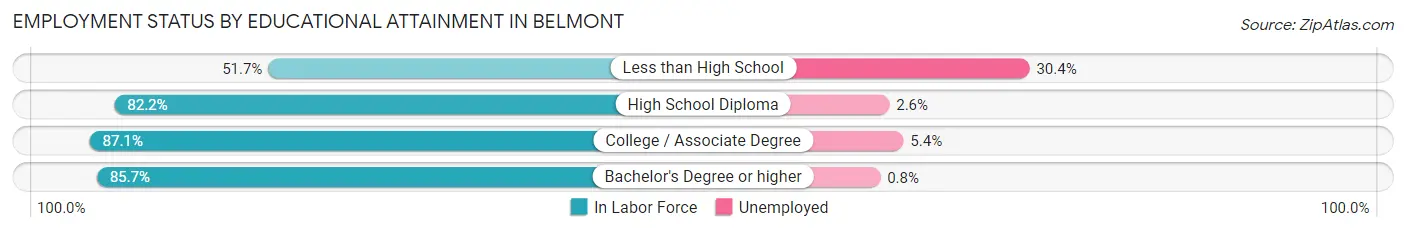
| Educational Attainment | In Labor Force | Unemployed |
| Less than High School | 293 (51.7%) | 172 (30.4%) |
| High School Diploma | 1,136 (82.2%) | 36 (2.6%) |
| College / Associate Degree | 1,774 (87.1%) | 110 (5.4%) |
| Bachelor's Degree or higher | 3,467 (85.7%) | 32 (0.8%) |
| Total | 6,666 (83.0%) | 297 (3.7%) |
Employment Occupations by Sex in Belmont
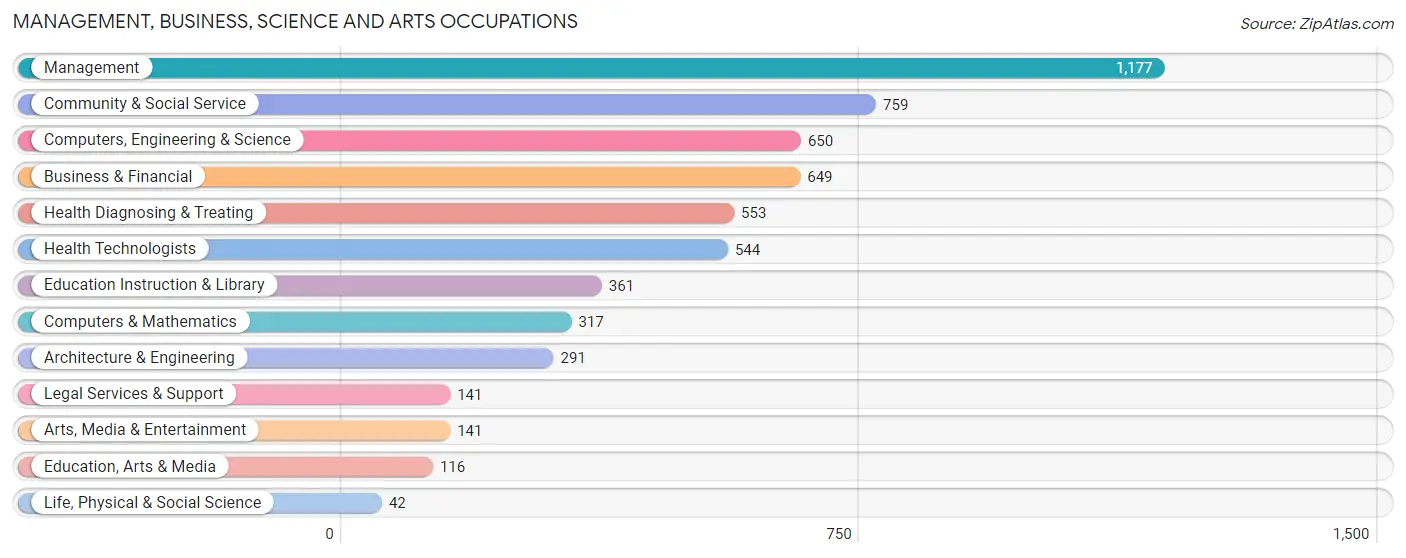
Management, Business, Science and Arts Occupations
The most common Management, Business, Science and Arts occupations in Belmont are Management (1,177 | 15.5%), Community & Social Service (759 | 10.0%), Computers, Engineering & Science (650 | 8.5%), Business & Financial (649 | 8.5%), and Health Diagnosing & Treating (553 | 7.3%).
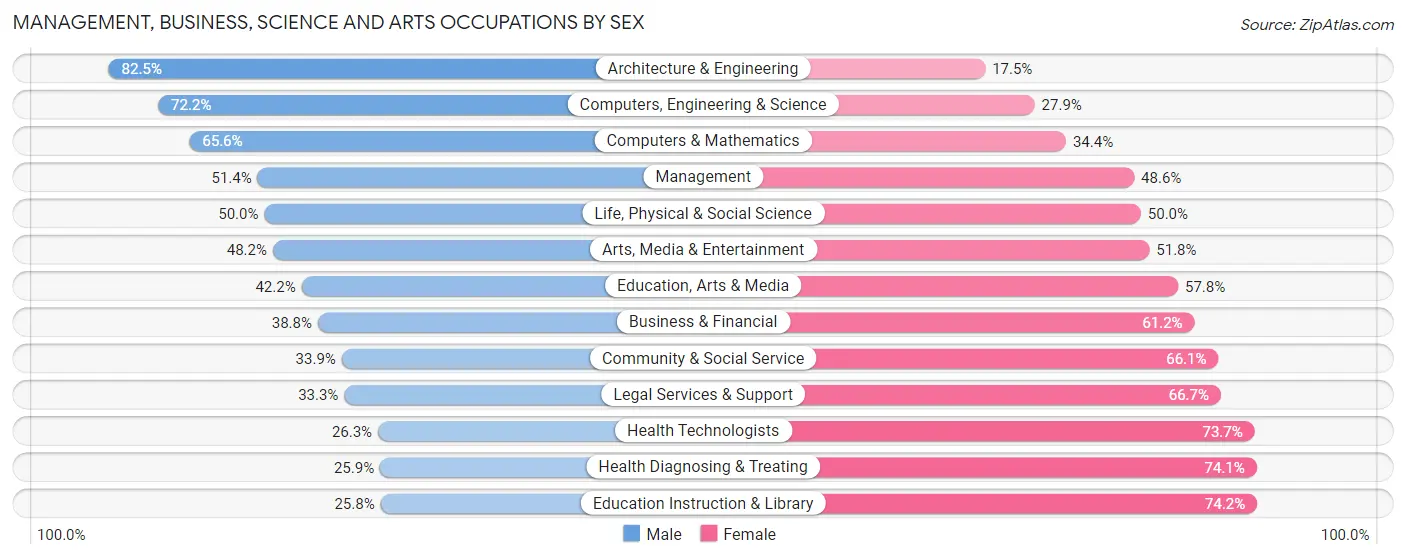
Management, Business, Science and Arts Occupations by Sex
Within the Management, Business, Science and Arts occupations in Belmont, the most male-oriented occupations are Architecture & Engineering (82.5%), Computers, Engineering & Science (72.2%), and Computers & Mathematics (65.6%), while the most female-oriented occupations are Education Instruction & Library (74.2%), Health Diagnosing & Treating (74.1%), and Health Technologists (73.7%).
| Occupation | Male | Female |
| Management | 605 (51.4%) | 572 (48.6%) |
| Business & Financial | 252 (38.8%) | 397 (61.2%) |
| Computers, Engineering & Science | 469 (72.2%) | 181 (27.9%) |
| Computers & Mathematics | 208 (65.6%) | 109 (34.4%) |
| Architecture & Engineering | 240 (82.5%) | 51 (17.5%) |
| Life, Physical & Social Science | 21 (50.0%) | 21 (50.0%) |
| Community & Social Service | 257 (33.9%) | 502 (66.1%) |
| Education, Arts & Media | 49 (42.2%) | 67 (57.8%) |
| Legal Services & Support | 47 (33.3%) | 94 (66.7%) |
| Education Instruction & Library | 93 (25.8%) | 268 (74.2%) |
| Arts, Media & Entertainment | 68 (48.2%) | 73 (51.8%) |
| Health Diagnosing & Treating | 143 (25.9%) | 410 (74.1%) |
| Health Technologists | 143 (26.3%) | 401 (73.7%) |
| Total (Category) | 1,726 (45.6%) | 2,062 (54.4%) |
| Total (Overall) | 3,904 (51.3%) | 3,706 (48.7%) |
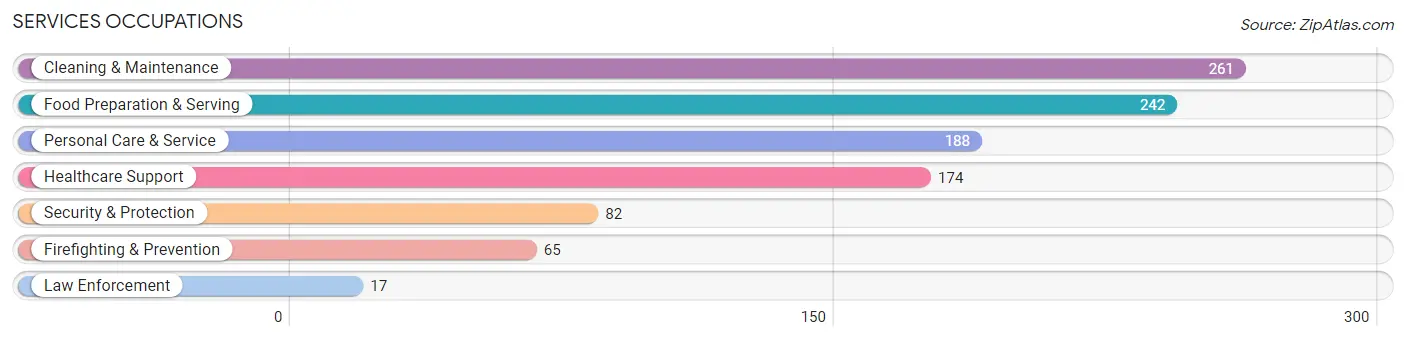
Services Occupations
The most common Services occupations in Belmont are Cleaning & Maintenance (261 | 3.4%), Food Preparation & Serving (242 | 3.2%), Personal Care & Service (188 | 2.5%), Healthcare Support (174 | 2.3%), and Security & Protection (82 | 1.1%).
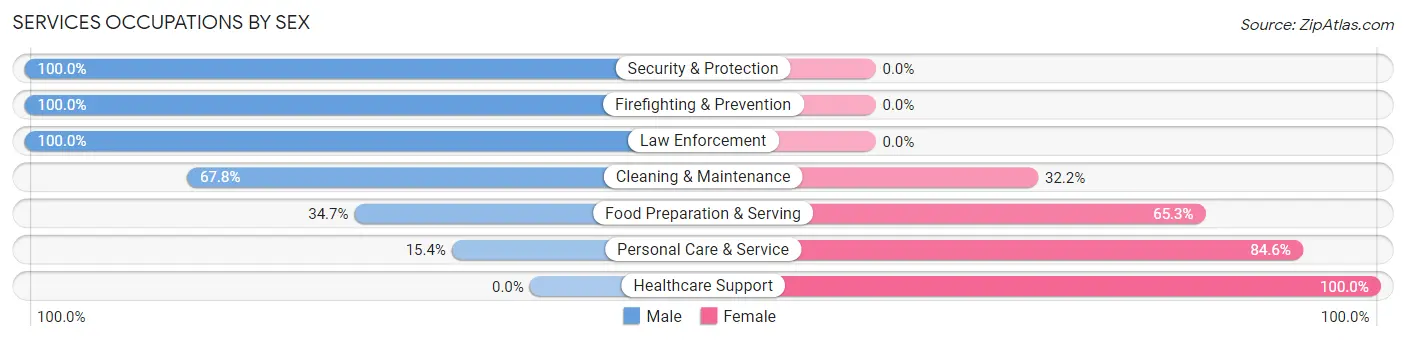
Services Occupations by Sex
Within the Services occupations in Belmont, the most male-oriented occupations are Security & Protection (100.0%), Firefighting & Prevention (100.0%), and Law Enforcement (100.0%), while the most female-oriented occupations are Healthcare Support (100.0%), Personal Care & Service (84.6%), and Food Preparation & Serving (65.3%).
| Occupation | Male | Female |
| Healthcare Support | 0 (0.0%) | 174 (100.0%) |
| Security & Protection | 82 (100.0%) | 0 (0.0%) |
| Firefighting & Prevention | 65 (100.0%) | 0 (0.0%) |
| Law Enforcement | 17 (100.0%) | 0 (0.0%) |
| Food Preparation & Serving | 84 (34.7%) | 158 (65.3%) |
| Cleaning & Maintenance | 177 (67.8%) | 84 (32.2%) |
| Personal Care & Service | 29 (15.4%) | 159 (84.6%) |
| Total (Category) | 372 (39.3%) | 575 (60.7%) |
| Total (Overall) | 3,904 (51.3%) | 3,706 (48.7%) |
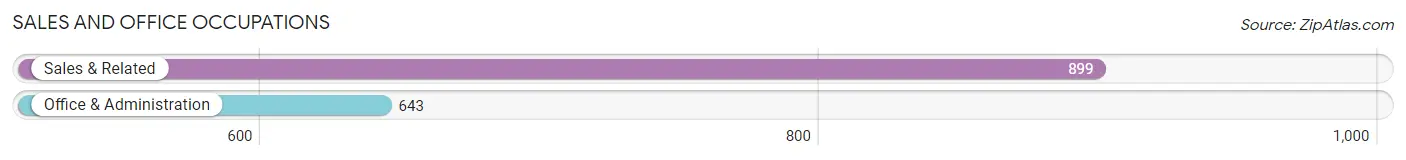
Sales and Office Occupations
The most common Sales and Office occupations in Belmont are Sales & Related (899 | 11.8%), and Office & Administration (643 | 8.5%).
Sales and Office Occupations by Sex
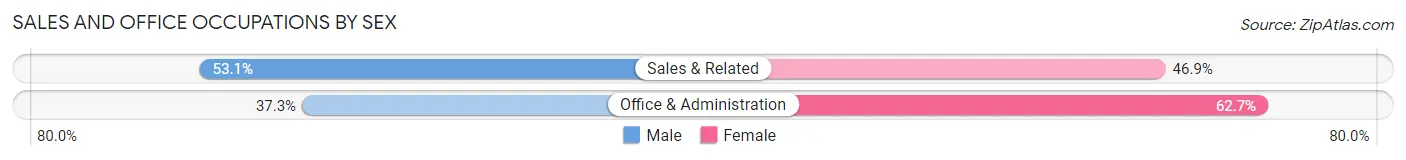
| Occupation | Male | Female |
| Sales & Related | 477 (53.1%) | 422 (46.9%) |
| Office & Administration | 240 (37.3%) | 403 (62.7%) |
| Total (Category) | 717 (46.5%) | 825 (53.5%) |
| Total (Overall) | 3,904 (51.3%) | 3,706 (48.7%) |
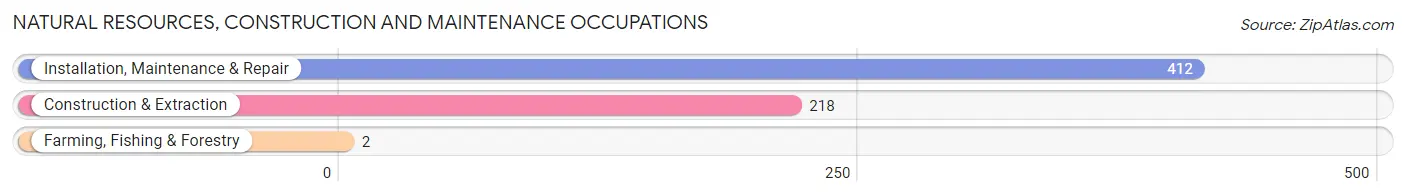
Natural Resources, Construction and Maintenance Occupations
The most common Natural Resources, Construction and Maintenance occupations in Belmont are Installation, Maintenance & Repair (412 | 5.4%), Construction & Extraction (218 | 2.9%), and Farming, Fishing & Forestry (2 | 0.0%).
Natural Resources, Construction and Maintenance Occupations by Sex
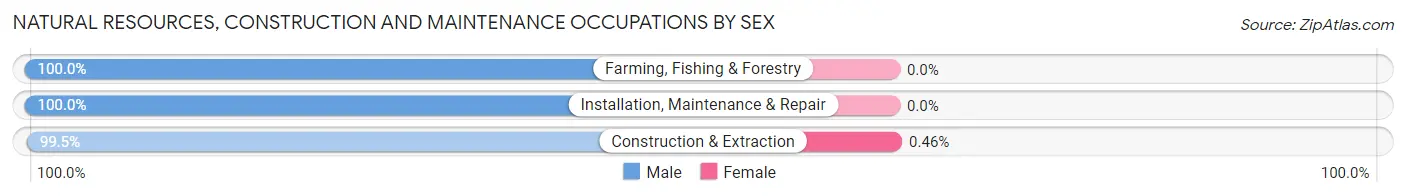
| Occupation | Male | Female |
| Farming, Fishing & Forestry | 2 (100.0%) | 0 (0.0%) |
| Construction & Extraction | 217 (99.5%) | 1 (0.5%) |
| Installation, Maintenance & Repair | 412 (100.0%) | 0 (0.0%) |
| Total (Category) | 631 (99.8%) | 1 (0.2%) |
| Total (Overall) | 3,904 (51.3%) | 3,706 (48.7%) |
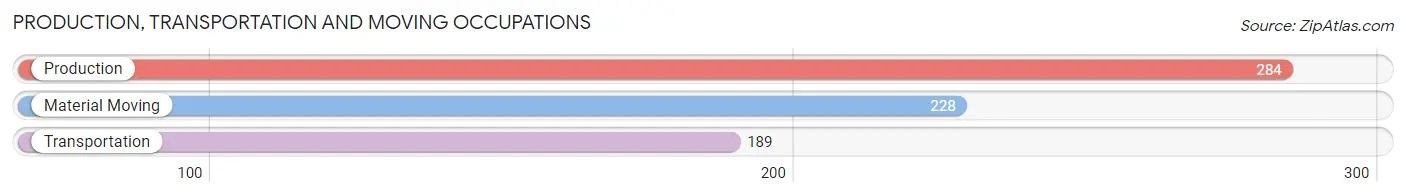
Production, Transportation and Moving Occupations
The most common Production, Transportation and Moving occupations in Belmont are Production (284 | 3.7%), Material Moving (228 | 3.0%), and Transportation (189 | 2.5%).
Production, Transportation and Moving Occupations by Sex
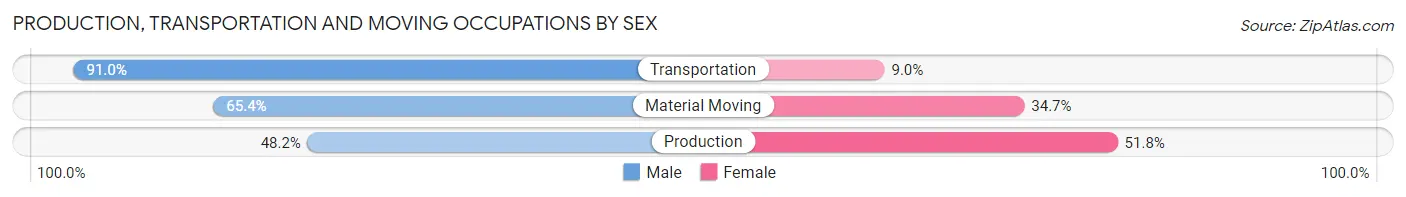
| Occupation | Male | Female |
| Production | 137 (48.2%) | 147 (51.8%) |
| Transportation | 172 (91.0%) | 17 (9.0%) |
| Material Moving | 149 (65.3%) | 79 (34.6%) |
| Total (Category) | 458 (65.3%) | 243 (34.7%) |
| Total (Overall) | 3,904 (51.3%) | 3,706 (48.7%) |
Employment Industries by Sex in Belmont
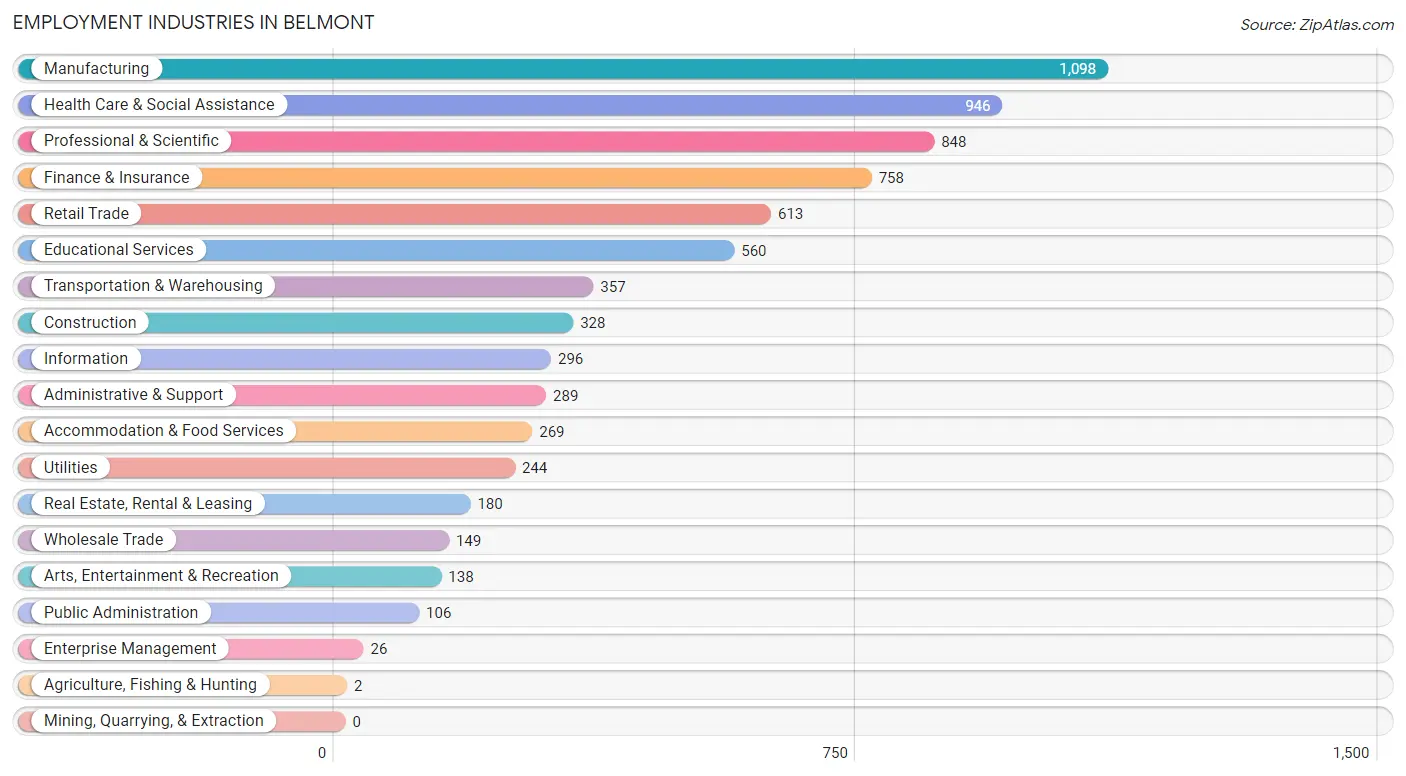
Employment Industries in Belmont
The major employment industries in Belmont include Manufacturing (1,098 | 14.4%), Health Care & Social Assistance (946 | 12.4%), Professional & Scientific (848 | 11.1%), Finance & Insurance (758 | 10.0%), and Retail Trade (613 | 8.1%).
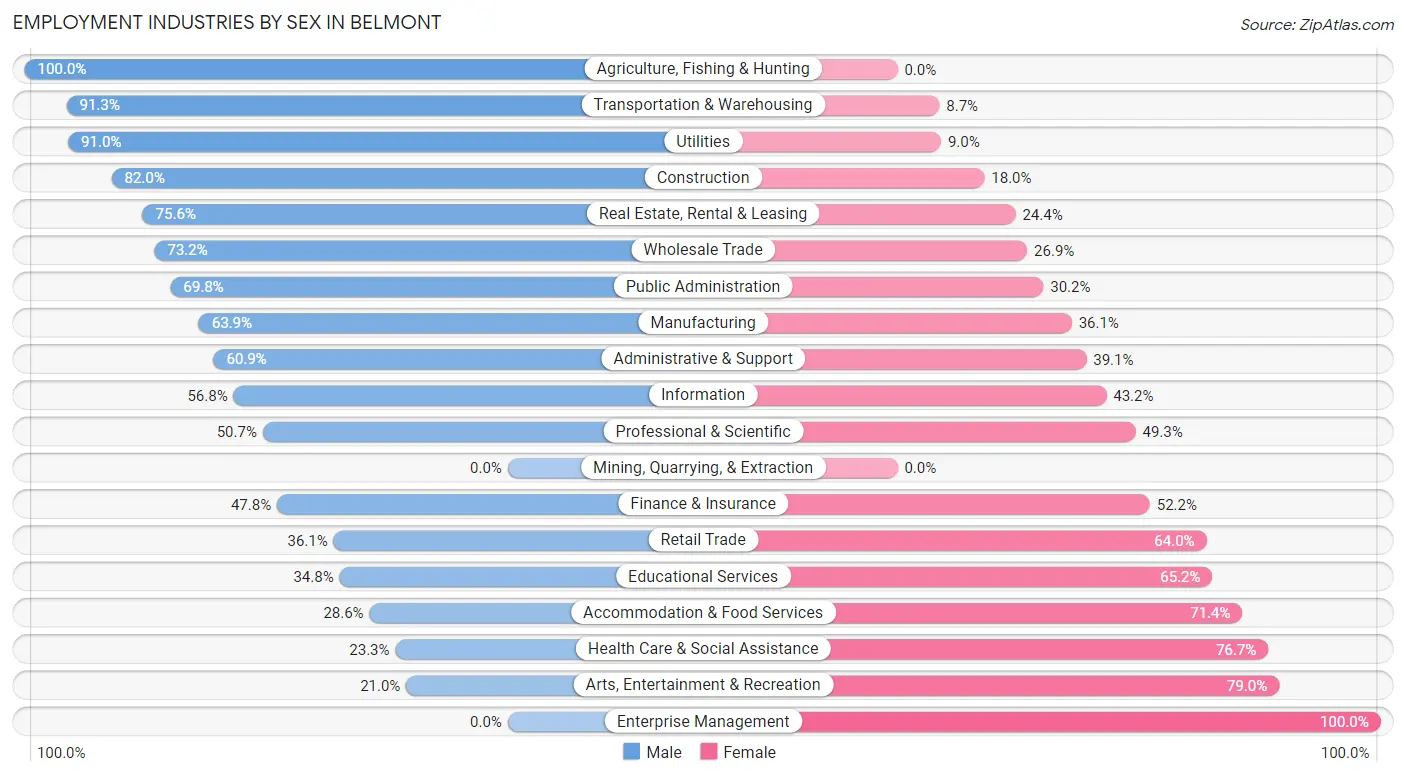
Employment Industries by Sex in Belmont
The Belmont industries that see more men than women are Agriculture, Fishing & Hunting (100.0%), Transportation & Warehousing (91.3%), and Utilities (91.0%), whereas the industries that tend to have a higher number of women are Enterprise Management (100.0%), Arts, Entertainment & Recreation (79.0%), and Health Care & Social Assistance (76.7%).
| Industry | Male | Female |
| Agriculture, Fishing & Hunting | 2 (100.0%) | 0 (0.0%) |
| Mining, Quarrying, & Extraction | 0 (0.0%) | 0 (0.0%) |
| Construction | 269 (82.0%) | 59 (18.0%) |
| Manufacturing | 702 (63.9%) | 396 (36.1%) |
| Wholesale Trade | 109 (73.2%) | 40 (26.9%) |
| Retail Trade | 221 (36.0%) | 392 (63.9%) |
| Transportation & Warehousing | 326 (91.3%) | 31 (8.7%) |
| Utilities | 222 (91.0%) | 22 (9.0%) |
| Information | 168 (56.8%) | 128 (43.2%) |
| Finance & Insurance | 362 (47.8%) | 396 (52.2%) |
| Real Estate, Rental & Leasing | 136 (75.6%) | 44 (24.4%) |
| Professional & Scientific | 430 (50.7%) | 418 (49.3%) |
| Enterprise Management | 0 (0.0%) | 26 (100.0%) |
| Administrative & Support | 176 (60.9%) | 113 (39.1%) |
| Educational Services | 195 (34.8%) | 365 (65.2%) |
| Health Care & Social Assistance | 220 (23.3%) | 726 (76.7%) |
| Arts, Entertainment & Recreation | 29 (21.0%) | 109 (79.0%) |
| Accommodation & Food Services | 77 (28.6%) | 192 (71.4%) |
| Public Administration | 74 (69.8%) | 32 (30.2%) |
| Total | 3,904 (51.3%) | 3,706 (48.7%) |
Education in Belmont
School Enrollment in Belmont
The most common levels of schooling among the 3,587 students in Belmont are college / undergraduate (1,032 | 28.8%), elementary school (800 | 22.3%), and middle school (739 | 20.6%).
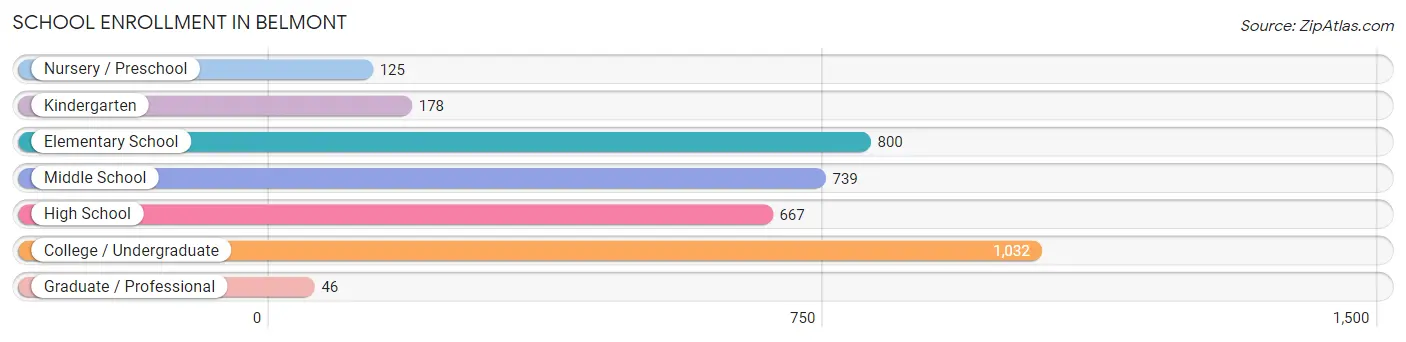
| School Level | # Students | % Students |
| Nursery / Preschool | 125 | 3.5% |
| Kindergarten | 178 | 5.0% |
| Elementary School | 800 | 22.3% |
| Middle School | 739 | 20.6% |
| High School | 667 | 18.6% |
| College / Undergraduate | 1,032 | 28.8% |
| Graduate / Professional | 46 | 1.3% |
| Total | 3,587 | 100.0% |
School Enrollment by Age by Funding Source in Belmont
Out of a total of 3,587 students who are enrolled in schools in Belmont, 968 (27.0%) attend a private institution, while the remaining 2,619 (73.0%) are enrolled in public schools. The age group of 3 to 4 year olds has the highest likelihood of being enrolled in private schools, with 66 (62.3% in the age bracket) enrolled. Conversely, the age group of 25 to 34 year olds has the lowest likelihood of being enrolled in a private school, with 78 (100.0% in the age bracket) attending a public institution.
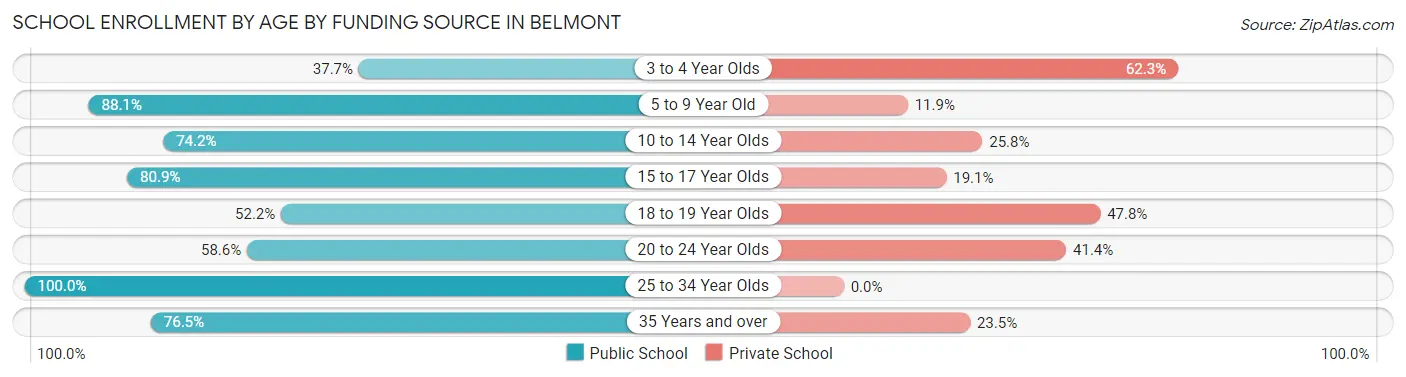
| Age Bracket | Public School | Private School |
| 3 to 4 Year Olds | 40 (37.7%) | 66 (62.3%) |
| 5 to 9 Year Old | 768 (88.1%) | 104 (11.9%) |
| 10 to 14 Year Olds | 678 (74.2%) | 236 (25.8%) |
| 15 to 17 Year Olds | 419 (80.9%) | 99 (19.1%) |
| 18 to 19 Year Olds | 330 (52.2%) | 302 (47.8%) |
| 20 to 24 Year Olds | 164 (58.6%) | 116 (41.4%) |
| 25 to 34 Year Olds | 78 (100.0%) | 0 (0.0%) |
| 35 Years and over | 143 (76.5%) | 44 (23.5%) |
| Total | 2,619 (73.0%) | 968 (27.0%) |
Educational Attainment by Field of Study in Belmont
Business (1,179 | 22.4%), engineering (571 | 10.8%), education (452 | 8.6%), social sciences (428 | 8.1%), and bio, nature & agricultural (403 | 7.7%) are the most common fields of study among 5,263 individuals in Belmont who have obtained a bachelor's degree or higher.
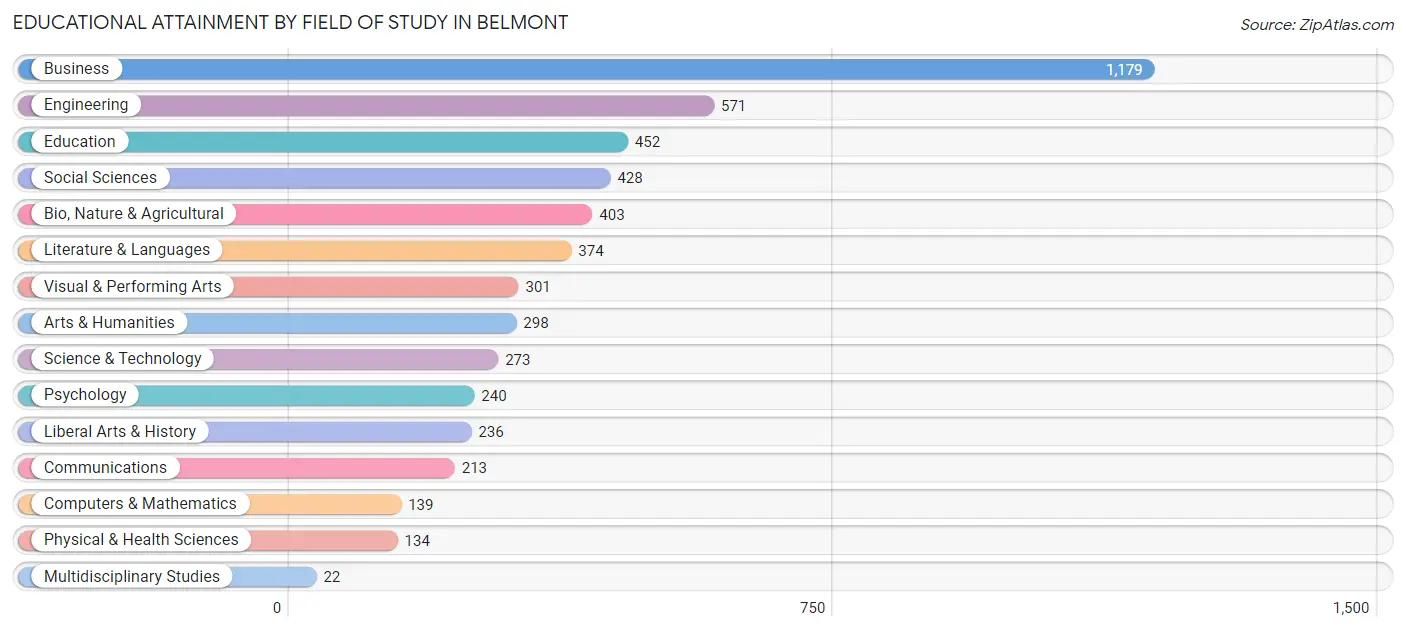
| Field of Study | # Graduates | % Graduates |
| Computers & Mathematics | 139 | 2.6% |
| Bio, Nature & Agricultural | 403 | 7.7% |
| Physical & Health Sciences | 134 | 2.5% |
| Psychology | 240 | 4.6% |
| Social Sciences | 428 | 8.1% |
| Engineering | 571 | 10.8% |
| Multidisciplinary Studies | 22 | 0.4% |
| Science & Technology | 273 | 5.2% |
| Business | 1,179 | 22.4% |
| Education | 452 | 8.6% |
| Literature & Languages | 374 | 7.1% |
| Liberal Arts & History | 236 | 4.5% |
| Visual & Performing Arts | 301 | 5.7% |
| Communications | 213 | 4.1% |
| Arts & Humanities | 298 | 5.7% |
| Total | 5,263 | 100.0% |
Transportation & Commute in Belmont
Vehicle Availability by Sex in Belmont
The most prevalent vehicle ownership categories in Belmont are males with 2 vehicles (2,118, accounting for 56.0%) and females with 2 vehicles (1,714, making up 58.6%).
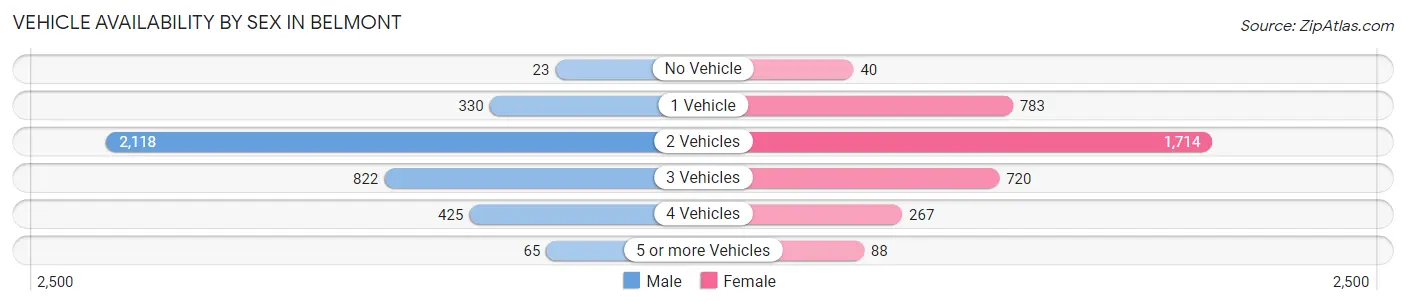
| Vehicles Available | Male | Female |
| No Vehicle | 23 (0.6%) | 40 (1.1%) |
| 1 Vehicle | 330 (8.7%) | 783 (21.7%) |
| 2 Vehicles | 2,118 (56.0%) | 1,714 (47.4%) |
| 3 Vehicles | 822 (21.7%) | 720 (19.9%) |
| 4 Vehicles | 425 (11.2%) | 267 (7.4%) |
| 5 or more Vehicles | 65 (1.7%) | 88 (2.4%) |
| Total | 3,783 (100.0%) | 3,612 (100.0%) |
Commute Time in Belmont
The most frequently occuring commute durations in Belmont are 30 to 34 minutes (977 commuters, 15.9%), 15 to 19 minutes (958 commuters, 15.6%), and 20 to 24 minutes (679 commuters, 11.0%).
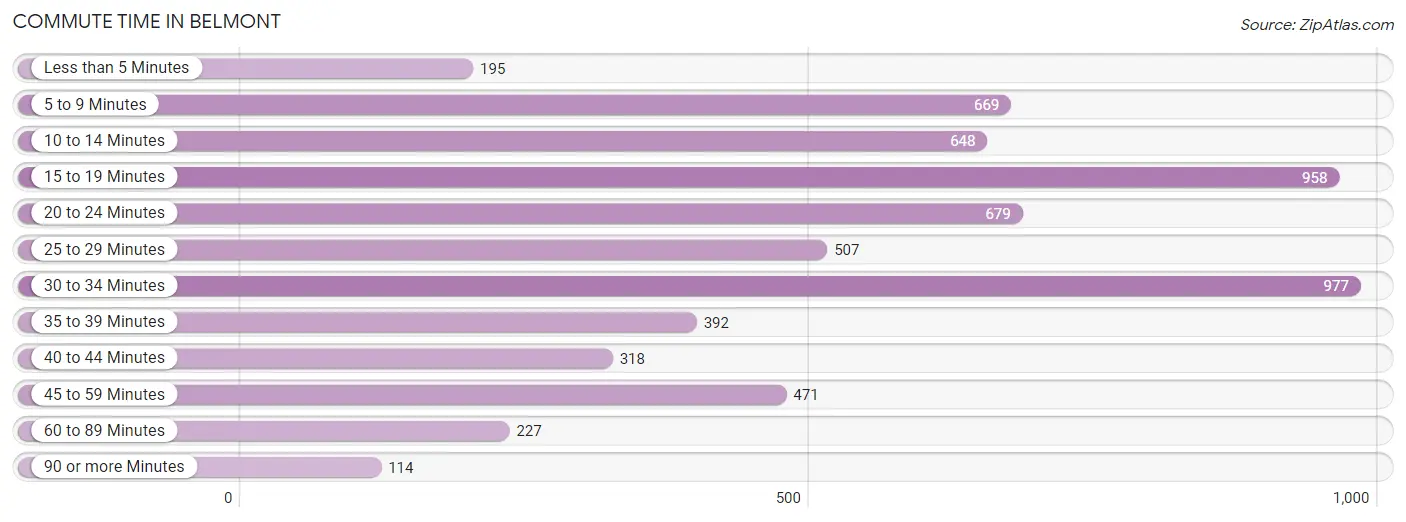
| Commute Time | # Commuters | % Commuters |
| Less than 5 Minutes | 195 | 3.2% |
| 5 to 9 Minutes | 669 | 10.9% |
| 10 to 14 Minutes | 648 | 10.5% |
| 15 to 19 Minutes | 958 | 15.6% |
| 20 to 24 Minutes | 679 | 11.0% |
| 25 to 29 Minutes | 507 | 8.2% |
| 30 to 34 Minutes | 977 | 15.9% |
| 35 to 39 Minutes | 392 | 6.4% |
| 40 to 44 Minutes | 318 | 5.2% |
| 45 to 59 Minutes | 471 | 7.6% |
| 60 to 89 Minutes | 227 | 3.7% |
| 90 or more Minutes | 114 | 1.8% |
Commute Time by Sex in Belmont
The most common commute times in Belmont are 30 to 34 minutes (536 commuters, 16.7%) for males and 15 to 19 minutes (447 commuters, 15.2%) for females.
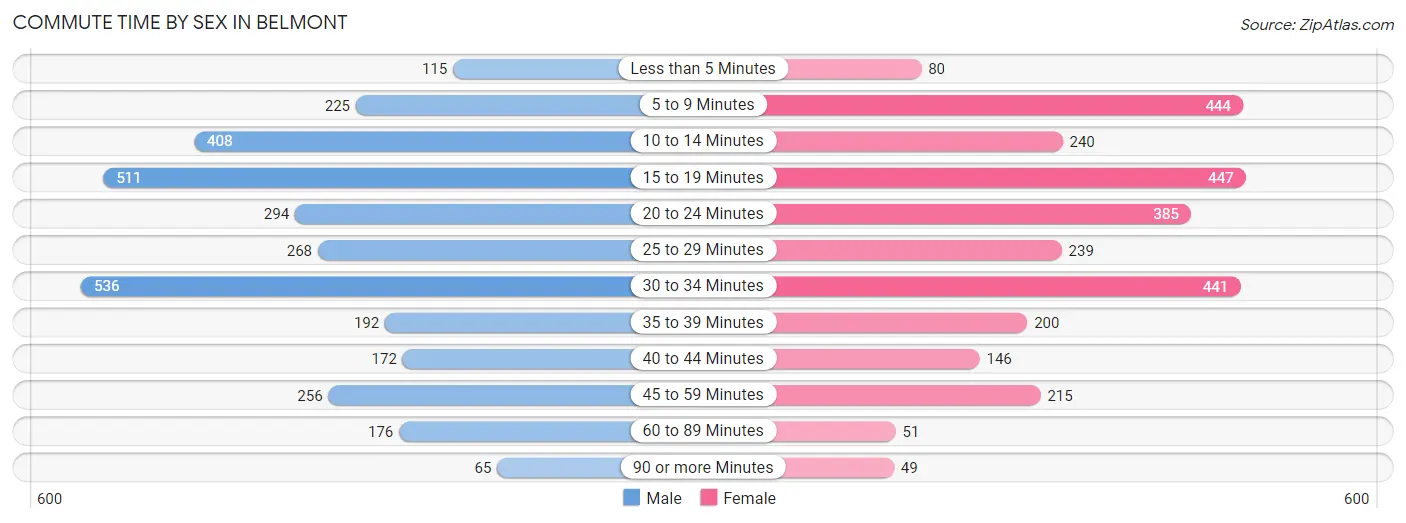
| Commute Time | Male | Female |
| Less than 5 Minutes | 115 (3.6%) | 80 (2.7%) |
| 5 to 9 Minutes | 225 (7.0%) | 444 (15.1%) |
| 10 to 14 Minutes | 408 (12.7%) | 240 (8.2%) |
| 15 to 19 Minutes | 511 (15.9%) | 447 (15.2%) |
| 20 to 24 Minutes | 294 (9.1%) | 385 (13.1%) |
| 25 to 29 Minutes | 268 (8.3%) | 239 (8.1%) |
| 30 to 34 Minutes | 536 (16.7%) | 441 (15.0%) |
| 35 to 39 Minutes | 192 (6.0%) | 200 (6.8%) |
| 40 to 44 Minutes | 172 (5.3%) | 146 (5.0%) |
| 45 to 59 Minutes | 256 (8.0%) | 215 (7.3%) |
| 60 to 89 Minutes | 176 (5.5%) | 51 (1.7%) |
| 90 or more Minutes | 65 (2.0%) | 49 (1.7%) |
Time of Departure to Work by Sex in Belmont
The most frequent times of departure to work in Belmont are 7:00 AM to 7:29 AM (584, 18.1%) for males and 7:00 AM to 7:29 AM (503, 17.1%) for females.
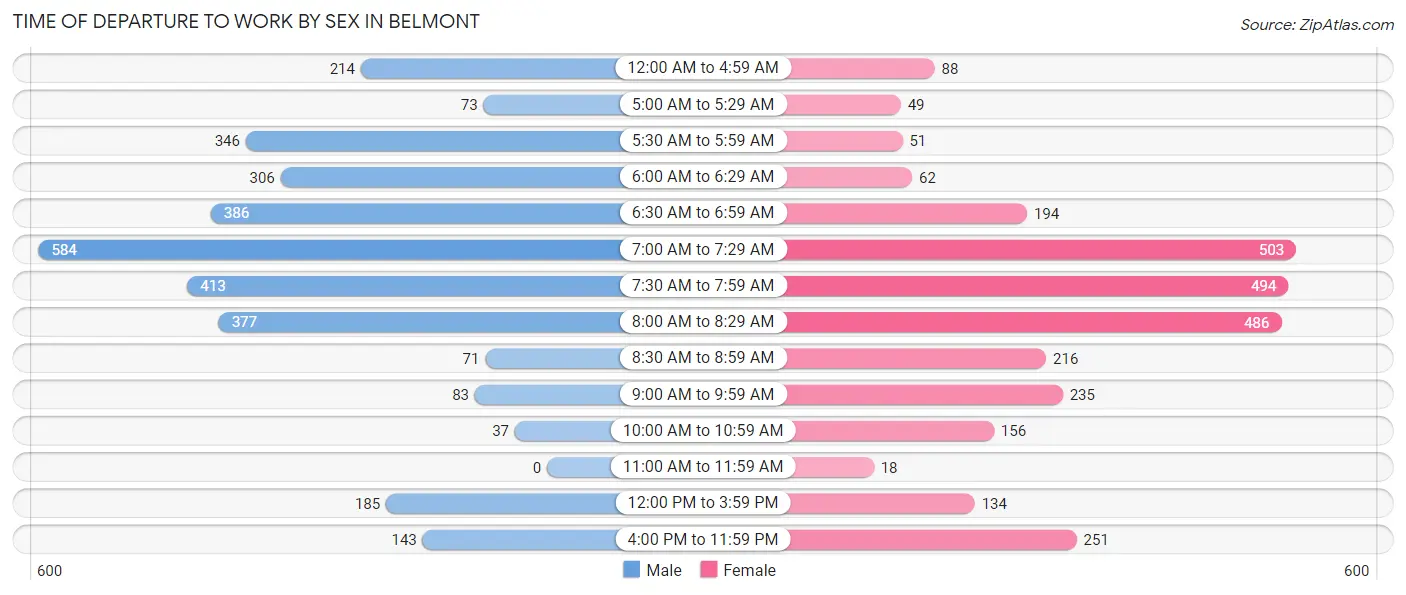
| Time of Departure | Male | Female |
| 12:00 AM to 4:59 AM | 214 (6.7%) | 88 (3.0%) |
| 5:00 AM to 5:29 AM | 73 (2.3%) | 49 (1.7%) |
| 5:30 AM to 5:59 AM | 346 (10.7%) | 51 (1.7%) |
| 6:00 AM to 6:29 AM | 306 (9.5%) | 62 (2.1%) |
| 6:30 AM to 6:59 AM | 386 (12.0%) | 194 (6.6%) |
| 7:00 AM to 7:29 AM | 584 (18.1%) | 503 (17.1%) |
| 7:30 AM to 7:59 AM | 413 (12.8%) | 494 (16.8%) |
| 8:00 AM to 8:29 AM | 377 (11.7%) | 486 (16.6%) |
| 8:30 AM to 8:59 AM | 71 (2.2%) | 216 (7.3%) |
| 9:00 AM to 9:59 AM | 83 (2.6%) | 235 (8.0%) |
| 10:00 AM to 10:59 AM | 37 (1.1%) | 156 (5.3%) |
| 11:00 AM to 11:59 AM | 0 (0.0%) | 18 (0.6%) |
| 12:00 PM to 3:59 PM | 185 (5.8%) | 134 (4.6%) |
| 4:00 PM to 11:59 PM | 143 (4.4%) | 251 (8.6%) |
| Total | 3,218 (100.0%) | 2,937 (100.0%) |
Housing Occupancy in Belmont
Occupancy by Ownership in Belmont
Of the total 6,049 dwellings in Belmont, owner-occupied units account for 4,180 (69.1%), while renter-occupied units make up 1,869 (30.9%).
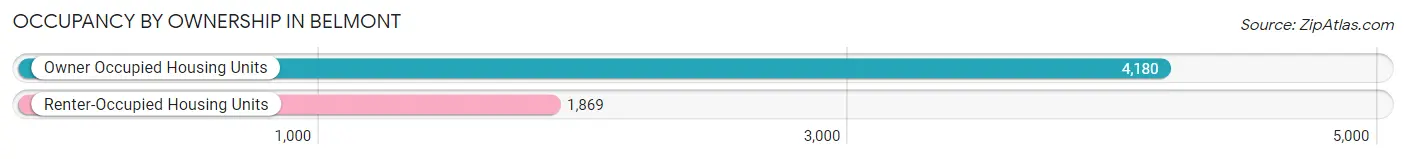
| Occupancy | # Housing Units | % Housing Units |
| Owner Occupied Housing Units | 4,180 | 69.1% |
| Renter-Occupied Housing Units | 1,869 | 30.9% |
| Total Occupied Housing Units | 6,049 | 100.0% |
Occupancy by Household Size in Belmont
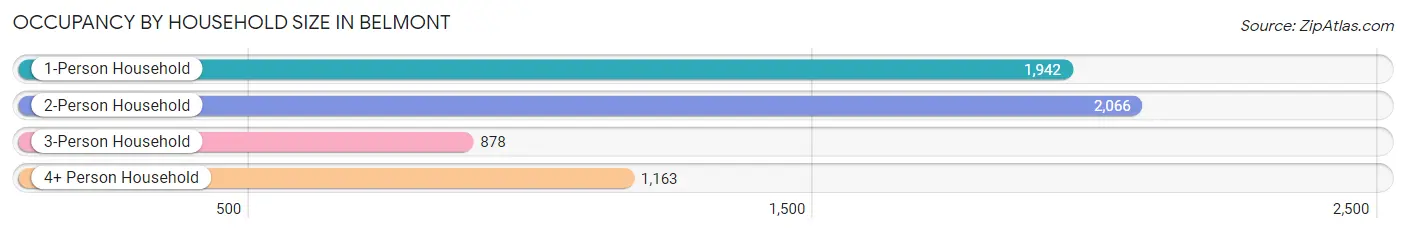
| Household Size | # Housing Units | % Housing Units |
| 1-Person Household | 1,942 | 32.1% |
| 2-Person Household | 2,066 | 34.2% |
| 3-Person Household | 878 | 14.5% |
| 4+ Person Household | 1,163 | 19.2% |
| Total Housing Units | 6,049 | 100.0% |
Occupancy by Ownership by Household Size in Belmont
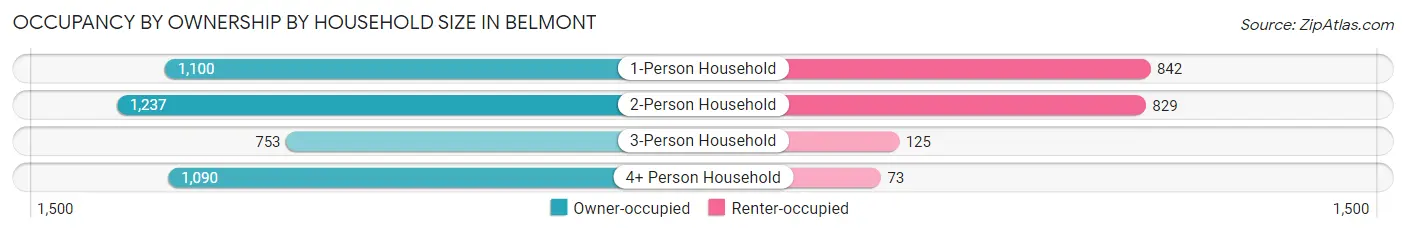
| Household Size | Owner-occupied | Renter-occupied |
| 1-Person Household | 1,100 (56.6%) | 842 (43.4%) |
| 2-Person Household | 1,237 (59.9%) | 829 (40.1%) |
| 3-Person Household | 753 (85.8%) | 125 (14.2%) |
| 4+ Person Household | 1,090 (93.7%) | 73 (6.3%) |
| Total Housing Units | 4,180 (69.1%) | 1,869 (30.9%) |
Occupancy by Educational Attainment in Belmont
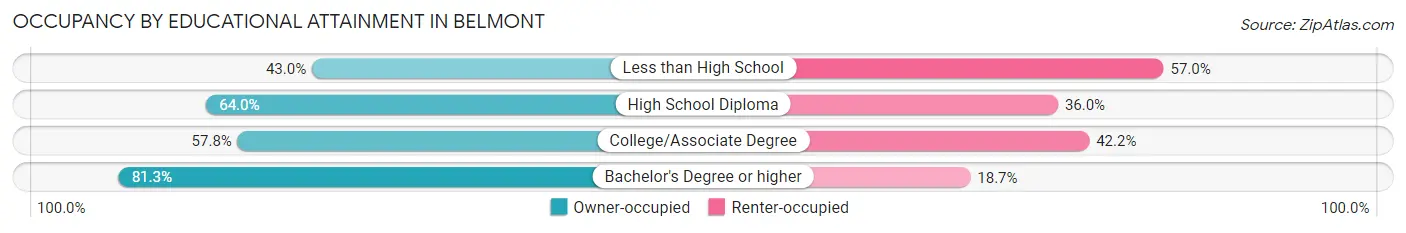
| Household Size | Owner-occupied | Renter-occupied |
| Less than High School | 151 (43.0%) | 200 (57.0%) |
| High School Diploma | 685 (64.0%) | 386 (36.0%) |
| College/Associate Degree | 1,027 (57.8%) | 751 (42.2%) |
| Bachelor's Degree or higher | 2,317 (81.3%) | 532 (18.7%) |
Occupancy by Age of Householder in Belmont
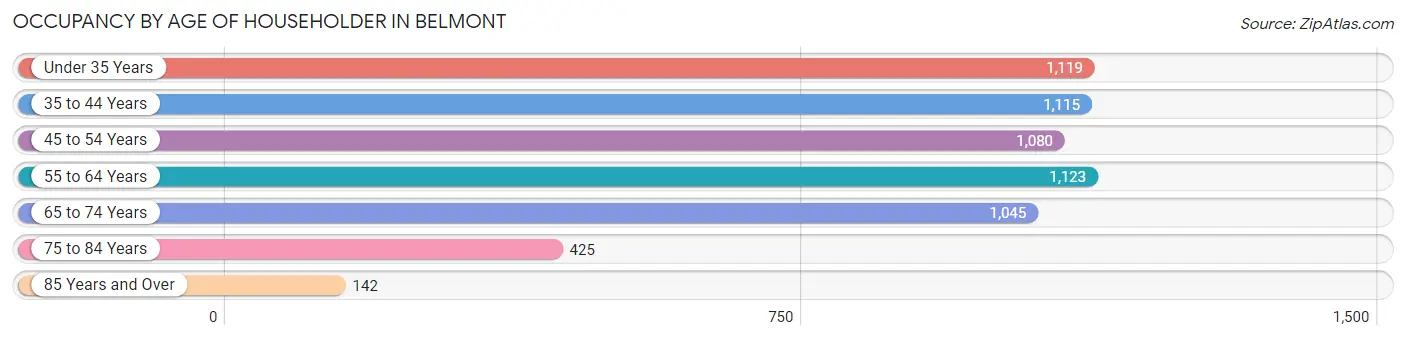
| Age Bracket | # Households | % Households |
| Under 35 Years | 1,119 | 18.5% |
| 35 to 44 Years | 1,115 | 18.4% |
| 45 to 54 Years | 1,080 | 17.8% |
| 55 to 64 Years | 1,123 | 18.6% |
| 65 to 74 Years | 1,045 | 17.3% |
| 75 to 84 Years | 425 | 7.0% |
| 85 Years and Over | 142 | 2.4% |
| Total | 6,049 | 100.0% |
Housing Finances in Belmont
Median Income by Occupancy in Belmont
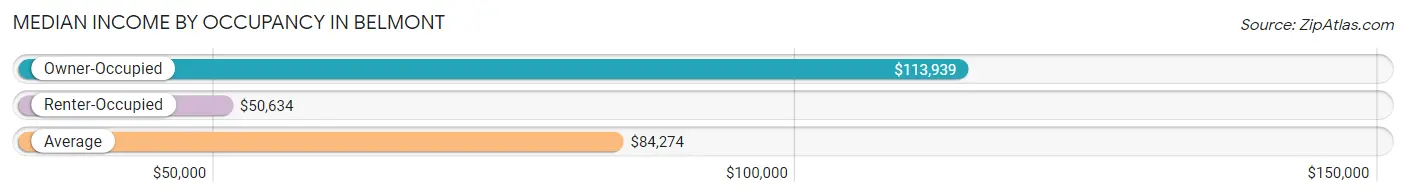
| Occupancy Type | # Households | Median Income |
| Owner-Occupied | 4,180 (69.1%) | $113,939 |
| Renter-Occupied | 1,869 (30.9%) | $50,634 |
| Average | 6,049 (100.0%) | $84,274 |
Occupancy by Householder Income Bracket in Belmont
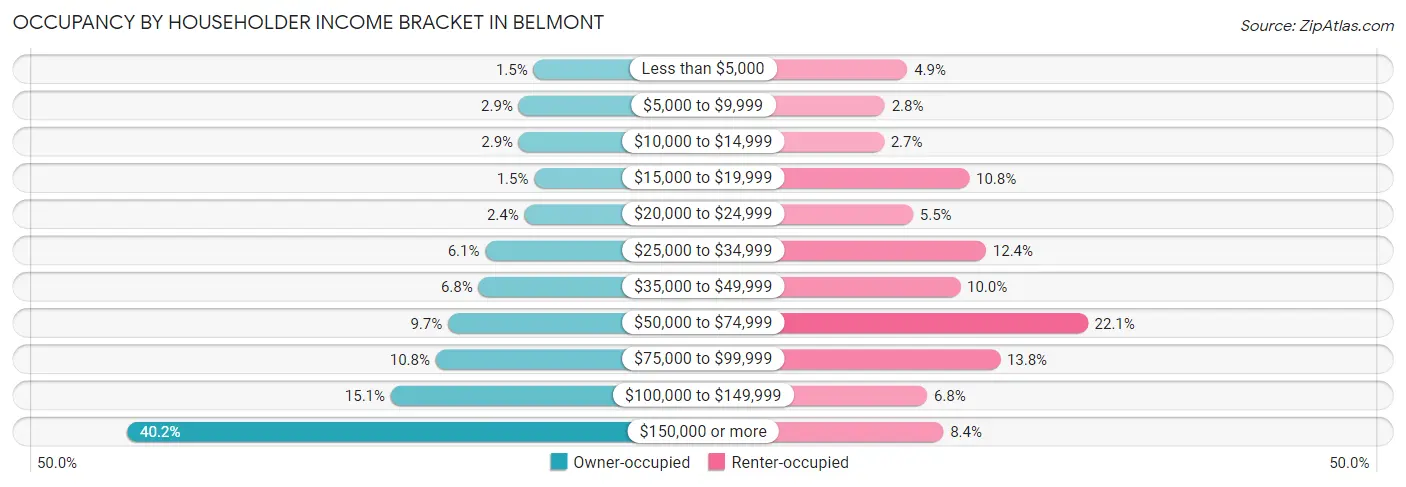
| Income Bracket | Owner-occupied | Renter-occupied |
| Less than $5,000 | 64 (1.5%) | 92 (4.9%) |
| $5,000 to $9,999 | 123 (2.9%) | 52 (2.8%) |
| $10,000 to $14,999 | 122 (2.9%) | 50 (2.7%) |
| $15,000 to $19,999 | 61 (1.5%) | 202 (10.8%) |
| $20,000 to $24,999 | 100 (2.4%) | 102 (5.5%) |
| $25,000 to $34,999 | 256 (6.1%) | 232 (12.4%) |
| $35,000 to $49,999 | 283 (6.8%) | 186 (10.0%) |
| $50,000 to $74,999 | 404 (9.7%) | 413 (22.1%) |
| $75,000 to $99,999 | 453 (10.8%) | 257 (13.8%) |
| $100,000 to $149,999 | 632 (15.1%) | 127 (6.8%) |
| $150,000 or more | 1,682 (40.2%) | 156 (8.4%) |
| Total | 4,180 (100.0%) | 1,869 (100.0%) |
Monthly Housing Cost Tiers in Belmont
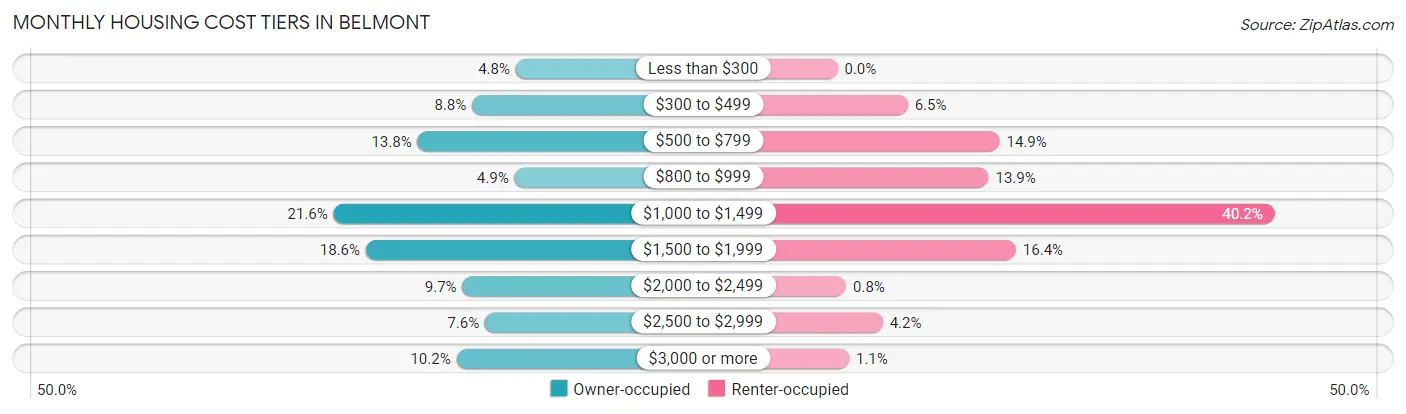
| Monthly Cost | Owner-occupied | Renter-occupied |
| Less than $300 | 200 (4.8%) | 0 (0.0%) |
| $300 to $499 | 368 (8.8%) | 121 (6.5%) |
| $500 to $799 | 578 (13.8%) | 279 (14.9%) |
| $800 to $999 | 205 (4.9%) | 260 (13.9%) |
| $1,000 to $1,499 | 901 (21.6%) | 752 (40.2%) |
| $1,500 to $1,999 | 777 (18.6%) | 307 (16.4%) |
| $2,000 to $2,499 | 405 (9.7%) | 15 (0.8%) |
| $2,500 to $2,999 | 318 (7.6%) | 78 (4.2%) |
| $3,000 or more | 428 (10.2%) | 20 (1.1%) |
| Total | 4,180 (100.0%) | 1,869 (100.0%) |
Physical Housing Characteristics in Belmont
Housing Structures in Belmont
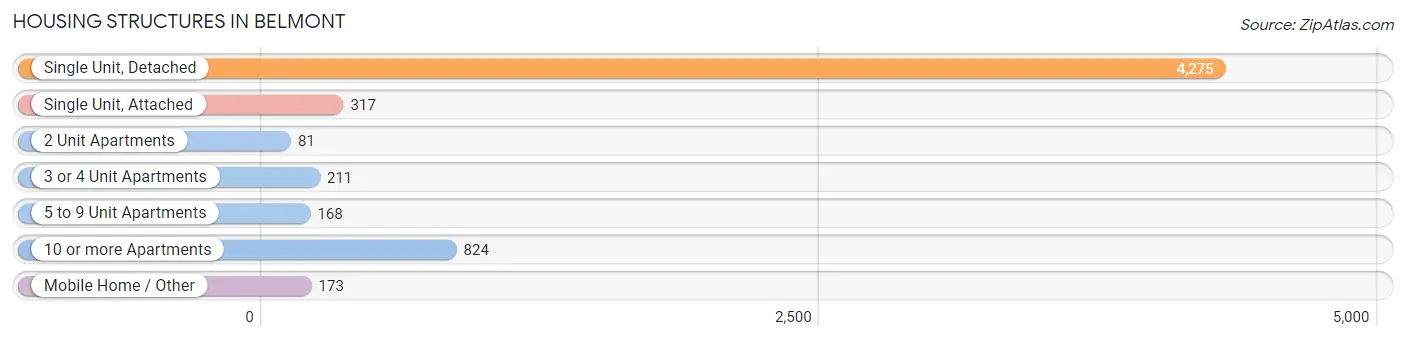
| Structure Type | # Housing Units | % Housing Units |
| Single Unit, Detached | 4,275 | 70.7% |
| Single Unit, Attached | 317 | 5.2% |
| 2 Unit Apartments | 81 | 1.3% |
| 3 or 4 Unit Apartments | 211 | 3.5% |
| 5 to 9 Unit Apartments | 168 | 2.8% |
| 10 or more Apartments | 824 | 13.6% |
| Mobile Home / Other | 173 | 2.9% |
| Total | 6,049 | 100.0% |
Housing Structures by Occupancy in Belmont
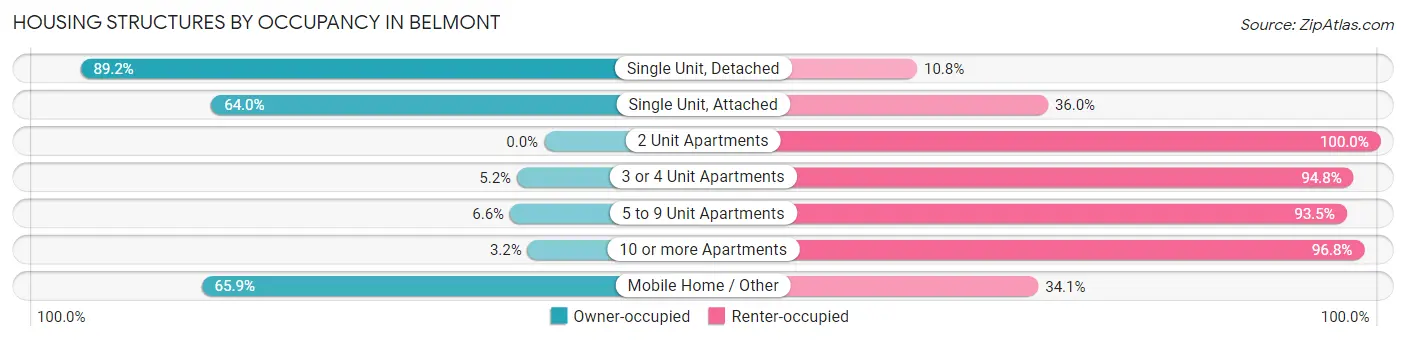
| Structure Type | Owner-occupied | Renter-occupied |
| Single Unit, Detached | 3,815 (89.2%) | 460 (10.8%) |
| Single Unit, Attached | 203 (64.0%) | 114 (36.0%) |
| 2 Unit Apartments | 0 (0.0%) | 81 (100.0%) |
| 3 or 4 Unit Apartments | 11 (5.2%) | 200 (94.8%) |
| 5 to 9 Unit Apartments | 11 (6.6%) | 157 (93.4%) |
| 10 or more Apartments | 26 (3.2%) | 798 (96.8%) |
| Mobile Home / Other | 114 (65.9%) | 59 (34.1%) |
| Total | 4,180 (69.1%) | 1,869 (30.9%) |
Housing Structures by Number of Rooms in Belmont
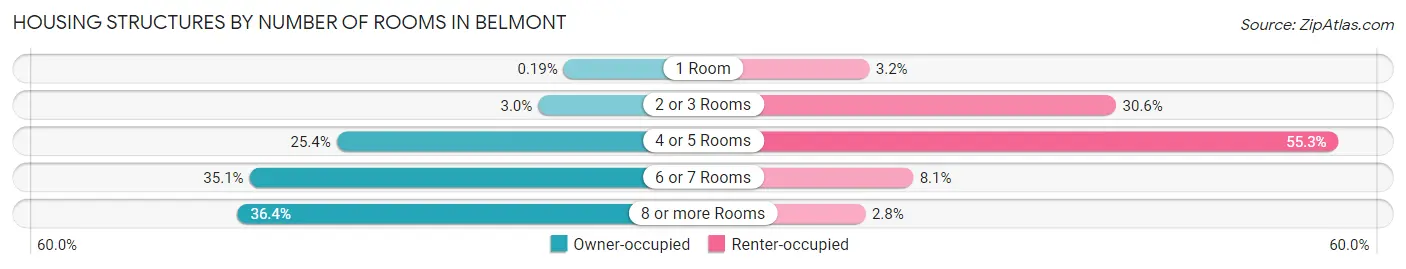
| Number of Rooms | Owner-occupied | Renter-occupied |
| 1 Room | 8 (0.2%) | 60 (3.2%) |
| 2 or 3 Rooms | 126 (3.0%) | 572 (30.6%) |
| 4 or 5 Rooms | 1,061 (25.4%) | 1,034 (55.3%) |
| 6 or 7 Rooms | 1,465 (35.0%) | 151 (8.1%) |
| 8 or more Rooms | 1,520 (36.4%) | 52 (2.8%) |
| Total | 4,180 (100.0%) | 1,869 (100.0%) |
Housing Structure by Heating Type in Belmont
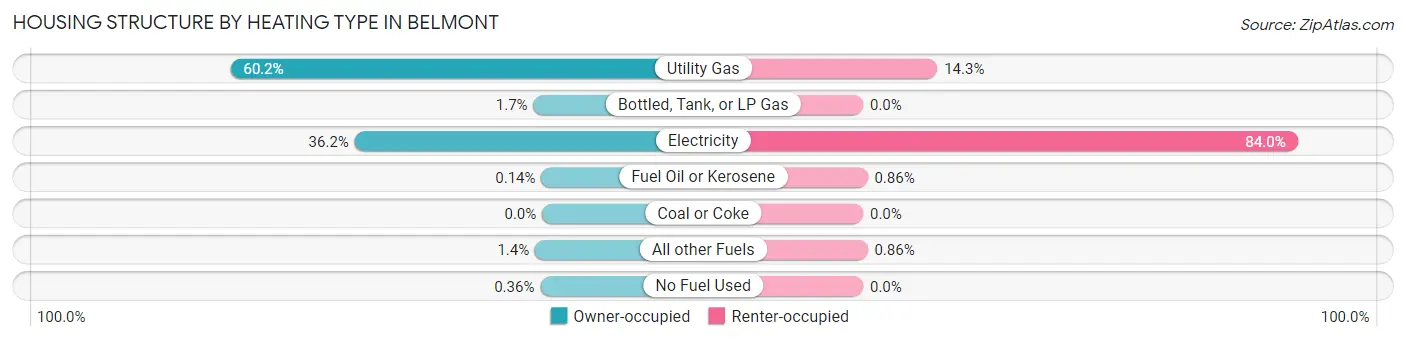
| Heating Type | Owner-occupied | Renter-occupied |
| Utility Gas | 2,518 (60.2%) | 268 (14.3%) |
| Bottled, Tank, or LP Gas | 70 (1.7%) | 0 (0.0%) |
| Electricity | 1,514 (36.2%) | 1,569 (84.0%) |
| Fuel Oil or Kerosene | 6 (0.1%) | 16 (0.9%) |
| Coal or Coke | 0 (0.0%) | 0 (0.0%) |
| All other Fuels | 57 (1.4%) | 16 (0.9%) |
| No Fuel Used | 15 (0.4%) | 0 (0.0%) |
| Total | 4,180 (100.0%) | 1,869 (100.0%) |
Household Vehicle Usage in Belmont
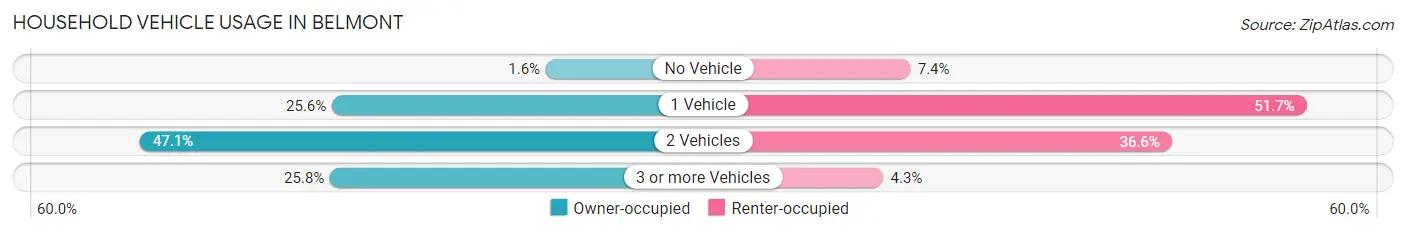
| Vehicles per Household | Owner-occupied | Renter-occupied |
| No Vehicle | 67 (1.6%) | 138 (7.4%) |
| 1 Vehicle | 1,068 (25.6%) | 966 (51.7%) |
| 2 Vehicles | 1,968 (47.1%) | 684 (36.6%) |
| 3 or more Vehicles | 1,077 (25.8%) | 81 (4.3%) |
| Total | 4,180 (100.0%) | 1,869 (100.0%) |
Real Estate & Mortgages in Belmont
Real Estate and Mortgage Overview in Belmont
| Characteristic | Without Mortgage | With Mortgage |
| Housing Units | 1,117 | 3,063 |
| Median Property Value | $235,200 | $341,100 |
| Median Household Income | $54,313 | $1,404 |
| Monthly Housing Costs | $504 | $417 |
| Real Estate Taxes | $1,986 | $0 |
Property Value by Mortgage Status in Belmont
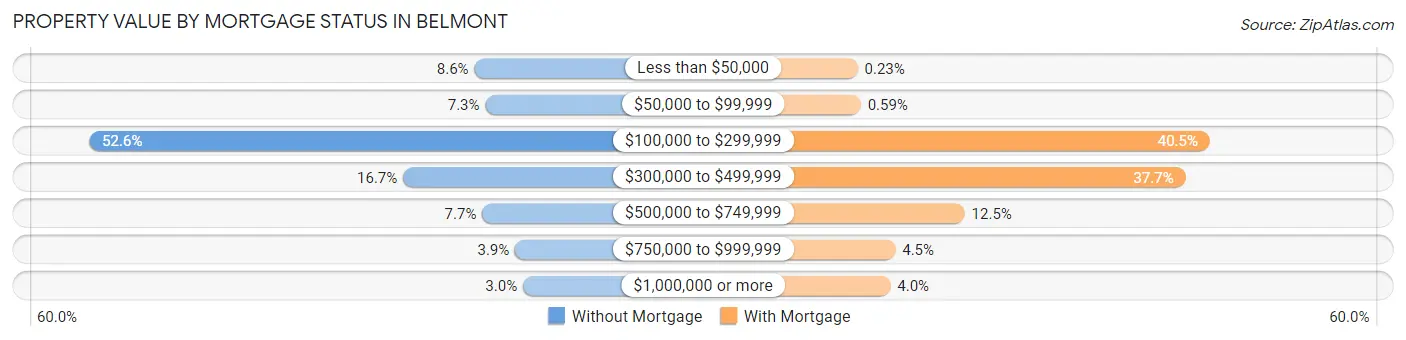
| Property Value | Without Mortgage | With Mortgage |
| Less than $50,000 | 96 (8.6%) | 7 (0.2%) |
| $50,000 to $99,999 | 82 (7.3%) | 18 (0.6%) |
| $100,000 to $299,999 | 588 (52.6%) | 1,240 (40.5%) |
| $300,000 to $499,999 | 187 (16.7%) | 1,155 (37.7%) |
| $500,000 to $749,999 | 86 (7.7%) | 382 (12.5%) |
| $750,000 to $999,999 | 44 (3.9%) | 139 (4.5%) |
| $1,000,000 or more | 34 (3.0%) | 122 (4.0%) |
| Total | 1,117 (100.0%) | 3,063 (100.0%) |
Household Income by Mortgage Status in Belmont
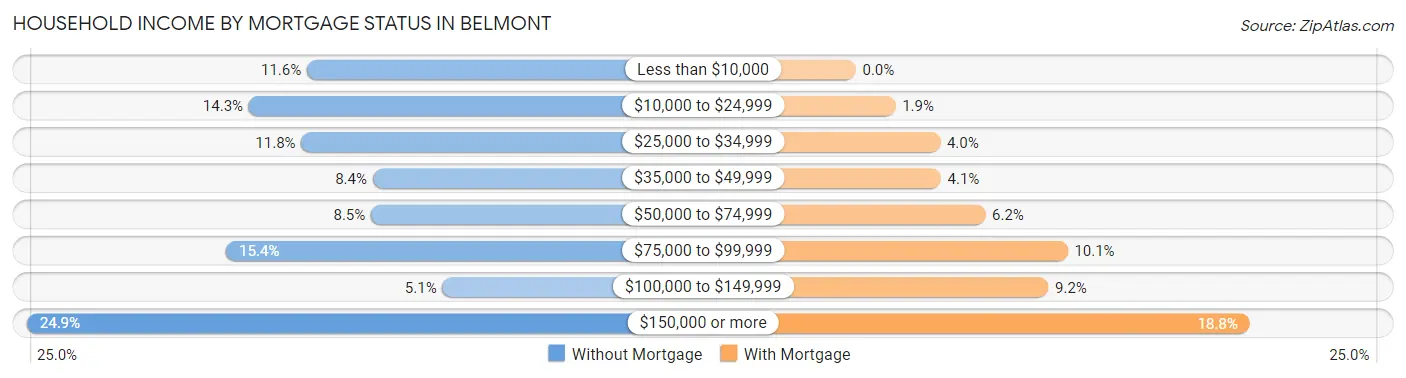
| Household Income | Without Mortgage | With Mortgage |
| Less than $10,000 | 129 (11.6%) | 0 (0.0%) |
| $10,000 to $24,999 | 160 (14.3%) | 58 (1.9%) |
| $25,000 to $34,999 | 132 (11.8%) | 123 (4.0%) |
| $35,000 to $49,999 | 94 (8.4%) | 124 (4.1%) |
| $50,000 to $74,999 | 95 (8.5%) | 189 (6.2%) |
| $75,000 to $99,999 | 172 (15.4%) | 309 (10.1%) |
| $100,000 to $149,999 | 57 (5.1%) | 281 (9.2%) |
| $150,000 or more | 278 (24.9%) | 575 (18.8%) |
| Total | 1,117 (100.0%) | 3,063 (100.0%) |
Property Value to Household Income Ratio in Belmont
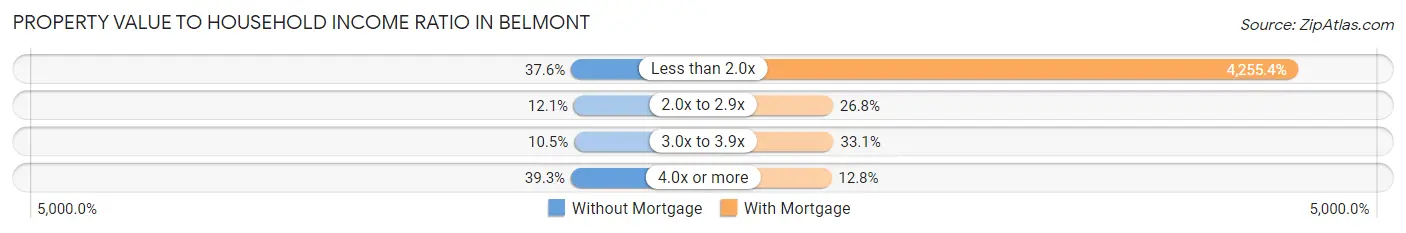
| Value-to-Income Ratio | Without Mortgage | With Mortgage |
| Less than 2.0x | 420 (37.6%) | 130,344 (4,255.4%) |
| 2.0x to 2.9x | 135 (12.1%) | 820 (26.8%) |
| 3.0x to 3.9x | 117 (10.5%) | 1,015 (33.1%) |
| 4.0x or more | 439 (39.3%) | 392 (12.8%) |
| Total | 1,117 (100.0%) | 3,063 (100.0%) |
Real Estate Taxes by Mortgage Status in Belmont
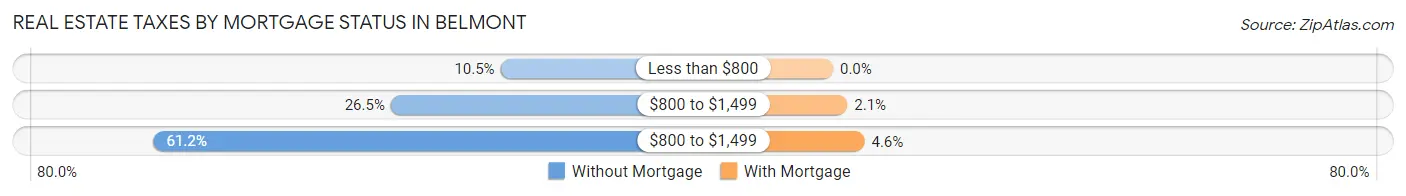
| Property Taxes | Without Mortgage | With Mortgage |
| Less than $800 | 117 (10.5%) | 0 (0.0%) |
| $800 to $1,499 | 296 (26.5%) | 64 (2.1%) |
| $800 to $1,499 | 683 (61.2%) | 141 (4.6%) |
| Total | 1,117 (100.0%) | 3,063 (100.0%) |
Health & Disability in Belmont
Health Insurance Coverage by Age in Belmont
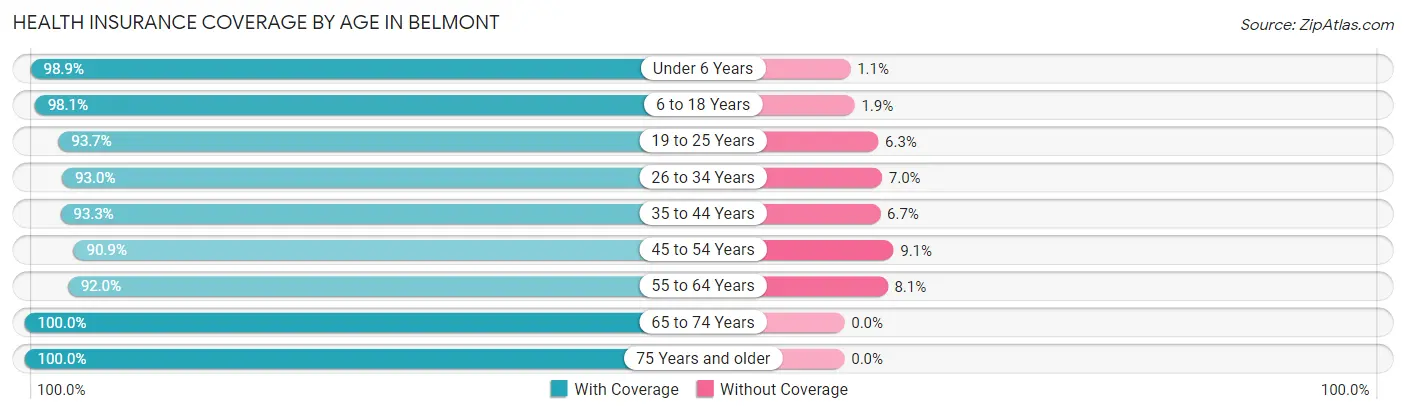
| Age Bracket | With Coverage | Without Coverage |
| Under 6 Years | 802 (98.9%) | 9 (1.1%) |
| 6 to 18 Years | 2,577 (98.1%) | 50 (1.9%) |
| 19 to 25 Years | 1,071 (93.7%) | 72 (6.3%) |
| 26 to 34 Years | 2,019 (93.0%) | 152 (7.0%) |
| 35 to 44 Years | 1,789 (93.3%) | 128 (6.7%) |
| 45 to 54 Years | 1,918 (90.9%) | 193 (9.1%) |
| 55 to 64 Years | 1,599 (91.9%) | 140 (8.1%) |
| 65 to 74 Years | 1,471 (100.0%) | 0 (0.0%) |
| 75 Years and older | 794 (100.0%) | 0 (0.0%) |
| Total | 14,040 (95.0%) | 744 (5.0%) |
Health Insurance Coverage by Citizenship Status in Belmont
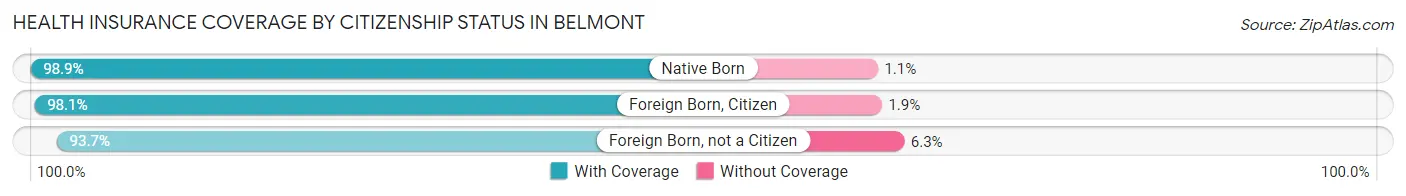
| Citizenship Status | With Coverage | Without Coverage |
| Native Born | 802 (98.9%) | 9 (1.1%) |
| Foreign Born, Citizen | 2,577 (98.1%) | 50 (1.9%) |
| Foreign Born, not a Citizen | 1,071 (93.7%) | 72 (6.3%) |
Health Insurance Coverage by Household Income in Belmont
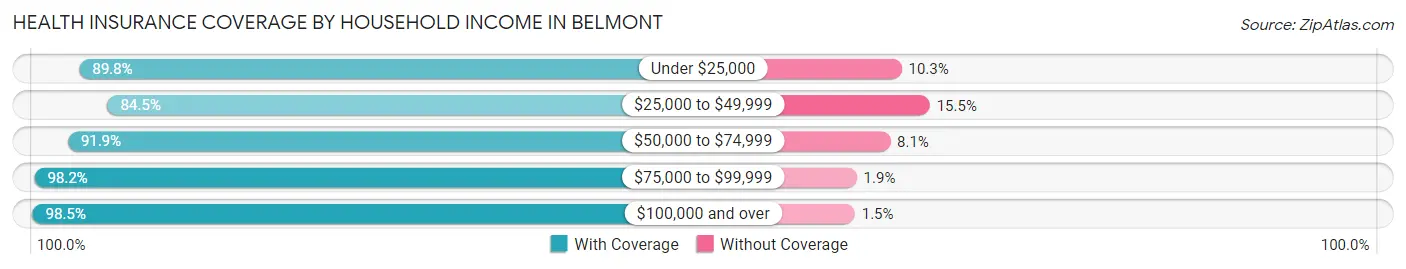
| Household Income | With Coverage | Without Coverage |
| Under $25,000 | 1,025 (89.7%) | 117 (10.2%) |
| $25,000 to $49,999 | 1,527 (84.5%) | 281 (15.5%) |
| $50,000 to $74,999 | 1,621 (91.9%) | 143 (8.1%) |
| $75,000 to $99,999 | 1,433 (98.2%) | 27 (1.8%) |
| $100,000 and over | 7,801 (98.5%) | 119 (1.5%) |
Public vs Private Health Insurance Coverage by Age in Belmont
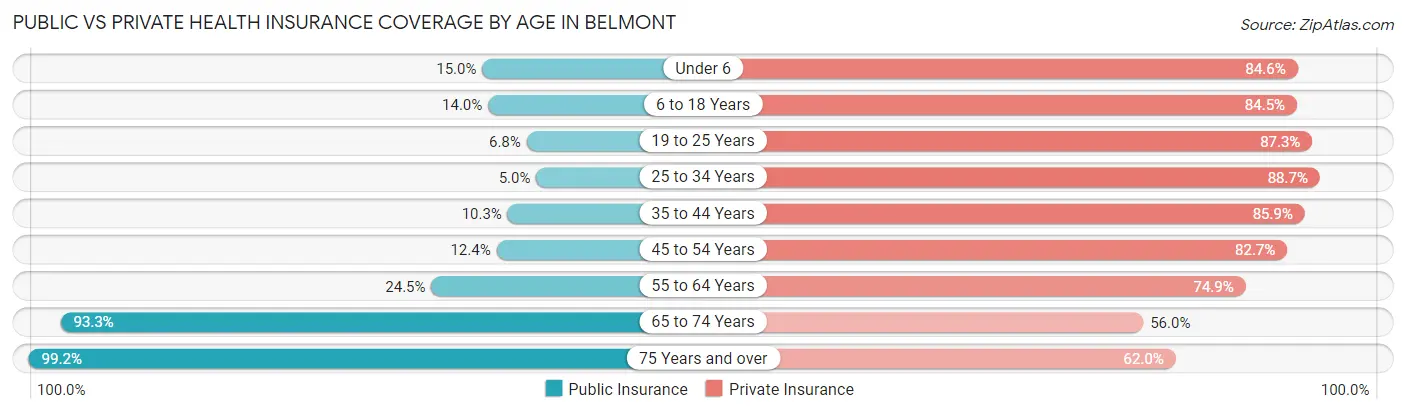
| Age Bracket | Public Insurance | Private Insurance |
| Under 6 | 122 (15.0%) | 686 (84.6%) |
| 6 to 18 Years | 367 (14.0%) | 2,219 (84.5%) |
| 19 to 25 Years | 78 (6.8%) | 998 (87.3%) |
| 25 to 34 Years | 109 (5.0%) | 1,926 (88.7%) |
| 35 to 44 Years | 198 (10.3%) | 1,647 (85.9%) |
| 45 to 54 Years | 262 (12.4%) | 1,745 (82.7%) |
| 55 to 64 Years | 426 (24.5%) | 1,303 (74.9%) |
| 65 to 74 Years | 1,373 (93.3%) | 823 (55.9%) |
| 75 Years and over | 788 (99.2%) | 492 (62.0%) |
| Total | 3,723 (25.2%) | 11,839 (80.1%) |
Disability Status by Sex by Age in Belmont
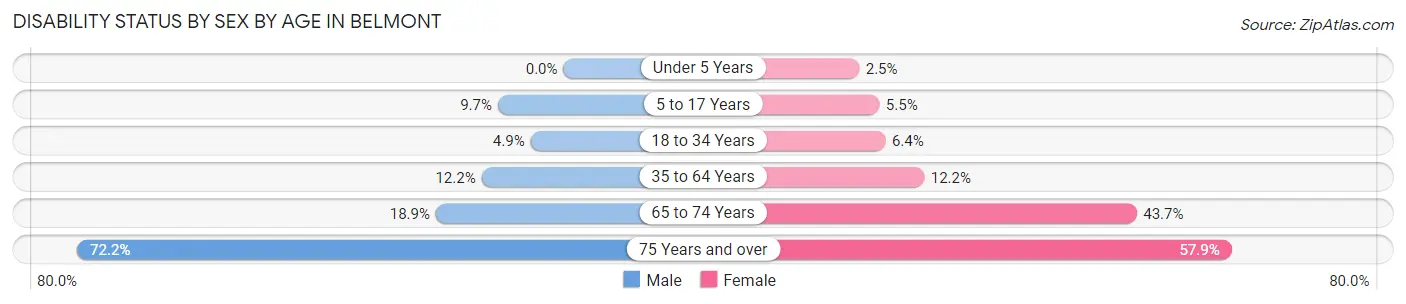
| Age Bracket | Male | Female |
| Under 5 Years | 0 (0.0%) | 13 (2.5%) |
| 5 to 17 Years | 94 (9.7%) | 79 (5.5%) |
| 18 to 34 Years | 89 (4.9%) | 119 (6.4%) |
| 35 to 64 Years | 338 (12.2%) | 364 (12.2%) |
| 65 to 74 Years | 111 (18.9%) | 387 (43.7%) |
| 75 Years and over | 174 (72.2%) | 320 (57.9%) |
Disability Class by Sex by Age in Belmont
Disability Class: Hearing Difficulty
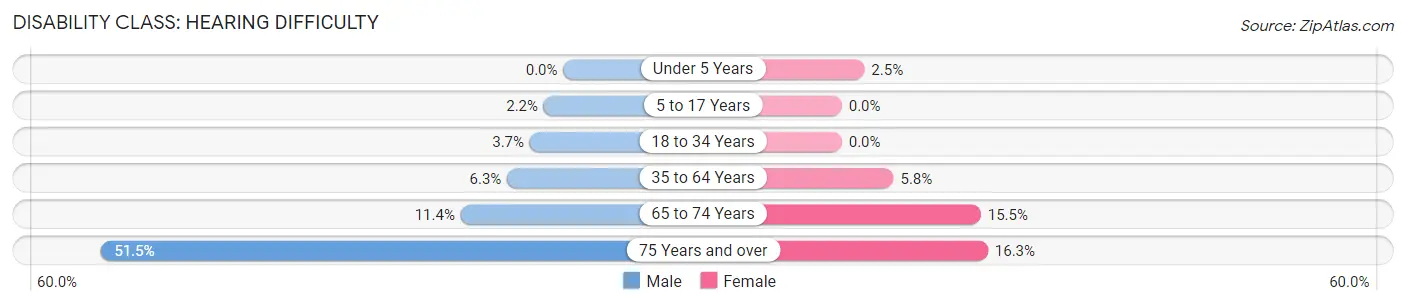
| Age Bracket | Male | Female |
| Under 5 Years | 0 (0.0%) | 13 (2.5%) |
| 5 to 17 Years | 21 (2.2%) | 0 (0.0%) |
| 18 to 34 Years | 68 (3.7%) | 0 (0.0%) |
| 35 to 64 Years | 174 (6.3%) | 172 (5.8%) |
| 65 to 74 Years | 67 (11.4%) | 137 (15.5%) |
| 75 Years and over | 124 (51.4%) | 90 (16.3%) |
Disability Class: Vision Difficulty
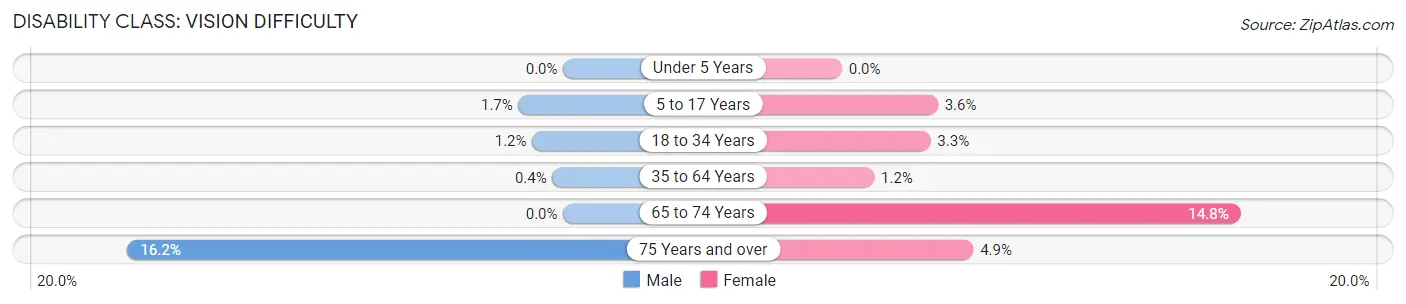
| Age Bracket | Male | Female |
| Under 5 Years | 0 (0.0%) | 0 (0.0%) |
| 5 to 17 Years | 16 (1.7%) | 51 (3.6%) |
| 18 to 34 Years | 21 (1.1%) | 61 (3.3%) |
| 35 to 64 Years | 11 (0.4%) | 36 (1.2%) |
| 65 to 74 Years | 0 (0.0%) | 131 (14.8%) |
| 75 Years and over | 39 (16.2%) | 27 (4.9%) |
Disability Class: Cognitive Difficulty
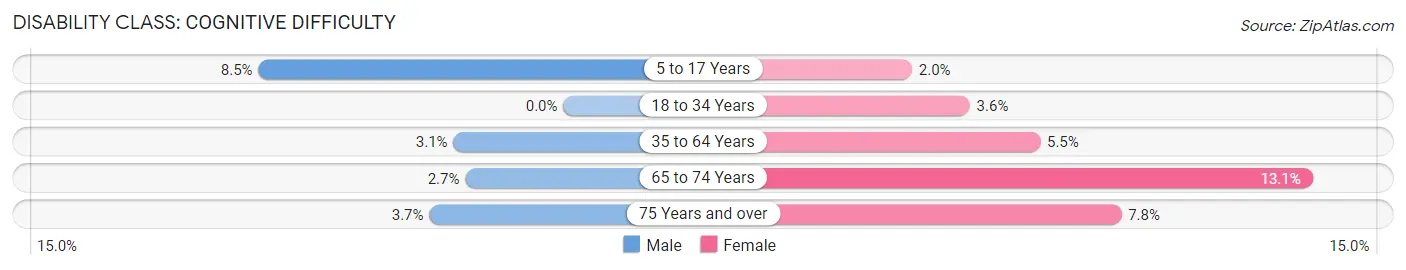
| Age Bracket | Male | Female |
| 5 to 17 Years | 82 (8.5%) | 28 (1.9%) |
| 18 to 34 Years | 0 (0.0%) | 66 (3.6%) |
| 35 to 64 Years | 85 (3.1%) | 165 (5.5%) |
| 65 to 74 Years | 16 (2.7%) | 116 (13.1%) |
| 75 Years and over | 9 (3.7%) | 43 (7.8%) |
Disability Class: Ambulatory Difficulty
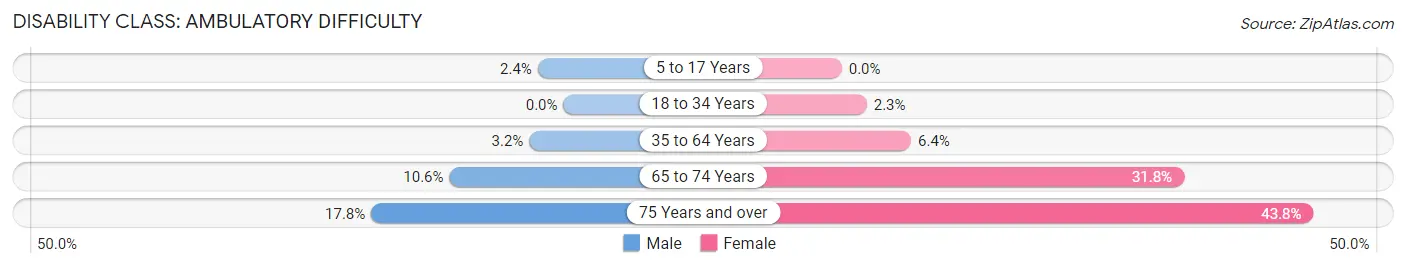
| Age Bracket | Male | Female |
| 5 to 17 Years | 23 (2.4%) | 0 (0.0%) |
| 18 to 34 Years | 0 (0.0%) | 43 (2.3%) |
| 35 to 64 Years | 88 (3.2%) | 192 (6.4%) |
| 65 to 74 Years | 62 (10.6%) | 281 (31.8%) |
| 75 Years and over | 43 (17.8%) | 242 (43.8%) |
Disability Class: Self-Care Difficulty
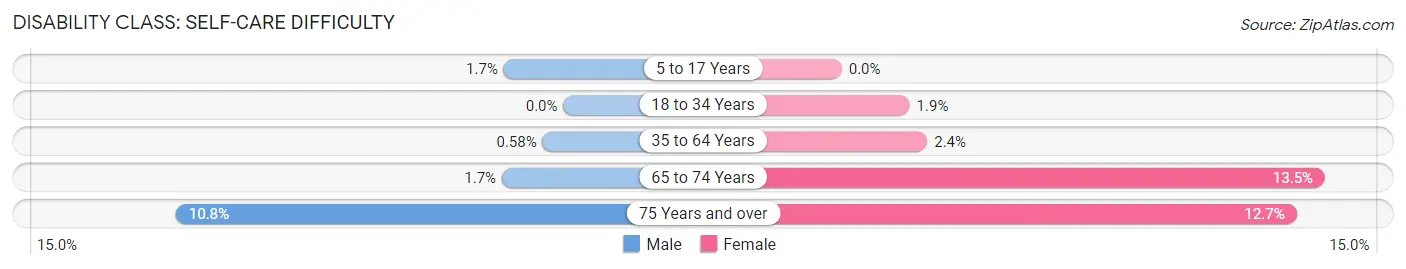
| Age Bracket | Male | Female |
| 5 to 17 Years | 16 (1.7%) | 0 (0.0%) |
| 18 to 34 Years | 0 (0.0%) | 35 (1.9%) |
| 35 to 64 Years | 16 (0.6%) | 71 (2.4%) |
| 65 to 74 Years | 10 (1.7%) | 119 (13.5%) |
| 75 Years and over | 26 (10.8%) | 70 (12.7%) |
Technology Access in Belmont
Computing Device Access in Belmont
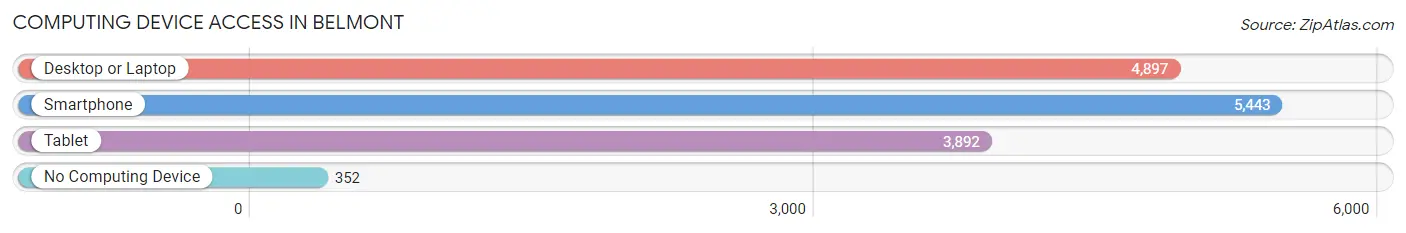
| Device Type | # Households | % Households |
| Desktop or Laptop | 4,897 | 81.0% |
| Smartphone | 5,443 | 90.0% |
| Tablet | 3,892 | 64.3% |
| No Computing Device | 352 | 5.8% |
| Total | 6,049 | 100.0% |
Internet Access in Belmont
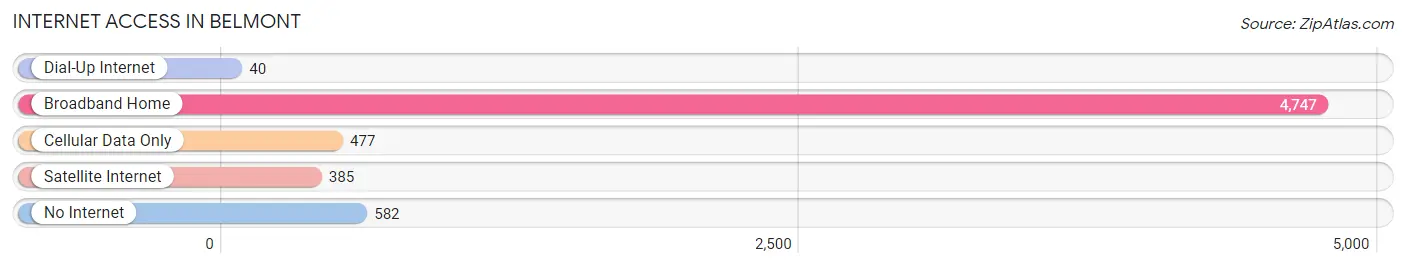
| Internet Type | # Households | % Households |
| Dial-Up Internet | 40 | 0.7% |
| Broadband Home | 4,747 | 78.5% |
| Cellular Data Only | 477 | 7.9% |
| Satellite Internet | 385 | 6.4% |
| No Internet | 582 | 9.6% |
| Total | 6,049 | 100.0% |
Belmont Summary
Belmont, North Carolina is a small city located in Gaston County, in the western part of the state. It is situated on the banks of the Catawba River, about 15 miles west of Charlotte. The city has a population of approximately 10,000 people and is part of the Charlotte metropolitan area.
History
Belmont was founded in 1895 by a group of investors from the nearby city of Charlotte. The city was named after the Belmont Mansion, which was built in the area in 1849. The mansion was owned by the prominent textile manufacturer, Colonel Robert M. Miller. The city was incorporated in 1895 and quickly became a center for the textile industry. The city was also home to several cotton mills, which provided employment for many of the city’s residents.
In the early 20th century, Belmont experienced a period of growth and prosperity. The city was home to several banks, stores, and other businesses. The city also had a thriving entertainment scene, with several theaters, restaurants, and other attractions.
In the late 20th century, the textile industry began to decline in the area, leading to a period of economic decline. The city’s population began to decline as well, as many people moved away in search of better job opportunities. In recent years, the city has experienced a resurgence, as new businesses and industries have moved into the area.
Geography
Belmont is located in western North Carolina, in Gaston County. The city is situated on the banks of the Catawba River, about 15 miles west of Charlotte. The city covers an area of approximately 4.5 square miles and has an elevation of 830 feet. The city is located in the foothills of the Blue Ridge Mountains and is surrounded by several small towns and villages.
The climate in Belmont is humid subtropical, with hot, humid summers and mild winters. The average annual temperature is around 60 degrees Fahrenheit. The city receives an average of 48 inches of precipitation per year.
Economy
Belmont’s economy is largely based on manufacturing and services. The city is home to several large manufacturing companies, including a paper mill, a plastics plant, and a furniture factory. The city is also home to several small businesses, including restaurants, retail stores, and professional services.
The city is also home to several educational institutions, including Belmont Abbey College and Gaston College. The city is served by the Charlotte Douglas International Airport, which is located about 20 miles away.
Demographics
As of the 2010 census, Belmont had a population of 10,076 people. The racial makeup of the city was 79.3% White, 14.2% African American, 0.4% Native American, 1.2% Asian, and 4.9% from other races. The median household income was $41,945, and the median family income was $50,945.
Belmont is a diverse city, with a variety of cultures and backgrounds represented. The city is home to a large Hispanic population, as well as a growing Asian population. The city is also home to a large number of churches, representing a variety of denominations.
Common Questions
What is Per Capita Income in Belmont?
Per Capita income in Belmont is $52,690.
What is the Median Family Income in Belmont?
Median Family Income in Belmont is $123,415.
What is the Median Household income in Belmont?
Median Household Income in Belmont is $84,274.
What is Income or Wage Gap in Belmont?
Income or Wage Gap in Belmont is 23.9%.
Women in Belmont earn 76.1 cents for every dollar earned by a man.
What is Family Income Deficit in Belmont?
Family Income Deficit in Belmont is $8,203.
Families that are below poverty line in Belmont earn $8,203 less on average than the poverty threshold level.
What is Inequality or Gini Index in Belmont?
Inequality or Gini Index in Belmont is 0.52.
What is the Total Population of Belmont?
Total Population of Belmont is 14,842.
What is the Total Male Population of Belmont?
Total Male Population of Belmont is 6,562.
What is the Total Female Population of Belmont?
Total Female Population of Belmont is 8,280.
What is the Ratio of Males per 100 Females in Belmont?
There are 79.25 Males per 100 Females in Belmont.
What is the Ratio of Females per 100 Males in Belmont?
There are 126.18 Females per 100 Males in Belmont.
What is the Median Population Age in Belmont?
Median Population Age in Belmont is 37.9 Years.
What is the Average Family Size in Belmont
Average Family Size in Belmont is 3.0 People.
What is the Average Household Size in Belmont
Average Household Size in Belmont is 2.3 People.
How Large is the Labor Force in Belmont?
There are 7,964 People in the Labor Forcein in Belmont.
What is the Percentage of People in the Labor Force in Belmont?
65.7% of People are in the Labor Force in Belmont.
What is the Unemployment Rate in Belmont?
Unemployment Rate in Belmont is 4.4%.