Morganton, NC Map & Demographics
Morganton Map
Morganton Overview
$26,379
PER CAPITA INCOME
$54,476
AVG FAMILY INCOME
$47,715
AVG HOUSEHOLD INCOME
1.6%
WAGE / INCOME GAP [ % ]
98.4¢/ $1
WAGE / INCOME GAP [ $ ]
$10,499
FAMILY INCOME DEFICIT
0.50
INEQUALITY / GINI INDEX
17,457
TOTAL POPULATION
8,383
MALE POPULATION
9,074
FEMALE POPULATION
92.38
MALES / 100 FEMALES
108.24
FEMALES / 100 MALES
37.7
MEDIAN AGE
3.2
AVG FAMILY SIZE
2.5
AVG HOUSEHOLD SIZE
7,491
LABOR FORCE [ PEOPLE ]
55.3%
PERCENT IN LABOR FORCE
5.4%
UNEMPLOYMENT RATE
Morganton Zip Codes
Morganton Area Codes
Income in Morganton
Income Overview in Morganton
Per Capita Income in Morganton is $26,379, while median incomes of families and households are $54,476 and $47,715 respectively.
| Characteristic | Number | Measure |
| Per Capita Income | 17,457 | $26,379 |
| Median Family Income | 4,236 | $54,476 |
| Mean Family Income | 4,236 | $80,633 |
| Median Household Income | 6,469 | $47,715 |
| Mean Household Income | 6,469 | $68,321 |
| Income Deficit | 4,236 | $10,499 |
| Wage / Income Gap (%) | 17,457 | 1.60% |
| Wage / Income Gap ($) | 17,457 | 98.40¢ per $1 |
| Gini / Inequality Index | 17,457 | 0.50 |
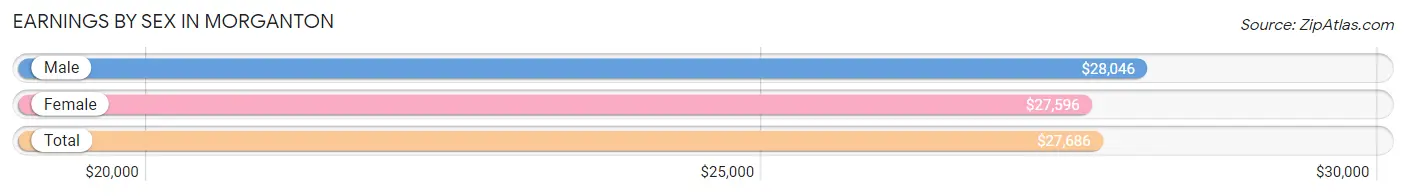
Earnings by Sex in Morganton
Average Earnings in Morganton are $27,686, $28,046 for men and $27,596 for women, a difference of 1.6%.
| Sex | Number | Average Earnings |
| Male | 3,964 (49.8%) | $28,046 |
| Female | 3,997 (50.2%) | $27,596 |
| Total | 7,961 (100.0%) | $27,686 |
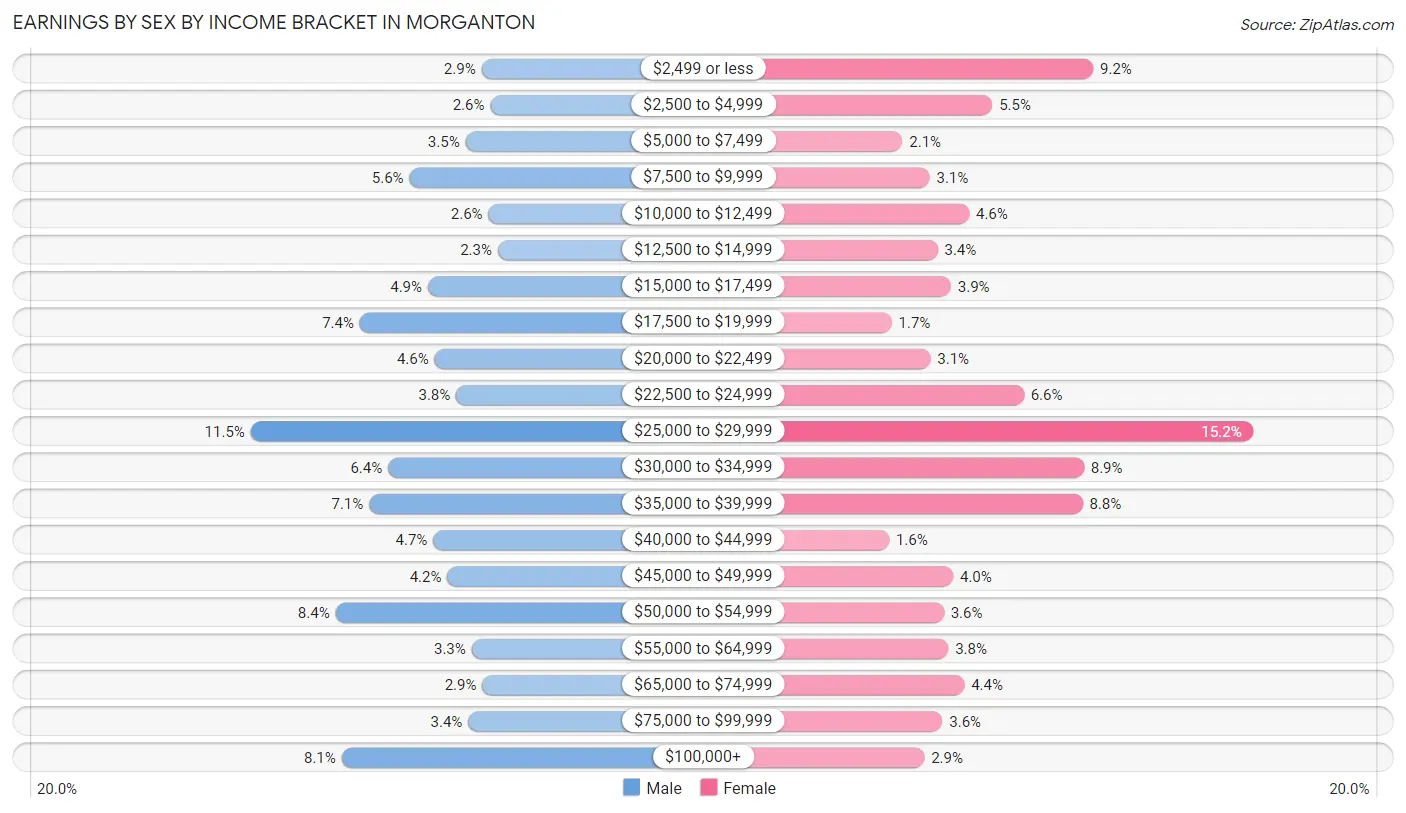
Earnings by Sex by Income Bracket in Morganton
The most common earnings brackets in Morganton are $25,000 to $29,999 for men (457 | 11.5%) and $25,000 to $29,999 for women (609 | 15.2%).
| Income | Male | Female |
| $2,499 or less | 114 (2.9%) | 369 (9.2%) |
| $2,500 to $4,999 | 101 (2.5%) | 218 (5.4%) |
| $5,000 to $7,499 | 138 (3.5%) | 83 (2.1%) |
| $7,500 to $9,999 | 221 (5.6%) | 124 (3.1%) |
| $10,000 to $12,499 | 104 (2.6%) | 183 (4.6%) |
| $12,500 to $14,999 | 90 (2.3%) | 136 (3.4%) |
| $15,000 to $17,499 | 194 (4.9%) | 156 (3.9%) |
| $17,500 to $19,999 | 295 (7.4%) | 67 (1.7%) |
| $20,000 to $22,499 | 184 (4.6%) | 125 (3.1%) |
| $22,500 to $24,999 | 152 (3.8%) | 265 (6.6%) |
| $25,000 to $29,999 | 457 (11.5%) | 609 (15.2%) |
| $30,000 to $34,999 | 253 (6.4%) | 355 (8.9%) |
| $35,000 to $39,999 | 281 (7.1%) | 353 (8.8%) |
| $40,000 to $44,999 | 186 (4.7%) | 63 (1.6%) |
| $45,000 to $49,999 | 165 (4.2%) | 159 (4.0%) |
| $50,000 to $54,999 | 331 (8.4%) | 145 (3.6%) |
| $55,000 to $64,999 | 129 (3.3%) | 152 (3.8%) |
| $65,000 to $74,999 | 113 (2.9%) | 176 (4.4%) |
| $75,000 to $99,999 | 134 (3.4%) | 143 (3.6%) |
| $100,000+ | 322 (8.1%) | 116 (2.9%) |
| Total | 3,964 (100.0%) | 3,997 (100.0%) |
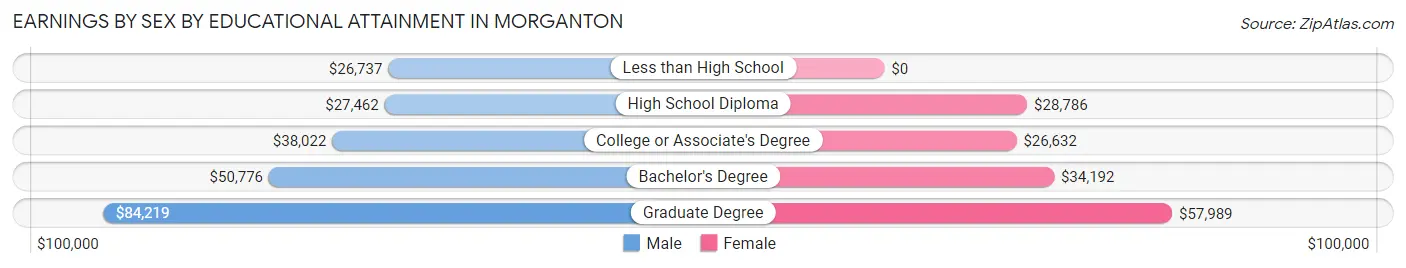
Earnings by Sex by Educational Attainment in Morganton
Average earnings in Morganton are $37,976 for men and $28,704 for women, a difference of 24.4%. Men with an educational attainment of graduate degree enjoy the highest average annual earnings of $84,219, while those with less than high school education earn the least with $26,737. Women with an educational attainment of graduate degree earn the most with the average annual earnings of $57,989, while those with college or associate's degree education have the smallest earnings of $26,632.
| Educational Attainment | Male Income | Female Income |
| Less than High School | $26,737 | $0 |
| High School Diploma | $27,462 | $28,786 |
| College or Associate's Degree | $38,022 | $26,632 |
| Bachelor's Degree | $50,776 | $34,192 |
| Graduate Degree | $84,219 | $57,989 |
| Total | $37,976 | $28,704 |
Family Income in Morganton
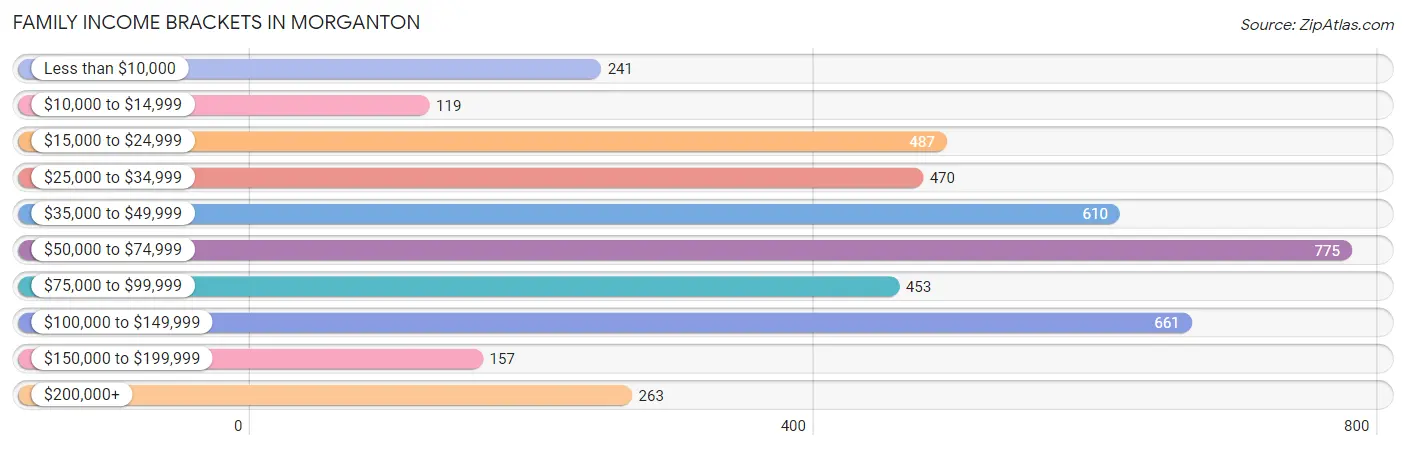
Family Income Brackets in Morganton
According to the Morganton family income data, there are 775 families falling into the $50,000 to $74,999 income range, which is the most common income bracket and makes up 18.3% of all families. Conversely, the $10,000 to $14,999 income bracket is the least frequent group with only 119 families (2.8%) belonging to this category.
| Income Bracket | # Families | % Families |
| Less than $10,000 | 241 | 5.7% |
| $10,000 to $14,999 | 119 | 2.8% |
| $15,000 to $24,999 | 487 | 11.5% |
| $25,000 to $34,999 | 470 | 11.1% |
| $35,000 to $49,999 | 610 | 14.4% |
| $50,000 to $74,999 | 775 | 18.3% |
| $75,000 to $99,999 | 453 | 10.7% |
| $100,000 to $149,999 | 661 | 15.6% |
| $150,000 to $199,999 | 157 | 3.7% |
| $200,000+ | 263 | 6.2% |
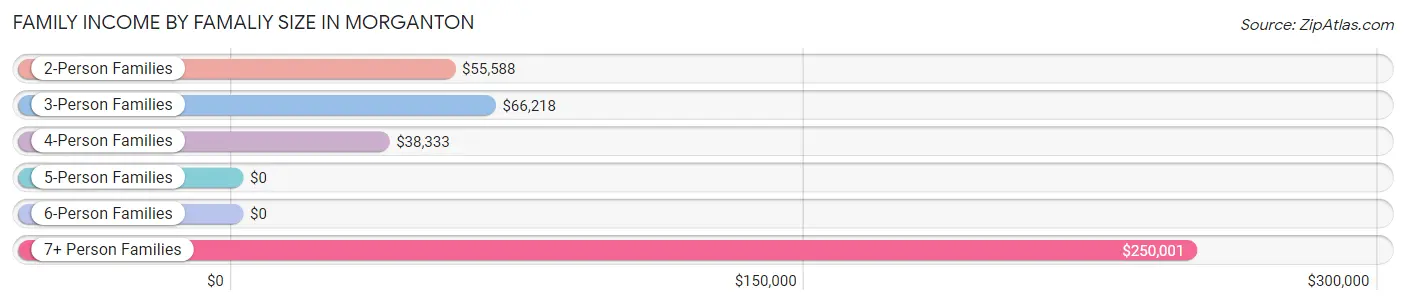
Family Income by Famaliy Size in Morganton
7+ person families (33 | 0.8%) account for the highest median family income in Morganton with $250,001 per family, while 7+ person families (33 | 0.8%) have the highest median income of $35,714 per family member.
| Income Bracket | # Families | Median Income |
| 2-Person Families | 2,116 (49.9%) | $55,588 |
| 3-Person Families | 603 (14.2%) | $66,218 |
| 4-Person Families | 720 (17.0%) | $38,333 |
| 5-Person Families | 526 (12.4%) | $0 |
| 6-Person Families | 238 (5.6%) | $0 |
| 7+ Person Families | 33 (0.8%) | $250,001 |
| Total | 4,236 (100.0%) | $54,476 |
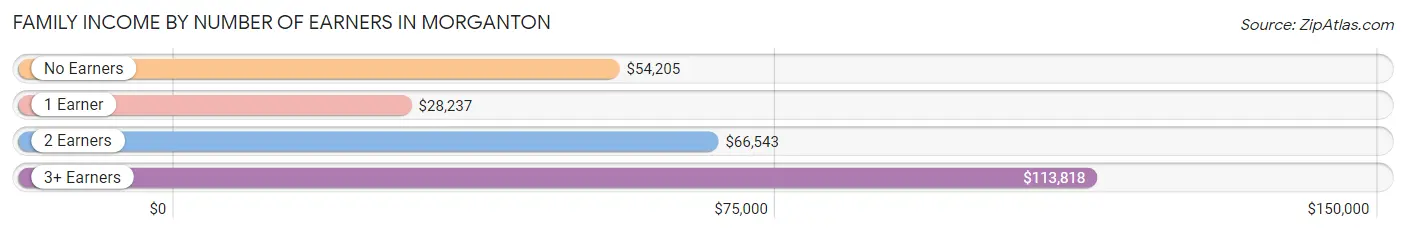
Family Income by Number of Earners in Morganton
The median family income in Morganton is $54,476, with families comprising 3+ earners (379) having the highest median family income of $113,818, while families with 1 earner (1,673) have the lowest median family income of $28,237, accounting for 8.9% and 39.5% of families, respectively.
| Number of Earners | # Families | Median Income |
| No Earners | 676 (16.0%) | $54,205 |
| 1 Earner | 1,673 (39.5%) | $28,237 |
| 2 Earners | 1,508 (35.6%) | $66,543 |
| 3+ Earners | 379 (8.9%) | $113,818 |
| Total | 4,236 (100.0%) | $54,476 |
Household Income in Morganton
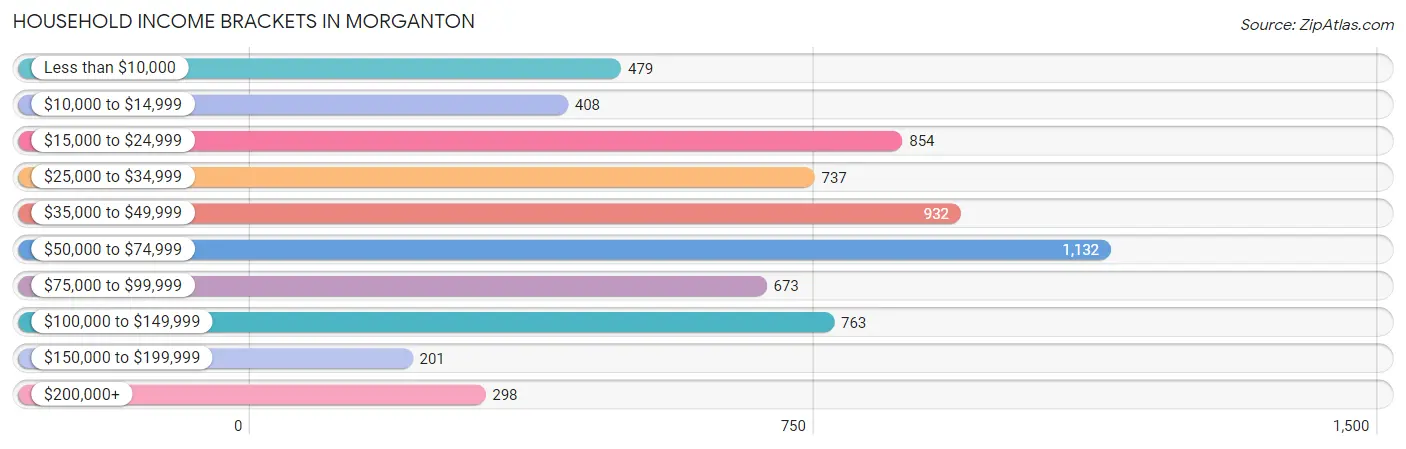
Household Income Brackets in Morganton
With 1,132 households falling in the category, the $50,000 to $74,999 income range is the most frequent in Morganton, accounting for 17.5% of all households. In contrast, only 201 households (3.1%) fall into the $150,000 to $199,999 income bracket, making it the least populous group.
| Income Bracket | # Households | % Households |
| Less than $10,000 | 479 | 7.4% |
| $10,000 to $14,999 | 408 | 6.3% |
| $15,000 to $24,999 | 854 | 13.2% |
| $25,000 to $34,999 | 737 | 11.4% |
| $35,000 to $49,999 | 932 | 14.4% |
| $50,000 to $74,999 | 1,132 | 17.5% |
| $75,000 to $99,999 | 673 | 10.4% |
| $100,000 to $149,999 | 763 | 11.8% |
| $150,000 to $199,999 | 201 | 3.1% |
| $200,000+ | 298 | 4.6% |
Household Income by Householder Age in Morganton
The median household income in Morganton is $47,715, with the highest median household income of $63,864 found in the 45 to 64 years age bracket for the primary householder. A total of 1,906 households (29.5%) fall into this category. Meanwhile, the 15 to 24 years age bracket for the primary householder has the lowest median household income of $18,892, with 467 households (7.2%) in this group.
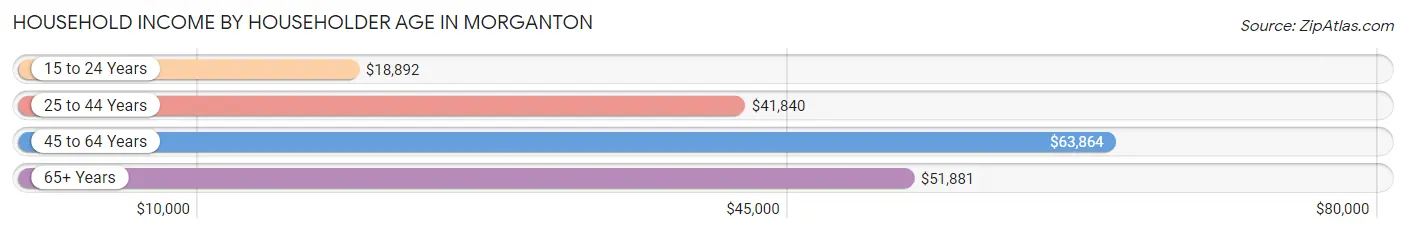
| Income Bracket | # Households | Median Income |
| 15 to 24 Years | 467 (7.2%) | $18,892 |
| 25 to 44 Years | 1,817 (28.1%) | $41,840 |
| 45 to 64 Years | 1,906 (29.5%) | $63,864 |
| 65+ Years | 2,279 (35.2%) | $51,881 |
| Total | 6,469 (100.0%) | $47,715 |
Poverty in Morganton
Income Below Poverty by Sex and Age in Morganton
With 27.7% poverty level for males and 28.3% for females among the residents of Morganton, 15 year old males and 12 to 14 year old females are the most vulnerable to poverty, with 50 males (68.5%) and 141 females (59.0%) in their respective age groups living below the poverty level.
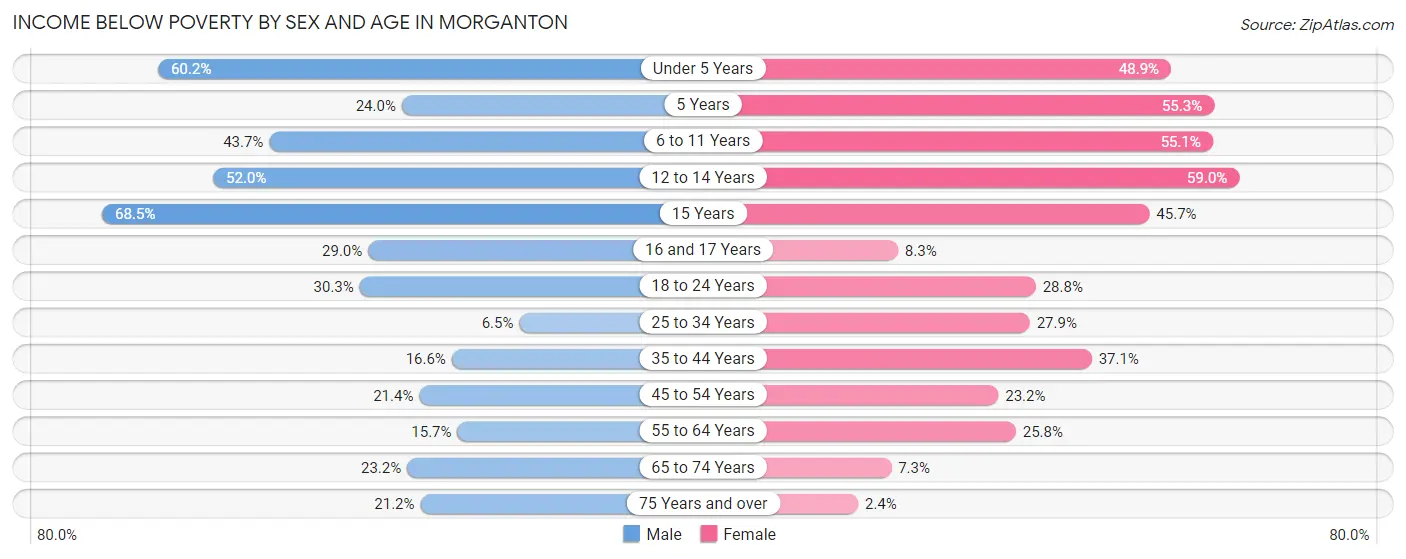
| Age Bracket | Male | Female |
| Under 5 Years | 375 (60.2%) | 345 (48.9%) |
| 5 Years | 12 (24.0%) | 63 (55.3%) |
| 6 to 11 Years | 304 (43.7%) | 375 (55.1%) |
| 12 to 14 Years | 259 (52.0%) | 141 (59.0%) |
| 15 Years | 50 (68.5%) | 74 (45.7%) |
| 16 and 17 Years | 60 (29.0%) | 8 (8.3%) |
| 18 to 24 Years | 350 (30.2%) | 178 (28.8%) |
| 25 to 34 Years | 63 (6.5%) | 340 (27.9%) |
| 35 to 44 Years | 123 (16.6%) | 344 (37.1%) |
| 45 to 54 Years | 177 (21.4%) | 224 (23.2%) |
| 55 to 64 Years | 113 (15.7%) | 260 (25.8%) |
| 65 to 74 Years | 182 (23.2%) | 86 (7.3%) |
| 75 Years and over | 117 (21.2%) | 19 (2.4%) |
| Total | 2,185 (27.7%) | 2,457 (28.3%) |
Income Above Poverty by Sex and Age in Morganton
According to the poverty statistics in Morganton, males aged 25 to 34 years and females aged 75 years and over are the age groups that are most secure financially, with 93.5% of males and 97.6% of females in these age groups living above the poverty line.
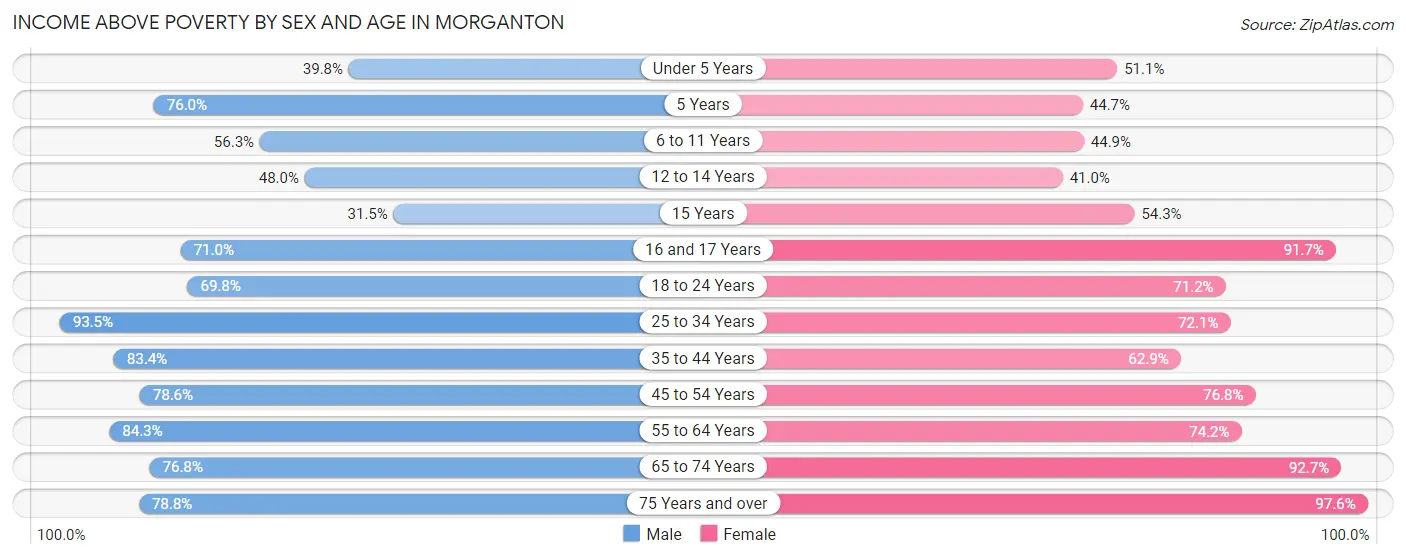
| Age Bracket | Male | Female |
| Under 5 Years | 248 (39.8%) | 361 (51.1%) |
| 5 Years | 38 (76.0%) | 51 (44.7%) |
| 6 to 11 Years | 392 (56.3%) | 306 (44.9%) |
| 12 to 14 Years | 239 (48.0%) | 98 (41.0%) |
| 15 Years | 23 (31.5%) | 88 (54.3%) |
| 16 and 17 Years | 147 (71.0%) | 88 (91.7%) |
| 18 to 24 Years | 807 (69.8%) | 440 (71.2%) |
| 25 to 34 Years | 900 (93.5%) | 878 (72.1%) |
| 35 to 44 Years | 619 (83.4%) | 583 (62.9%) |
| 45 to 54 Years | 650 (78.6%) | 740 (76.8%) |
| 55 to 64 Years | 605 (84.3%) | 746 (74.2%) |
| 65 to 74 Years | 602 (76.8%) | 1,085 (92.7%) |
| 75 Years and over | 434 (78.8%) | 770 (97.6%) |
| Total | 5,704 (72.3%) | 6,234 (71.7%) |
Income Below Poverty Among Married-Couple Families in Morganton
The poverty statistics for married-couple families in Morganton show that 5.3% or 118 of the total 2,226 families live below the poverty line. Families with 3 or 4 children have the highest poverty rate of 27.2%, comprising of 66 families. On the other hand, families with 5 or more children have the lowest poverty rate of 0.0%, which includes 0 families.
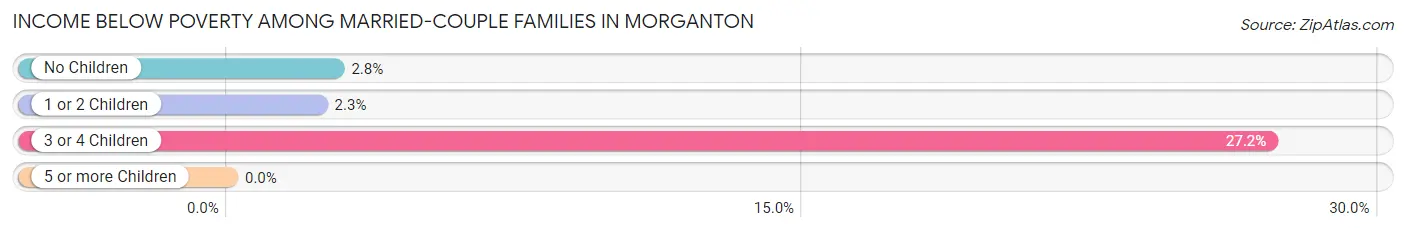
| Children | Above Poverty | Below Poverty |
| No Children | 1,293 (97.2%) | 37 (2.8%) |
| 1 or 2 Children | 627 (97.7%) | 15 (2.3%) |
| 3 or 4 Children | 177 (72.8%) | 66 (27.2%) |
| 5 or more Children | 11 (100.0%) | 0 (0.0%) |
| Total | 2,108 (94.7%) | 118 (5.3%) |
Income Below Poverty Among Single-Parent Households in Morganton
According to the poverty data in Morganton, 45.0% or 289 single-father households and 44.0% or 602 single-mother households are living below the poverty line. Among single-father households, those with 3 or 4 children have the highest poverty rate, with 87 households (100.0%) experiencing poverty. Likewise, among single-mother households, those with 5 or more children have the highest poverty rate, with 52 households (100.0%) falling below the poverty line.
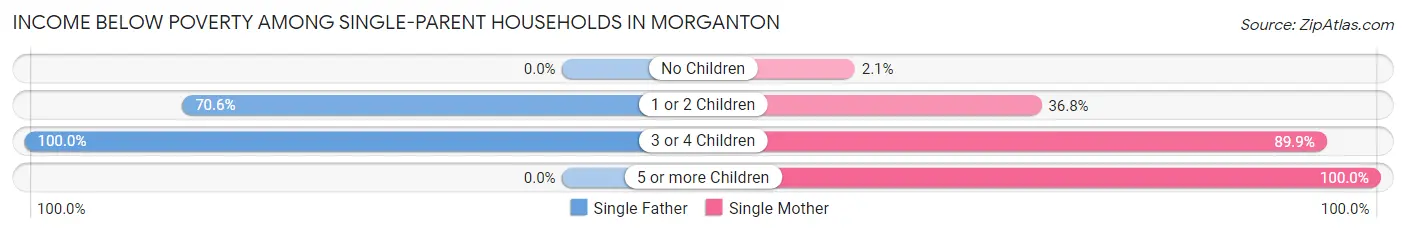
| Children | Single Father | Single Mother |
| No Children | 0 (0.0%) | 9 (2.1%) |
| 1 or 2 Children | 202 (70.6%) | 175 (36.8%) |
| 3 or 4 Children | 87 (100.0%) | 366 (89.9%) |
| 5 or more Children | 0 (0.0%) | 52 (100.0%) |
| Total | 289 (45.0%) | 602 (44.0%) |
Income Below Poverty Among Married-Couple vs Single-Parent Households in Morganton
The poverty data for Morganton shows that 118 of the married-couple family households (5.3%) and 891 of the single-parent households (44.3%) are living below the poverty level. Within the married-couple family households, those with 3 or 4 children have the highest poverty rate, with 66 households (27.2%) falling below the poverty line. Among the single-parent households, those with 5 or more children have the highest poverty rate, with 52 household (100.0%) living below poverty.
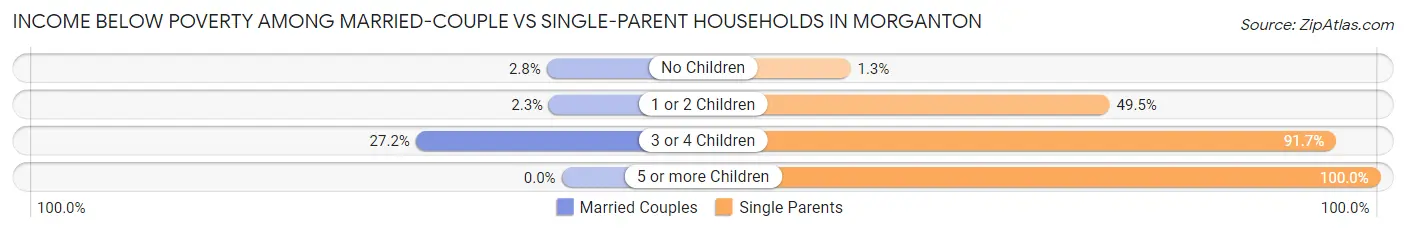
| Children | Married-Couple Families | Single-Parent Households |
| No Children | 37 (2.8%) | 9 (1.3%) |
| 1 or 2 Children | 15 (2.3%) | 377 (49.5%) |
| 3 or 4 Children | 66 (27.2%) | 453 (91.7%) |
| 5 or more Children | 0 (0.0%) | 52 (100.0%) |
| Total | 118 (5.3%) | 891 (44.3%) |
Race in Morganton
The most populous races in Morganton are White / Caucasian (11,323 | 64.9%), Hispanic or Latino (3,527 | 20.2%), and Black / African American (2,358 | 13.5%).
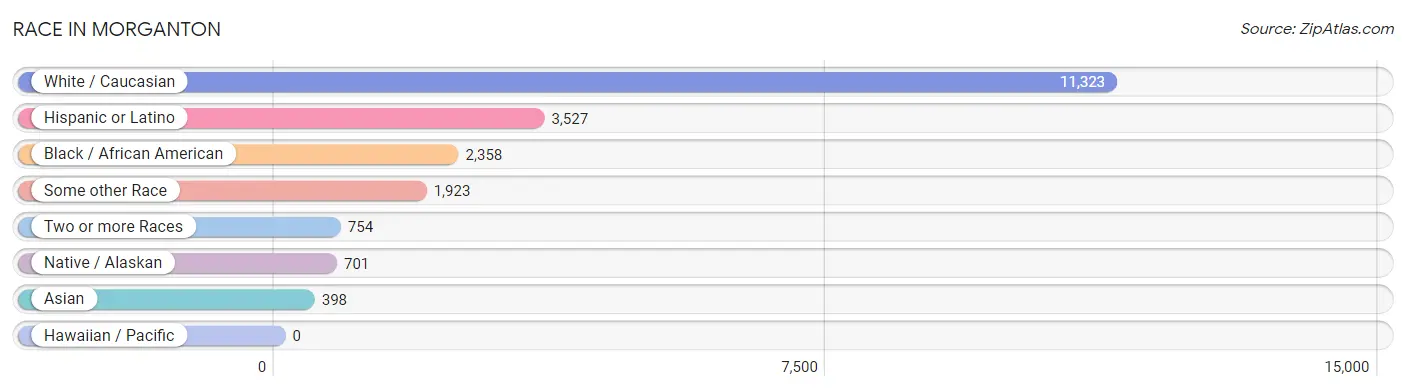
| Race | # Population | % Population |
| Asian | 398 | 2.3% |
| Black / African American | 2,358 | 13.5% |
| Hawaiian / Pacific | 0 | 0.0% |
| Hispanic or Latino | 3,527 | 20.2% |
| Native / Alaskan | 701 | 4.0% |
| White / Caucasian | 11,323 | 64.9% |
| Two or more Races | 754 | 4.3% |
| Some other Race | 1,923 | 11.0% |
| Total | 17,457 | 100.0% |
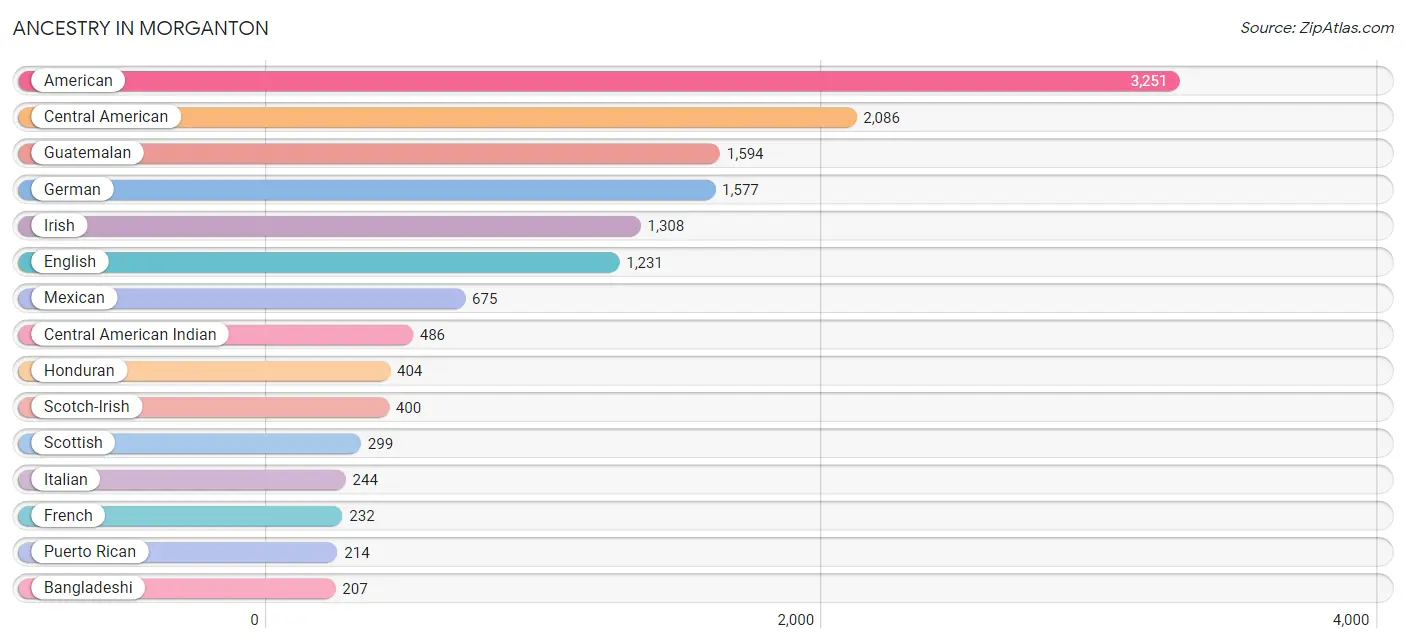
Ancestry in Morganton
The most populous ancestries reported in Morganton are American (3,251 | 18.6%), Central American (2,086 | 11.9%), Guatemalan (1,594 | 9.1%), German (1,577 | 9.0%), and Irish (1,308 | 7.5%), together accounting for 56.2% of all Morganton residents.
| Ancestry | # Population | % Population |
| African | 148 | 0.9% |
| American | 3,251 | 18.6% |
| Austrian | 11 | 0.1% |
| Bangladeshi | 207 | 1.2% |
| Blackfeet | 8 | 0.1% |
| British | 21 | 0.1% |
| Canadian | 20 | 0.1% |
| Celtic | 15 | 0.1% |
| Central American | 2,086 | 11.9% |
| Central American Indian | 486 | 2.8% |
| Cherokee | 58 | 0.3% |
| Cuban | 88 | 0.5% |
| Czech | 13 | 0.1% |
| Czechoslovakian | 10 | 0.1% |
| Danish | 17 | 0.1% |
| Dutch | 76 | 0.4% |
| English | 1,231 | 7.0% |
| Ethiopian | 6 | 0.0% |
| European | 96 | 0.5% |
| Finnish | 12 | 0.1% |
| French | 232 | 1.3% |
| French American Indian | 5 | 0.0% |
| French Canadian | 40 | 0.2% |
| German | 1,577 | 9.0% |
| Greek | 11 | 0.1% |
| Guatemalan | 1,594 | 9.1% |
| Haitian | 36 | 0.2% |
| Honduran | 404 | 2.3% |
| Hungarian | 11 | 0.1% |
| Indian (Asian) | 30 | 0.2% |
| Irish | 1,308 | 7.5% |
| Italian | 244 | 1.4% |
| Korean | 82 | 0.5% |
| Latvian | 5 | 0.0% |
| Lithuanian | 8 | 0.1% |
| Luxembourger | 5 | 0.0% |
| Malaysian | 38 | 0.2% |
| Mexican | 675 | 3.9% |
| Norwegian | 22 | 0.1% |
| Pakistani | 7 | 0.0% |
| Pennsylvania German | 9 | 0.1% |
| Polish | 140 | 0.8% |
| Puerto Rican | 214 | 1.2% |
| Romanian | 6 | 0.0% |
| Russian | 36 | 0.2% |
| Salvadoran | 34 | 0.2% |
| Scandinavian | 11 | 0.1% |
| Scotch-Irish | 400 | 2.3% |
| Scottish | 299 | 1.7% |
| Sri Lankan | 3 | 0.0% |
| Subsaharan African | 154 | 0.9% |
| Swedish | 69 | 0.4% |
| Swiss | 13 | 0.1% |
| Thai | 81 | 0.5% |
| Welsh | 56 | 0.3% | View All 55 Rows |
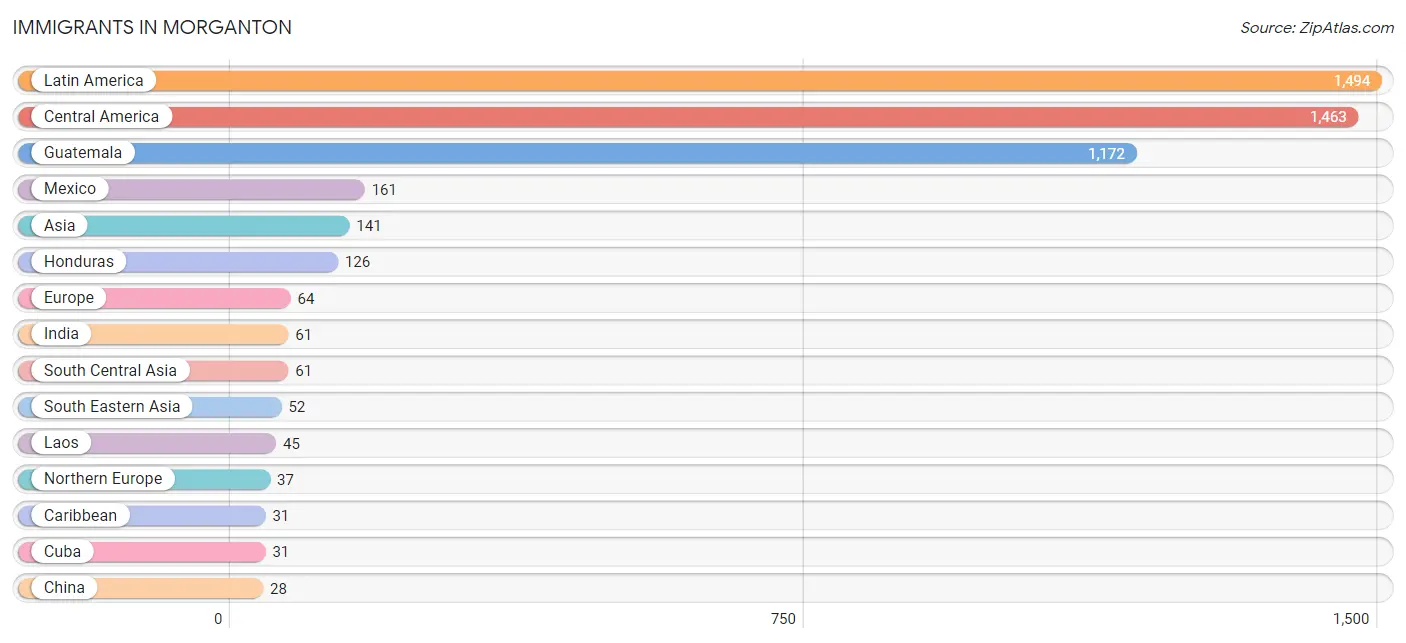
Immigrants in Morganton
The most numerous immigrant groups reported in Morganton came from Latin America (1,494 | 8.6%), Central America (1,463 | 8.4%), Guatemala (1,172 | 6.7%), Mexico (161 | 0.9%), and Asia (141 | 0.8%), together accounting for 25.4% of all Morganton residents.
| Immigration Origin | # Population | % Population |
| Africa | 3 | 0.0% |
| Asia | 141 | 0.8% |
| Australia | 9 | 0.1% |
| Canada | 20 | 0.1% |
| Caribbean | 31 | 0.2% |
| Central America | 1,463 | 8.4% |
| China | 28 | 0.2% |
| Cuba | 31 | 0.2% |
| Eastern Africa | 3 | 0.0% |
| Eastern Asia | 28 | 0.2% |
| Eastern Europe | 13 | 0.1% |
| El Salvador | 4 | 0.0% |
| England | 15 | 0.1% |
| Ethiopia | 3 | 0.0% |
| Europe | 64 | 0.4% |
| Germany | 3 | 0.0% |
| Greece | 3 | 0.0% |
| Guatemala | 1,172 | 6.7% |
| Honduras | 126 | 0.7% |
| Hong Kong | 28 | 0.2% |
| India | 61 | 0.4% |
| Ireland | 13 | 0.1% |
| Laos | 45 | 0.3% |
| Latin America | 1,494 | 8.6% |
| Mexico | 161 | 0.9% |
| Northern Europe | 37 | 0.2% |
| Oceania | 9 | 0.1% |
| Russia | 13 | 0.1% |
| Scotland | 9 | 0.1% |
| South Central Asia | 61 | 0.4% |
| South Eastern Asia | 52 | 0.3% |
| Southern Europe | 3 | 0.0% |
| Switzerland | 8 | 0.1% |
| Thailand | 7 | 0.0% |
| Western Europe | 11 | 0.1% | View All 35 Rows |
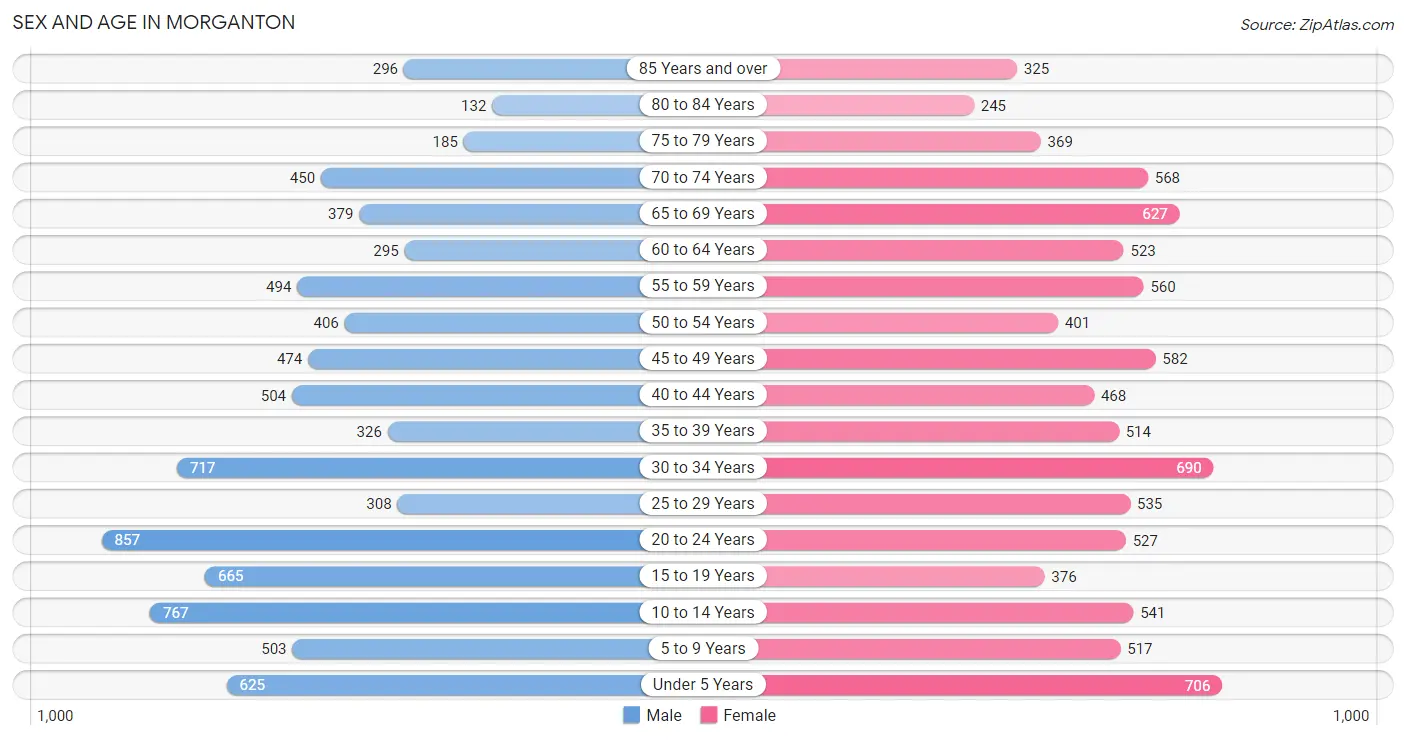
Sex and Age in Morganton
Sex and Age in Morganton
The most populous age groups in Morganton are 20 to 24 Years (857 | 10.2%) for men and Under 5 Years (706 | 7.8%) for women.
| Age Bracket | Male | Female |
| Under 5 Years | 625 (7.5%) | 706 (7.8%) |
| 5 to 9 Years | 503 (6.0%) | 517 (5.7%) |
| 10 to 14 Years | 767 (9.1%) | 541 (6.0%) |
| 15 to 19 Years | 665 (7.9%) | 376 (4.1%) |
| 20 to 24 Years | 857 (10.2%) | 527 (5.8%) |
| 25 to 29 Years | 308 (3.7%) | 535 (5.9%) |
| 30 to 34 Years | 717 (8.6%) | 690 (7.6%) |
| 35 to 39 Years | 326 (3.9%) | 514 (5.7%) |
| 40 to 44 Years | 504 (6.0%) | 468 (5.2%) |
| 45 to 49 Years | 474 (5.7%) | 582 (6.4%) |
| 50 to 54 Years | 406 (4.8%) | 401 (4.4%) |
| 55 to 59 Years | 494 (5.9%) | 560 (6.2%) |
| 60 to 64 Years | 295 (3.5%) | 523 (5.8%) |
| 65 to 69 Years | 379 (4.5%) | 627 (6.9%) |
| 70 to 74 Years | 450 (5.4%) | 568 (6.3%) |
| 75 to 79 Years | 185 (2.2%) | 369 (4.1%) |
| 80 to 84 Years | 132 (1.6%) | 245 (2.7%) |
| 85 Years and over | 296 (3.5%) | 325 (3.6%) |
| Total | 8,383 (100.0%) | 9,074 (100.0%) |
Families and Households in Morganton
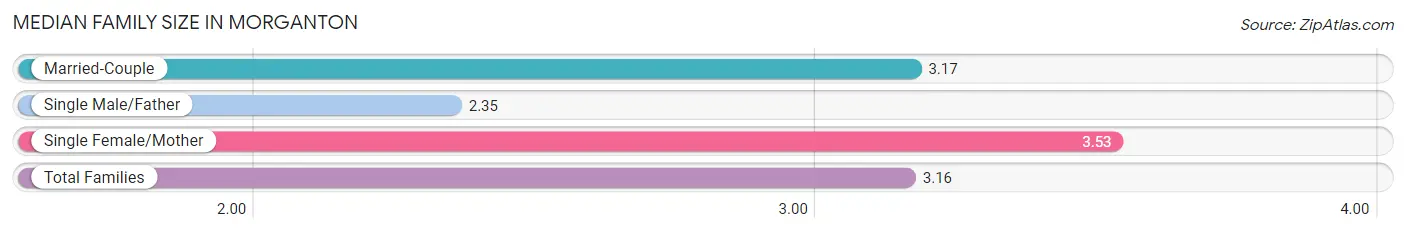
Median Family Size in Morganton
The median family size in Morganton is 3.16 persons per family, with single female/mother families (1,368 | 32.3%) accounting for the largest median family size of 3.53 persons per family. On the other hand, single male/father families (642 | 15.2%) represent the smallest median family size with 2.35 persons per family.
| Family Type | # Families | Family Size |
| Married-Couple | 2,226 (52.5%) | 3.17 |
| Single Male/Father | 642 (15.2%) | 2.35 |
| Single Female/Mother | 1,368 (32.3%) | 3.53 |
| Total Families | 4,236 (100.0%) | 3.16 |
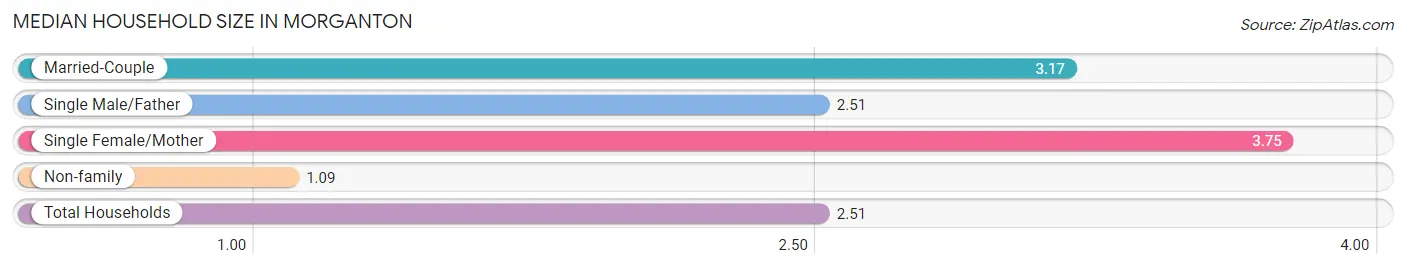
Median Household Size in Morganton
The median household size in Morganton is 2.51 persons per household, with single female/mother households (1,368 | 21.1%) accounting for the largest median household size of 3.75 persons per household. non-family households (2,233 | 34.5%) represent the smallest median household size with 1.09 persons per household.
| Household Type | # Households | Household Size |
| Married-Couple | 2,226 (34.4%) | 3.17 |
| Single Male/Father | 642 (9.9%) | 2.51 |
| Single Female/Mother | 1,368 (21.1%) | 3.75 |
| Non-family | 2,233 (34.5%) | 1.09 |
| Total Households | 6,469 (100.0%) | 2.51 |
Household Size by Marriage Status in Morganton
Out of a total of 6,469 households in Morganton, 4,236 (65.5%) are family households, while 2,233 (34.5%) are nonfamily households. The most numerous type of family households are 2-person households, comprising 2,078, and the most common type of nonfamily households are 1-person households, comprising 2,080.
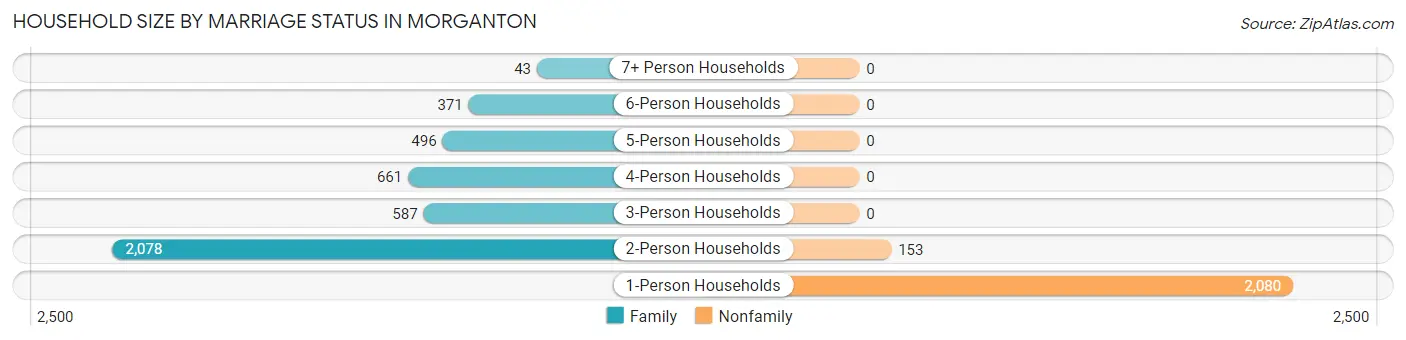
| Household Size | Family Households | Nonfamily Households |
| 1-Person Households | - | 2,080 (32.2%) |
| 2-Person Households | 2,078 (32.1%) | 153 (2.4%) |
| 3-Person Households | 587 (9.1%) | 0 (0.0%) |
| 4-Person Households | 661 (10.2%) | 0 (0.0%) |
| 5-Person Households | 496 (7.7%) | 0 (0.0%) |
| 6-Person Households | 371 (5.7%) | 0 (0.0%) |
| 7+ Person Households | 43 (0.7%) | 0 (0.0%) |
| Total | 4,236 (65.5%) | 2,233 (34.5%) |
Female Fertility in Morganton
Fertility by Age in Morganton
Average fertility rate in Morganton is 71.0 births per 1,000 women. Women in the age bracket of 35 to 50 years have the highest fertility rate with 101.0 births per 1,000 women. Women in the age bracket of 35 to 50 years acount for 62.9% of all women with births.
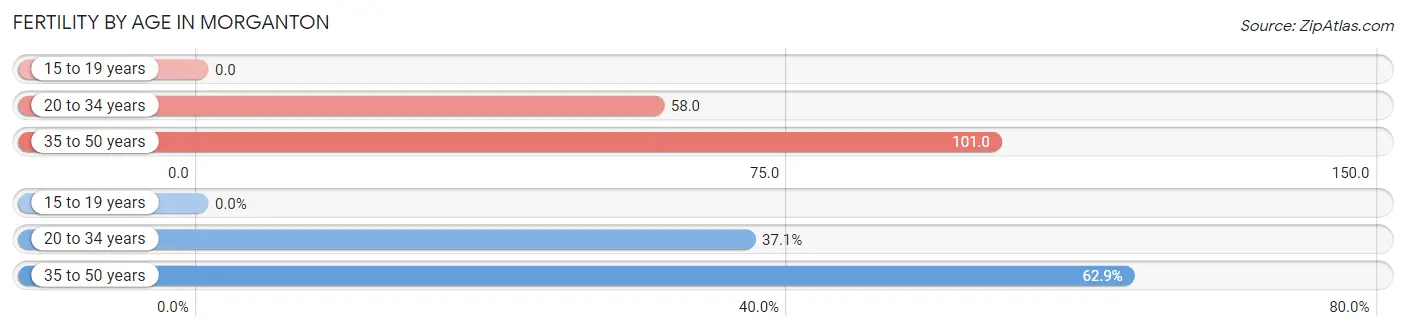
| Age Bracket | Women with Births | Births / 1,000 Women |
| 15 to 19 years | 0 (0.0%) | 0.0 |
| 20 to 34 years | 101 (37.1%) | 58.0 |
| 35 to 50 years | 171 (62.9%) | 101.0 |
| Total | 272 (100.0%) | 71.0 |
Fertility by Age by Marriage Status in Morganton
37.5% of women with births (272) in Morganton are married. The highest percentage of unmarried women with births falls into 35 to 50 years age bracket with 69.6% of them unmarried at the time of birth, while the lowest percentage of unmarried women with births belong to 20 to 34 years age bracket with 50.5% of them unmarried.
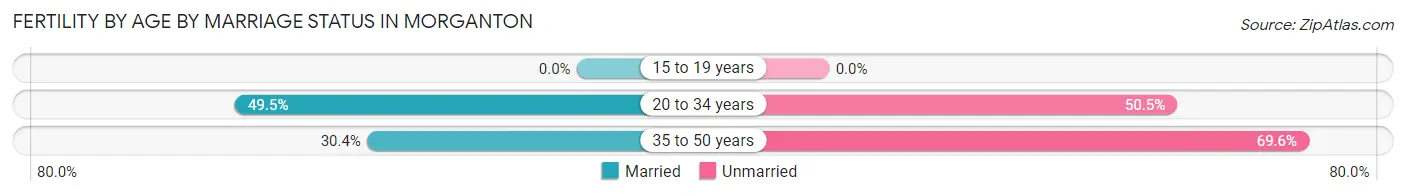
| Age Bracket | Married | Unmarried |
| 15 to 19 years | 0 (0.0%) | 0 (0.0%) |
| 20 to 34 years | 50 (49.5%) | 51 (50.5%) |
| 35 to 50 years | 52 (30.4%) | 119 (69.6%) |
| Total | 102 (37.5%) | 170 (62.5%) |
Fertility by Education in Morganton
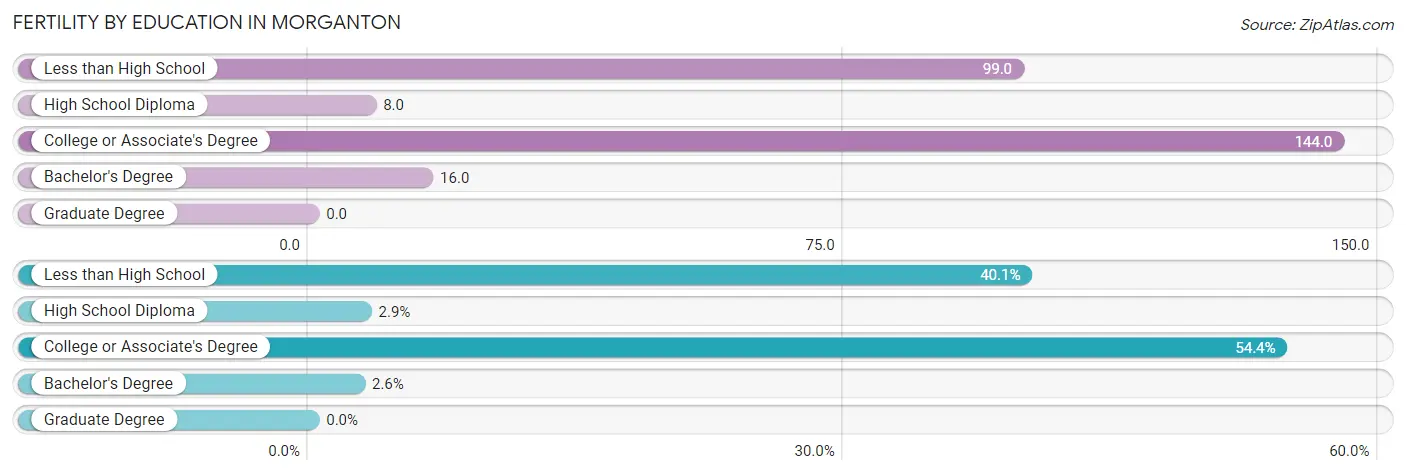
| Educational Attainment | Women with Births | Births / 1,000 Women |
| Less than High School | 109 (40.1%) | 99.0 |
| High School Diploma | 8 (2.9%) | 8.0 |
| College or Associate's Degree | 148 (54.4%) | 144.0 |
| Bachelor's Degree | 7 (2.6%) | 16.0 |
| Graduate Degree | 0 (0.0%) | 0.0 |
| Total | 272 (100.0%) | 71.0 |
Fertility by Education by Marriage Status in Morganton
62.5% of women with births in Morganton are unmarried. Women with the educational attainment of bachelor's degree are most likely to be married with 100.0% of them married at childbirth, while women with the educational attainment of high school diploma are least likely to be married with 100.0% of them unmarried at childbirth.
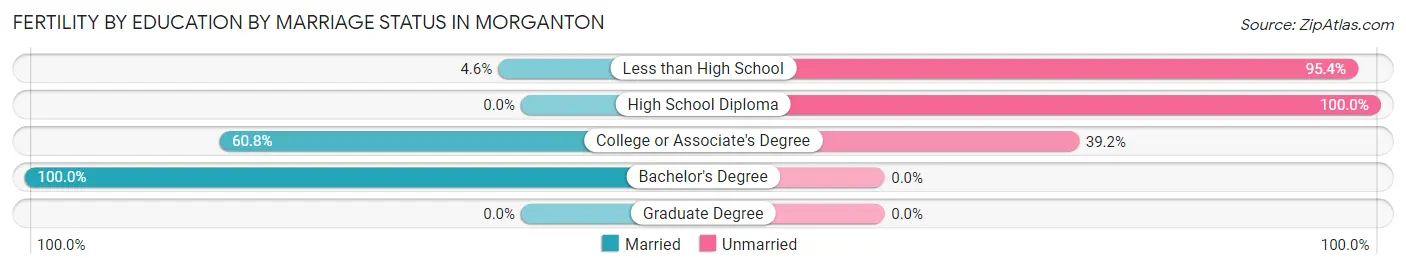
| Educational Attainment | Married | Unmarried |
| Less than High School | 5 (4.6%) | 104 (95.4%) |
| High School Diploma | 0 (0.0%) | 8 (100.0%) |
| College or Associate's Degree | 90 (60.8%) | 58 (39.2%) |
| Bachelor's Degree | 7 (100.0%) | 0 (0.0%) |
| Graduate Degree | 0 (0.0%) | 0 (0.0%) |
| Total | 102 (37.5%) | 170 (62.5%) |
Employment Characteristics in Morganton
Employment by Class of Employer in Morganton
Among the 6,999 employed individuals in Morganton, private company employees (4,848 | 69.3%), state government employees (536 | 7.7%), and not-for-profit organizations (513 | 7.3%) make up the most common classes of employment.
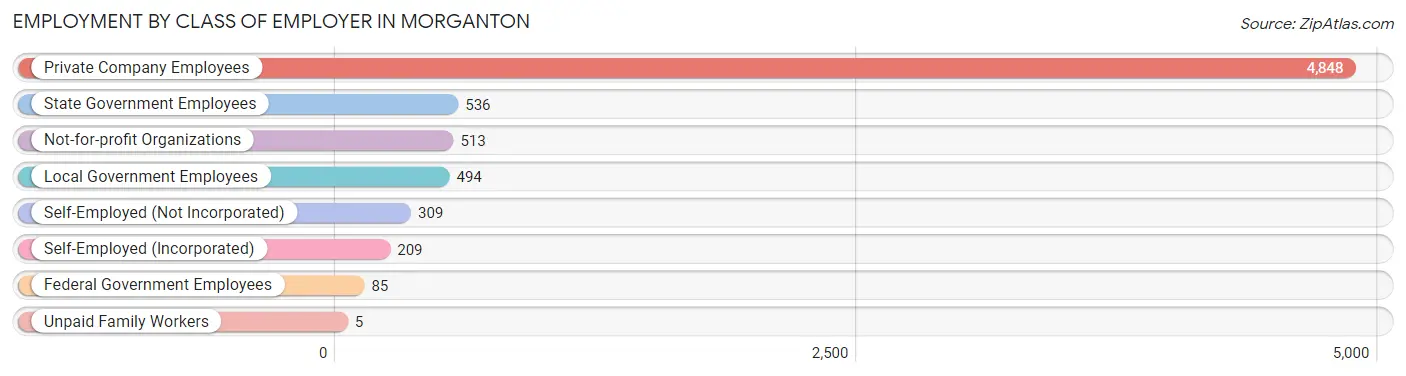
| Employer Class | # Employees | % Employees |
| Private Company Employees | 4,848 | 69.3% |
| Self-Employed (Incorporated) | 209 | 3.0% |
| Self-Employed (Not Incorporated) | 309 | 4.4% |
| Not-for-profit Organizations | 513 | 7.3% |
| Local Government Employees | 494 | 7.1% |
| State Government Employees | 536 | 7.7% |
| Federal Government Employees | 85 | 1.2% |
| Unpaid Family Workers | 5 | 0.1% |
| Total | 6,999 | 100.0% |
Employment Status by Age in Morganton
According to the labor force statistics for Morganton, out of the total population over 16 years of age (13,546), 55.3% or 7,491 individuals are in the labor force, with 5.4% or 405 of them unemployed. The age group with the highest labor force participation rate is 30 to 34 years, with 90.8% or 1,278 individuals in the labor force. Within the labor force, the 16 to 19 years age range has the highest percentage of unemployed individuals, with 18.1% or 66 of them being unemployed.
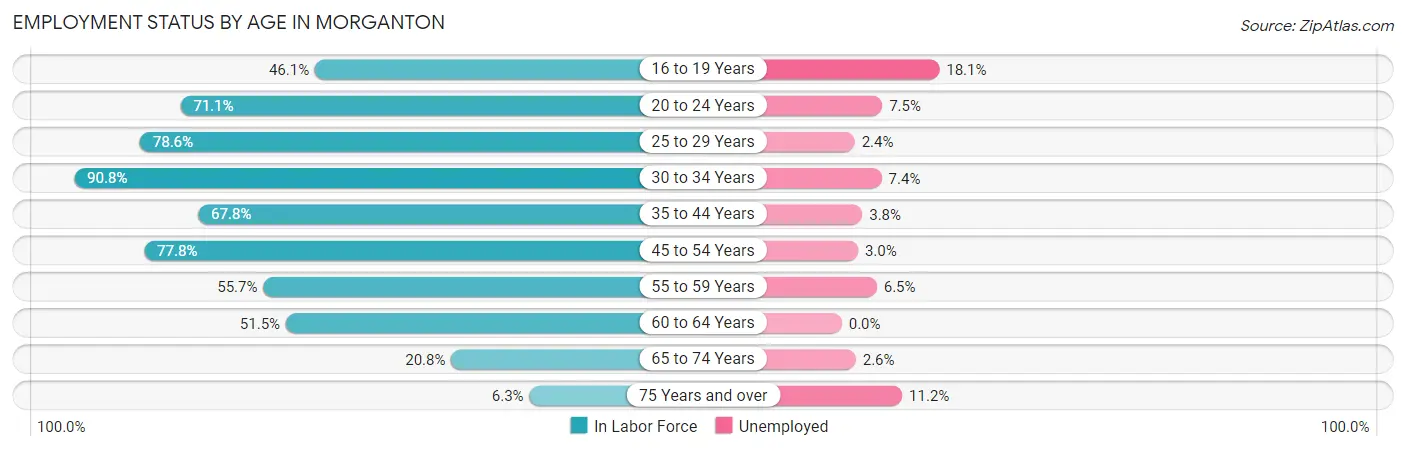
| Age Bracket | In Labor Force | Unemployed |
| 16 to 19 Years | 364 (46.1%) | 66 (18.1%) |
| 20 to 24 Years | 984 (71.1%) | 74 (7.5%) |
| 25 to 29 Years | 663 (78.6%) | 16 (2.4%) |
| 30 to 34 Years | 1,278 (90.8%) | 95 (7.4%) |
| 35 to 44 Years | 1,229 (67.8%) | 47 (3.8%) |
| 45 to 54 Years | 1,449 (77.8%) | 43 (3.0%) |
| 55 to 59 Years | 587 (55.7%) | 38 (6.5%) |
| 60 to 64 Years | 421 (51.5%) | 0 (0.0%) |
| 65 to 74 Years | 421 (20.8%) | 11 (2.6%) |
| 75 Years and over | 98 (6.3%) | 11 (11.2%) |
| Total | 7,491 (55.3%) | 405 (5.4%) |
Employment Status by Educational Attainment in Morganton
According to labor force statistics for Morganton, 72.1% of individuals (5,622) out of the total population between 25 and 64 years of age (7,797) are in the labor force, with 4.2% or 236 of them being unemployed. The group with the highest labor force participation rate are those with the educational attainment of bachelor's degree or higher, with 89.1% or 1,477 individuals in the labor force. Within the labor force, individuals with less than high school education have the highest percentage of unemployment, with 9.5% or 90 of them being unemployed.
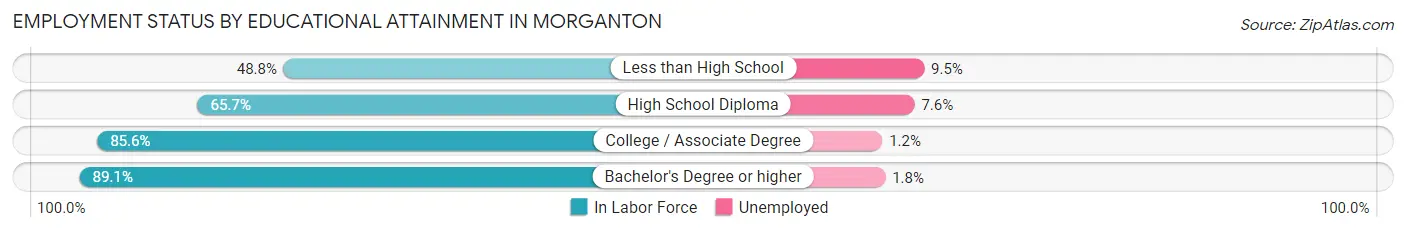
| Educational Attainment | In Labor Force | Unemployed |
| Less than High School | 946 (48.8%) | 184 (9.5%) |
| High School Diploma | 1,297 (65.7%) | 150 (7.6%) |
| College / Associate Degree | 1,905 (85.6%) | 27 (1.2%) |
| Bachelor's Degree or higher | 1,477 (89.1%) | 30 (1.8%) |
| Total | 5,622 (72.1%) | 327 (4.2%) |
Employment Occupations by Sex in Morganton
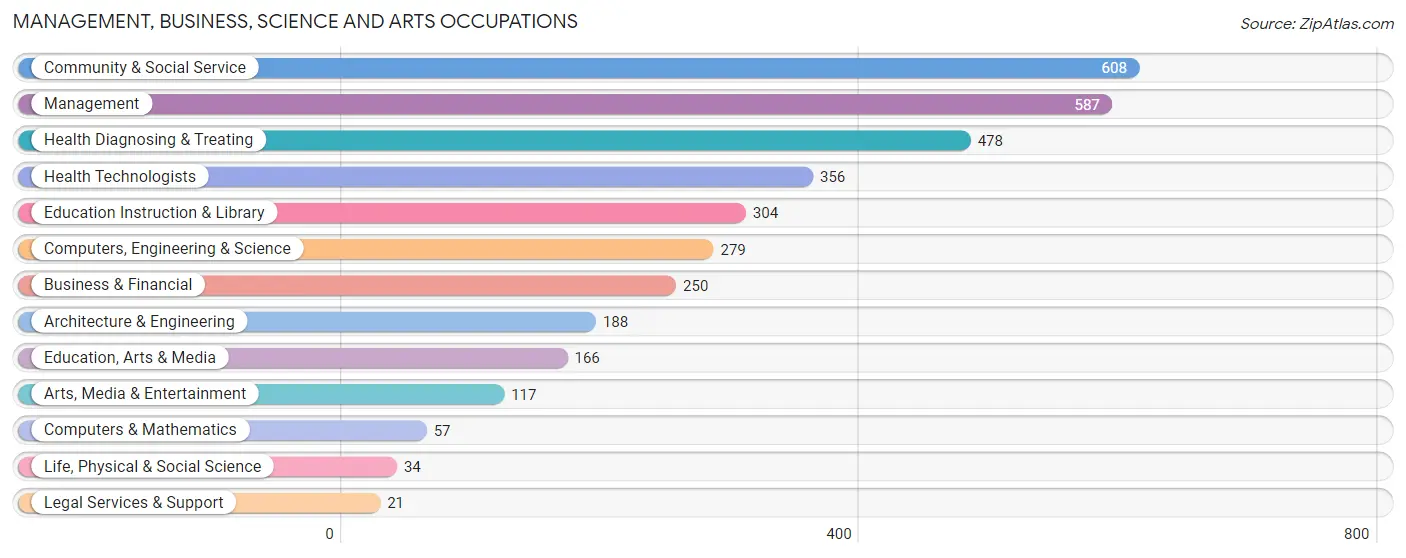
Management, Business, Science and Arts Occupations
The most common Management, Business, Science and Arts occupations in Morganton are Community & Social Service (608 | 8.6%), Management (587 | 8.3%), Health Diagnosing & Treating (478 | 6.7%), Health Technologists (356 | 5.0%), and Education Instruction & Library (304 | 4.3%).
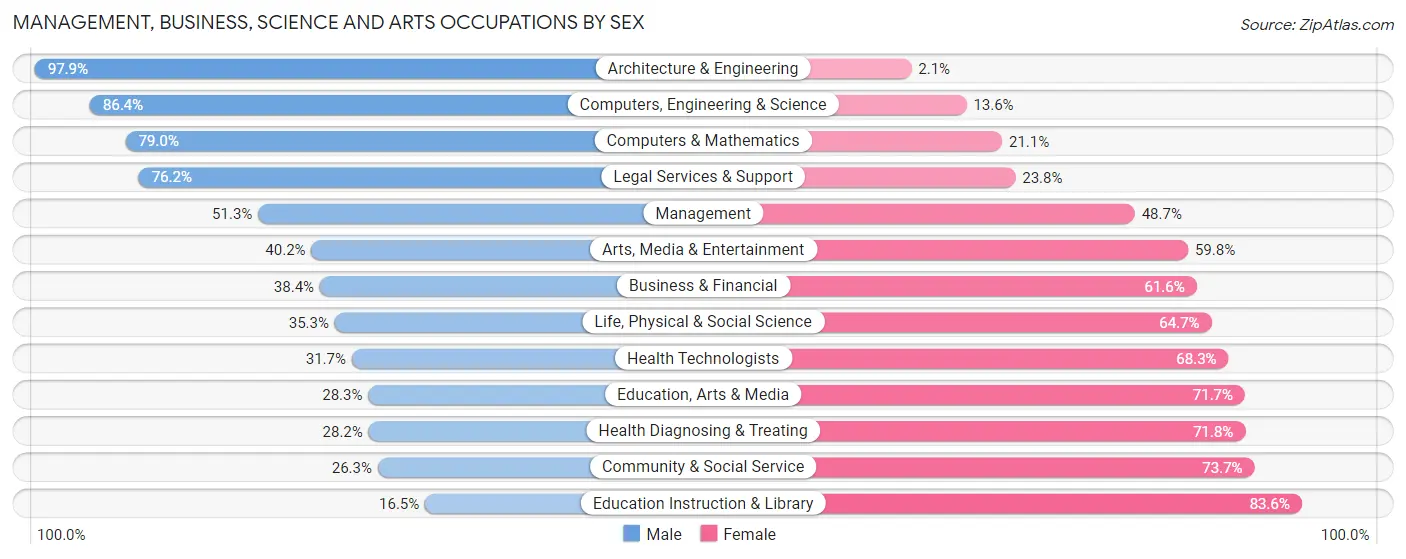
Management, Business, Science and Arts Occupations by Sex
Within the Management, Business, Science and Arts occupations in Morganton, the most male-oriented occupations are Architecture & Engineering (97.9%), Computers, Engineering & Science (86.4%), and Computers & Mathematics (78.9%), while the most female-oriented occupations are Education Instruction & Library (83.6%), Community & Social Service (73.7%), and Health Diagnosing & Treating (71.8%).
| Occupation | Male | Female |
| Management | 301 (51.3%) | 286 (48.7%) |
| Business & Financial | 96 (38.4%) | 154 (61.6%) |
| Computers, Engineering & Science | 241 (86.4%) | 38 (13.6%) |
| Computers & Mathematics | 45 (78.9%) | 12 (21.0%) |
| Architecture & Engineering | 184 (97.9%) | 4 (2.1%) |
| Life, Physical & Social Science | 12 (35.3%) | 22 (64.7%) |
| Community & Social Service | 160 (26.3%) | 448 (73.7%) |
| Education, Arts & Media | 47 (28.3%) | 119 (71.7%) |
| Legal Services & Support | 16 (76.2%) | 5 (23.8%) |
| Education Instruction & Library | 50 (16.5%) | 254 (83.6%) |
| Arts, Media & Entertainment | 47 (40.2%) | 70 (59.8%) |
| Health Diagnosing & Treating | 135 (28.2%) | 343 (71.8%) |
| Health Technologists | 113 (31.7%) | 243 (68.3%) |
| Total (Category) | 933 (42.4%) | 1,269 (57.6%) |
| Total (Overall) | 3,565 (50.3%) | 3,526 (49.7%) |
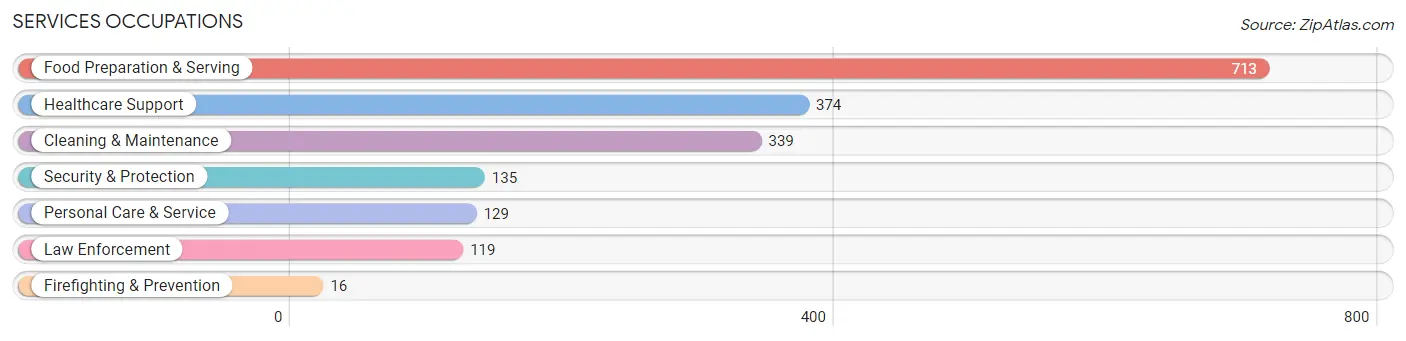
Services Occupations
The most common Services occupations in Morganton are Food Preparation & Serving (713 | 10.1%), Healthcare Support (374 | 5.3%), Cleaning & Maintenance (339 | 4.8%), Security & Protection (135 | 1.9%), and Personal Care & Service (129 | 1.8%).
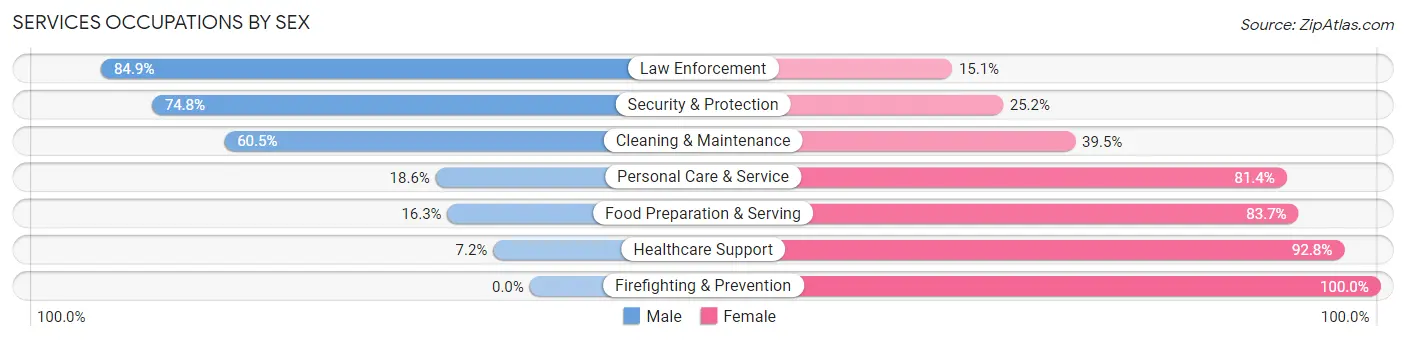
Services Occupations by Sex
Within the Services occupations in Morganton, the most male-oriented occupations are Law Enforcement (84.9%), Security & Protection (74.8%), and Cleaning & Maintenance (60.5%), while the most female-oriented occupations are Firefighting & Prevention (100.0%), Healthcare Support (92.8%), and Food Preparation & Serving (83.7%).
| Occupation | Male | Female |
| Healthcare Support | 27 (7.2%) | 347 (92.8%) |
| Security & Protection | 101 (74.8%) | 34 (25.2%) |
| Firefighting & Prevention | 0 (0.0%) | 16 (100.0%) |
| Law Enforcement | 101 (84.9%) | 18 (15.1%) |
| Food Preparation & Serving | 116 (16.3%) | 597 (83.7%) |
| Cleaning & Maintenance | 205 (60.5%) | 134 (39.5%) |
| Personal Care & Service | 24 (18.6%) | 105 (81.4%) |
| Total (Category) | 473 (28.0%) | 1,217 (72.0%) |
| Total (Overall) | 3,565 (50.3%) | 3,526 (49.7%) |
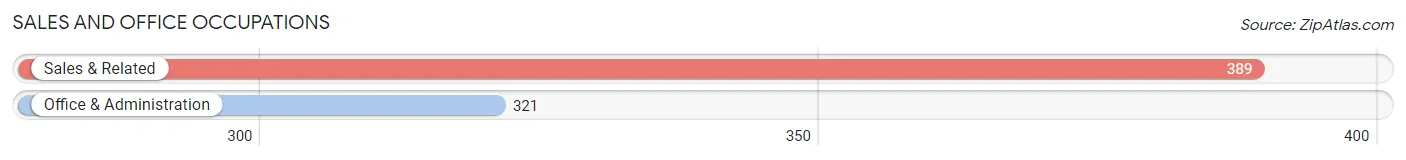
Sales and Office Occupations
The most common Sales and Office occupations in Morganton are Sales & Related (389 | 5.5%), and Office & Administration (321 | 4.5%).
Sales and Office Occupations by Sex
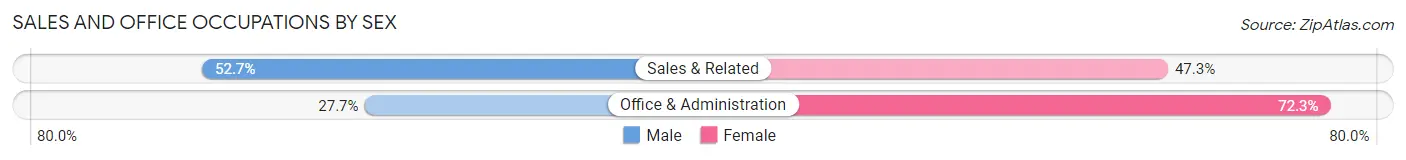
| Occupation | Male | Female |
| Sales & Related | 205 (52.7%) | 184 (47.3%) |
| Office & Administration | 89 (27.7%) | 232 (72.3%) |
| Total (Category) | 294 (41.4%) | 416 (58.6%) |
| Total (Overall) | 3,565 (50.3%) | 3,526 (49.7%) |
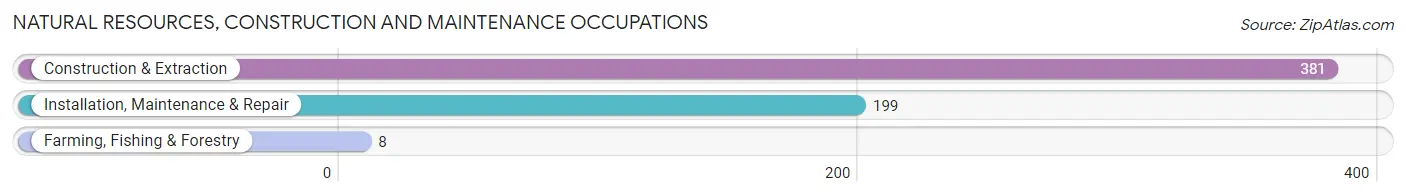
Natural Resources, Construction and Maintenance Occupations
The most common Natural Resources, Construction and Maintenance occupations in Morganton are Construction & Extraction (381 | 5.4%), Installation, Maintenance & Repair (199 | 2.8%), and Farming, Fishing & Forestry (8 | 0.1%).
Natural Resources, Construction and Maintenance Occupations by Sex
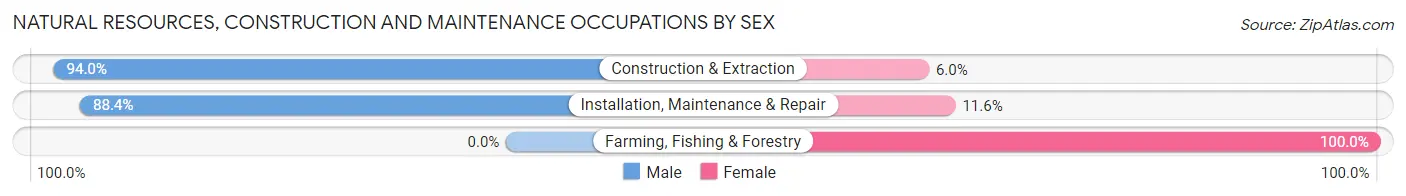
| Occupation | Male | Female |
| Farming, Fishing & Forestry | 0 (0.0%) | 8 (100.0%) |
| Construction & Extraction | 358 (94.0%) | 23 (6.0%) |
| Installation, Maintenance & Repair | 176 (88.4%) | 23 (11.6%) |
| Total (Category) | 534 (90.8%) | 54 (9.2%) |
| Total (Overall) | 3,565 (50.3%) | 3,526 (49.7%) |
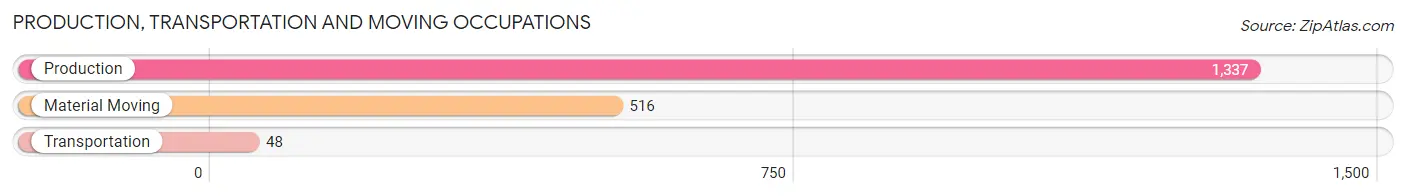
Production, Transportation and Moving Occupations
The most common Production, Transportation and Moving occupations in Morganton are Production (1,337 | 18.9%), Material Moving (516 | 7.3%), and Transportation (48 | 0.7%).
Production, Transportation and Moving Occupations by Sex
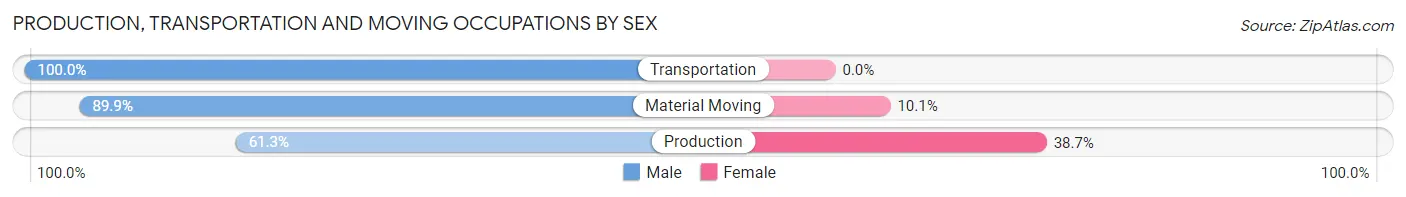
| Occupation | Male | Female |
| Production | 819 (61.3%) | 518 (38.7%) |
| Transportation | 48 (100.0%) | 0 (0.0%) |
| Material Moving | 464 (89.9%) | 52 (10.1%) |
| Total (Category) | 1,331 (70.0%) | 570 (30.0%) |
| Total (Overall) | 3,565 (50.3%) | 3,526 (49.7%) |
Employment Industries by Sex in Morganton
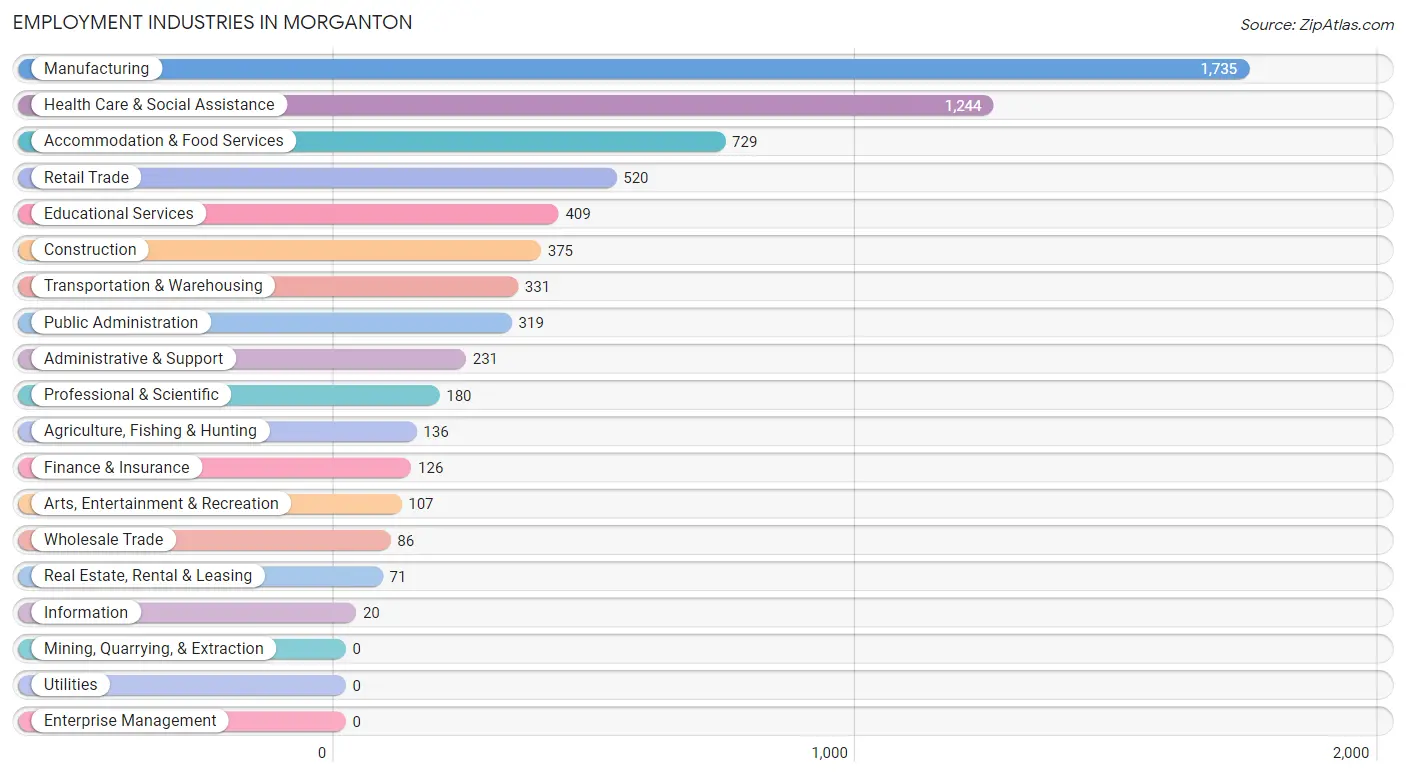
Employment Industries in Morganton
The major employment industries in Morganton include Manufacturing (1,735 | 24.5%), Health Care & Social Assistance (1,244 | 17.5%), Accommodation & Food Services (729 | 10.3%), Retail Trade (520 | 7.3%), and Educational Services (409 | 5.8%).
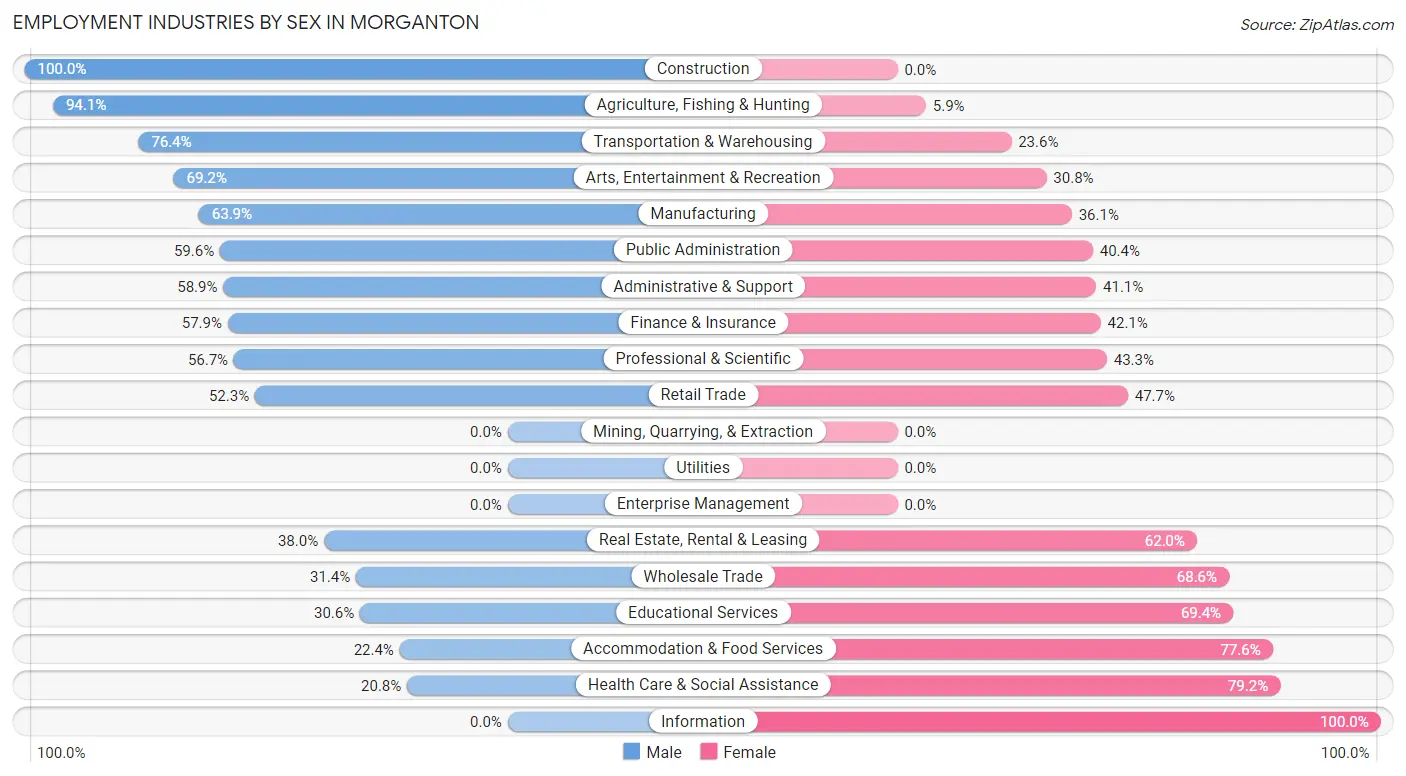
Employment Industries by Sex in Morganton
The Morganton industries that see more men than women are Construction (100.0%), Agriculture, Fishing & Hunting (94.1%), and Transportation & Warehousing (76.4%), whereas the industries that tend to have a higher number of women are Information (100.0%), Health Care & Social Assistance (79.2%), and Accommodation & Food Services (77.6%).
| Industry | Male | Female |
| Agriculture, Fishing & Hunting | 128 (94.1%) | 8 (5.9%) |
| Mining, Quarrying, & Extraction | 0 (0.0%) | 0 (0.0%) |
| Construction | 375 (100.0%) | 0 (0.0%) |
| Manufacturing | 1,109 (63.9%) | 626 (36.1%) |
| Wholesale Trade | 27 (31.4%) | 59 (68.6%) |
| Retail Trade | 272 (52.3%) | 248 (47.7%) |
| Transportation & Warehousing | 253 (76.4%) | 78 (23.6%) |
| Utilities | 0 (0.0%) | 0 (0.0%) |
| Information | 0 (0.0%) | 20 (100.0%) |
| Finance & Insurance | 73 (57.9%) | 53 (42.1%) |
| Real Estate, Rental & Leasing | 27 (38.0%) | 44 (62.0%) |
| Professional & Scientific | 102 (56.7%) | 78 (43.3%) |
| Enterprise Management | 0 (0.0%) | 0 (0.0%) |
| Administrative & Support | 136 (58.9%) | 95 (41.1%) |
| Educational Services | 125 (30.6%) | 284 (69.4%) |
| Health Care & Social Assistance | 259 (20.8%) | 985 (79.2%) |
| Arts, Entertainment & Recreation | 74 (69.2%) | 33 (30.8%) |
| Accommodation & Food Services | 163 (22.4%) | 566 (77.6%) |
| Public Administration | 190 (59.6%) | 129 (40.4%) |
| Total | 3,565 (50.3%) | 3,526 (49.7%) |
Education in Morganton
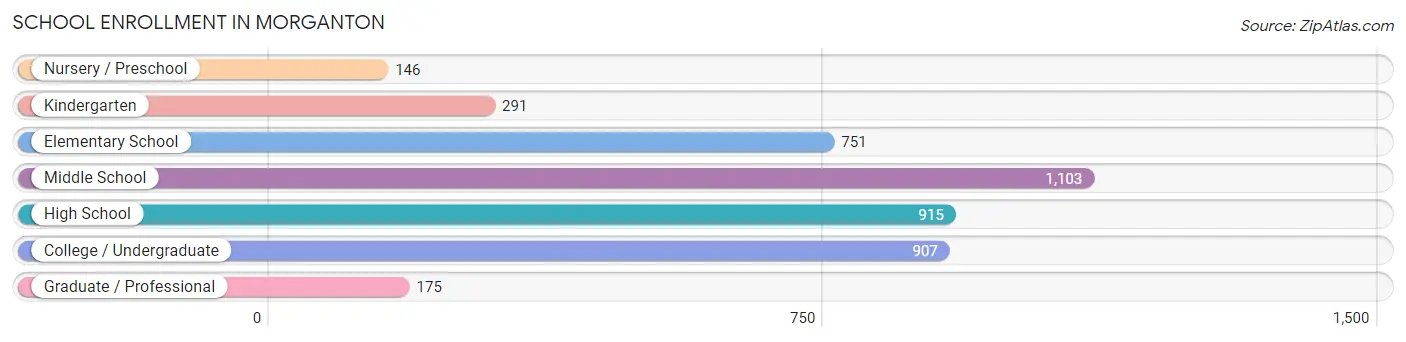
School Enrollment in Morganton
The most common levels of schooling among the 4,288 students in Morganton are middle school (1,103 | 25.7%), high school (915 | 21.3%), and college / undergraduate (907 | 21.1%).
| School Level | # Students | % Students |
| Nursery / Preschool | 146 | 3.4% |
| Kindergarten | 291 | 6.8% |
| Elementary School | 751 | 17.5% |
| Middle School | 1,103 | 25.7% |
| High School | 915 | 21.3% |
| College / Undergraduate | 907 | 21.1% |
| Graduate / Professional | 175 | 4.1% |
| Total | 4,288 | 100.0% |
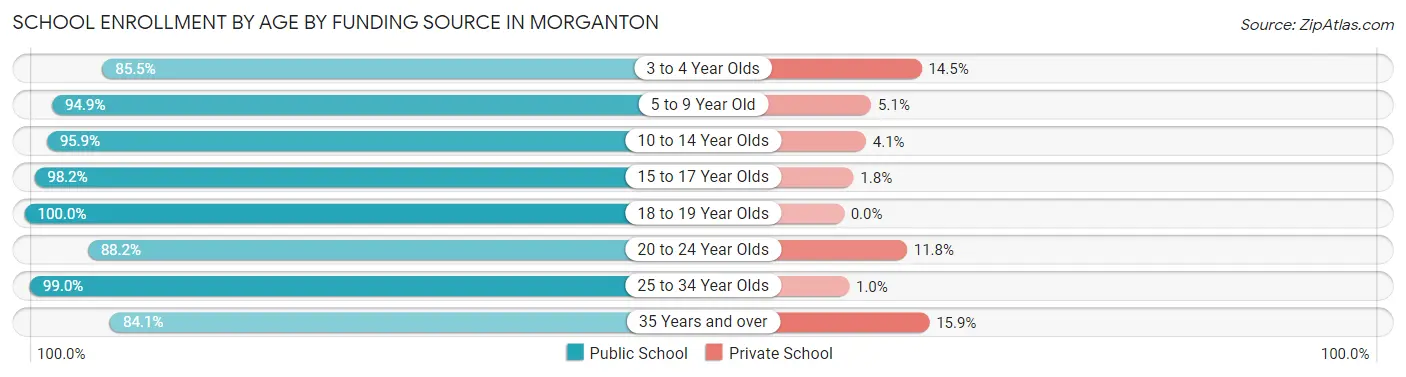
School Enrollment by Age by Funding Source in Morganton
Out of a total of 4,288 students who are enrolled in schools in Morganton, 236 (5.5%) attend a private institution, while the remaining 4,052 (94.5%) are enrolled in public schools. The age group of 35 years and over has the highest likelihood of being enrolled in private schools, with 43 (15.9% in the age bracket) enrolled. Conversely, the age group of 18 to 19 year olds has the lowest likelihood of being enrolled in a private school, with 248 (100.0% in the age bracket) attending a public institution.
| Age Bracket | Public School | Private School |
| 3 to 4 Year Olds | 118 (85.5%) | 20 (14.5%) |
| 5 to 9 Year Old | 945 (94.9%) | 51 (5.1%) |
| 10 to 14 Year Olds | 1,254 (95.9%) | 54 (4.1%) |
| 15 to 17 Year Olds | 542 (98.2%) | 10 (1.8%) |
| 18 to 19 Year Olds | 248 (100.0%) | 0 (0.0%) |
| 20 to 24 Year Olds | 420 (88.2%) | 56 (11.8%) |
| 25 to 34 Year Olds | 297 (99.0%) | 3 (1.0%) |
| 35 Years and over | 227 (84.1%) | 43 (15.9%) |
| Total | 4,052 (94.5%) | 236 (5.5%) |
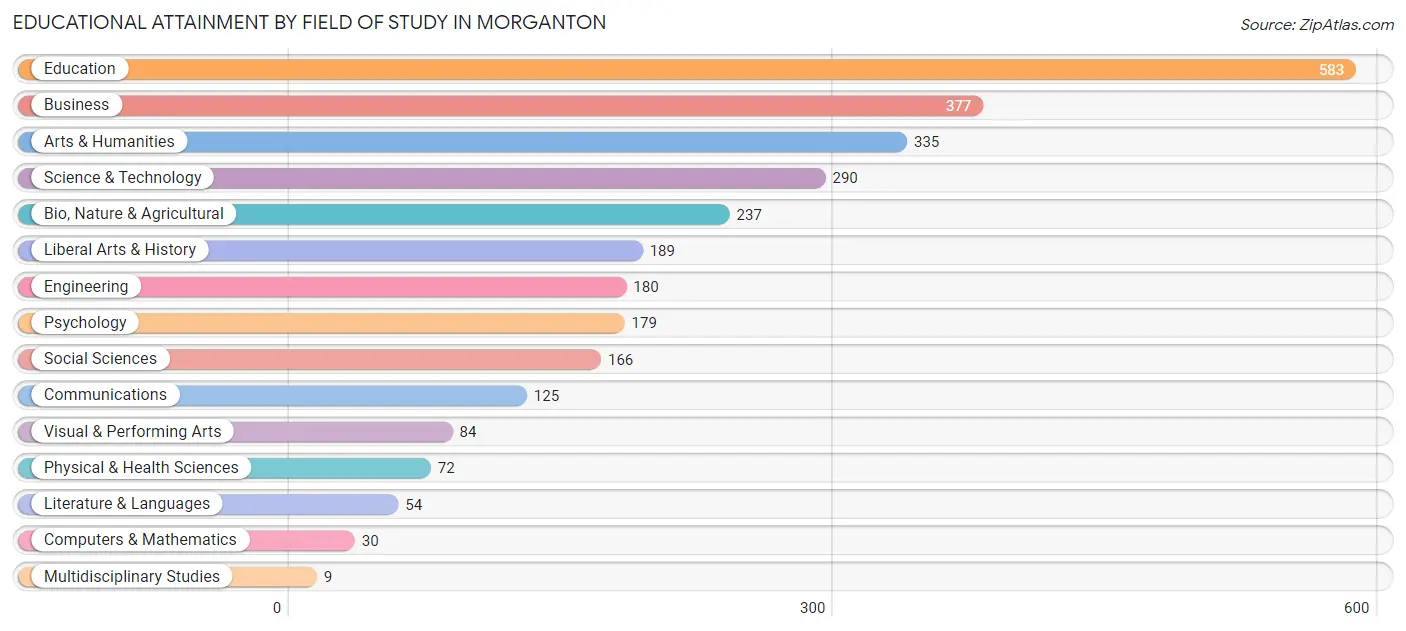
Educational Attainment by Field of Study in Morganton
Education (583 | 20.0%), business (377 | 13.0%), arts & humanities (335 | 11.5%), science & technology (290 | 10.0%), and bio, nature & agricultural (237 | 8.1%) are the most common fields of study among 2,910 individuals in Morganton who have obtained a bachelor's degree or higher.
| Field of Study | # Graduates | % Graduates |
| Computers & Mathematics | 30 | 1.0% |
| Bio, Nature & Agricultural | 237 | 8.1% |
| Physical & Health Sciences | 72 | 2.5% |
| Psychology | 179 | 6.1% |
| Social Sciences | 166 | 5.7% |
| Engineering | 180 | 6.2% |
| Multidisciplinary Studies | 9 | 0.3% |
| Science & Technology | 290 | 10.0% |
| Business | 377 | 13.0% |
| Education | 583 | 20.0% |
| Literature & Languages | 54 | 1.9% |
| Liberal Arts & History | 189 | 6.5% |
| Visual & Performing Arts | 84 | 2.9% |
| Communications | 125 | 4.3% |
| Arts & Humanities | 335 | 11.5% |
| Total | 2,910 | 100.0% |
Transportation & Commute in Morganton
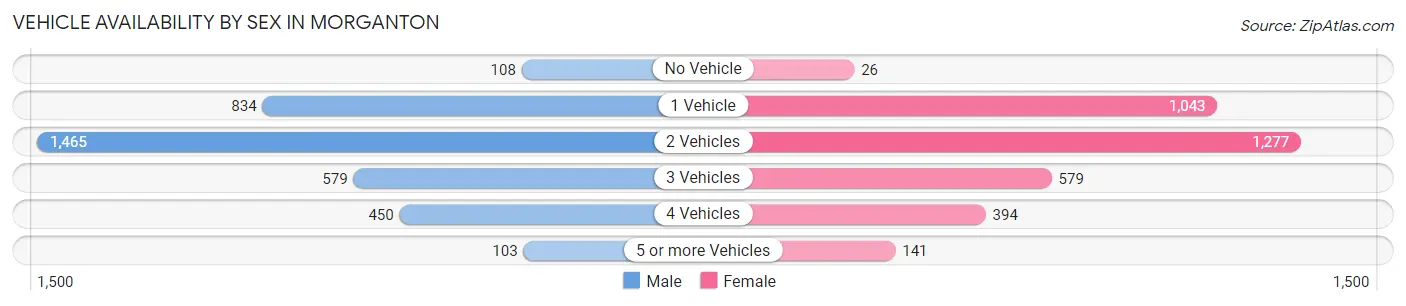
Vehicle Availability by Sex in Morganton
The most prevalent vehicle ownership categories in Morganton are males with 2 vehicles (1,465, accounting for 41.4%) and females with 2 vehicles (1,277, making up 42.3%).
| Vehicles Available | Male | Female |
| No Vehicle | 108 (3.0%) | 26 (0.7%) |
| 1 Vehicle | 834 (23.6%) | 1,043 (30.1%) |
| 2 Vehicles | 1,465 (41.4%) | 1,277 (36.9%) |
| 3 Vehicles | 579 (16.4%) | 579 (16.7%) |
| 4 Vehicles | 450 (12.7%) | 394 (11.4%) |
| 5 or more Vehicles | 103 (2.9%) | 141 (4.1%) |
| Total | 3,539 (100.0%) | 3,460 (100.0%) |
Commute Time in Morganton
The most frequently occuring commute durations in Morganton are 10 to 14 minutes (1,740 commuters, 26.3%), 5 to 9 minutes (980 commuters, 14.8%), and 15 to 19 minutes (906 commuters, 13.7%).
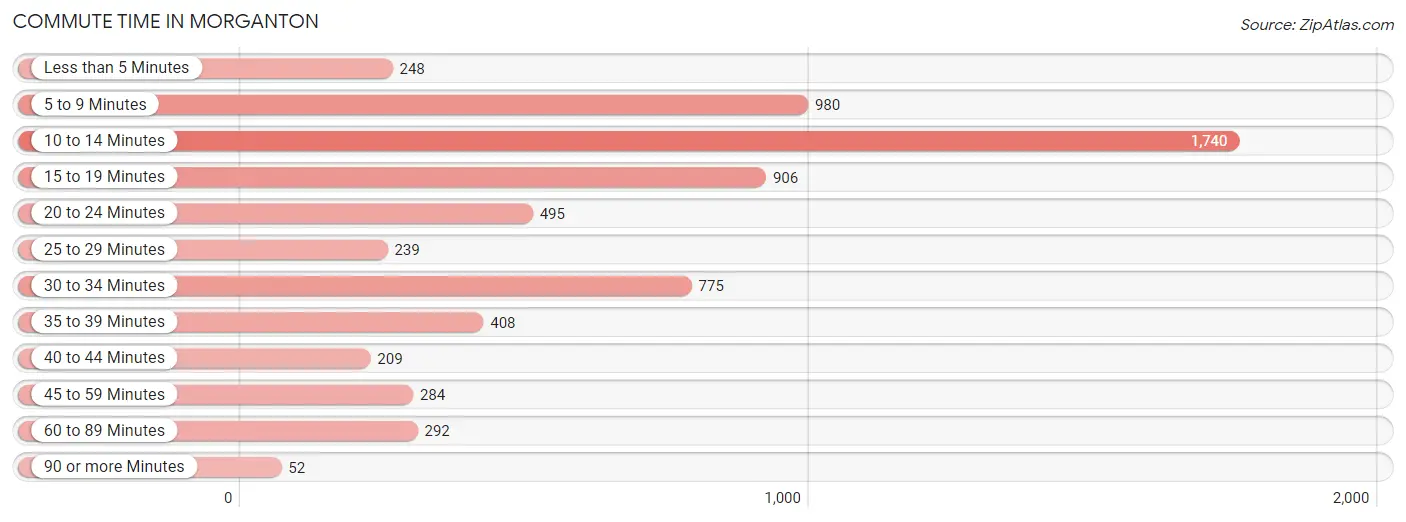
| Commute Time | # Commuters | % Commuters |
| Less than 5 Minutes | 248 | 3.7% |
| 5 to 9 Minutes | 980 | 14.8% |
| 10 to 14 Minutes | 1,740 | 26.3% |
| 15 to 19 Minutes | 906 | 13.7% |
| 20 to 24 Minutes | 495 | 7.5% |
| 25 to 29 Minutes | 239 | 3.6% |
| 30 to 34 Minutes | 775 | 11.7% |
| 35 to 39 Minutes | 408 | 6.2% |
| 40 to 44 Minutes | 209 | 3.2% |
| 45 to 59 Minutes | 284 | 4.3% |
| 60 to 89 Minutes | 292 | 4.4% |
| 90 or more Minutes | 52 | 0.8% |
Commute Time by Sex in Morganton
The most common commute times in Morganton are 10 to 14 minutes (660 commuters, 19.1%) for males and 10 to 14 minutes (1,080 commuters, 34.1%) for females.
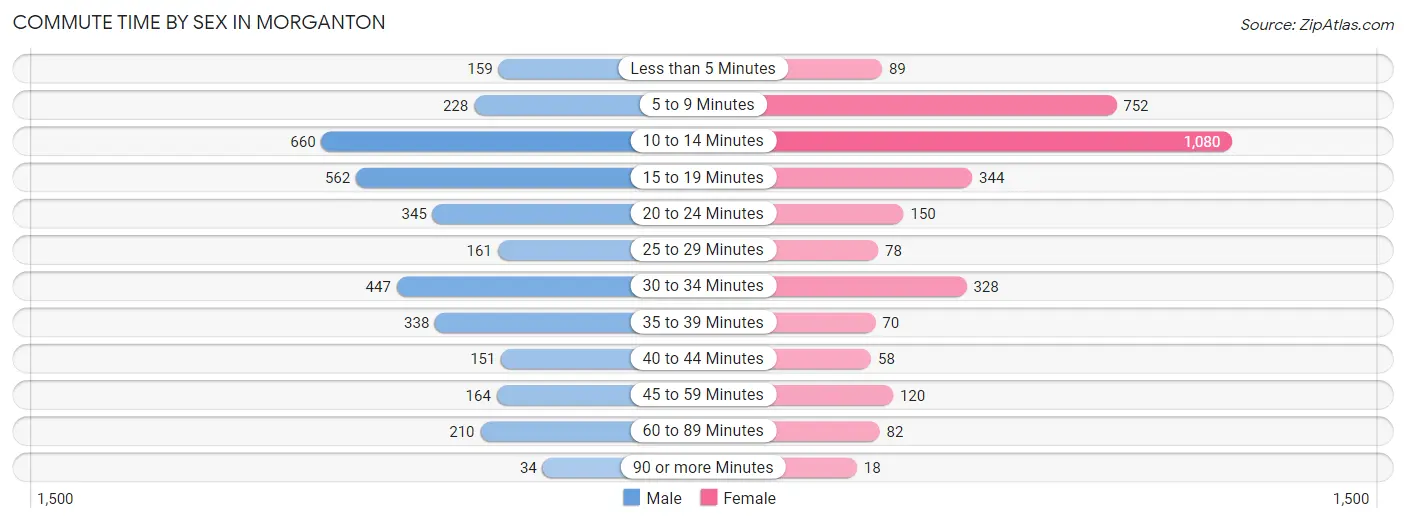
| Commute Time | Male | Female |
| Less than 5 Minutes | 159 (4.6%) | 89 (2.8%) |
| 5 to 9 Minutes | 228 (6.6%) | 752 (23.7%) |
| 10 to 14 Minutes | 660 (19.1%) | 1,080 (34.1%) |
| 15 to 19 Minutes | 562 (16.3%) | 344 (10.9%) |
| 20 to 24 Minutes | 345 (10.0%) | 150 (4.7%) |
| 25 to 29 Minutes | 161 (4.6%) | 78 (2.5%) |
| 30 to 34 Minutes | 447 (12.9%) | 328 (10.3%) |
| 35 to 39 Minutes | 338 (9.8%) | 70 (2.2%) |
| 40 to 44 Minutes | 151 (4.4%) | 58 (1.8%) |
| 45 to 59 Minutes | 164 (4.7%) | 120 (3.8%) |
| 60 to 89 Minutes | 210 (6.1%) | 82 (2.6%) |
| 90 or more Minutes | 34 (1.0%) | 18 (0.6%) |
Time of Departure to Work by Sex in Morganton
The most frequent times of departure to work in Morganton are 6:00 AM to 6:29 AM (483, 14.0%) for males and 7:00 AM to 7:29 AM (579, 18.3%) for females.
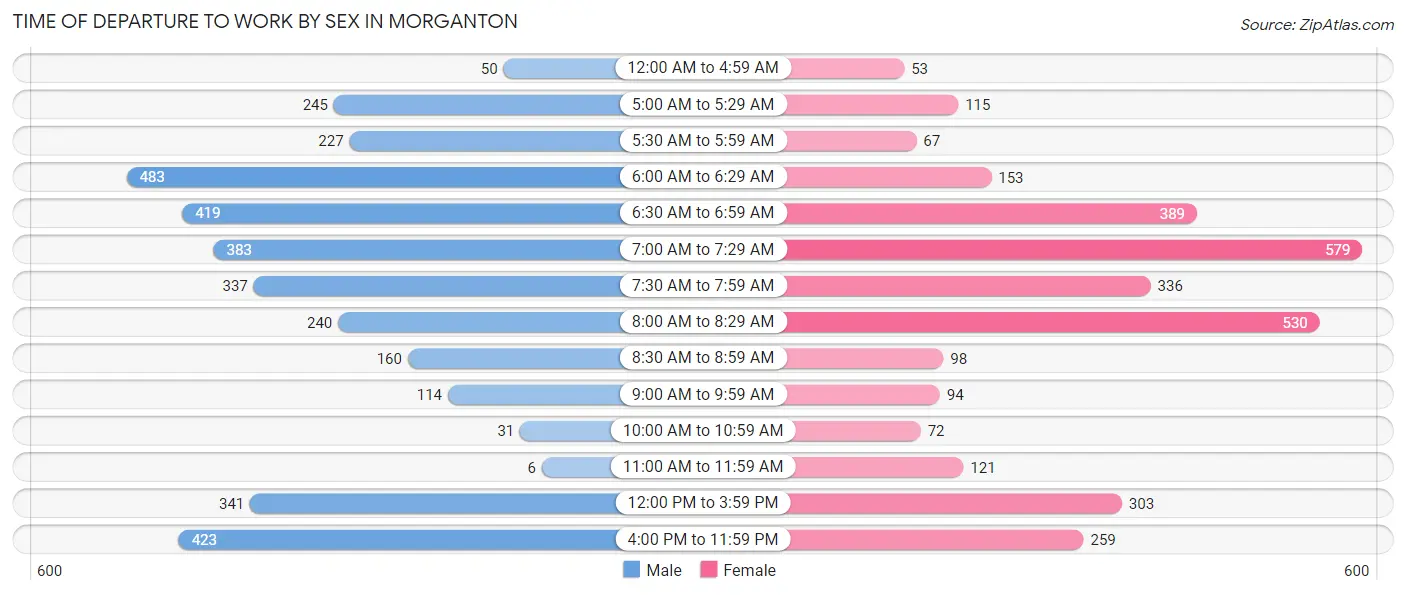
| Time of Departure | Male | Female |
| 12:00 AM to 4:59 AM | 50 (1.5%) | 53 (1.7%) |
| 5:00 AM to 5:29 AM | 245 (7.1%) | 115 (3.6%) |
| 5:30 AM to 5:59 AM | 227 (6.6%) | 67 (2.1%) |
| 6:00 AM to 6:29 AM | 483 (14.0%) | 153 (4.8%) |
| 6:30 AM to 6:59 AM | 419 (12.1%) | 389 (12.3%) |
| 7:00 AM to 7:29 AM | 383 (11.1%) | 579 (18.3%) |
| 7:30 AM to 7:59 AM | 337 (9.7%) | 336 (10.6%) |
| 8:00 AM to 8:29 AM | 240 (6.9%) | 530 (16.7%) |
| 8:30 AM to 8:59 AM | 160 (4.6%) | 98 (3.1%) |
| 9:00 AM to 9:59 AM | 114 (3.3%) | 94 (3.0%) |
| 10:00 AM to 10:59 AM | 31 (0.9%) | 72 (2.3%) |
| 11:00 AM to 11:59 AM | 6 (0.2%) | 121 (3.8%) |
| 12:00 PM to 3:59 PM | 341 (9.9%) | 303 (9.6%) |
| 4:00 PM to 11:59 PM | 423 (12.2%) | 259 (8.2%) |
| Total | 3,459 (100.0%) | 3,169 (100.0%) |
Housing Occupancy in Morganton
Occupancy by Ownership in Morganton
Of the total 6,469 dwellings in Morganton, owner-occupied units account for 3,341 (51.6%), while renter-occupied units make up 3,128 (48.3%).
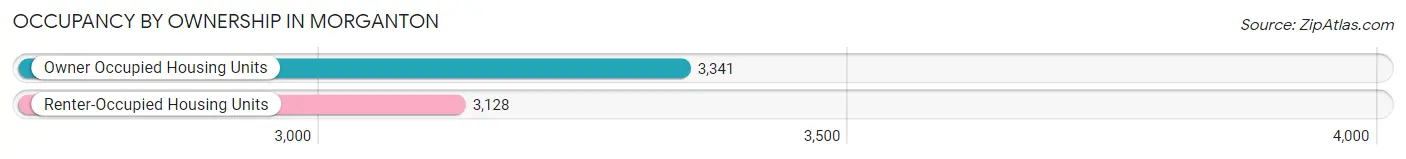
| Occupancy | # Housing Units | % Housing Units |
| Owner Occupied Housing Units | 3,341 | 51.6% |
| Renter-Occupied Housing Units | 3,128 | 48.3% |
| Total Occupied Housing Units | 6,469 | 100.0% |
Occupancy by Household Size in Morganton
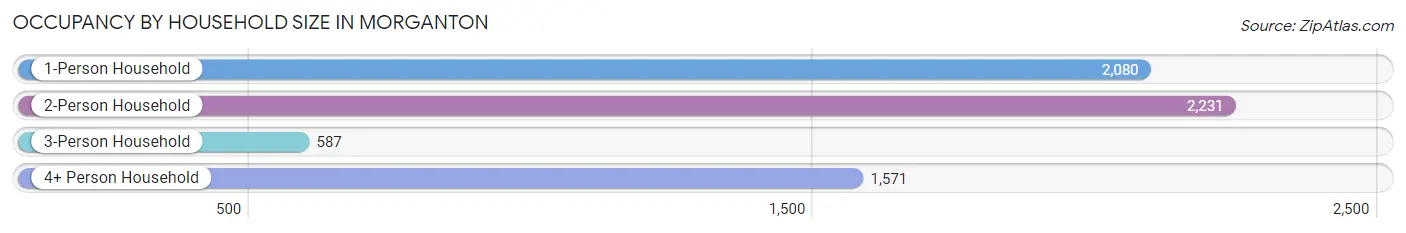
| Household Size | # Housing Units | % Housing Units |
| 1-Person Household | 2,080 | 32.2% |
| 2-Person Household | 2,231 | 34.5% |
| 3-Person Household | 587 | 9.1% |
| 4+ Person Household | 1,571 | 24.3% |
| Total Housing Units | 6,469 | 100.0% |
Occupancy by Ownership by Household Size in Morganton
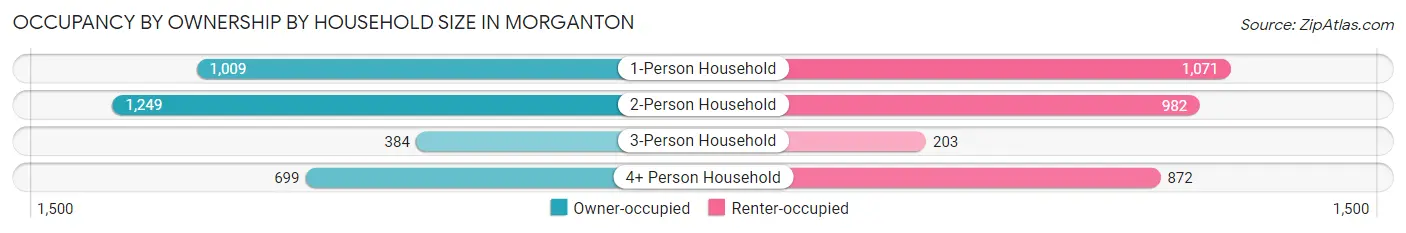
| Household Size | Owner-occupied | Renter-occupied |
| 1-Person Household | 1,009 (48.5%) | 1,071 (51.5%) |
| 2-Person Household | 1,249 (56.0%) | 982 (44.0%) |
| 3-Person Household | 384 (65.4%) | 203 (34.6%) |
| 4+ Person Household | 699 (44.5%) | 872 (55.5%) |
| Total Housing Units | 3,341 (51.6%) | 3,128 (48.3%) |
Occupancy by Educational Attainment in Morganton
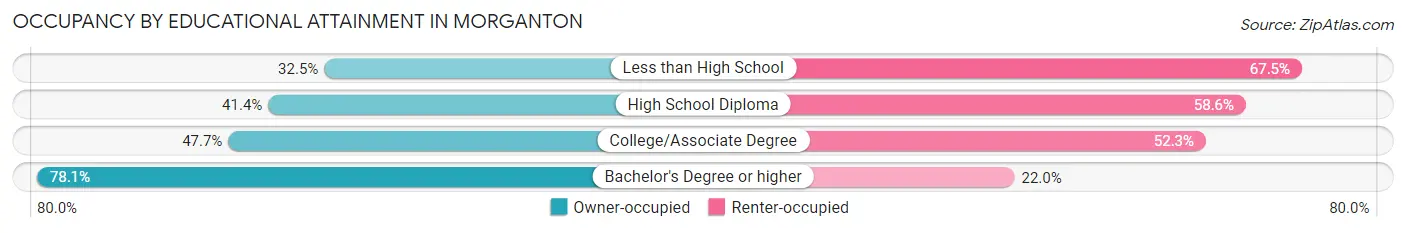
| Household Size | Owner-occupied | Renter-occupied |
| Less than High School | 464 (32.5%) | 964 (67.5%) |
| High School Diploma | 446 (41.4%) | 632 (58.6%) |
| College/Associate Degree | 1,041 (47.7%) | 1,141 (52.3%) |
| Bachelor's Degree or higher | 1,390 (78.0%) | 391 (22.0%) |
Occupancy by Age of Householder in Morganton
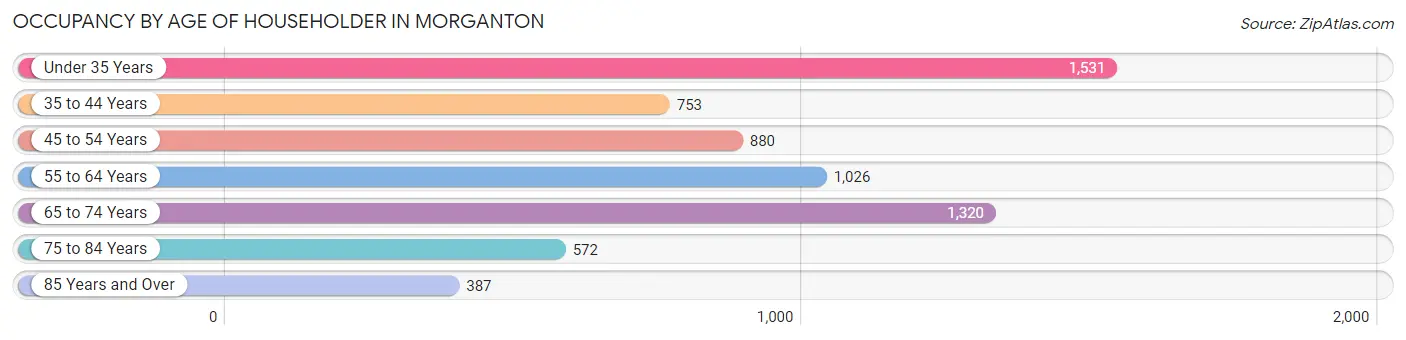
| Age Bracket | # Households | % Households |
| Under 35 Years | 1,531 | 23.7% |
| 35 to 44 Years | 753 | 11.6% |
| 45 to 54 Years | 880 | 13.6% |
| 55 to 64 Years | 1,026 | 15.9% |
| 65 to 74 Years | 1,320 | 20.4% |
| 75 to 84 Years | 572 | 8.8% |
| 85 Years and Over | 387 | 6.0% |
| Total | 6,469 | 100.0% |
Housing Finances in Morganton
Median Income by Occupancy in Morganton
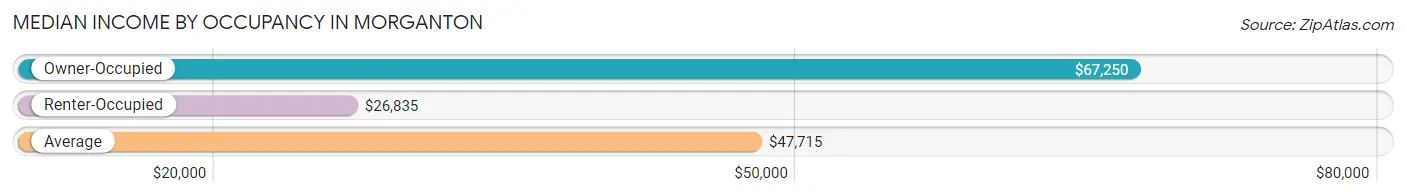
| Occupancy Type | # Households | Median Income |
| Owner-Occupied | 3,341 (51.6%) | $67,250 |
| Renter-Occupied | 3,128 (48.3%) | $26,835 |
| Average | 6,469 (100.0%) | $47,715 |
Occupancy by Householder Income Bracket in Morganton
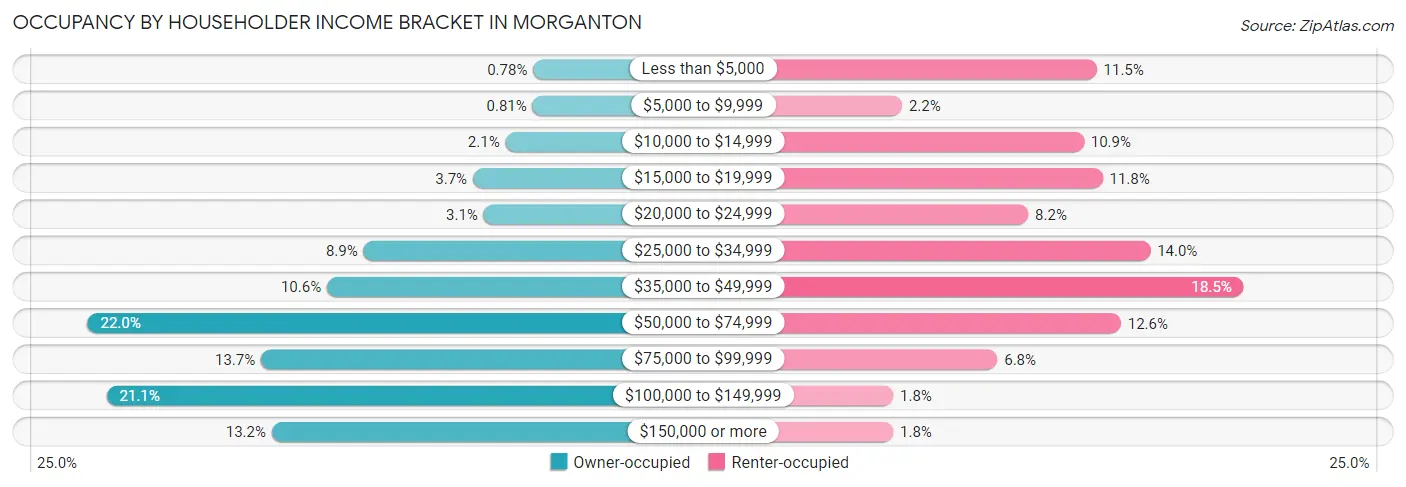
| Income Bracket | Owner-occupied | Renter-occupied |
| Less than $5,000 | 26 (0.8%) | 359 (11.5%) |
| $5,000 to $9,999 | 27 (0.8%) | 69 (2.2%) |
| $10,000 to $14,999 | 70 (2.1%) | 340 (10.9%) |
| $15,000 to $19,999 | 122 (3.6%) | 368 (11.8%) |
| $20,000 to $24,999 | 105 (3.1%) | 257 (8.2%) |
| $25,000 to $34,999 | 296 (8.9%) | 439 (14.0%) |
| $35,000 to $49,999 | 354 (10.6%) | 578 (18.5%) |
| $50,000 to $74,999 | 735 (22.0%) | 395 (12.6%) |
| $75,000 to $99,999 | 459 (13.7%) | 211 (6.8%) |
| $100,000 to $149,999 | 705 (21.1%) | 56 (1.8%) |
| $150,000 or more | 442 (13.2%) | 56 (1.8%) |
| Total | 3,341 (100.0%) | 3,128 (100.0%) |
Monthly Housing Cost Tiers in Morganton
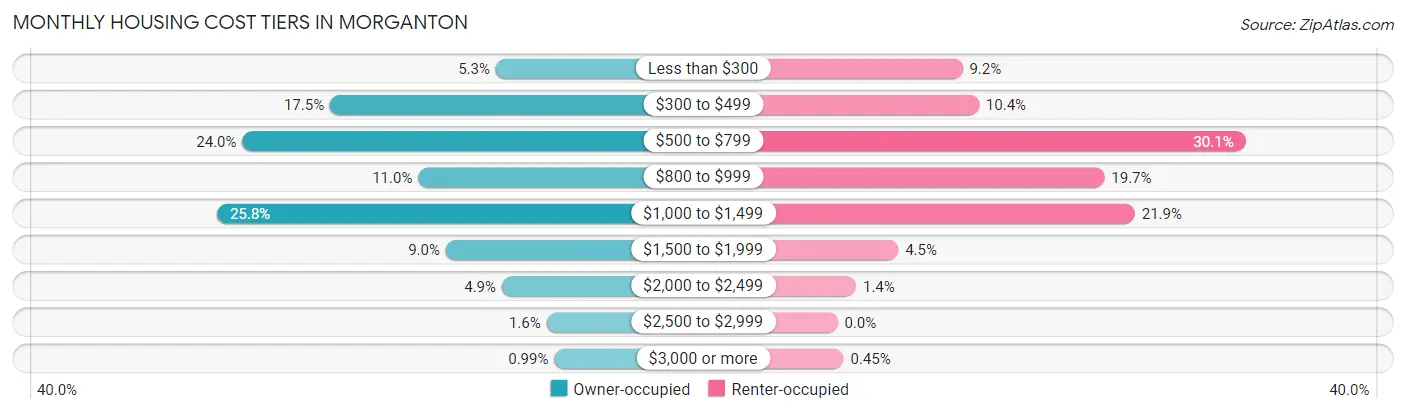
| Monthly Cost | Owner-occupied | Renter-occupied |
| Less than $300 | 177 (5.3%) | 288 (9.2%) |
| $300 to $499 | 585 (17.5%) | 326 (10.4%) |
| $500 to $799 | 801 (24.0%) | 940 (30.0%) |
| $800 to $999 | 368 (11.0%) | 615 (19.7%) |
| $1,000 to $1,499 | 863 (25.8%) | 685 (21.9%) |
| $1,500 to $1,999 | 300 (9.0%) | 140 (4.5%) |
| $2,000 to $2,499 | 162 (4.9%) | 43 (1.4%) |
| $2,500 to $2,999 | 52 (1.6%) | 0 (0.0%) |
| $3,000 or more | 33 (1.0%) | 14 (0.4%) |
| Total | 3,341 (100.0%) | 3,128 (100.0%) |
Physical Housing Characteristics in Morganton
Housing Structures in Morganton
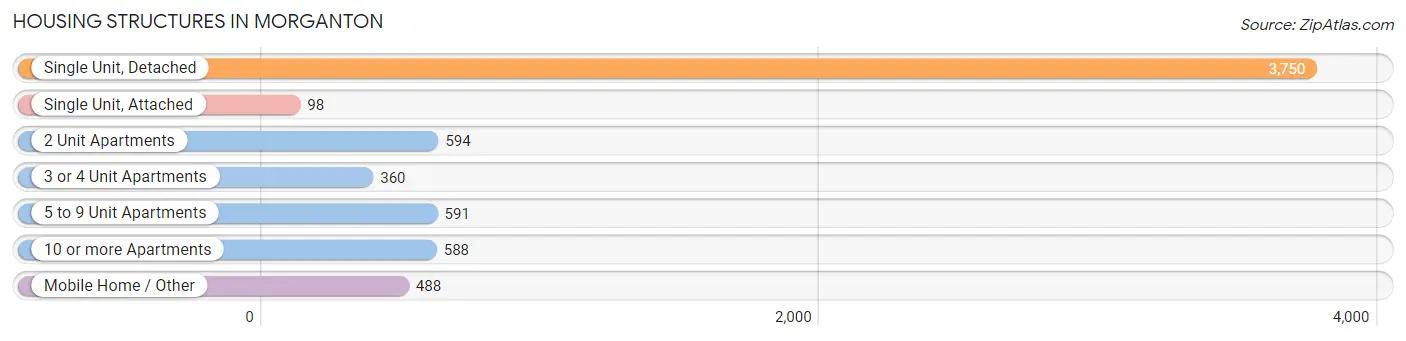
| Structure Type | # Housing Units | % Housing Units |
| Single Unit, Detached | 3,750 | 58.0% |
| Single Unit, Attached | 98 | 1.5% |
| 2 Unit Apartments | 594 | 9.2% |
| 3 or 4 Unit Apartments | 360 | 5.6% |
| 5 to 9 Unit Apartments | 591 | 9.1% |
| 10 or more Apartments | 588 | 9.1% |
| Mobile Home / Other | 488 | 7.5% |
| Total | 6,469 | 100.0% |
Housing Structures by Occupancy in Morganton
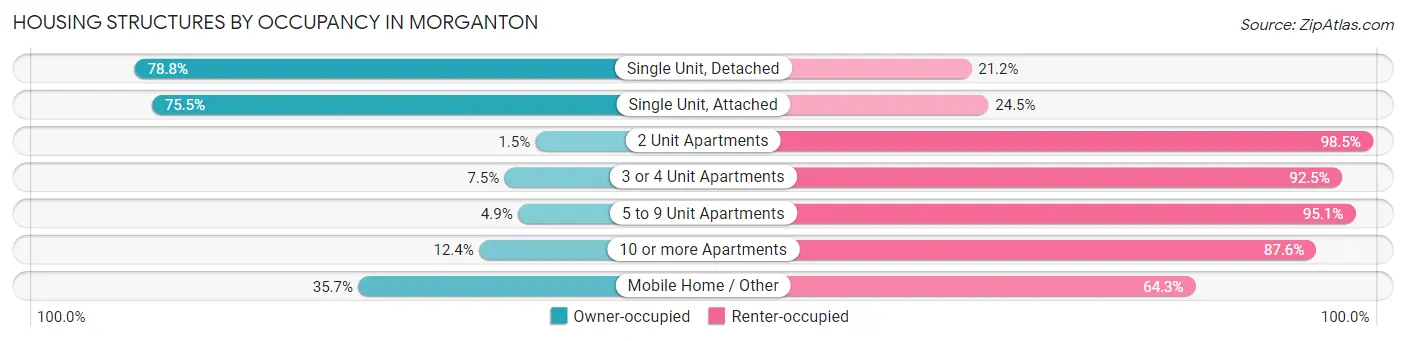
| Structure Type | Owner-occupied | Renter-occupied |
| Single Unit, Detached | 2,955 (78.8%) | 795 (21.2%) |
| Single Unit, Attached | 74 (75.5%) | 24 (24.5%) |
| 2 Unit Apartments | 9 (1.5%) | 585 (98.5%) |
| 3 or 4 Unit Apartments | 27 (7.5%) | 333 (92.5%) |
| 5 to 9 Unit Apartments | 29 (4.9%) | 562 (95.1%) |
| 10 or more Apartments | 73 (12.4%) | 515 (87.6%) |
| Mobile Home / Other | 174 (35.7%) | 314 (64.3%) |
| Total | 3,341 (51.6%) | 3,128 (48.3%) |
Housing Structures by Number of Rooms in Morganton
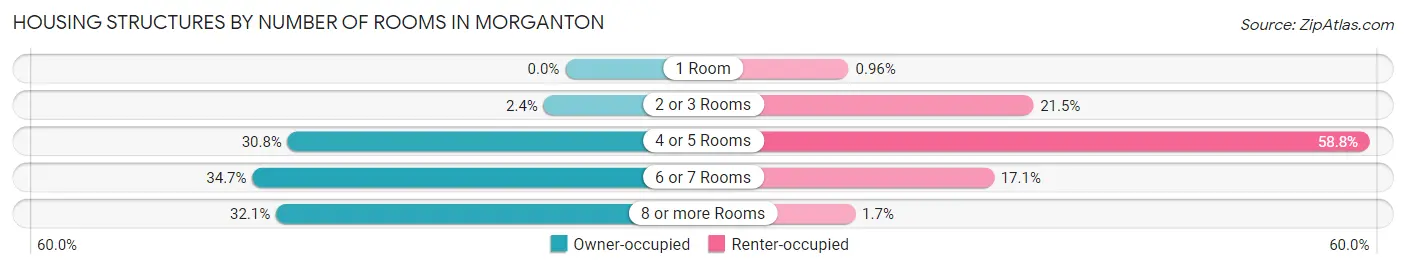
| Number of Rooms | Owner-occupied | Renter-occupied |
| 1 Room | 0 (0.0%) | 30 (1.0%) |
| 2 or 3 Rooms | 80 (2.4%) | 671 (21.4%) |
| 4 or 5 Rooms | 1,029 (30.8%) | 1,840 (58.8%) |
| 6 or 7 Rooms | 1,160 (34.7%) | 534 (17.1%) |
| 8 or more Rooms | 1,072 (32.1%) | 53 (1.7%) |
| Total | 3,341 (100.0%) | 3,128 (100.0%) |
Housing Structure by Heating Type in Morganton
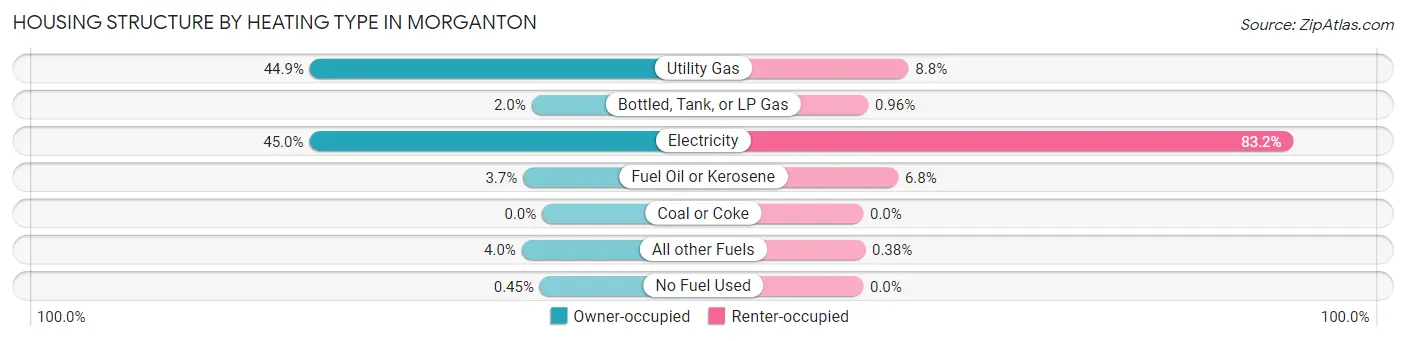
| Heating Type | Owner-occupied | Renter-occupied |
| Utility Gas | 1,500 (44.9%) | 274 (8.8%) |
| Bottled, Tank, or LP Gas | 68 (2.0%) | 30 (1.0%) |
| Electricity | 1,503 (45.0%) | 2,601 (83.2%) |
| Fuel Oil or Kerosene | 123 (3.7%) | 211 (6.8%) |
| Coal or Coke | 0 (0.0%) | 0 (0.0%) |
| All other Fuels | 132 (4.0%) | 12 (0.4%) |
| No Fuel Used | 15 (0.4%) | 0 (0.0%) |
| Total | 3,341 (100.0%) | 3,128 (100.0%) |
Household Vehicle Usage in Morganton
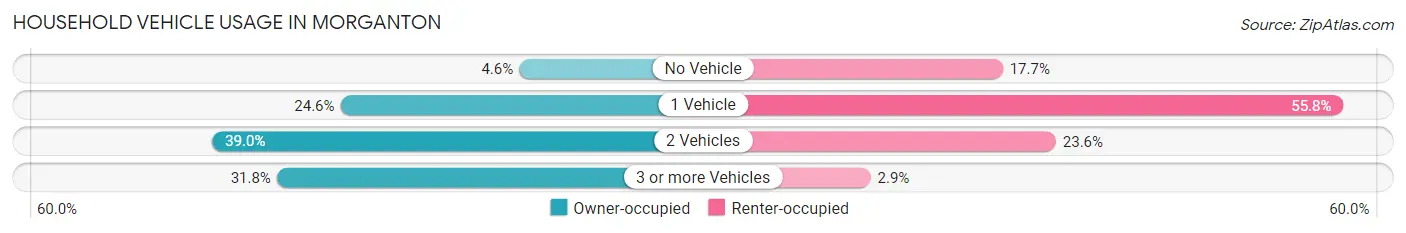
| Vehicles per Household | Owner-occupied | Renter-occupied |
| No Vehicle | 154 (4.6%) | 553 (17.7%) |
| 1 Vehicle | 823 (24.6%) | 1,746 (55.8%) |
| 2 Vehicles | 1,303 (39.0%) | 739 (23.6%) |
| 3 or more Vehicles | 1,061 (31.8%) | 90 (2.9%) |
| Total | 3,341 (100.0%) | 3,128 (100.0%) |
Real Estate & Mortgages in Morganton
Real Estate and Mortgage Overview in Morganton
| Characteristic | Without Mortgage | With Mortgage |
| Housing Units | 1,498 | 1,843 |
| Median Property Value | $155,100 | $197,000 |
| Median Household Income | $49,643 | $304 |
| Monthly Housing Costs | $502 | $33 |
| Real Estate Taxes | $1,537 | $28 |
Property Value by Mortgage Status in Morganton
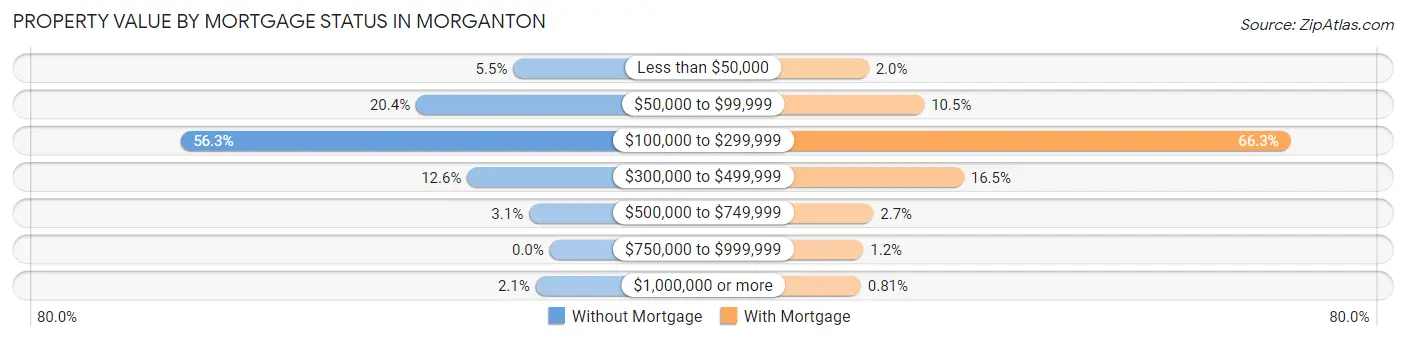
| Property Value | Without Mortgage | With Mortgage |
| Less than $50,000 | 83 (5.5%) | 37 (2.0%) |
| $50,000 to $99,999 | 305 (20.4%) | 193 (10.5%) |
| $100,000 to $299,999 | 843 (56.3%) | 1,222 (66.3%) |
| $300,000 to $499,999 | 188 (12.6%) | 304 (16.5%) |
| $500,000 to $749,999 | 47 (3.1%) | 50 (2.7%) |
| $750,000 to $999,999 | 0 (0.0%) | 22 (1.2%) |
| $1,000,000 or more | 32 (2.1%) | 15 (0.8%) |
| Total | 1,498 (100.0%) | 1,843 (100.0%) |
Household Income by Mortgage Status in Morganton
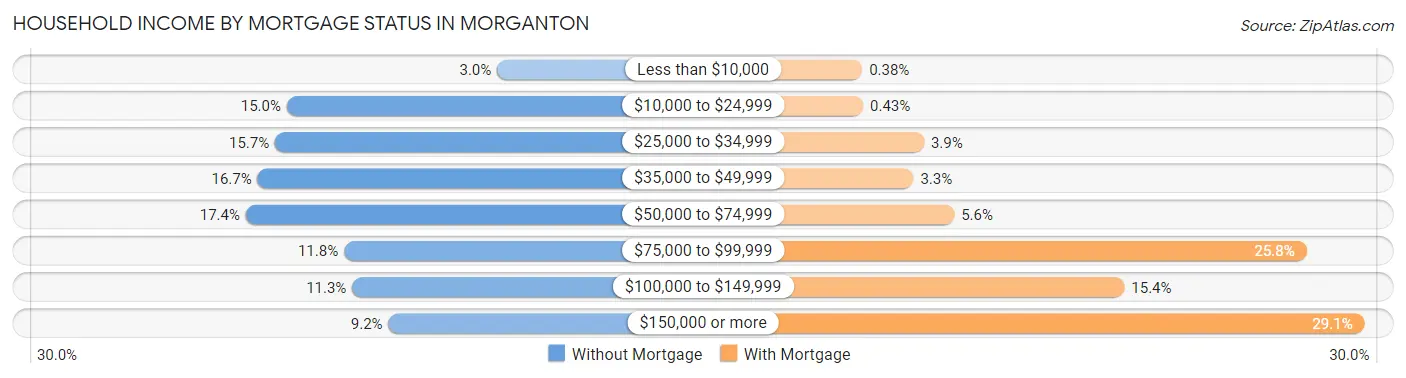
| Household Income | Without Mortgage | With Mortgage |
| Less than $10,000 | 45 (3.0%) | 7 (0.4%) |
| $10,000 to $24,999 | 225 (15.0%) | 8 (0.4%) |
| $25,000 to $34,999 | 235 (15.7%) | 72 (3.9%) |
| $35,000 to $49,999 | 250 (16.7%) | 61 (3.3%) |
| $50,000 to $74,999 | 260 (17.4%) | 104 (5.6%) |
| $75,000 to $99,999 | 176 (11.7%) | 475 (25.8%) |
| $100,000 to $149,999 | 169 (11.3%) | 283 (15.4%) |
| $150,000 or more | 138 (9.2%) | 536 (29.1%) |
| Total | 1,498 (100.0%) | 1,843 (100.0%) |
Property Value to Household Income Ratio in Morganton
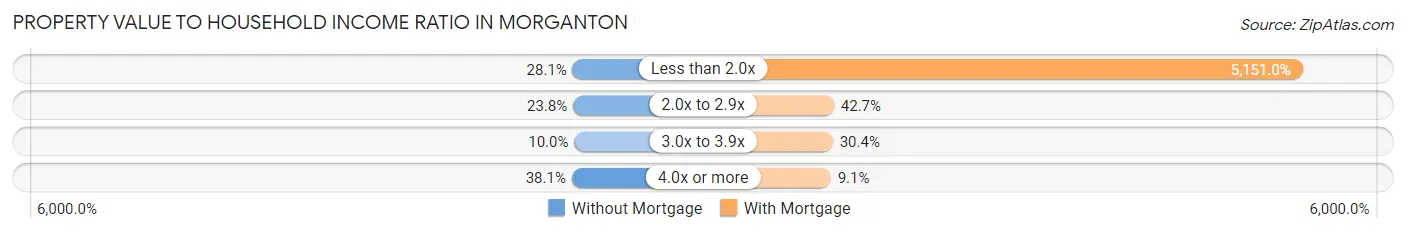
| Value-to-Income Ratio | Without Mortgage | With Mortgage |
| Less than 2.0x | 421 (28.1%) | 94,932 (5,151.0%) |
| 2.0x to 2.9x | 357 (23.8%) | 786 (42.6%) |
| 3.0x to 3.9x | 149 (10.0%) | 561 (30.4%) |
| 4.0x or more | 571 (38.1%) | 167 (9.1%) |
| Total | 1,498 (100.0%) | 1,843 (100.0%) |
Real Estate Taxes by Mortgage Status in Morganton
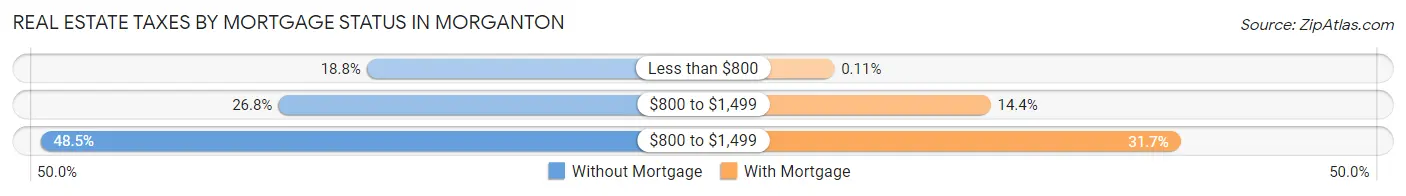
| Property Taxes | Without Mortgage | With Mortgage |
| Less than $800 | 281 (18.8%) | 2 (0.1%) |
| $800 to $1,499 | 402 (26.8%) | 265 (14.4%) |
| $800 to $1,499 | 727 (48.5%) | 585 (31.7%) |
| Total | 1,498 (100.0%) | 1,843 (100.0%) |
Health & Disability in Morganton
Health Insurance Coverage by Age in Morganton
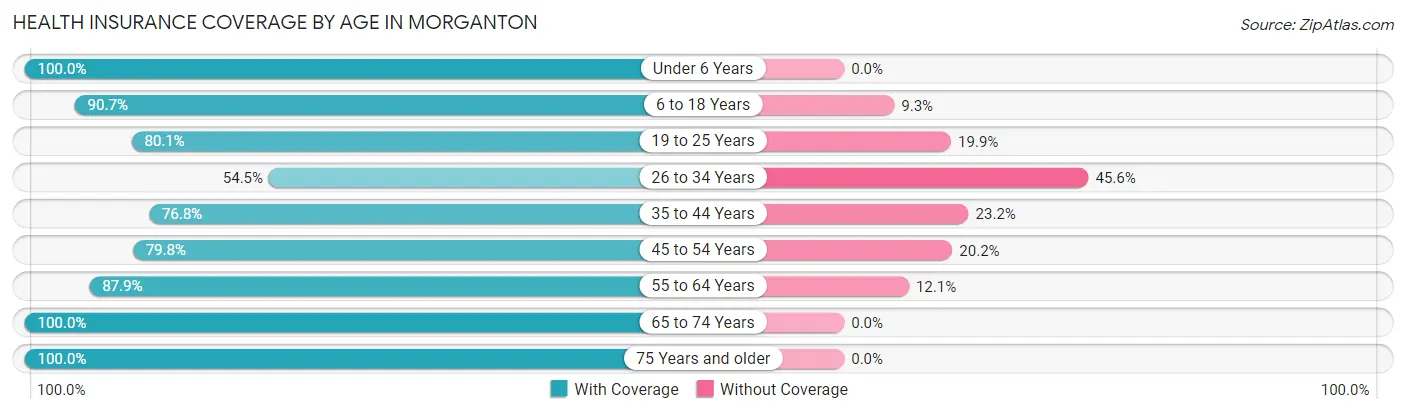
| Age Bracket | With Coverage | Without Coverage |
| Under 6 Years | 1,495 (100.0%) | 0 (0.0%) |
| 6 to 18 Years | 2,629 (90.7%) | 271 (9.3%) |
| 19 to 25 Years | 1,318 (80.1%) | 328 (19.9%) |
| 26 to 34 Years | 1,143 (54.4%) | 956 (45.6%) |
| 35 to 44 Years | 1,282 (76.8%) | 387 (23.2%) |
| 45 to 54 Years | 1,430 (79.8%) | 361 (20.2%) |
| 55 to 64 Years | 1,516 (87.9%) | 208 (12.1%) |
| 65 to 74 Years | 1,955 (100.0%) | 0 (0.0%) |
| 75 Years and older | 1,340 (100.0%) | 0 (0.0%) |
| Total | 14,108 (84.9%) | 2,511 (15.1%) |
Health Insurance Coverage by Citizenship Status in Morganton
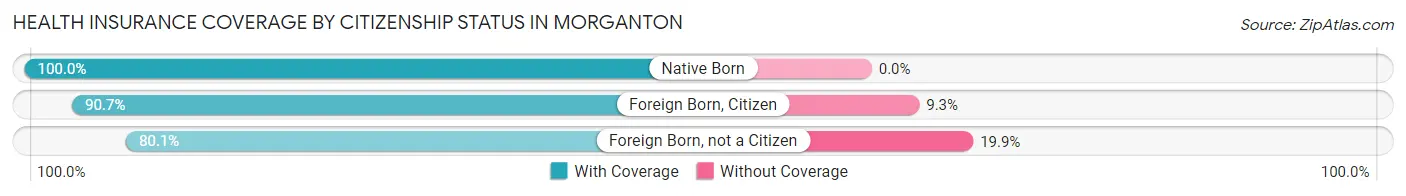
| Citizenship Status | With Coverage | Without Coverage |
| Native Born | 1,495 (100.0%) | 0 (0.0%) |
| Foreign Born, Citizen | 2,629 (90.7%) | 271 (9.3%) |
| Foreign Born, not a Citizen | 1,318 (80.1%) | 328 (19.9%) |
Health Insurance Coverage by Household Income in Morganton
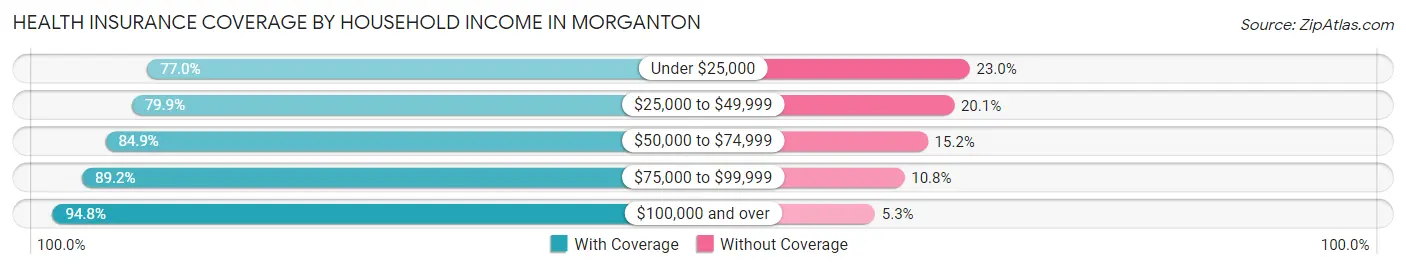
| Household Income | With Coverage | Without Coverage |
| Under $25,000 | 2,725 (77.0%) | 814 (23.0%) |
| $25,000 to $49,999 | 3,403 (79.9%) | 855 (20.1%) |
| $50,000 to $74,999 | 2,374 (84.9%) | 424 (15.1%) |
| $75,000 to $99,999 | 1,696 (89.2%) | 205 (10.8%) |
| $100,000 and over | 3,539 (94.8%) | 196 (5.2%) |
Public vs Private Health Insurance Coverage by Age in Morganton
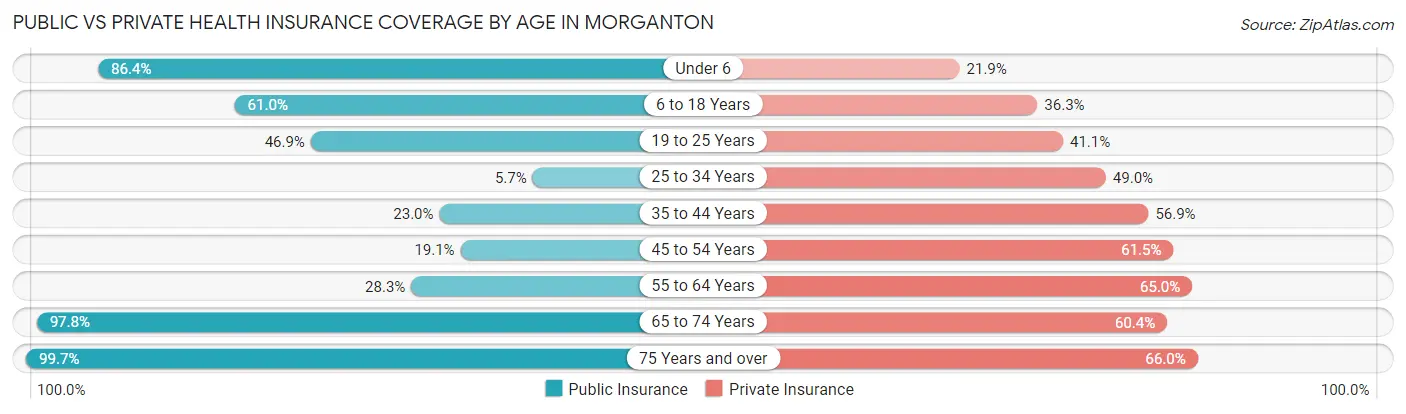
| Age Bracket | Public Insurance | Private Insurance |
| Under 6 | 1,291 (86.4%) | 327 (21.9%) |
| 6 to 18 Years | 1,769 (61.0%) | 1,053 (36.3%) |
| 19 to 25 Years | 772 (46.9%) | 676 (41.1%) |
| 25 to 34 Years | 120 (5.7%) | 1,029 (49.0%) |
| 35 to 44 Years | 384 (23.0%) | 950 (56.9%) |
| 45 to 54 Years | 342 (19.1%) | 1,102 (61.5%) |
| 55 to 64 Years | 487 (28.2%) | 1,121 (65.0%) |
| 65 to 74 Years | 1,911 (97.8%) | 1,180 (60.4%) |
| 75 Years and over | 1,336 (99.7%) | 885 (66.0%) |
| Total | 8,412 (50.6%) | 8,323 (50.1%) |
Disability Status by Sex by Age in Morganton
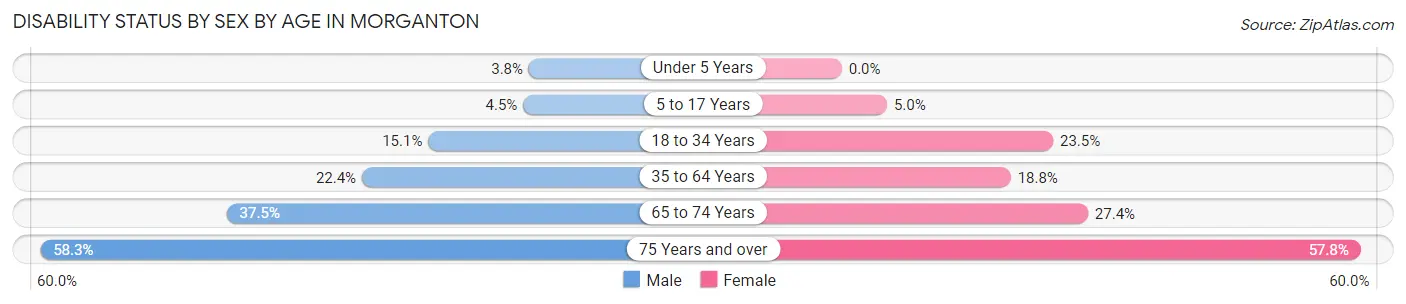
| Age Bracket | Male | Female |
| Under 5 Years | 24 (3.8%) | 0 (0.0%) |
| 5 to 17 Years | 69 (4.5%) | 66 (5.0%) |
| 18 to 34 Years | 319 (15.0%) | 432 (23.5%) |
| 35 to 64 Years | 513 (22.4%) | 545 (18.8%) |
| 65 to 74 Years | 294 (37.5%) | 321 (27.4%) |
| 75 Years and over | 321 (58.3%) | 456 (57.8%) |
Disability Class by Sex by Age in Morganton
Disability Class: Hearing Difficulty
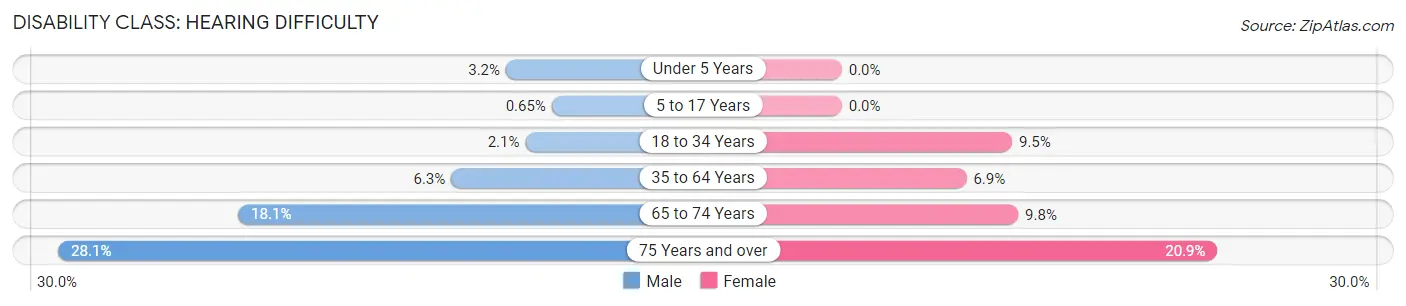
| Age Bracket | Male | Female |
| Under 5 Years | 20 (3.2%) | 0 (0.0%) |
| 5 to 17 Years | 10 (0.6%) | 0 (0.0%) |
| 18 to 34 Years | 45 (2.1%) | 174 (9.5%) |
| 35 to 64 Years | 143 (6.2%) | 201 (6.9%) |
| 65 to 74 Years | 142 (18.1%) | 115 (9.8%) |
| 75 Years and over | 155 (28.1%) | 165 (20.9%) |
Disability Class: Vision Difficulty
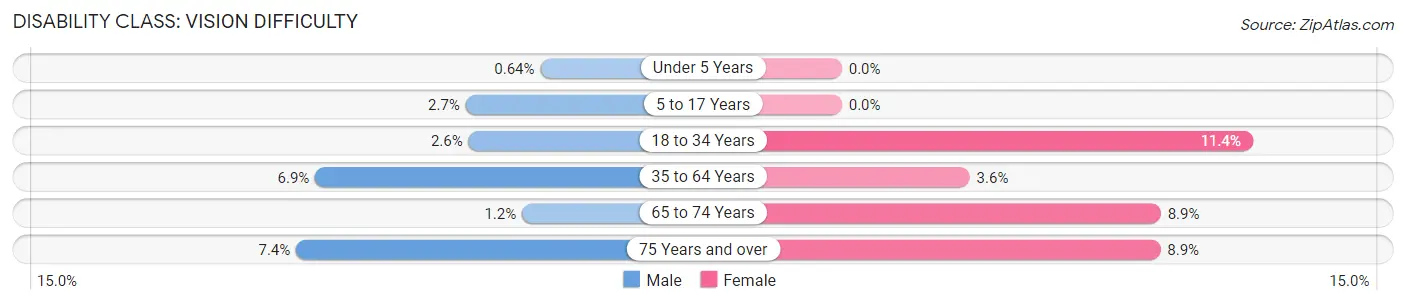
| Age Bracket | Male | Female |
| Under 5 Years | 4 (0.6%) | 0 (0.0%) |
| 5 to 17 Years | 42 (2.7%) | 0 (0.0%) |
| 18 to 34 Years | 56 (2.6%) | 210 (11.4%) |
| 35 to 64 Years | 158 (6.9%) | 103 (3.6%) |
| 65 to 74 Years | 9 (1.1%) | 104 (8.9%) |
| 75 Years and over | 41 (7.4%) | 70 (8.9%) |
Disability Class: Cognitive Difficulty
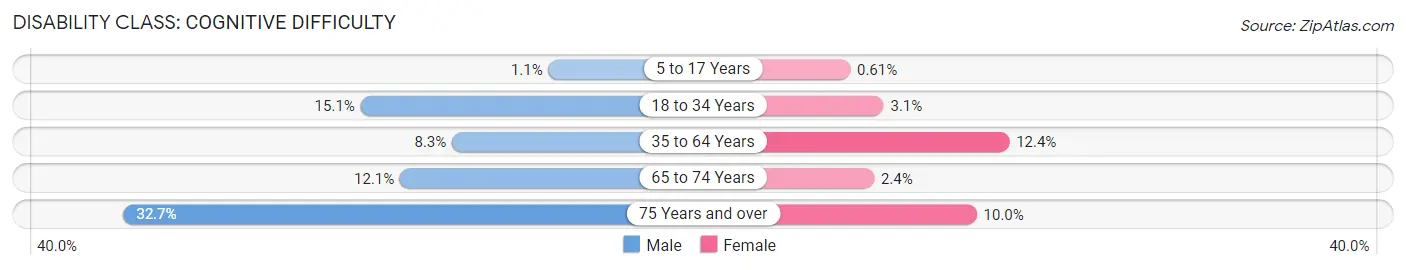
| Age Bracket | Male | Female |
| 5 to 17 Years | 17 (1.1%) | 8 (0.6%) |
| 18 to 34 Years | 319 (15.0%) | 57 (3.1%) |
| 35 to 64 Years | 189 (8.3%) | 360 (12.4%) |
| 65 to 74 Years | 95 (12.1%) | 28 (2.4%) |
| 75 Years and over | 180 (32.7%) | 79 (10.0%) |
Disability Class: Ambulatory Difficulty
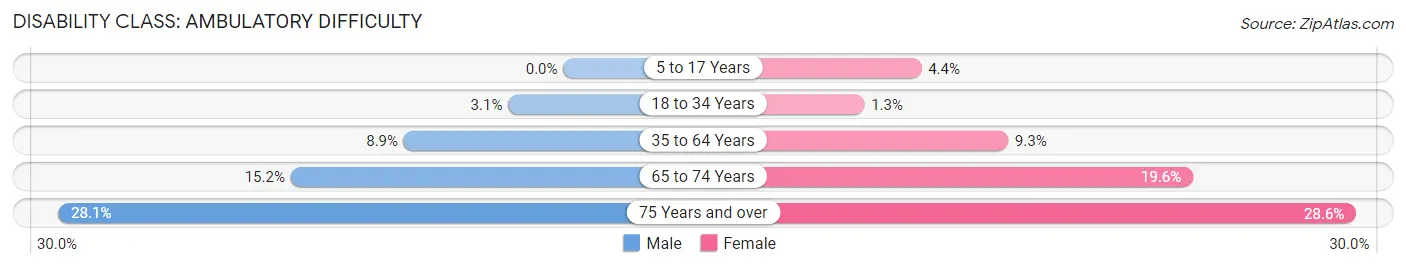
| Age Bracket | Male | Female |
| 5 to 17 Years | 0 (0.0%) | 58 (4.4%) |
| 18 to 34 Years | 65 (3.1%) | 23 (1.3%) |
| 35 to 64 Years | 203 (8.9%) | 268 (9.2%) |
| 65 to 74 Years | 119 (15.2%) | 229 (19.6%) |
| 75 Years and over | 155 (28.1%) | 226 (28.6%) |
Disability Class: Self-Care Difficulty
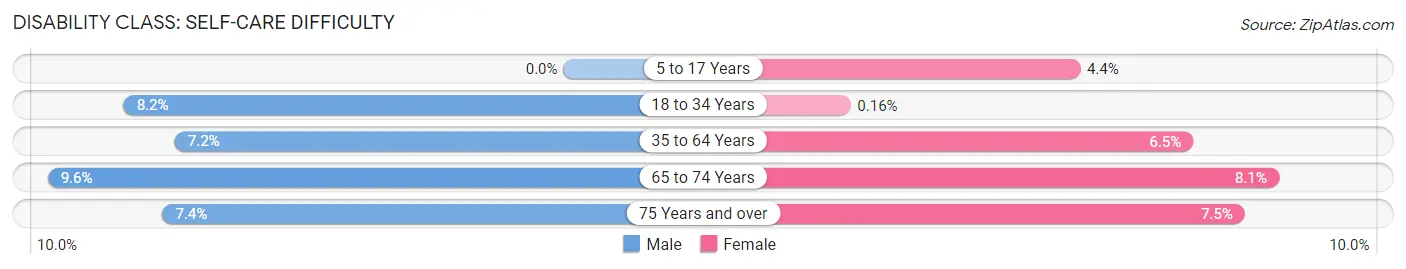
| Age Bracket | Male | Female |
| 5 to 17 Years | 0 (0.0%) | 58 (4.4%) |
| 18 to 34 Years | 173 (8.2%) | 3 (0.2%) |
| 35 to 64 Years | 165 (7.2%) | 189 (6.5%) |
| 65 to 74 Years | 75 (9.6%) | 95 (8.1%) |
| 75 Years and over | 41 (7.4%) | 59 (7.5%) |
Technology Access in Morganton
Computing Device Access in Morganton
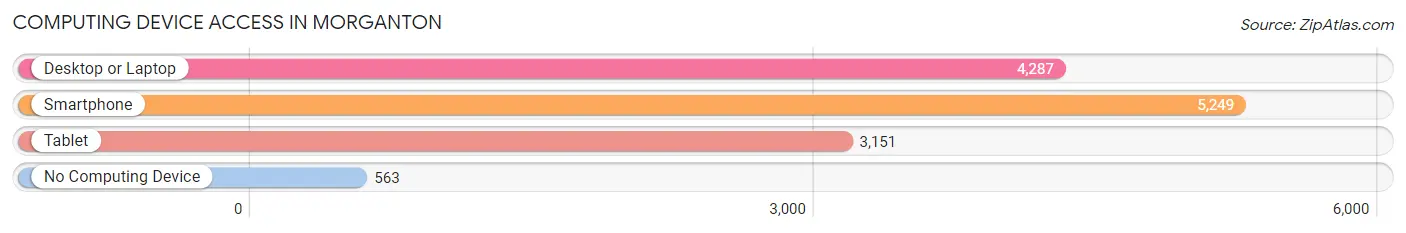
| Device Type | # Households | % Households |
| Desktop or Laptop | 4,287 | 66.3% |
| Smartphone | 5,249 | 81.1% |
| Tablet | 3,151 | 48.7% |
| No Computing Device | 563 | 8.7% |
| Total | 6,469 | 100.0% |
Internet Access in Morganton
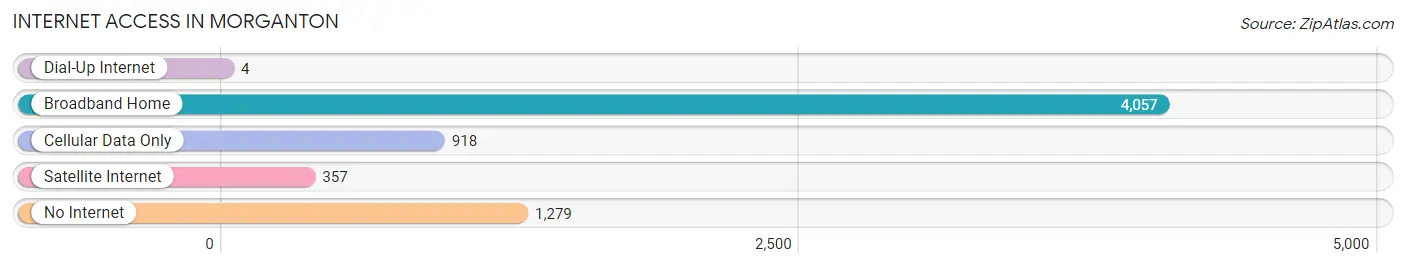
| Internet Type | # Households | % Households |
| Dial-Up Internet | 4 | 0.1% |
| Broadband Home | 4,057 | 62.7% |
| Cellular Data Only | 918 | 14.2% |
| Satellite Internet | 357 | 5.5% |
| No Internet | 1,279 | 19.8% |
| Total | 6,469 | 100.0% |
Morganton Summary
Morganton is a city located in Burke County, North Carolina. It is the county seat of Burke County and is situated in the foothills of the Blue Ridge Mountains. The city has a population of approximately 17,000 people and is located approximately 70 miles east of Asheville.
Geography
Morganton is located in the foothills of the Blue Ridge Mountains in western North Carolina. The city is situated at an elevation of 1,000 feet above sea level and is surrounded by the Catawba River to the north, the South Mountains to the east, and the Linville Gorge to the south. The city is located in a humid subtropical climate zone and experiences hot, humid summers and mild winters.
Economy
Morganton’s economy is largely based on manufacturing and agriculture. The city is home to several large manufacturing companies, including Continental Automotive Systems, Inc., which produces automotive parts, and the Morganton Furniture Company, which produces furniture. The city is also home to several agricultural businesses, including the Burke County Farmers Market, which sells locally grown produce, and the Burke County Livestock Market, which sells livestock.
Demographics
As of the 2010 census, the population of Morganton was 16,918. The racial makeup of the city was 79.2% White, 15.3% African American, 0.4% Native American, 0.7% Asian, 0.1% Pacific Islander, 2.2% from other races, and 2.2% from two or more races. Hispanic or Latino of any race were 4.3% of the population.
The median income for a household in the city was $33,945, and the median income for a family was $41,945. The per capita income for the city was $19,845. About 17.2% of families and 20.7% of the population were below the poverty line, including 28.2% of those under age 18 and 14.2% of those age 65 or over.
Education
Morganton is served by the Burke County Public Schools system. The city is home to several public schools, including Morganton Elementary School, East Burke Middle School, and Freedom High School. The city is also home to several private schools, including the Burke Christian Academy and the Morganton Day School.
Conclusion
Morganton is a city located in Burke County, North Carolina. It is the county seat of Burke County and is situated in the foothills of the Blue Ridge Mountains. The city has a population of approximately 17,000 people and is located approximately 70 miles east of Asheville. The city’s economy is largely based on manufacturing and agriculture, and the city is served by the Burke County Public Schools system. The racial makeup of the city is 79.2% White, 15.3% African American, 0.4% Native American, 0.7% Asian, 0.1% Pacific Islander, 2.2% from other races, and 2.2% from two or more races. The median income for a household in the city was $33,945, and the median income for a family was $41,945.
Common Questions
What is Per Capita Income in Morganton?
Per Capita income in Morganton is $26,379.
What is the Median Family Income in Morganton?
Median Family Income in Morganton is $54,476.
What is the Median Household income in Morganton?
Median Household Income in Morganton is $47,715.
What is Income or Wage Gap in Morganton?
Income or Wage Gap in Morganton is 1.6%.
Women in Morganton earn 98.4 cents for every dollar earned by a man.
What is Family Income Deficit in Morganton?
Family Income Deficit in Morganton is $10,499.
Families that are below poverty line in Morganton earn $10,499 less on average than the poverty threshold level.
What is Inequality or Gini Index in Morganton?
Inequality or Gini Index in Morganton is 0.50.
What is the Total Population of Morganton?
Total Population of Morganton is 17,457.
What is the Total Male Population of Morganton?
Total Male Population of Morganton is 8,383.
What is the Total Female Population of Morganton?
Total Female Population of Morganton is 9,074.
What is the Ratio of Males per 100 Females in Morganton?
There are 92.38 Males per 100 Females in Morganton.
What is the Ratio of Females per 100 Males in Morganton?
There are 108.24 Females per 100 Males in Morganton.
What is the Median Population Age in Morganton?
Median Population Age in Morganton is 37.7 Years.
What is the Average Family Size in Morganton
Average Family Size in Morganton is 3.2 People.
What is the Average Household Size in Morganton
Average Household Size in Morganton is 2.5 People.
How Large is the Labor Force in Morganton?
There are 7,491 People in the Labor Forcein in Morganton.
What is the Percentage of People in the Labor Force in Morganton?
55.3% of People are in the Labor Force in Morganton.
What is the Unemployment Rate in Morganton?
Unemployment Rate in Morganton is 5.4%.