Oak Island, NC Map & Demographics
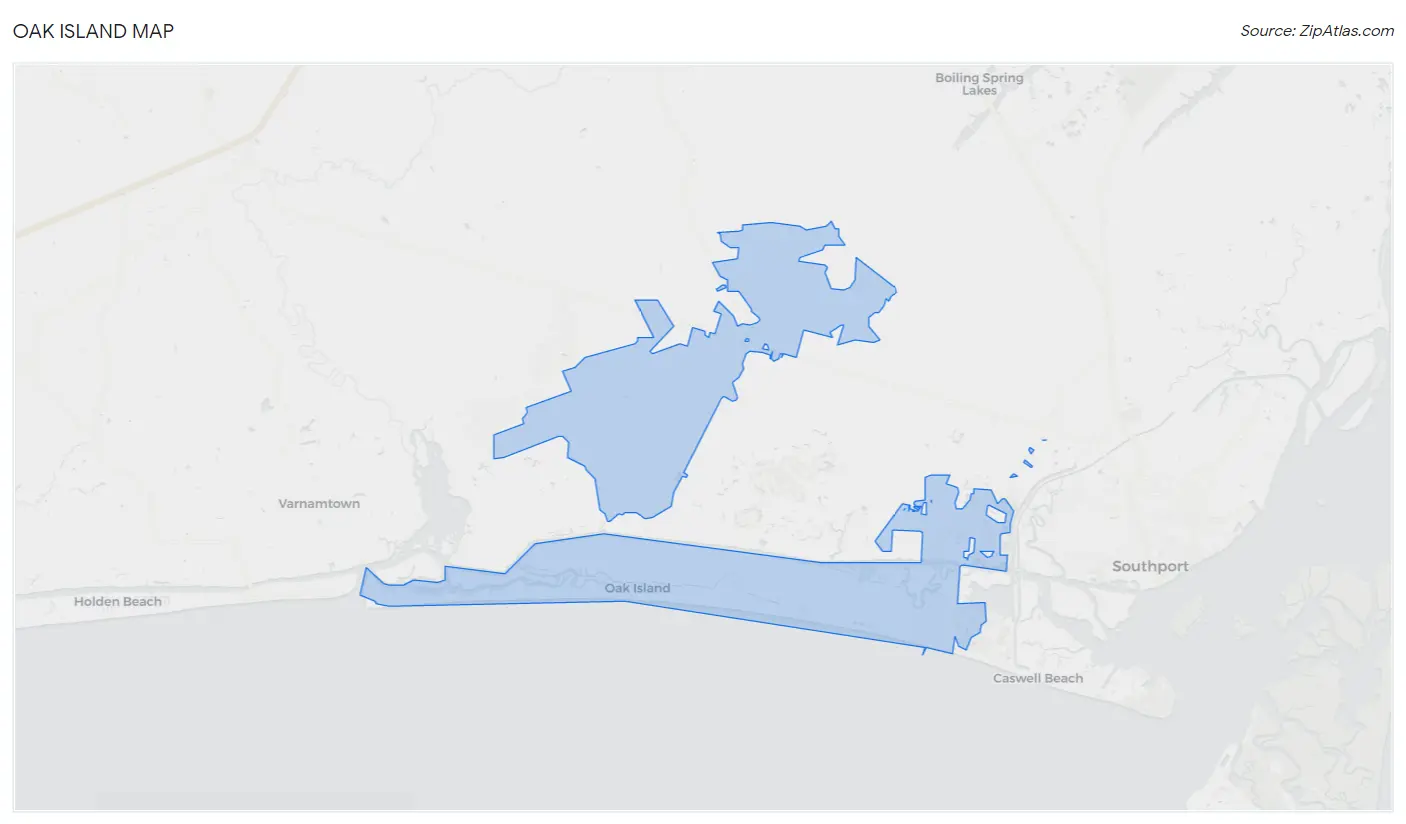
Oak Island Map
Oak Island Overview
$56,481
PER CAPITA INCOME
$97,481
AVG FAMILY INCOME
$85,513
AVG HOUSEHOLD INCOME
4.0%
WAGE / INCOME GAP [ % ]
96.0¢/ $1
WAGE / INCOME GAP [ $ ]
0.48
INEQUALITY / GINI INDEX
8,564
TOTAL POPULATION
4,154
MALE POPULATION
4,410
FEMALE POPULATION
94.20
MALES / 100 FEMALES
106.16
FEMALES / 100 MALES
60.7
MEDIAN AGE
2.5
AVG FAMILY SIZE
2.1
AVG HOUSEHOLD SIZE
3,824
LABOR FORCE [ PEOPLE ]
48.5%
PERCENT IN LABOR FORCE
4.9%
UNEMPLOYMENT RATE
Oak Island Zip Codes
Oak Island Area Codes
Income in Oak Island
Income Overview in Oak Island
Per Capita Income in Oak Island is $56,481, while median incomes of families and households are $97,481 and $85,513 respectively.
| Characteristic | Number | Measure |
| Per Capita Income | 8,564 | $56,481 |
| Median Family Income | 2,662 | $97,481 |
| Mean Family Income | 2,662 | $133,274 |
| Median Household Income | 4,048 | $85,513 |
| Mean Household Income | 4,048 | $116,549 |
| Income Deficit | 2,662 | $0 |
| Wage / Income Gap (%) | 8,564 | 4.03% |
| Wage / Income Gap ($) | 8,564 | 95.97¢ per $1 |
| Gini / Inequality Index | 8,564 | 0.48 |
Earnings by Sex in Oak Island
Average Earnings in Oak Island are $39,045, $38,101 for men and $39,700 for women, a difference of 4.0%.
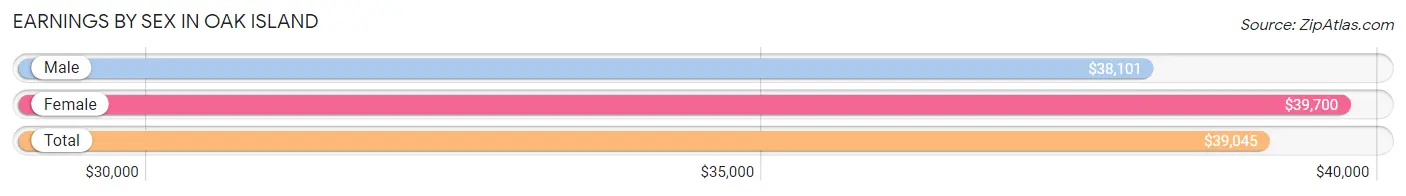
| Sex | Number | Average Earnings |
| Male | 2,089 (51.0%) | $38,101 |
| Female | 2,010 (49.0%) | $39,700 |
| Total | 4,099 (100.0%) | $39,045 |
Earnings by Sex by Income Bracket in Oak Island
The most common earnings brackets in Oak Island are $100,000+ for men (492 | 23.5%) and $100,000+ for women (373 | 18.6%).
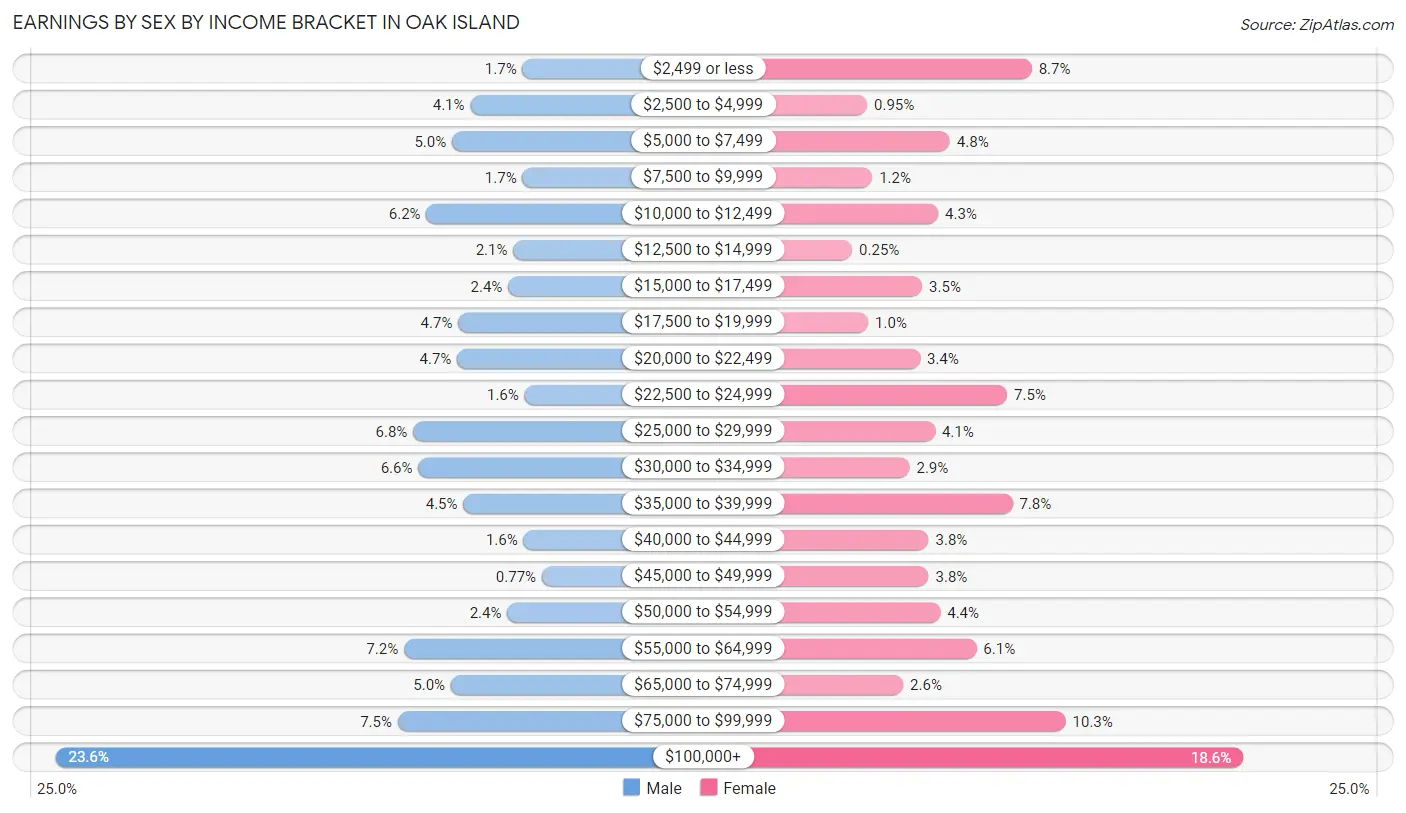
| Income | Male | Female |
| $2,499 or less | 35 (1.7%) | 174 (8.7%) |
| $2,500 to $4,999 | 86 (4.1%) | 19 (0.9%) |
| $5,000 to $7,499 | 104 (5.0%) | 97 (4.8%) |
| $7,500 to $9,999 | 35 (1.7%) | 24 (1.2%) |
| $10,000 to $12,499 | 129 (6.2%) | 86 (4.3%) |
| $12,500 to $14,999 | 44 (2.1%) | 5 (0.3%) |
| $15,000 to $17,499 | 49 (2.4%) | 71 (3.5%) |
| $17,500 to $19,999 | 98 (4.7%) | 20 (1.0%) |
| $20,000 to $22,499 | 99 (4.7%) | 69 (3.4%) |
| $22,500 to $24,999 | 33 (1.6%) | 151 (7.5%) |
| $25,000 to $29,999 | 142 (6.8%) | 83 (4.1%) |
| $30,000 to $34,999 | 137 (6.6%) | 59 (2.9%) |
| $35,000 to $39,999 | 93 (4.4%) | 156 (7.8%) |
| $40,000 to $44,999 | 34 (1.6%) | 77 (3.8%) |
| $45,000 to $49,999 | 16 (0.8%) | 77 (3.8%) |
| $50,000 to $54,999 | 50 (2.4%) | 88 (4.4%) |
| $55,000 to $64,999 | 151 (7.2%) | 122 (6.1%) |
| $65,000 to $74,999 | 105 (5.0%) | 53 (2.6%) |
| $75,000 to $99,999 | 157 (7.5%) | 206 (10.2%) |
| $100,000+ | 492 (23.5%) | 373 (18.6%) |
| Total | 2,089 (100.0%) | 2,010 (100.0%) |
Earnings by Sex by Educational Attainment in Oak Island
Average earnings in Oak Island are $45,859 for men and $40,919 for women, a difference of 10.8%. Men with an educational attainment of graduate degree enjoy the highest average annual earnings of $69,286, while those with high school diploma education earn the least with $34,773. Women with an educational attainment of graduate degree earn the most with the average annual earnings of $61,940, while those with high school diploma education have the smallest earnings of $28,672.
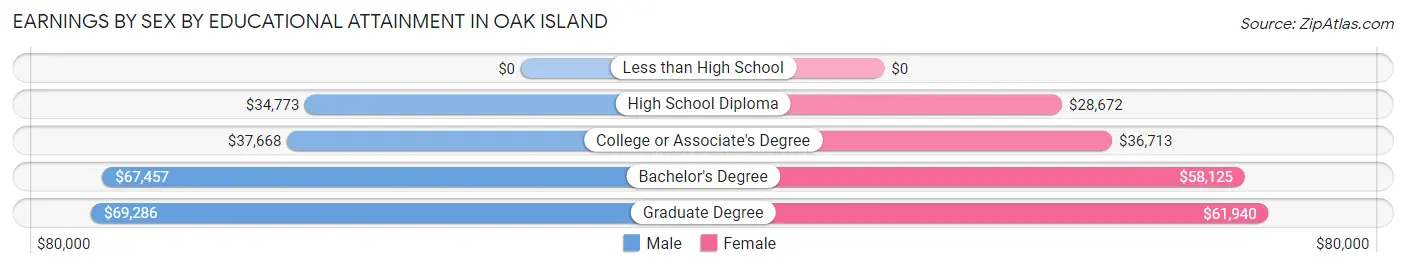
| Educational Attainment | Male Income | Female Income |
| Less than High School | - | - |
| High School Diploma | $34,773 | $28,672 |
| College or Associate's Degree | $37,668 | $36,713 |
| Bachelor's Degree | $67,457 | $58,125 |
| Graduate Degree | $69,286 | $61,940 |
| Total | $45,859 | $40,919 |
Family Income in Oak Island
Family Income Brackets in Oak Island
According to the Oak Island family income data, there are 556 families falling into the $100,000 to $149,999 income range, which is the most common income bracket and makes up 20.9% of all families. Conversely, the $25,000 to $34,999 income bracket is the least frequent group with only 56 families (2.1%) belonging to this category.
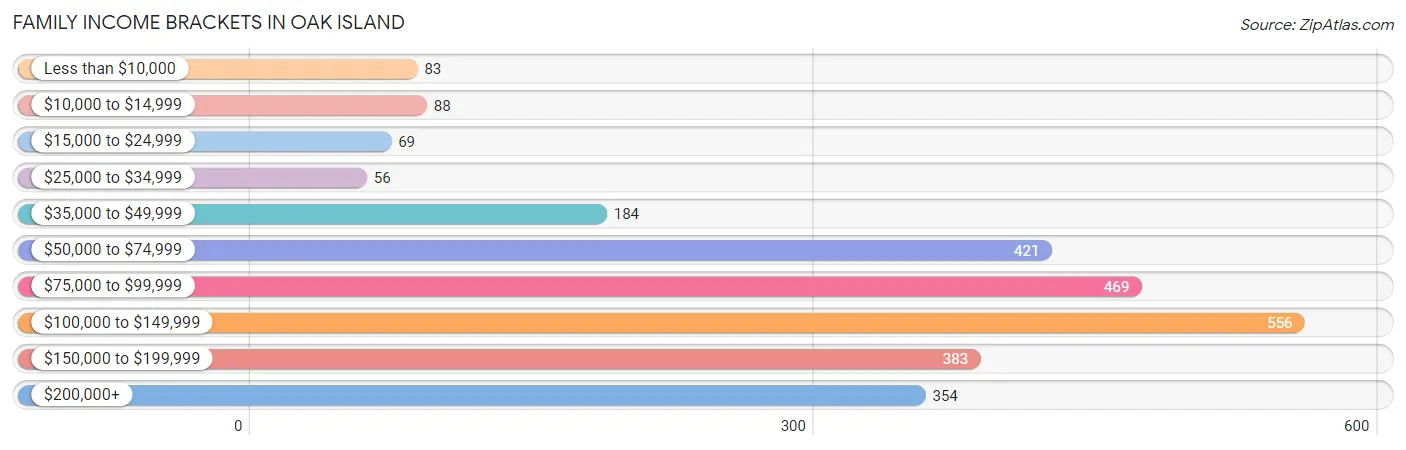
| Income Bracket | # Families | % Families |
| Less than $10,000 | 83 | 3.1% |
| $10,000 to $14,999 | 88 | 3.3% |
| $15,000 to $24,999 | 69 | 2.6% |
| $25,000 to $34,999 | 56 | 2.1% |
| $35,000 to $49,999 | 184 | 6.9% |
| $50,000 to $74,999 | 421 | 15.8% |
| $75,000 to $99,999 | 469 | 17.6% |
| $100,000 to $149,999 | 556 | 20.9% |
| $150,000 to $199,999 | 383 | 14.4% |
| $200,000+ | 354 | 13.3% |
Family Income by Famaliy Size in Oak Island
2-person families (2,047 | 76.9%) account for the highest median family income in Oak Island with $101,492 per family, while 2-person families (2,047 | 76.9%) have the highest median income of $50,746 per family member.
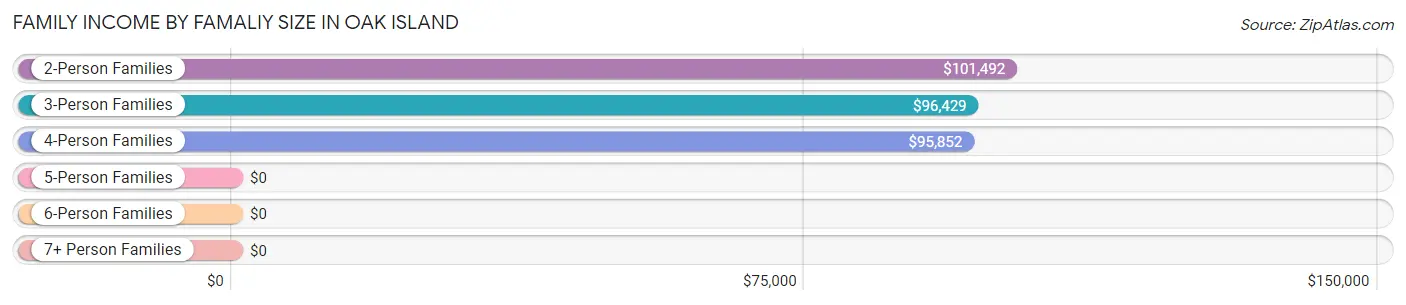
| Income Bracket | # Families | Median Income |
| 2-Person Families | 2,047 (76.9%) | $101,492 |
| 3-Person Families | 436 (16.4%) | $96,429 |
| 4-Person Families | 93 (3.5%) | $95,852 |
| 5-Person Families | 80 (3.0%) | $0 |
| 6-Person Families | 4 (0.2%) | $0 |
| 7+ Person Families | 2 (0.1%) | $0 |
| Total | 2,662 (100.0%) | $97,481 |
Family Income by Number of Earners in Oak Island
The median family income in Oak Island is $97,481, with families comprising 3+ earners (81) having the highest median family income of $131,458, while families with no earners (882) have the lowest median family income of $62,750, accounting for 3.0% and 33.1% of families, respectively.
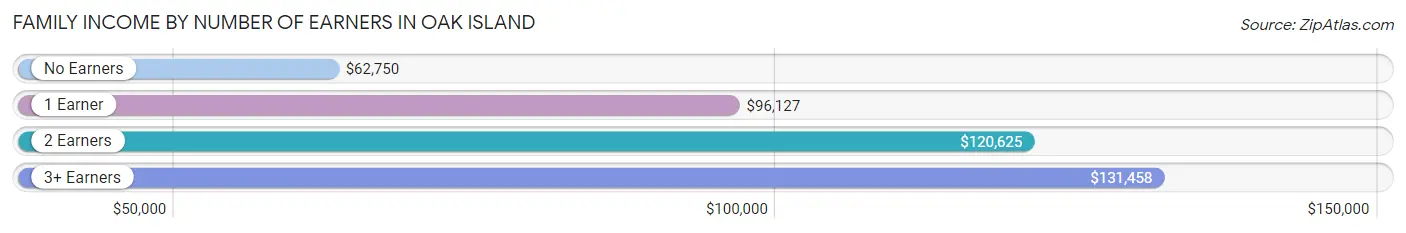
| Number of Earners | # Families | Median Income |
| No Earners | 882 (33.1%) | $62,750 |
| 1 Earner | 774 (29.1%) | $96,127 |
| 2 Earners | 925 (34.7%) | $120,625 |
| 3+ Earners | 81 (3.0%) | $131,458 |
| Total | 2,662 (100.0%) | $97,481 |
Household Income in Oak Island
Household Income Brackets in Oak Island
With 733 households falling in the category, the $100,000 to $149,999 income range is the most frequent in Oak Island, accounting for 18.1% of all households. In contrast, only 146 households (3.6%) fall into the $10,000 to $14,999 income bracket, making it the least populous group.
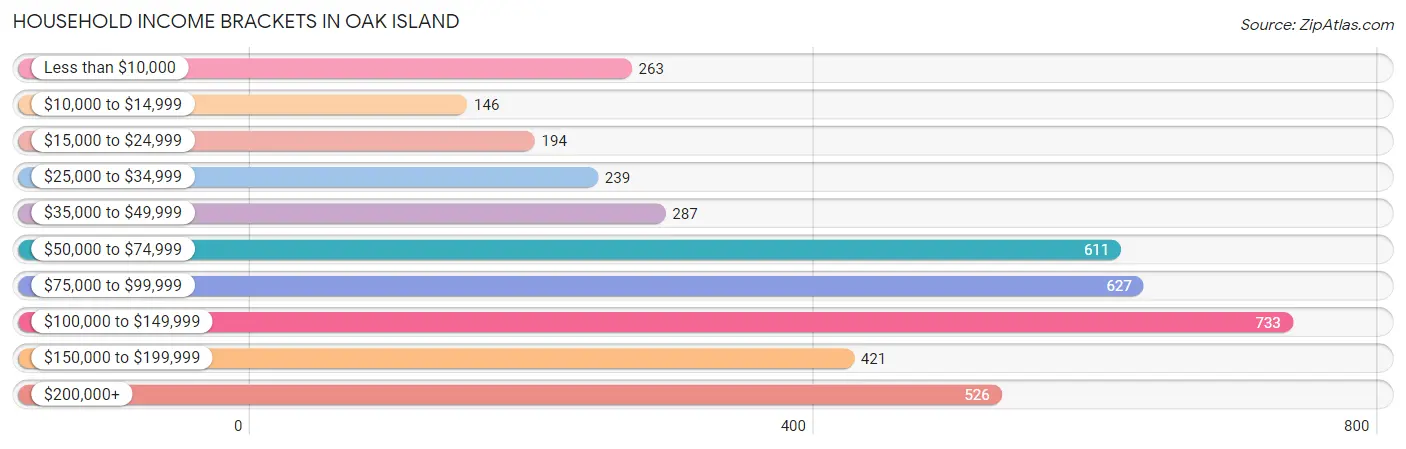
| Income Bracket | # Households | % Households |
| Less than $10,000 | 263 | 6.5% |
| $10,000 to $14,999 | 146 | 3.6% |
| $15,000 to $24,999 | 194 | 4.8% |
| $25,000 to $34,999 | 239 | 5.9% |
| $35,000 to $49,999 | 287 | 7.1% |
| $50,000 to $74,999 | 611 | 15.1% |
| $75,000 to $99,999 | 627 | 15.5% |
| $100,000 to $149,999 | 733 | 18.1% |
| $150,000 to $199,999 | 421 | 10.4% |
| $200,000+ | 526 | 13.0% |
Household Income by Householder Age in Oak Island
The median household income in Oak Island is $85,513, with the highest median household income of $98,583 found in the 45 to 64 years age bracket for the primary householder. A total of 1,759 households (43.4%) fall into this category. Meanwhile, the 15 to 24 years age bracket for the primary householder has the lowest median household income of $0, with 8 households (0.2%) in this group.
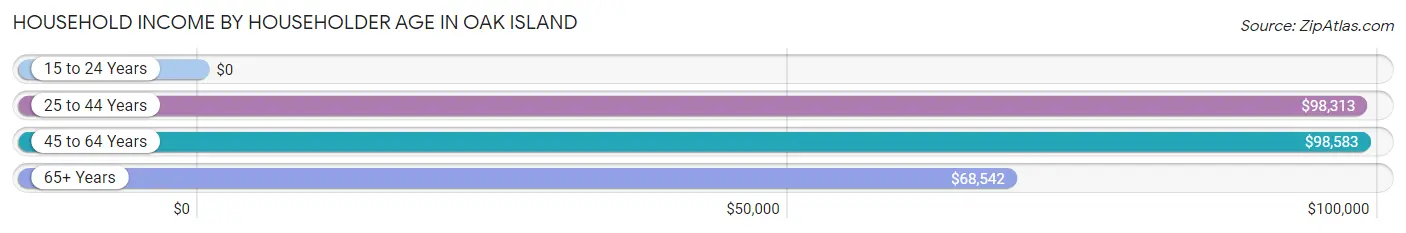
| Income Bracket | # Households | Median Income |
| 15 to 24 Years | 8 (0.2%) | $0 |
| 25 to 44 Years | 307 (7.6%) | $98,313 |
| 45 to 64 Years | 1,759 (43.4%) | $98,583 |
| 65+ Years | 1,974 (48.8%) | $68,542 |
| Total | 4,048 (100.0%) | $85,513 |
Poverty in Oak Island
Income Below Poverty by Sex and Age in Oak Island
With 8.7% poverty level for males and 9.5% for females among the residents of Oak Island, 55 to 64 year old males and 18 to 24 year old females are the most vulnerable to poverty, with 181 males (16.3%) and 20 females (19.2%) in their respective age groups living below the poverty level.
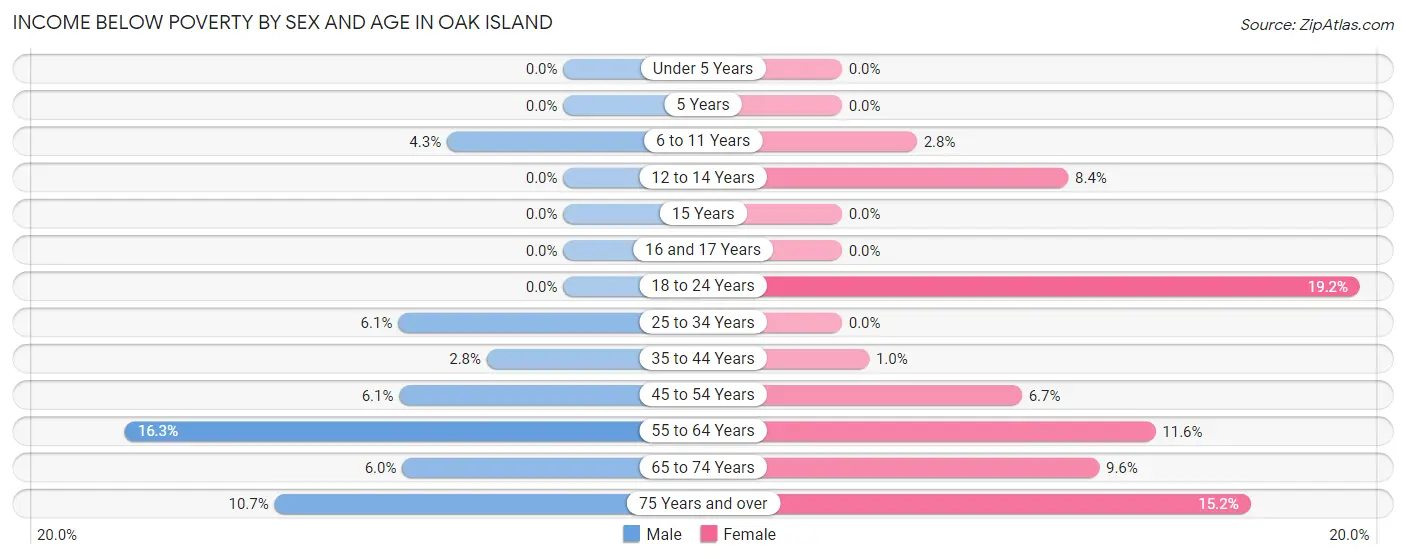
| Age Bracket | Male | Female |
| Under 5 Years | 0 (0.0%) | 0 (0.0%) |
| 5 Years | 0 (0.0%) | 0 (0.0%) |
| 6 to 11 Years | 8 (4.3%) | 2 (2.8%) |
| 12 to 14 Years | 0 (0.0%) | 11 (8.4%) |
| 15 Years | 0 (0.0%) | 0 (0.0%) |
| 16 and 17 Years | 0 (0.0%) | 0 (0.0%) |
| 18 to 24 Years | 0 (0.0%) | 20 (19.2%) |
| 25 to 34 Years | 16 (6.1%) | 0 (0.0%) |
| 35 to 44 Years | 5 (2.8%) | 2 (1.0%) |
| 45 to 54 Years | 31 (6.1%) | 47 (6.7%) |
| 55 to 64 Years | 181 (16.3%) | 149 (11.6%) |
| 65 to 74 Years | 59 (6.0%) | 110 (9.6%) |
| 75 Years and over | 61 (10.7%) | 76 (15.2%) |
| Total | 361 (8.7%) | 417 (9.5%) |
Income Above Poverty by Sex and Age in Oak Island
According to the poverty statistics in Oak Island, males aged under 5 years and females aged under 5 years are the age groups that are most secure financially, with 100.0% of males and 100.0% of females in these age groups living above the poverty line.
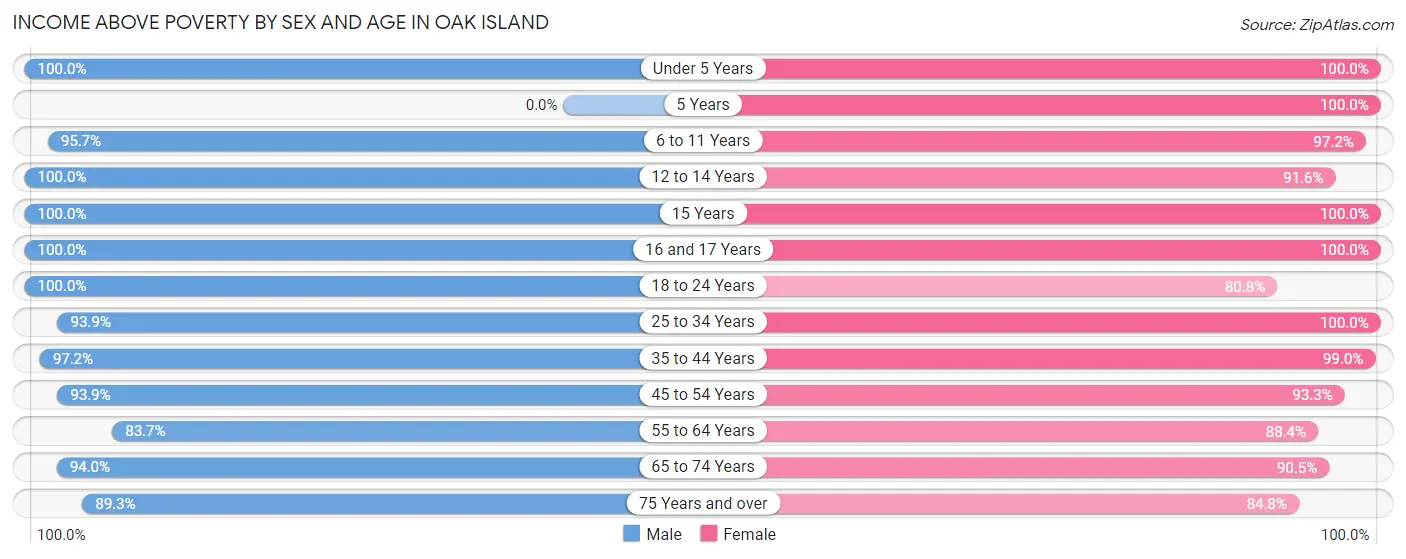
| Age Bracket | Male | Female |
| Under 5 Years | 79 (100.0%) | 19 (100.0%) |
| 5 Years | 0 (0.0%) | 14 (100.0%) |
| 6 to 11 Years | 177 (95.7%) | 70 (97.2%) |
| 12 to 14 Years | 28 (100.0%) | 120 (91.6%) |
| 15 Years | 50 (100.0%) | 82 (100.0%) |
| 16 and 17 Years | 26 (100.0%) | 6 (100.0%) |
| 18 to 24 Years | 166 (100.0%) | 84 (80.8%) |
| 25 to 34 Years | 245 (93.9%) | 133 (100.0%) |
| 35 to 44 Years | 171 (97.2%) | 197 (99.0%) |
| 45 to 54 Years | 478 (93.9%) | 657 (93.3%) |
| 55 to 64 Years | 931 (83.7%) | 1,131 (88.4%) |
| 65 to 74 Years | 928 (94.0%) | 1,042 (90.4%) |
| 75 Years and over | 508 (89.3%) | 425 (84.8%) |
| Total | 3,787 (91.3%) | 3,980 (90.5%) |
Income Below Poverty Among Married-Couple Families in Oak Island
The poverty statistics for married-couple families in Oak Island show that 6.7% or 159 of the total 2,362 families live below the poverty line. Families with no children have the highest poverty rate of 7.5%, comprising of 159 families. On the other hand, families with 1 or 2 children have the lowest poverty rate of 0.0%, which includes 0 families.
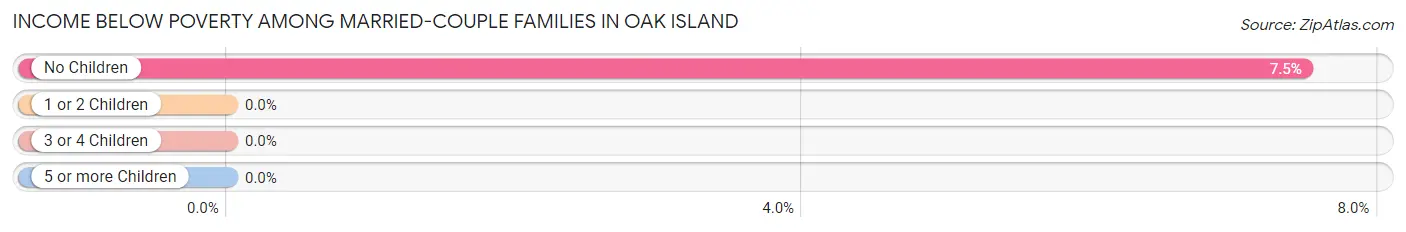
| Children | Above Poverty | Below Poverty |
| No Children | 1,964 (92.5%) | 159 (7.5%) |
| 1 or 2 Children | 228 (100.0%) | 0 (0.0%) |
| 3 or 4 Children | 11 (100.0%) | 0 (0.0%) |
| 5 or more Children | 0 (0.0%) | 0 (0.0%) |
| Total | 2,203 (93.3%) | 159 (6.7%) |
Income Below Poverty Among Single-Parent Households in Oak Island
According to the poverty data in Oak Island, 7.8% or 8 single-father households and 5.6% or 11 single-mother households are living below the poverty line. Among single-father households, those with 1 or 2 children have the highest poverty rate, with 8 households (14.0%) experiencing poverty. Likewise, among single-mother households, those with 3 or 4 children have the highest poverty rate, with 2 households (100.0%) falling below the poverty line.
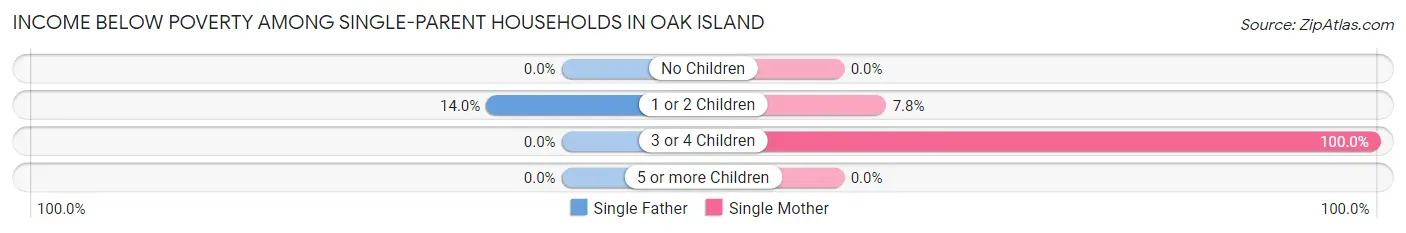
| Children | Single Father | Single Mother |
| No Children | 0 (0.0%) | 0 (0.0%) |
| 1 or 2 Children | 8 (14.0%) | 9 (7.8%) |
| 3 or 4 Children | 0 (0.0%) | 2 (100.0%) |
| 5 or more Children | 0 (0.0%) | 0 (0.0%) |
| Total | 8 (7.8%) | 11 (5.6%) |
Income Below Poverty Among Married-Couple vs Single-Parent Households in Oak Island
The poverty data for Oak Island shows that 159 of the married-couple family households (6.7%) and 19 of the single-parent households (6.3%) are living below the poverty level. Within the married-couple family households, those with no children have the highest poverty rate, with 159 households (7.5%) falling below the poverty line. Among the single-parent households, those with 3 or 4 children have the highest poverty rate, with 2 household (100.0%) living below poverty.
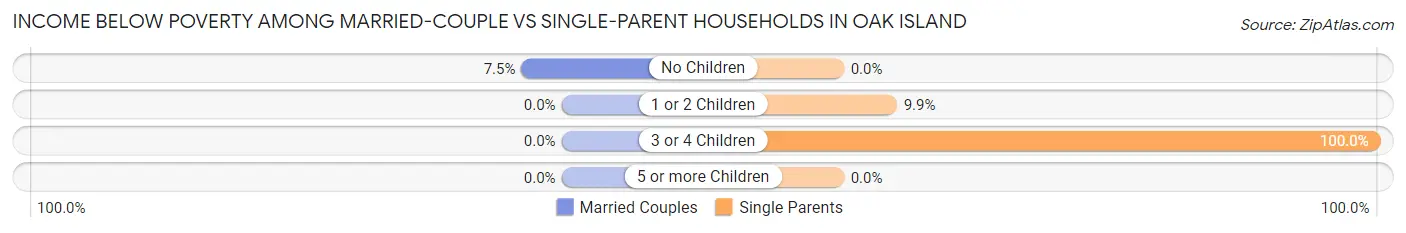
| Children | Married-Couple Families | Single-Parent Households |
| No Children | 159 (7.5%) | 0 (0.0%) |
| 1 or 2 Children | 0 (0.0%) | 17 (9.9%) |
| 3 or 4 Children | 0 (0.0%) | 2 (100.0%) |
| 5 or more Children | 0 (0.0%) | 0 (0.0%) |
| Total | 159 (6.7%) | 19 (6.3%) |
Race in Oak Island
The most populous races in Oak Island are White / Caucasian (8,129 | 94.9%), Two or more Races (260 | 3.0%), and Hispanic or Latino (103 | 1.2%).
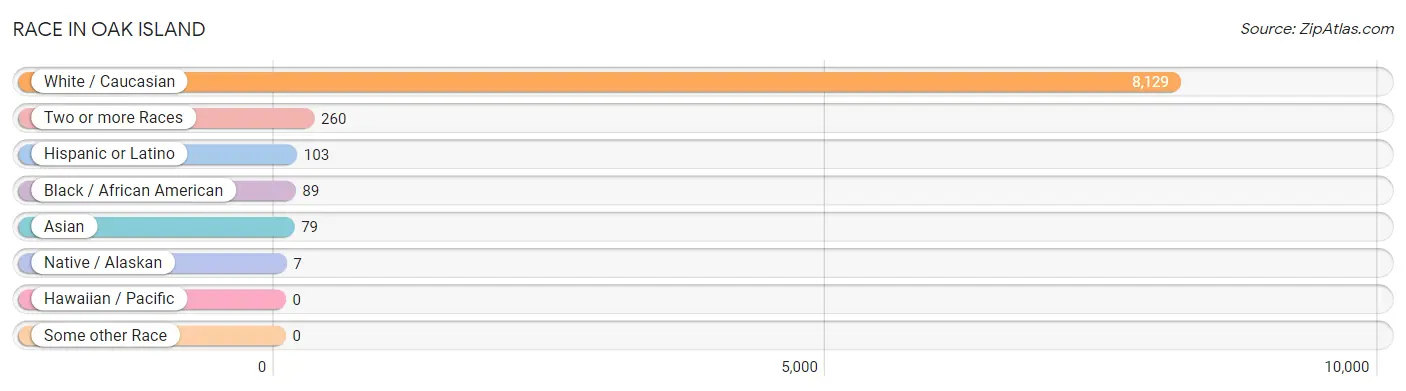
| Race | # Population | % Population |
| Asian | 79 | 0.9% |
| Black / African American | 89 | 1.0% |
| Hawaiian / Pacific | 0 | 0.0% |
| Hispanic or Latino | 103 | 1.2% |
| Native / Alaskan | 7 | 0.1% |
| White / Caucasian | 8,129 | 94.9% |
| Two or more Races | 260 | 3.0% |
| Some other Race | 0 | 0.0% |
| Total | 8,564 | 100.0% |
Ancestry in Oak Island
The most populous ancestries reported in Oak Island are English (1,479 | 17.3%), German (1,320 | 15.4%), Irish (1,287 | 15.0%), American (627 | 7.3%), and Italian (548 | 6.4%), together accounting for 61.4% of all Oak Island residents.
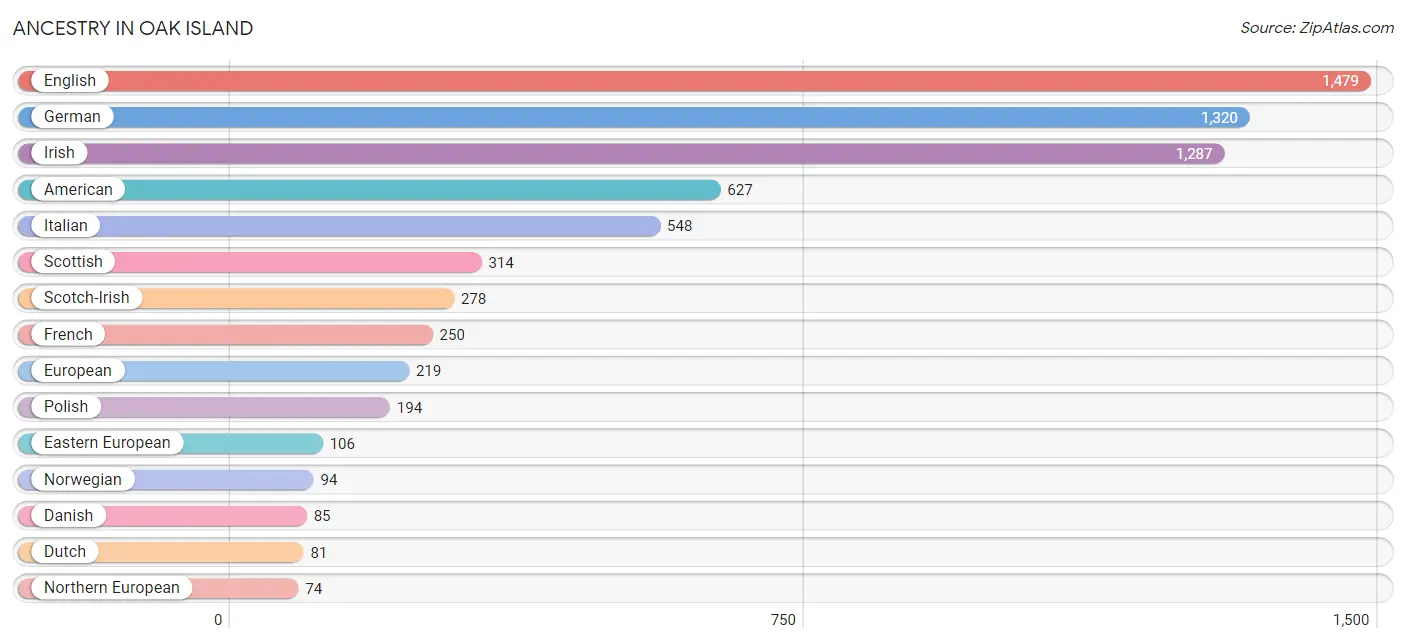
| Ancestry | # Population | % Population |
| African | 24 | 0.3% |
| American | 627 | 7.3% |
| Arab | 6 | 0.1% |
| Austrian | 18 | 0.2% |
| Bahamian | 7 | 0.1% |
| Brazilian | 12 | 0.1% |
| British | 73 | 0.9% |
| Canadian | 15 | 0.2% |
| Cherokee | 24 | 0.3% |
| Czech | 5 | 0.1% |
| Czechoslovakian | 8 | 0.1% |
| Danish | 85 | 1.0% |
| Dutch | 81 | 0.9% |
| Eastern European | 106 | 1.2% |
| English | 1,479 | 17.3% |
| European | 219 | 2.6% |
| French | 250 | 2.9% |
| French Canadian | 32 | 0.4% |
| German | 1,320 | 15.4% |
| Greek | 27 | 0.3% |
| Guyanese | 23 | 0.3% |
| Hungarian | 28 | 0.3% |
| Indian (Asian) | 56 | 0.6% |
| Irish | 1,287 | 15.0% |
| Italian | 548 | 6.4% |
| Latvian | 4 | 0.1% |
| Lebanese | 1 | 0.0% |
| Lithuanian | 50 | 0.6% |
| Lumbee | 4 | 0.1% |
| Mexican | 13 | 0.2% |
| Northern European | 74 | 0.9% |
| Norwegian | 94 | 1.1% |
| Pakistani | 18 | 0.2% |
| Polish | 194 | 2.3% |
| Portuguese | 36 | 0.4% |
| Puerto Rican | 35 | 0.4% |
| Russian | 17 | 0.2% |
| Scandinavian | 59 | 0.7% |
| Scotch-Irish | 278 | 3.3% |
| Scottish | 314 | 3.7% |
| Serbian | 9 | 0.1% |
| Slavic | 9 | 0.1% |
| South American | 20 | 0.2% |
| Spanish | 35 | 0.4% |
| Subsaharan African | 24 | 0.3% |
| Swedish | 61 | 0.7% |
| Swiss | 9 | 0.1% |
| Syrian | 5 | 0.1% |
| Thai | 5 | 0.1% |
| Ukrainian | 8 | 0.1% |
| Uruguayan | 20 | 0.2% |
| Welsh | 44 | 0.5% | View All 52 Rows |
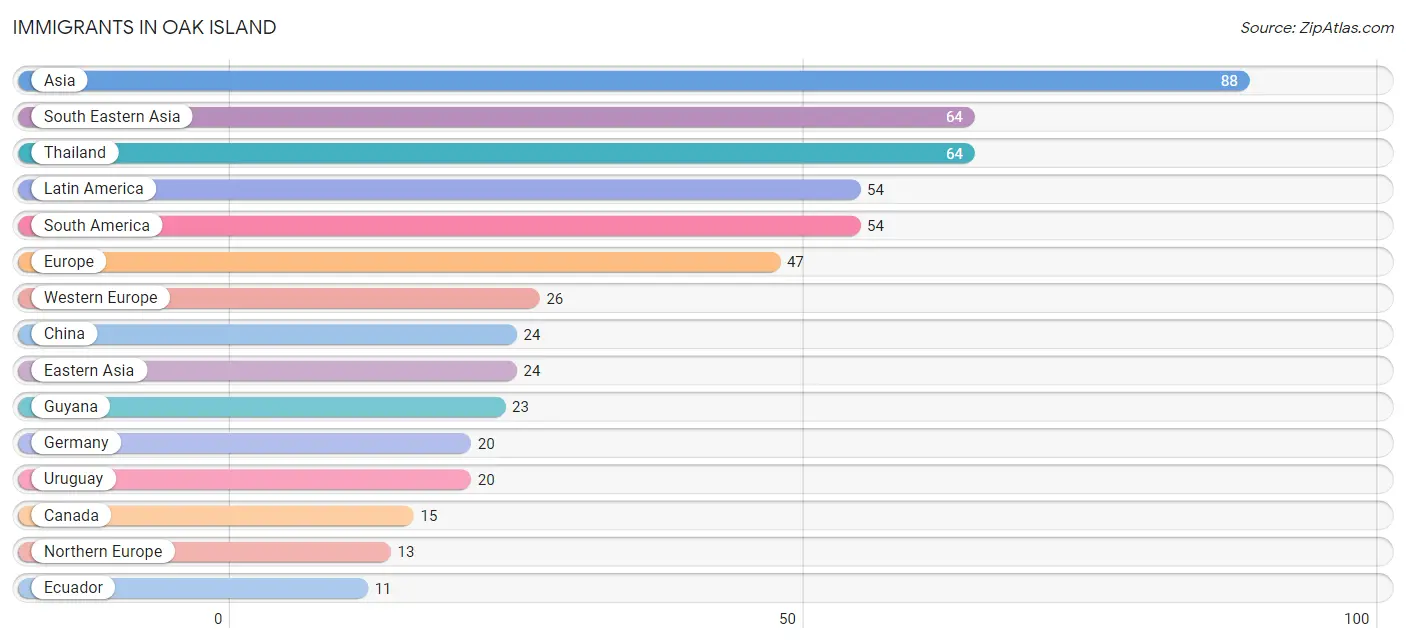
Immigrants in Oak Island
The most numerous immigrant groups reported in Oak Island came from Asia (88 | 1.0%), South Eastern Asia (64 | 0.7%), Thailand (64 | 0.7%), Latin America (54 | 0.6%), and South America (54 | 0.6%), together accounting for 3.8% of all Oak Island residents.
| Immigration Origin | # Population | % Population |
| Asia | 88 | 1.0% |
| Australia | 5 | 0.1% |
| Canada | 15 | 0.2% |
| China | 24 | 0.3% |
| Eastern Asia | 24 | 0.3% |
| Eastern Europe | 8 | 0.1% |
| Ecuador | 11 | 0.1% |
| Europe | 47 | 0.5% |
| Germany | 20 | 0.2% |
| Guyana | 23 | 0.3% |
| Ireland | 2 | 0.0% |
| Latin America | 54 | 0.6% |
| Netherlands | 6 | 0.1% |
| Northern Europe | 13 | 0.2% |
| Oceania | 5 | 0.1% |
| Scotland | 11 | 0.1% |
| South America | 54 | 0.6% |
| South Eastern Asia | 64 | 0.7% |
| Thailand | 64 | 0.7% |
| Ukraine | 8 | 0.1% |
| Uruguay | 20 | 0.2% |
| Western Europe | 26 | 0.3% | View All 22 Rows |
Sex and Age in Oak Island
Sex and Age in Oak Island
The most populous age groups in Oak Island are 60 to 64 Years (630 | 15.2%) for men and 65 to 69 Years (655 | 14.8%) for women.
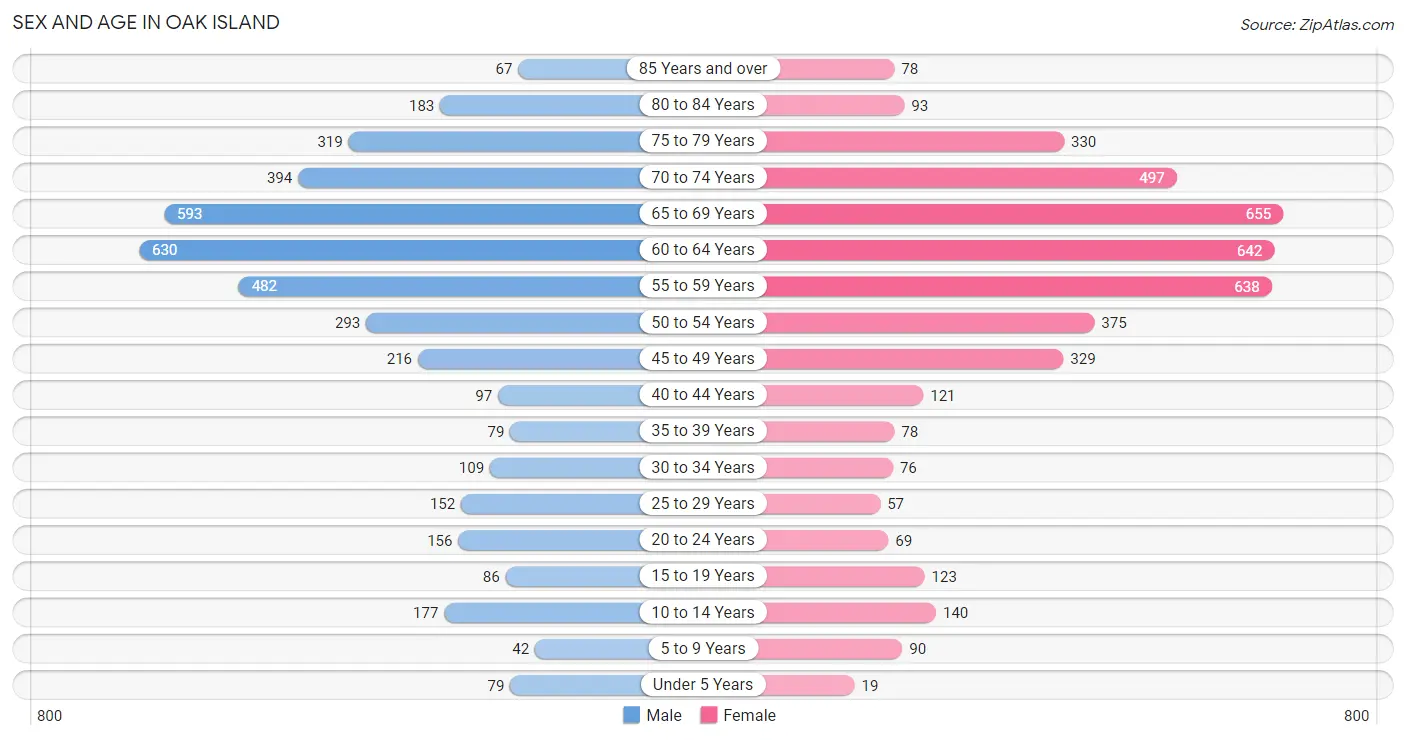
| Age Bracket | Male | Female |
| Under 5 Years | 79 (1.9%) | 19 (0.4%) |
| 5 to 9 Years | 42 (1.0%) | 90 (2.0%) |
| 10 to 14 Years | 177 (4.3%) | 140 (3.2%) |
| 15 to 19 Years | 86 (2.1%) | 123 (2.8%) |
| 20 to 24 Years | 156 (3.8%) | 69 (1.6%) |
| 25 to 29 Years | 152 (3.7%) | 57 (1.3%) |
| 30 to 34 Years | 109 (2.6%) | 76 (1.7%) |
| 35 to 39 Years | 79 (1.9%) | 78 (1.8%) |
| 40 to 44 Years | 97 (2.3%) | 121 (2.7%) |
| 45 to 49 Years | 216 (5.2%) | 329 (7.5%) |
| 50 to 54 Years | 293 (7.0%) | 375 (8.5%) |
| 55 to 59 Years | 482 (11.6%) | 638 (14.5%) |
| 60 to 64 Years | 630 (15.2%) | 642 (14.6%) |
| 65 to 69 Years | 593 (14.3%) | 655 (14.8%) |
| 70 to 74 Years | 394 (9.5%) | 497 (11.3%) |
| 75 to 79 Years | 319 (7.7%) | 330 (7.5%) |
| 80 to 84 Years | 183 (4.4%) | 93 (2.1%) |
| 85 Years and over | 67 (1.6%) | 78 (1.8%) |
| Total | 4,154 (100.0%) | 4,410 (100.0%) |
Families and Households in Oak Island
Median Family Size in Oak Island
The median family size in Oak Island is 2.50 persons per family, with single female/mother families (197 | 7.4%) accounting for the largest median family size of 3.68 persons per family. On the other hand, married-couple families (2,362 | 88.7%) represent the smallest median family size with 2.39 persons per family.
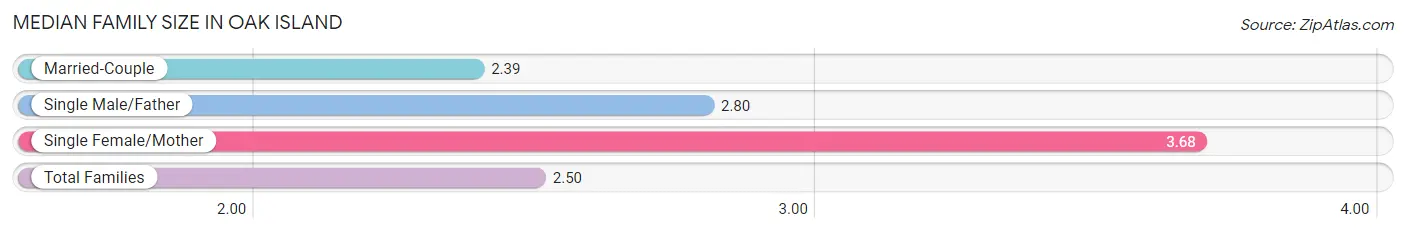
| Family Type | # Families | Family Size |
| Married-Couple | 2,362 (88.7%) | 2.39 |
| Single Male/Father | 103 (3.9%) | 2.80 |
| Single Female/Mother | 197 (7.4%) | 3.68 |
| Total Families | 2,662 (100.0%) | 2.50 |
Median Household Size in Oak Island
The median household size in Oak Island is 2.12 persons per household, with single female/mother households (197 | 4.9%) accounting for the largest median household size of 4.15 persons per household. non-family households (1,386 | 34.2%) represent the smallest median household size with 1.22 persons per household.
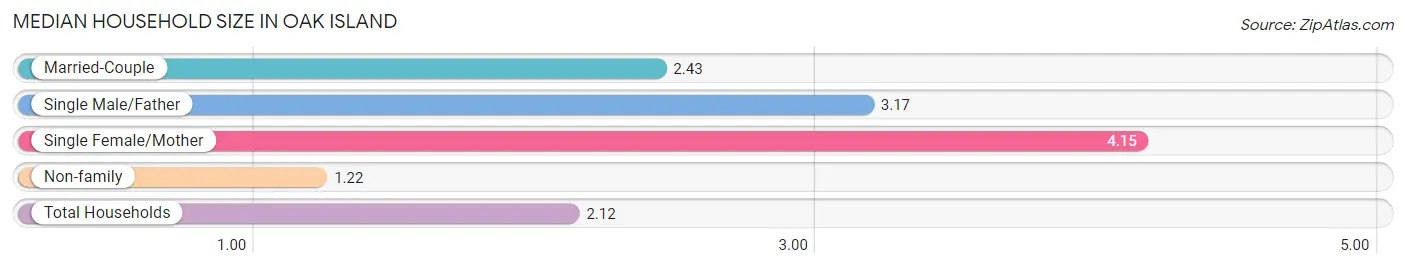
| Household Type | # Households | Household Size |
| Married-Couple | 2,362 (58.4%) | 2.43 |
| Single Male/Father | 103 (2.5%) | 3.17 |
| Single Female/Mother | 197 (4.9%) | 4.15 |
| Non-family | 1,386 (34.2%) | 1.22 |
| Total Households | 4,048 (100.0%) | 2.12 |
Household Size by Marriage Status in Oak Island
Out of a total of 4,048 households in Oak Island, 2,662 (65.8%) are family households, while 1,386 (34.2%) are nonfamily households. The most numerous type of family households are 2-person households, comprising 1,979, and the most common type of nonfamily households are 1-person households, comprising 1,109.
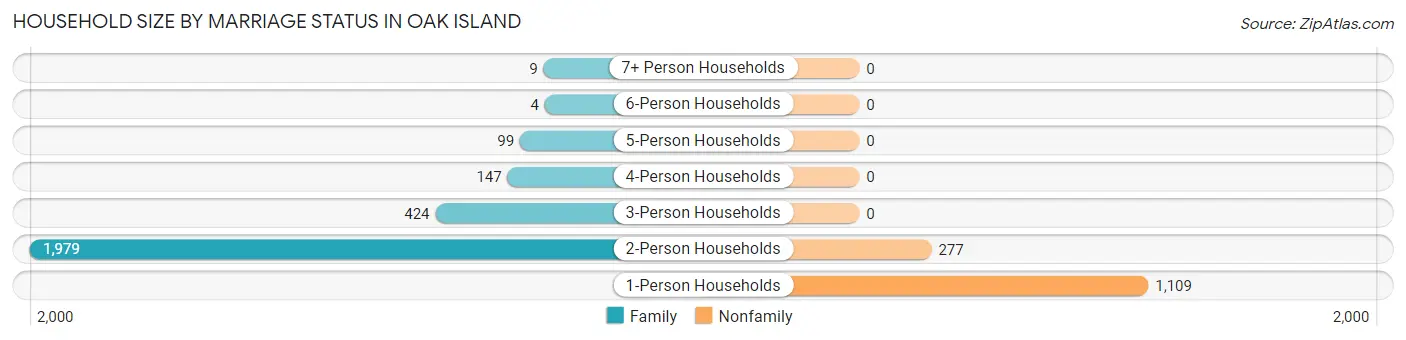
| Household Size | Family Households | Nonfamily Households |
| 1-Person Households | - | 1,109 (27.4%) |
| 2-Person Households | 1,979 (48.9%) | 277 (6.8%) |
| 3-Person Households | 424 (10.5%) | 0 (0.0%) |
| 4-Person Households | 147 (3.6%) | 0 (0.0%) |
| 5-Person Households | 99 (2.5%) | 0 (0.0%) |
| 6-Person Households | 4 (0.1%) | 0 (0.0%) |
| 7+ Person Households | 9 (0.2%) | 0 (0.0%) |
| Total | 2,662 (65.8%) | 1,386 (34.2%) |
Female Fertility in Oak Island
Fertility by Age in Oak Island
Average fertility rate in Oak Island is 71.0 births per 1,000 women. Women in the age bracket of 20 to 34 years have the highest fertility rate with 158.0 births per 1,000 women. Women in the age bracket of 20 to 34 years acount for 50.8% of all women with births.
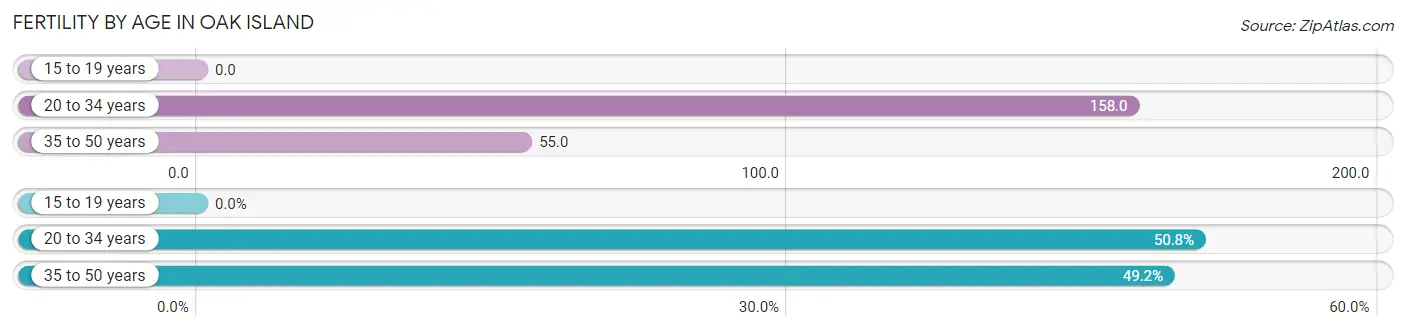
| Age Bracket | Women with Births | Births / 1,000 Women |
| 15 to 19 years | 0 (0.0%) | 0.0 |
| 20 to 34 years | 32 (50.8%) | 158.0 |
| 35 to 50 years | 31 (49.2%) | 55.0 |
| Total | 63 (100.0%) | 71.0 |
Fertility by Age by Marriage Status in Oak Island
12.7% of women with births (63) in Oak Island are married. The highest percentage of unmarried women with births falls into 20 to 34 years age bracket with 100.0% of them unmarried at the time of birth, while the lowest percentage of unmarried women with births belong to 35 to 50 years age bracket with 74.2% of them unmarried.
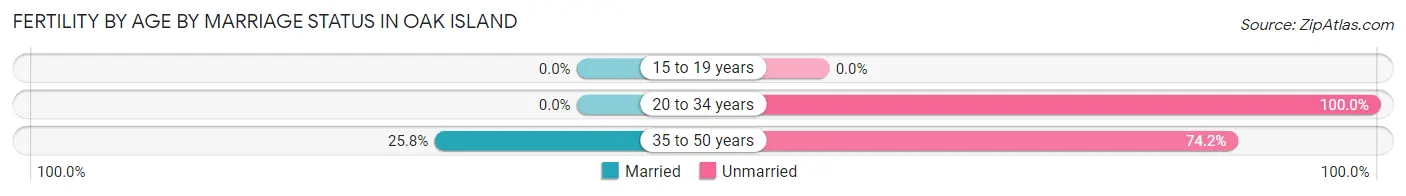
| Age Bracket | Married | Unmarried |
| 15 to 19 years | 0 (0.0%) | 0 (0.0%) |
| 20 to 34 years | 0 (0.0%) | 32 (100.0%) |
| 35 to 50 years | 8 (25.8%) | 23 (74.2%) |
| Total | 8 (12.7%) | 55 (87.3%) |
Fertility by Education in Oak Island
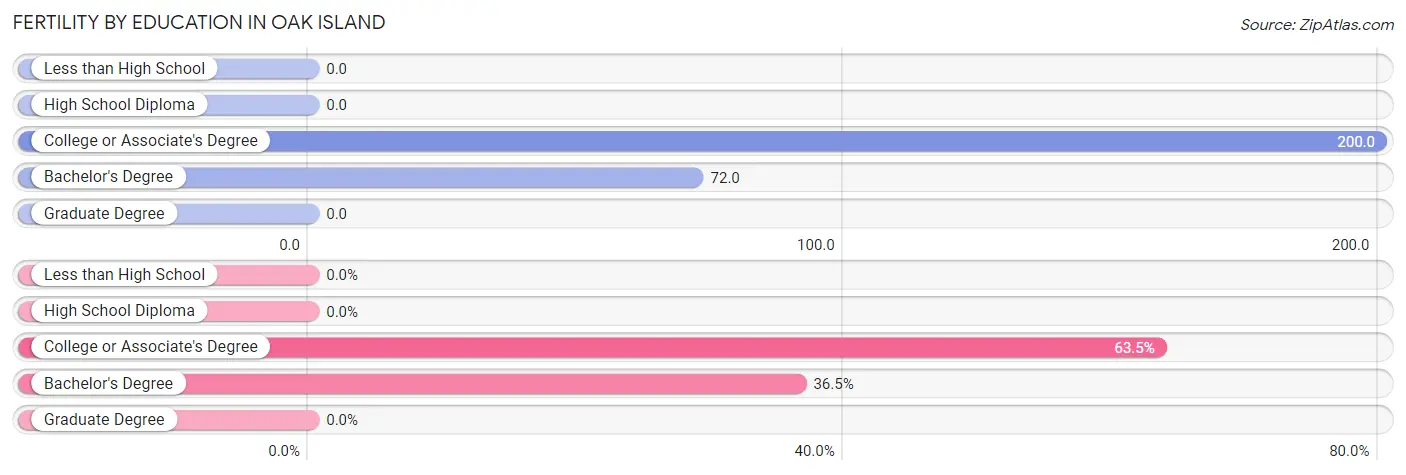
| Educational Attainment | Women with Births | Births / 1,000 Women |
| Less than High School | 0 (0.0%) | 0.0 |
| High School Diploma | 0 (0.0%) | 0.0 |
| College or Associate's Degree | 40 (63.5%) | 200.0 |
| Bachelor's Degree | 23 (36.5%) | 72.0 |
| Graduate Degree | 0 (0.0%) | 0.0 |
| Total | 63 (100.0%) | 71.0 |
Fertility by Education by Marriage Status in Oak Island
87.3% of women with births in Oak Island are unmarried. Women with the educational attainment of college or associate's degree are most likely to be married with 20.0% of them married at childbirth, while women with the educational attainment of bachelor's degree are least likely to be married with 100.0% of them unmarried at childbirth.
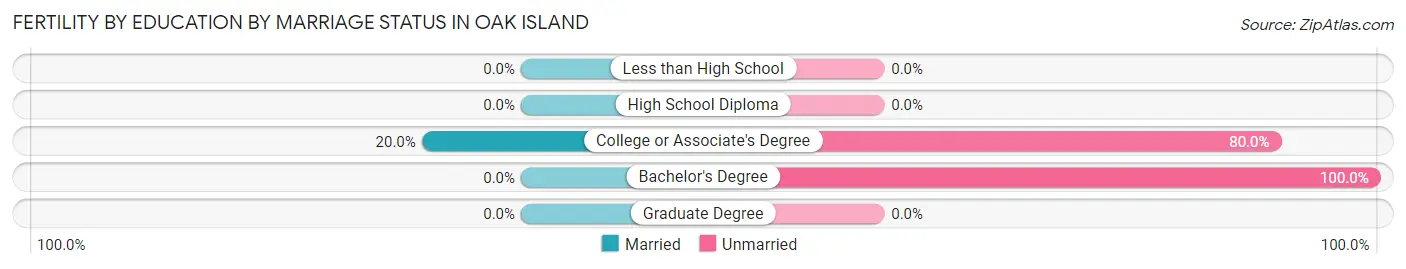
| Educational Attainment | Married | Unmarried |
| Less than High School | 0 (0.0%) | 0 (0.0%) |
| High School Diploma | 0 (0.0%) | 0 (0.0%) |
| College or Associate's Degree | 8 (20.0%) | 32 (80.0%) |
| Bachelor's Degree | 0 (0.0%) | 23 (100.0%) |
| Graduate Degree | 0 (0.0%) | 0 (0.0%) |
| Total | 8 (12.7%) | 55 (87.3%) |
Employment Characteristics in Oak Island
Employment by Class of Employer in Oak Island
Among the 3,531 employed individuals in Oak Island, private company employees (1,927 | 54.6%), local government employees (372 | 10.5%), and self-employed (incorporated) (315 | 8.9%) make up the most common classes of employment.
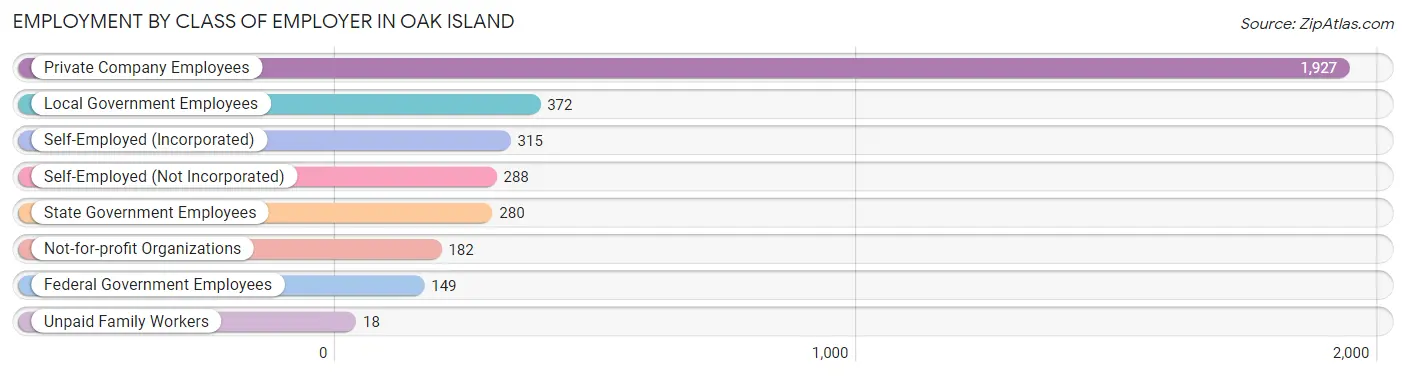
| Employer Class | # Employees | % Employees |
| Private Company Employees | 1,927 | 54.6% |
| Self-Employed (Incorporated) | 315 | 8.9% |
| Self-Employed (Not Incorporated) | 288 | 8.2% |
| Not-for-profit Organizations | 182 | 5.1% |
| Local Government Employees | 372 | 10.5% |
| State Government Employees | 280 | 7.9% |
| Federal Government Employees | 149 | 4.2% |
| Unpaid Family Workers | 18 | 0.5% |
| Total | 3,531 | 100.0% |
Employment Status by Age in Oak Island
According to the labor force statistics for Oak Island, out of the total population over 16 years of age (7,885), 48.5% or 3,824 individuals are in the labor force, with 4.9% or 187 of them unemployed. The age group with the highest labor force participation rate is 30 to 34 years, with 89.7% or 166 individuals in the labor force. Within the labor force, the 25 to 29 years age range has the highest percentage of unemployed individuals, with 35.7% or 61 of them being unemployed.
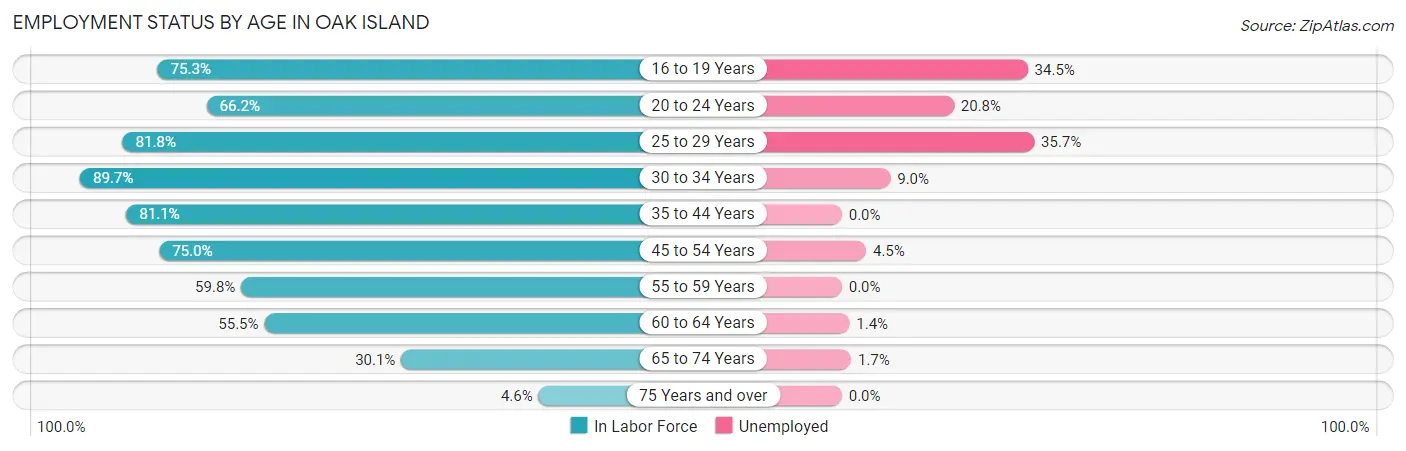
| Age Bracket | In Labor Force | Unemployed |
| 16 to 19 Years | 58 (75.3%) | 20 (34.5%) |
| 20 to 24 Years | 149 (66.2%) | 31 (20.8%) |
| 25 to 29 Years | 171 (81.8%) | 61 (35.7%) |
| 30 to 34 Years | 166 (89.7%) | 15 (9.0%) |
| 35 to 44 Years | 304 (81.1%) | 0 (0.0%) |
| 45 to 54 Years | 910 (75.0%) | 41 (4.5%) |
| 55 to 59 Years | 670 (59.8%) | 0 (0.0%) |
| 60 to 64 Years | 706 (55.5%) | 10 (1.4%) |
| 65 to 74 Years | 644 (30.1%) | 11 (1.7%) |
| 75 Years and over | 49 (4.6%) | 0 (0.0%) |
| Total | 3,824 (48.5%) | 187 (4.9%) |
Employment Status by Educational Attainment in Oak Island
According to labor force statistics for Oak Island, 66.9% of individuals (2,926) out of the total population between 25 and 64 years of age (4,374) are in the labor force, with 4.3% or 126 of them being unemployed. The group with the highest labor force participation rate are those with the educational attainment of college / associate degree, with 74.6% or 1,082 individuals in the labor force. Within the labor force, individuals with college / associate degree education have the highest percentage of unemployment, with 10.3% or 111 of them being unemployed.
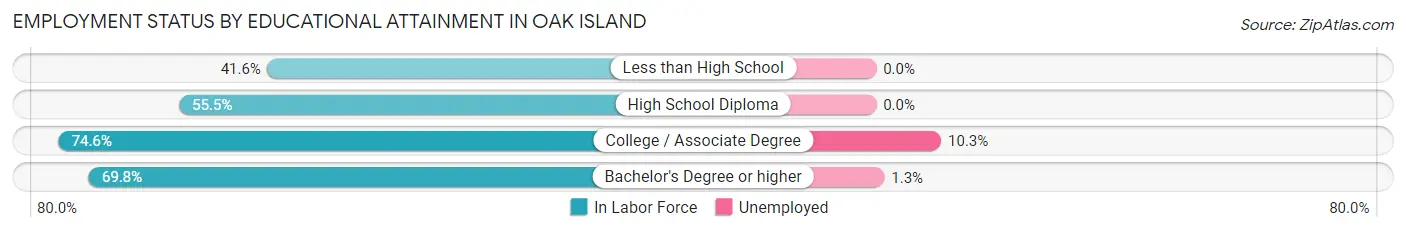
| Educational Attainment | In Labor Force | Unemployed |
| Less than High School | 69 (41.6%) | 0 (0.0%) |
| High School Diploma | 580 (55.5%) | 0 (0.0%) |
| College / Associate Degree | 1,082 (74.6%) | 149 (10.3%) |
| Bachelor's Degree or higher | 1,196 (69.8%) | 22 (1.3%) |
| Total | 2,926 (66.9%) | 188 (4.3%) |
Employment Occupations by Sex in Oak Island
Management, Business, Science and Arts Occupations
The most common Management, Business, Science and Arts occupations in Oak Island are Management (651 | 17.9%), Business & Financial (314 | 8.6%), Community & Social Service (213 | 5.9%), Computers, Engineering & Science (195 | 5.4%), and Health Diagnosing & Treating (184 | 5.1%).
Management, Business, Science and Arts Occupations by Sex
Within the Management, Business, Science and Arts occupations in Oak Island, the most male-oriented occupations are Architecture & Engineering (84.8%), Life, Physical & Social Science (68.3%), and Computers, Engineering & Science (65.6%), while the most female-oriented occupations are Health Diagnosing & Treating (96.7%), Health Technologists (95.9%), and Education Instruction & Library (91.1%).
| Occupation | Male | Female |
| Management | 333 (51.1%) | 318 (48.8%) |
| Business & Financial | 70 (22.3%) | 244 (77.7%) |
| Computers, Engineering & Science | 128 (65.6%) | 67 (34.4%) |
| Computers & Mathematics | 48 (53.9%) | 41 (46.1%) |
| Architecture & Engineering | 39 (84.8%) | 7 (15.2%) |
| Life, Physical & Social Science | 41 (68.3%) | 19 (31.7%) |
| Community & Social Service | 39 (18.3%) | 174 (81.7%) |
| Education, Arts & Media | 5 (11.1%) | 40 (88.9%) |
| Legal Services & Support | 7 (53.8%) | 6 (46.2%) |
| Education Instruction & Library | 10 (8.9%) | 102 (91.1%) |
| Arts, Media & Entertainment | 17 (39.5%) | 26 (60.5%) |
| Health Diagnosing & Treating | 6 (3.3%) | 178 (96.7%) |
| Health Technologists | 6 (4.1%) | 139 (95.9%) |
| Total (Category) | 576 (37.0%) | 981 (63.0%) |
| Total (Overall) | 1,853 (50.9%) | 1,785 (49.1%) |
Services Occupations
The most common Services occupations in Oak Island are Cleaning & Maintenance (269 | 7.4%), Security & Protection (193 | 5.3%), Food Preparation & Serving (122 | 3.4%), Law Enforcement (101 | 2.8%), and Firefighting & Prevention (92 | 2.5%).
Services Occupations by Sex
Within the Services occupations in Oak Island, the most male-oriented occupations are Firefighting & Prevention (100.0%), Security & Protection (81.4%), and Food Preparation & Serving (68.9%), while the most female-oriented occupations are Healthcare Support (80.9%), Personal Care & Service (68.8%), and Law Enforcement (35.6%).
| Occupation | Male | Female |
| Healthcare Support | 12 (19.1%) | 51 (80.9%) |
| Security & Protection | 157 (81.4%) | 36 (18.6%) |
| Firefighting & Prevention | 92 (100.0%) | 0 (0.0%) |
| Law Enforcement | 65 (64.4%) | 36 (35.6%) |
| Food Preparation & Serving | 84 (68.9%) | 38 (31.1%) |
| Cleaning & Maintenance | 179 (66.5%) | 90 (33.5%) |
| Personal Care & Service | 5 (31.2%) | 11 (68.8%) |
| Total (Category) | 437 (65.9%) | 226 (34.1%) |
| Total (Overall) | 1,853 (50.9%) | 1,785 (49.1%) |
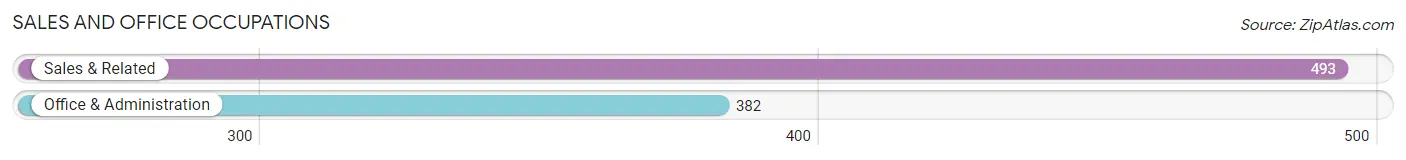
Sales and Office Occupations
The most common Sales and Office occupations in Oak Island are Sales & Related (493 | 13.6%), and Office & Administration (382 | 10.5%).
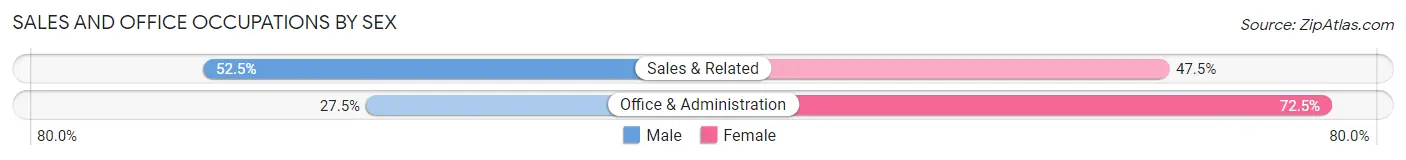
Sales and Office Occupations by Sex
| Occupation | Male | Female |
| Sales & Related | 259 (52.5%) | 234 (47.5%) |
| Office & Administration | 105 (27.5%) | 277 (72.5%) |
| Total (Category) | 364 (41.6%) | 511 (58.4%) |
| Total (Overall) | 1,853 (50.9%) | 1,785 (49.1%) |
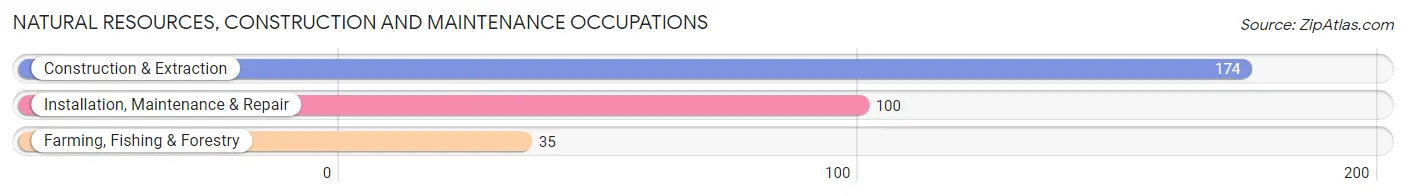
Natural Resources, Construction and Maintenance Occupations
The most common Natural Resources, Construction and Maintenance occupations in Oak Island are Construction & Extraction (174 | 4.8%), Installation, Maintenance & Repair (100 | 2.8%), and Farming, Fishing & Forestry (35 | 1.0%).
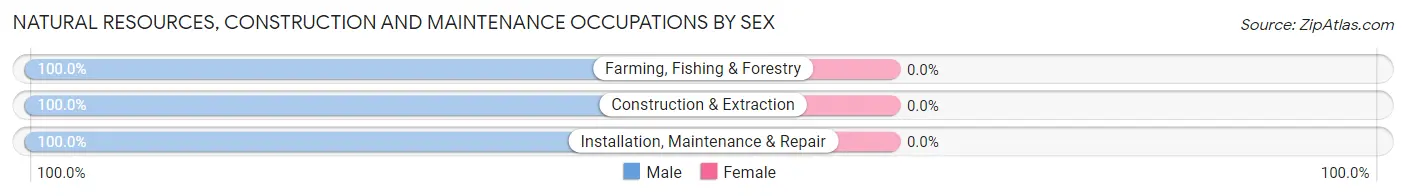
Natural Resources, Construction and Maintenance Occupations by Sex
| Occupation | Male | Female |
| Farming, Fishing & Forestry | 35 (100.0%) | 0 (0.0%) |
| Construction & Extraction | 174 (100.0%) | 0 (0.0%) |
| Installation, Maintenance & Repair | 100 (100.0%) | 0 (0.0%) |
| Total (Category) | 309 (100.0%) | 0 (0.0%) |
| Total (Overall) | 1,853 (50.9%) | 1,785 (49.1%) |
Production, Transportation and Moving Occupations
The most common Production, Transportation and Moving occupations in Oak Island are Production (131 | 3.6%), Transportation (80 | 2.2%), and Material Moving (23 | 0.6%).
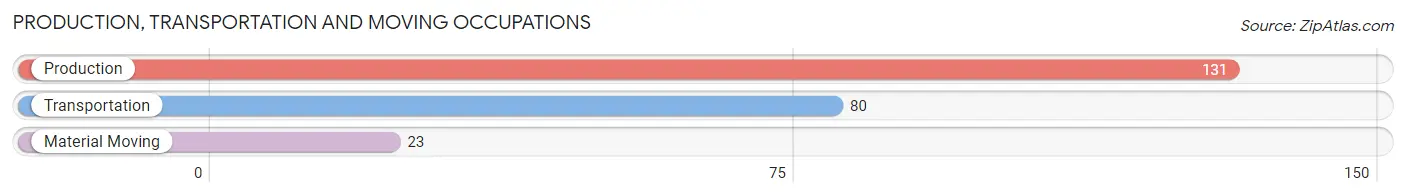
Production, Transportation and Moving Occupations by Sex
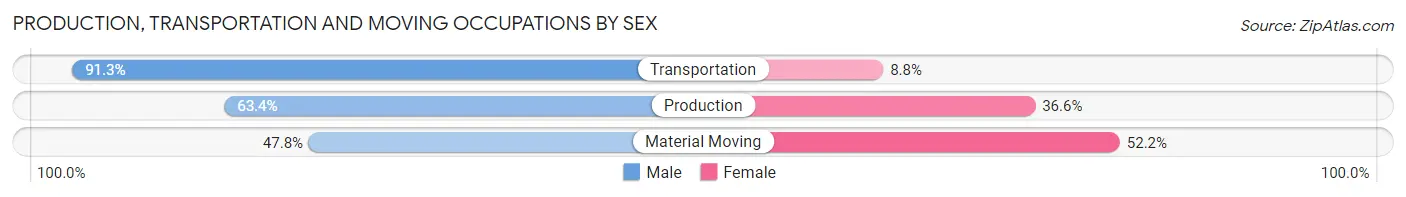
| Occupation | Male | Female |
| Production | 83 (63.4%) | 48 (36.6%) |
| Transportation | 73 (91.2%) | 7 (8.7%) |
| Material Moving | 11 (47.8%) | 12 (52.2%) |
| Total (Category) | 167 (71.4%) | 67 (28.6%) |
| Total (Overall) | 1,853 (50.9%) | 1,785 (49.1%) |
Employment Industries by Sex in Oak Island
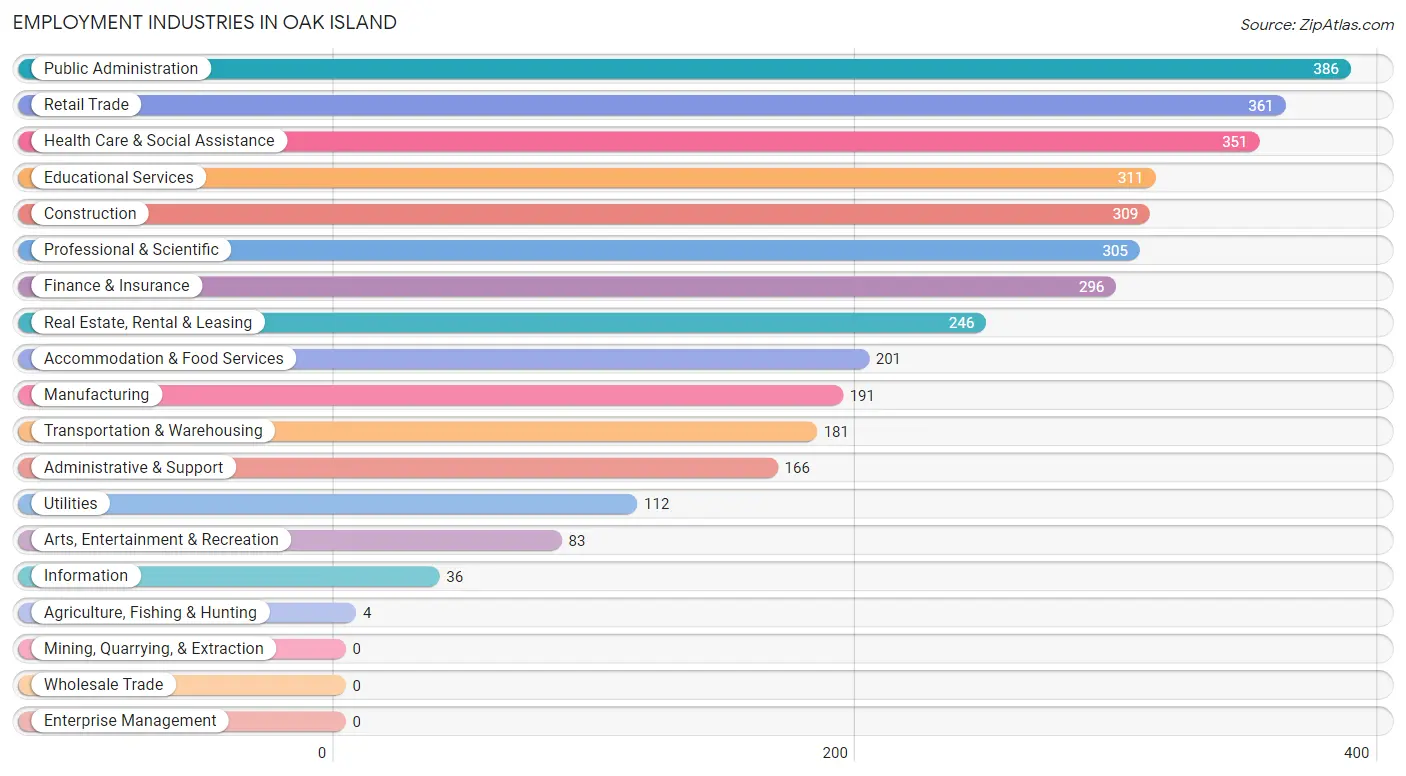
Employment Industries in Oak Island
The major employment industries in Oak Island include Public Administration (386 | 10.6%), Retail Trade (361 | 9.9%), Health Care & Social Assistance (351 | 9.7%), Educational Services (311 | 8.6%), and Construction (309 | 8.5%).
Employment Industries by Sex in Oak Island
The Oak Island industries that see more men than women are Agriculture, Fishing & Hunting (100.0%), Administrative & Support (89.8%), and Manufacturing (85.9%), whereas the industries that tend to have a higher number of women are Health Care & Social Assistance (75.8%), Real Estate, Rental & Leasing (72.8%), and Finance & Insurance (71.3%).
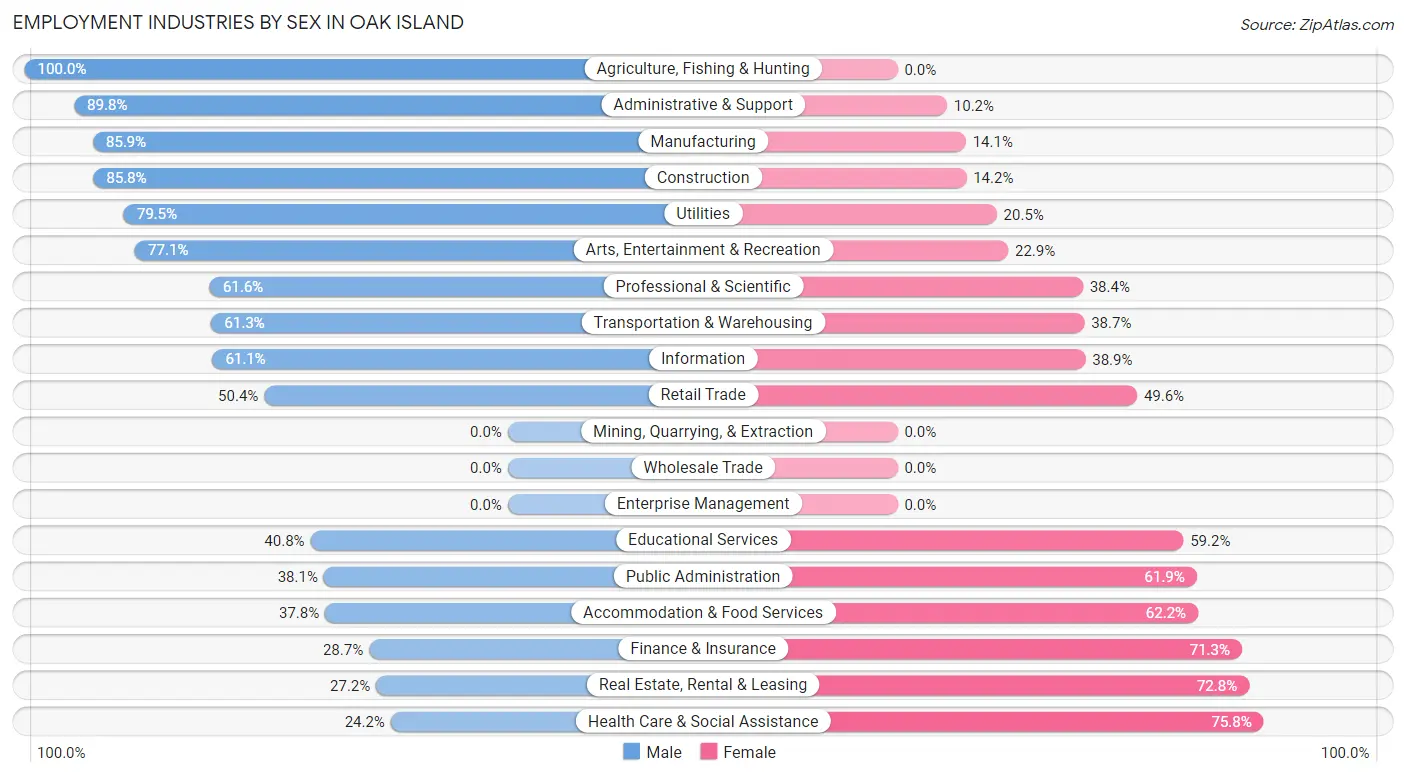
| Industry | Male | Female |
| Agriculture, Fishing & Hunting | 4 (100.0%) | 0 (0.0%) |
| Mining, Quarrying, & Extraction | 0 (0.0%) | 0 (0.0%) |
| Construction | 265 (85.8%) | 44 (14.2%) |
| Manufacturing | 164 (85.9%) | 27 (14.1%) |
| Wholesale Trade | 0 (0.0%) | 0 (0.0%) |
| Retail Trade | 182 (50.4%) | 179 (49.6%) |
| Transportation & Warehousing | 111 (61.3%) | 70 (38.7%) |
| Utilities | 89 (79.5%) | 23 (20.5%) |
| Information | 22 (61.1%) | 14 (38.9%) |
| Finance & Insurance | 85 (28.7%) | 211 (71.3%) |
| Real Estate, Rental & Leasing | 67 (27.2%) | 179 (72.8%) |
| Professional & Scientific | 188 (61.6%) | 117 (38.4%) |
| Enterprise Management | 0 (0.0%) | 0 (0.0%) |
| Administrative & Support | 149 (89.8%) | 17 (10.2%) |
| Educational Services | 127 (40.8%) | 184 (59.2%) |
| Health Care & Social Assistance | 85 (24.2%) | 266 (75.8%) |
| Arts, Entertainment & Recreation | 64 (77.1%) | 19 (22.9%) |
| Accommodation & Food Services | 76 (37.8%) | 125 (62.2%) |
| Public Administration | 147 (38.1%) | 239 (61.9%) |
| Total | 1,853 (50.9%) | 1,785 (49.1%) |
Education in Oak Island
School Enrollment in Oak Island
The most common levels of schooling among the 788 students in Oak Island are middle school (266 | 33.8%), high school (176 | 22.3%), and elementary school (156 | 19.8%).
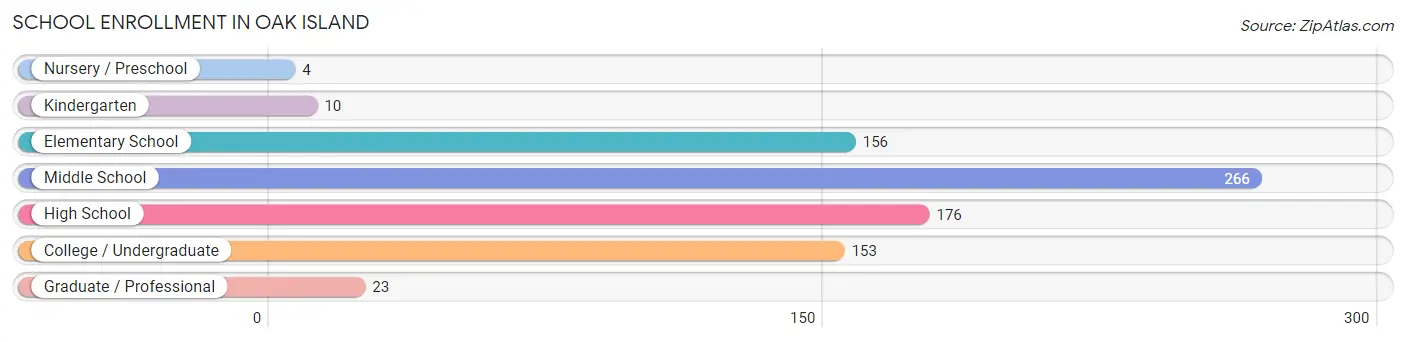
| School Level | # Students | % Students |
| Nursery / Preschool | 4 | 0.5% |
| Kindergarten | 10 | 1.3% |
| Elementary School | 156 | 19.8% |
| Middle School | 266 | 33.8% |
| High School | 176 | 22.3% |
| College / Undergraduate | 153 | 19.4% |
| Graduate / Professional | 23 | 2.9% |
| Total | 788 | 100.0% |
School Enrollment by Age by Funding Source in Oak Island
Out of a total of 788 students who are enrolled in schools in Oak Island, 264 (33.5%) attend a private institution, while the remaining 524 (66.5%) are enrolled in public schools. The age group of 18 to 19 year olds has the highest likelihood of being enrolled in private schools, with 2 (100.0% in the age bracket) enrolled. Conversely, the age group of 25 to 34 year olds has the lowest likelihood of being enrolled in a private school, with 6 (100.0% in the age bracket) attending a public institution.
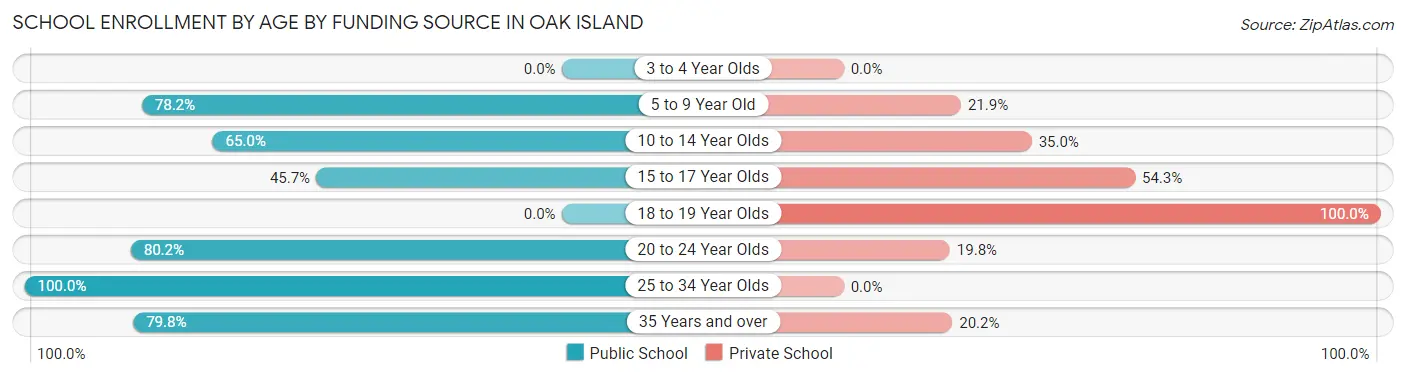
| Age Bracket | Public School | Private School |
| 3 to 4 Year Olds | 0 (0.0%) | 0 (0.0%) |
| 5 to 9 Year Old | 93 (78.1%) | 26 (21.8%) |
| 10 to 14 Year Olds | 206 (65.0%) | 111 (35.0%) |
| 15 to 17 Year Olds | 75 (45.7%) | 89 (54.3%) |
| 18 to 19 Year Olds | 0 (0.0%) | 2 (100.0%) |
| 20 to 24 Year Olds | 77 (80.2%) | 19 (19.8%) |
| 25 to 34 Year Olds | 6 (100.0%) | 0 (0.0%) |
| 35 Years and over | 67 (79.8%) | 17 (20.2%) |
| Total | 524 (66.5%) | 264 (33.5%) |
Educational Attainment by Field of Study in Oak Island
Business (580 | 18.2%), science & technology (572 | 17.9%), education (515 | 16.1%), arts & humanities (263 | 8.2%), and engineering (259 | 8.1%) are the most common fields of study among 3,192 individuals in Oak Island who have obtained a bachelor's degree or higher.
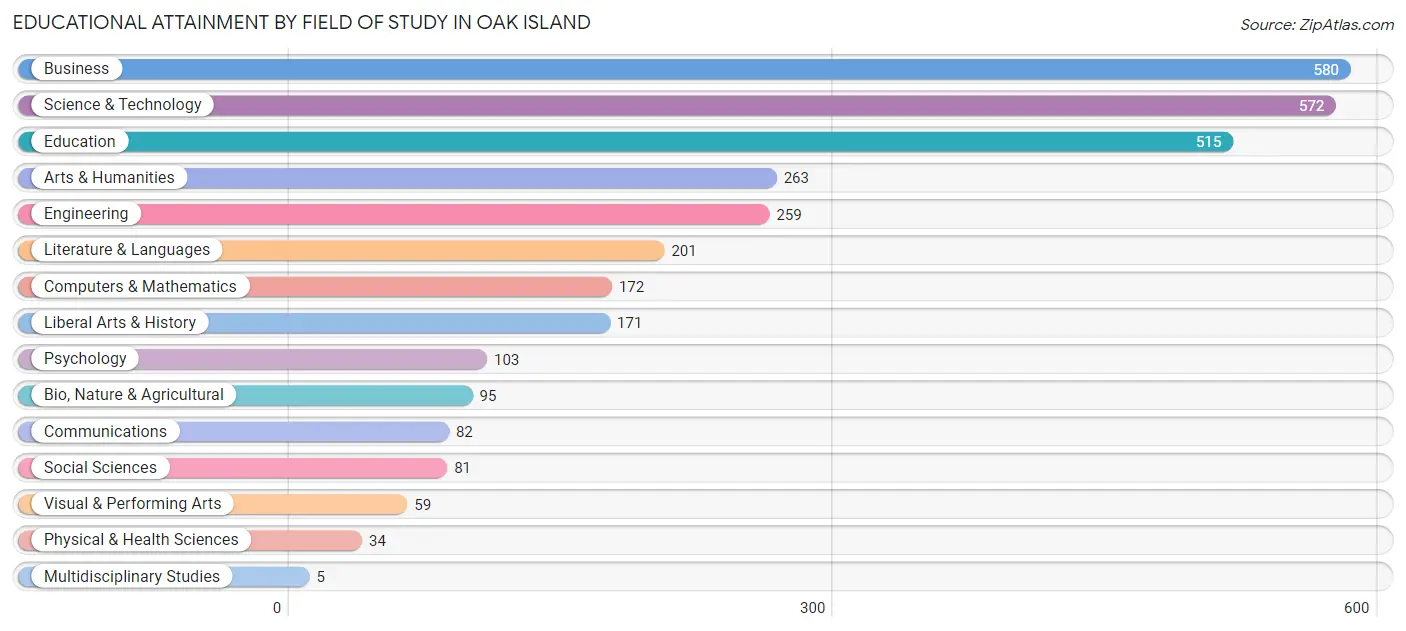
| Field of Study | # Graduates | % Graduates |
| Computers & Mathematics | 172 | 5.4% |
| Bio, Nature & Agricultural | 95 | 3.0% |
| Physical & Health Sciences | 34 | 1.1% |
| Psychology | 103 | 3.2% |
| Social Sciences | 81 | 2.5% |
| Engineering | 259 | 8.1% |
| Multidisciplinary Studies | 5 | 0.2% |
| Science & Technology | 572 | 17.9% |
| Business | 580 | 18.2% |
| Education | 515 | 16.1% |
| Literature & Languages | 201 | 6.3% |
| Liberal Arts & History | 171 | 5.4% |
| Visual & Performing Arts | 59 | 1.8% |
| Communications | 82 | 2.6% |
| Arts & Humanities | 263 | 8.2% |
| Total | 3,192 | 100.0% |
Transportation & Commute in Oak Island
Vehicle Availability by Sex in Oak Island
The most prevalent vehicle ownership categories in Oak Island are males with 2 vehicles (861, accounting for 47.6%) and females with 2 vehicles (835, making up 49.9%).
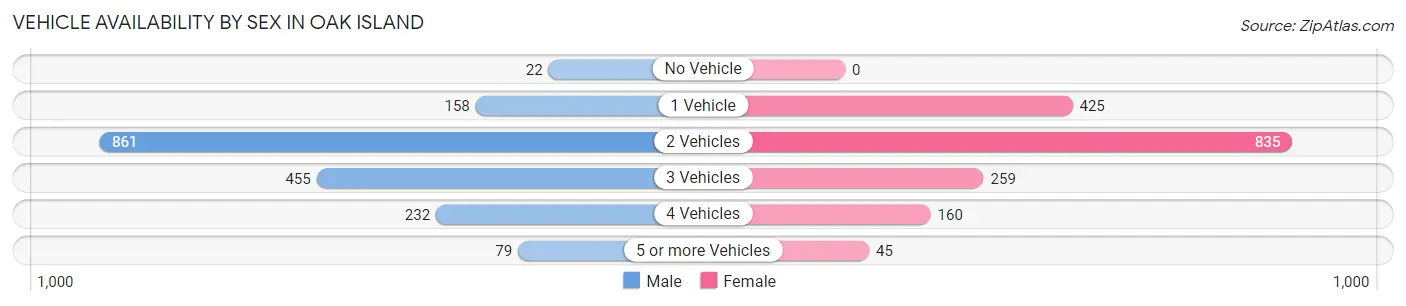
| Vehicles Available | Male | Female |
| No Vehicle | 22 (1.2%) | 0 (0.0%) |
| 1 Vehicle | 158 (8.7%) | 425 (24.6%) |
| 2 Vehicles | 861 (47.6%) | 835 (48.4%) |
| 3 Vehicles | 455 (25.2%) | 259 (15.0%) |
| 4 Vehicles | 232 (12.8%) | 160 (9.3%) |
| 5 or more Vehicles | 79 (4.4%) | 45 (2.6%) |
| Total | 1,807 (100.0%) | 1,724 (100.0%) |
Commute Time in Oak Island
The most frequently occuring commute durations in Oak Island are 15 to 19 minutes (495 commuters, 18.0%), 20 to 24 minutes (435 commuters, 15.8%), and 5 to 9 minutes (382 commuters, 13.9%).
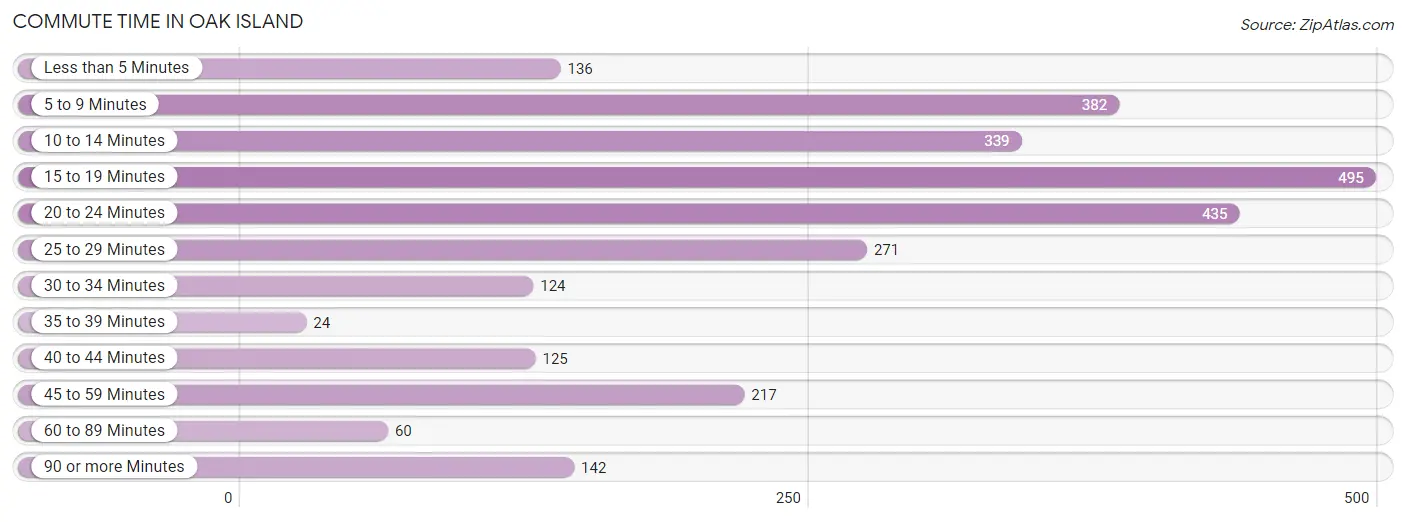
| Commute Time | # Commuters | % Commuters |
| Less than 5 Minutes | 136 | 5.0% |
| 5 to 9 Minutes | 382 | 13.9% |
| 10 to 14 Minutes | 339 | 12.3% |
| 15 to 19 Minutes | 495 | 18.0% |
| 20 to 24 Minutes | 435 | 15.8% |
| 25 to 29 Minutes | 271 | 9.9% |
| 30 to 34 Minutes | 124 | 4.5% |
| 35 to 39 Minutes | 24 | 0.9% |
| 40 to 44 Minutes | 125 | 4.5% |
| 45 to 59 Minutes | 217 | 7.9% |
| 60 to 89 Minutes | 60 | 2.2% |
| 90 or more Minutes | 142 | 5.2% |
Commute Time by Sex in Oak Island
The most common commute times in Oak Island are 15 to 19 minutes (357 commuters, 23.7%) for males and 20 to 24 minutes (244 commuters, 19.6%) for females.
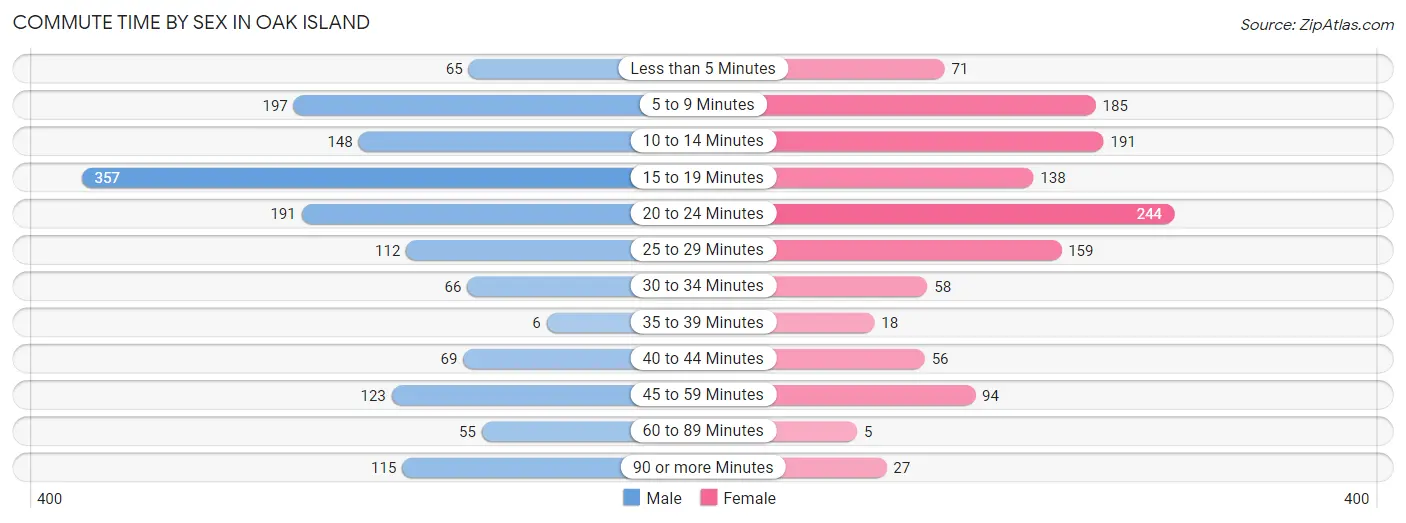
| Commute Time | Male | Female |
| Less than 5 Minutes | 65 (4.3%) | 71 (5.7%) |
| 5 to 9 Minutes | 197 (13.1%) | 185 (14.8%) |
| 10 to 14 Minutes | 148 (9.8%) | 191 (15.3%) |
| 15 to 19 Minutes | 357 (23.7%) | 138 (11.1%) |
| 20 to 24 Minutes | 191 (12.7%) | 244 (19.6%) |
| 25 to 29 Minutes | 112 (7.4%) | 159 (12.8%) |
| 30 to 34 Minutes | 66 (4.4%) | 58 (4.6%) |
| 35 to 39 Minutes | 6 (0.4%) | 18 (1.4%) |
| 40 to 44 Minutes | 69 (4.6%) | 56 (4.5%) |
| 45 to 59 Minutes | 123 (8.2%) | 94 (7.5%) |
| 60 to 89 Minutes | 55 (3.7%) | 5 (0.4%) |
| 90 or more Minutes | 115 (7.6%) | 27 (2.2%) |
Time of Departure to Work by Sex in Oak Island
The most frequent times of departure to work in Oak Island are 7:00 AM to 7:29 AM (276, 18.3%) for males and 7:30 AM to 7:59 AM (249, 20.0%) for females.
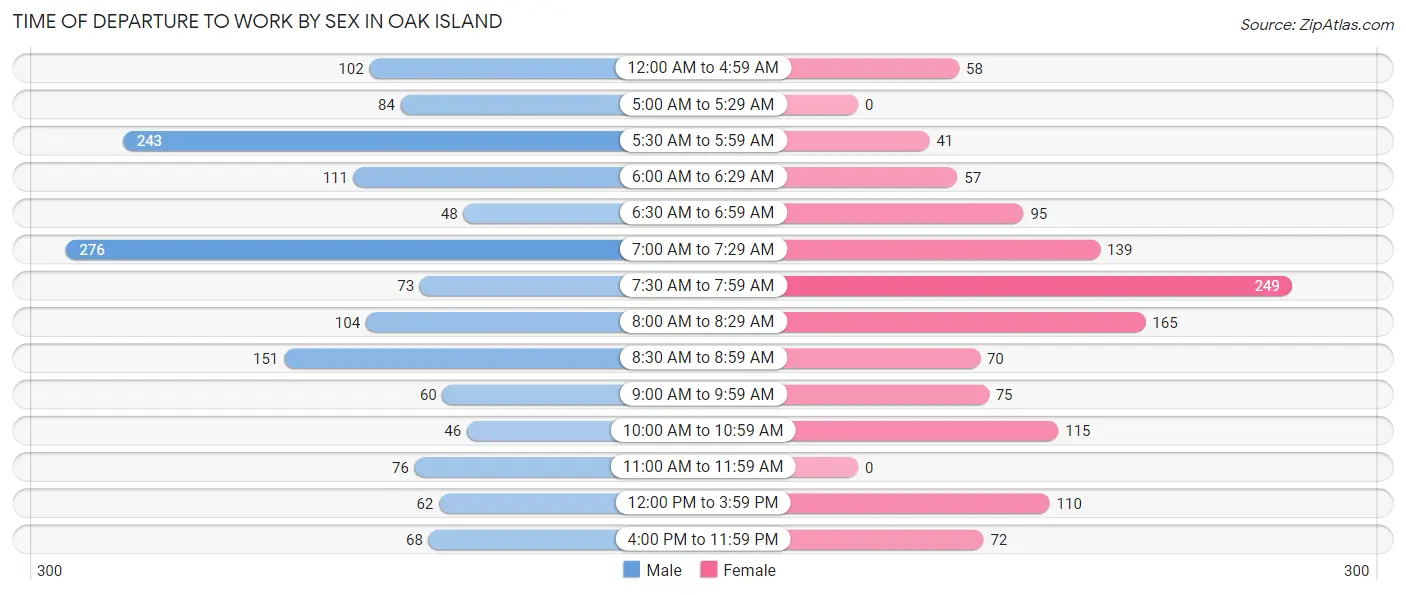
| Time of Departure | Male | Female |
| 12:00 AM to 4:59 AM | 102 (6.8%) | 58 (4.6%) |
| 5:00 AM to 5:29 AM | 84 (5.6%) | 0 (0.0%) |
| 5:30 AM to 5:59 AM | 243 (16.2%) | 41 (3.3%) |
| 6:00 AM to 6:29 AM | 111 (7.4%) | 57 (4.6%) |
| 6:30 AM to 6:59 AM | 48 (3.2%) | 95 (7.6%) |
| 7:00 AM to 7:29 AM | 276 (18.3%) | 139 (11.2%) |
| 7:30 AM to 7:59 AM | 73 (4.9%) | 249 (20.0%) |
| 8:00 AM to 8:29 AM | 104 (6.9%) | 165 (13.2%) |
| 8:30 AM to 8:59 AM | 151 (10.0%) | 70 (5.6%) |
| 9:00 AM to 9:59 AM | 60 (4.0%) | 75 (6.0%) |
| 10:00 AM to 10:59 AM | 46 (3.1%) | 115 (9.2%) |
| 11:00 AM to 11:59 AM | 76 (5.1%) | 0 (0.0%) |
| 12:00 PM to 3:59 PM | 62 (4.1%) | 110 (8.8%) |
| 4:00 PM to 11:59 PM | 68 (4.5%) | 72 (5.8%) |
| Total | 1,504 (100.0%) | 1,246 (100.0%) |
Housing Occupancy in Oak Island
Occupancy by Ownership in Oak Island
Of the total 4,048 dwellings in Oak Island, owner-occupied units account for 3,497 (86.4%), while renter-occupied units make up 551 (13.6%).
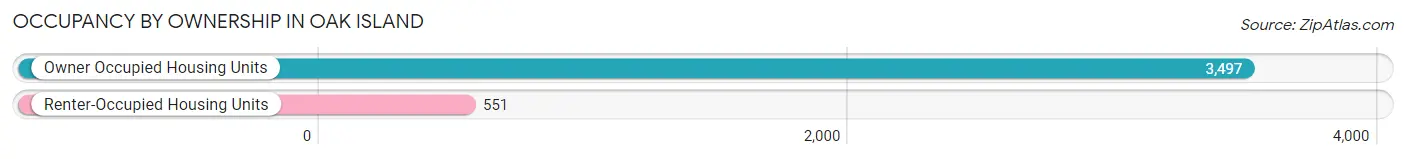
| Occupancy | # Housing Units | % Housing Units |
| Owner Occupied Housing Units | 3,497 | 86.4% |
| Renter-Occupied Housing Units | 551 | 13.6% |
| Total Occupied Housing Units | 4,048 | 100.0% |
Occupancy by Household Size in Oak Island
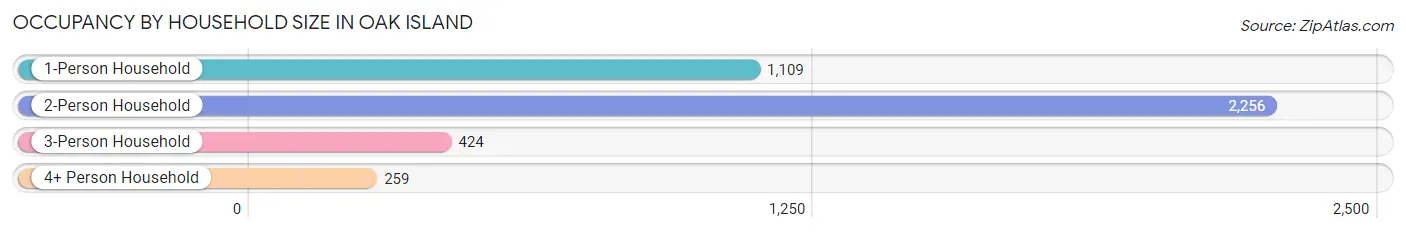
| Household Size | # Housing Units | % Housing Units |
| 1-Person Household | 1,109 | 27.4% |
| 2-Person Household | 2,256 | 55.7% |
| 3-Person Household | 424 | 10.5% |
| 4+ Person Household | 259 | 6.4% |
| Total Housing Units | 4,048 | 100.0% |
Occupancy by Ownership by Household Size in Oak Island
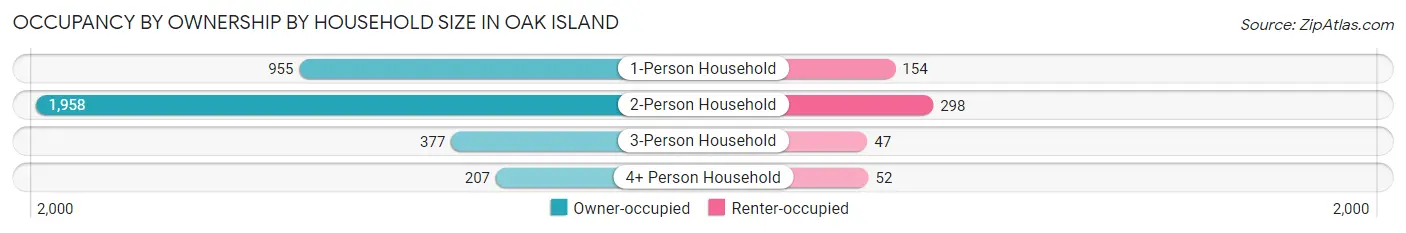
| Household Size | Owner-occupied | Renter-occupied |
| 1-Person Household | 955 (86.1%) | 154 (13.9%) |
| 2-Person Household | 1,958 (86.8%) | 298 (13.2%) |
| 3-Person Household | 377 (88.9%) | 47 (11.1%) |
| 4+ Person Household | 207 (79.9%) | 52 (20.1%) |
| Total Housing Units | 3,497 (86.4%) | 551 (13.6%) |
Occupancy by Educational Attainment in Oak Island
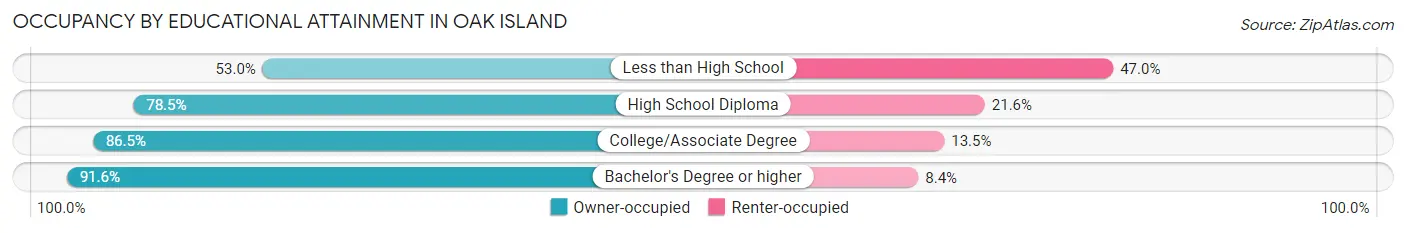
| Household Size | Owner-occupied | Renter-occupied |
| Less than High School | 53 (53.0%) | 47 (47.0%) |
| High School Diploma | 626 (78.4%) | 172 (21.5%) |
| College/Associate Degree | 1,152 (86.5%) | 180 (13.5%) |
| Bachelor's Degree or higher | 1,666 (91.6%) | 152 (8.4%) |
Occupancy by Age of Householder in Oak Island
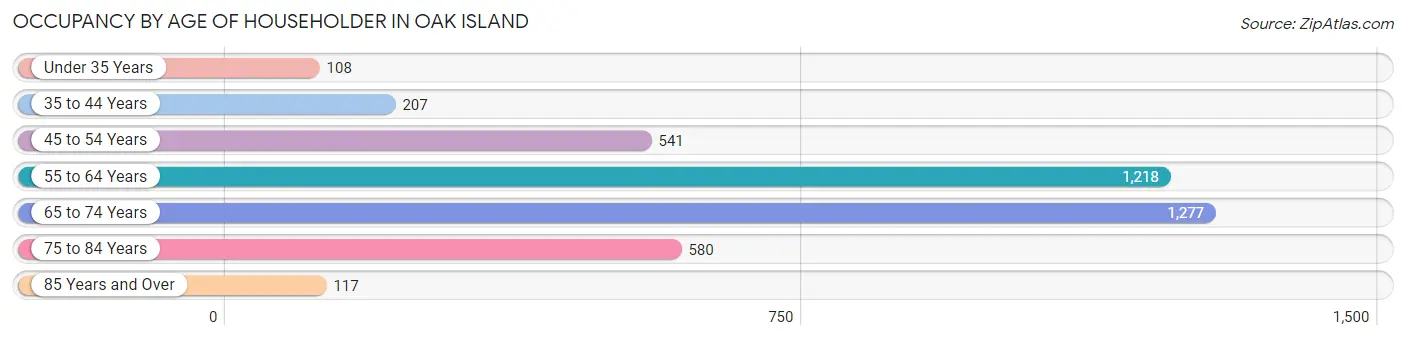
| Age Bracket | # Households | % Households |
| Under 35 Years | 108 | 2.7% |
| 35 to 44 Years | 207 | 5.1% |
| 45 to 54 Years | 541 | 13.4% |
| 55 to 64 Years | 1,218 | 30.1% |
| 65 to 74 Years | 1,277 | 31.6% |
| 75 to 84 Years | 580 | 14.3% |
| 85 Years and Over | 117 | 2.9% |
| Total | 4,048 | 100.0% |
Housing Finances in Oak Island
Median Income by Occupancy in Oak Island
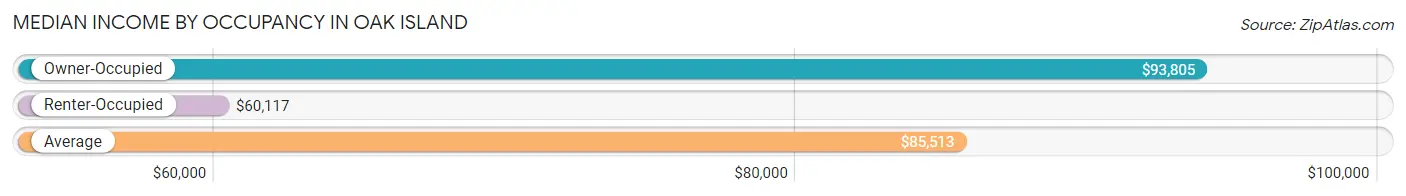
| Occupancy Type | # Households | Median Income |
| Owner-Occupied | 3,497 (86.4%) | $93,805 |
| Renter-Occupied | 551 (13.6%) | $60,117 |
| Average | 4,048 (100.0%) | $85,513 |
Occupancy by Householder Income Bracket in Oak Island
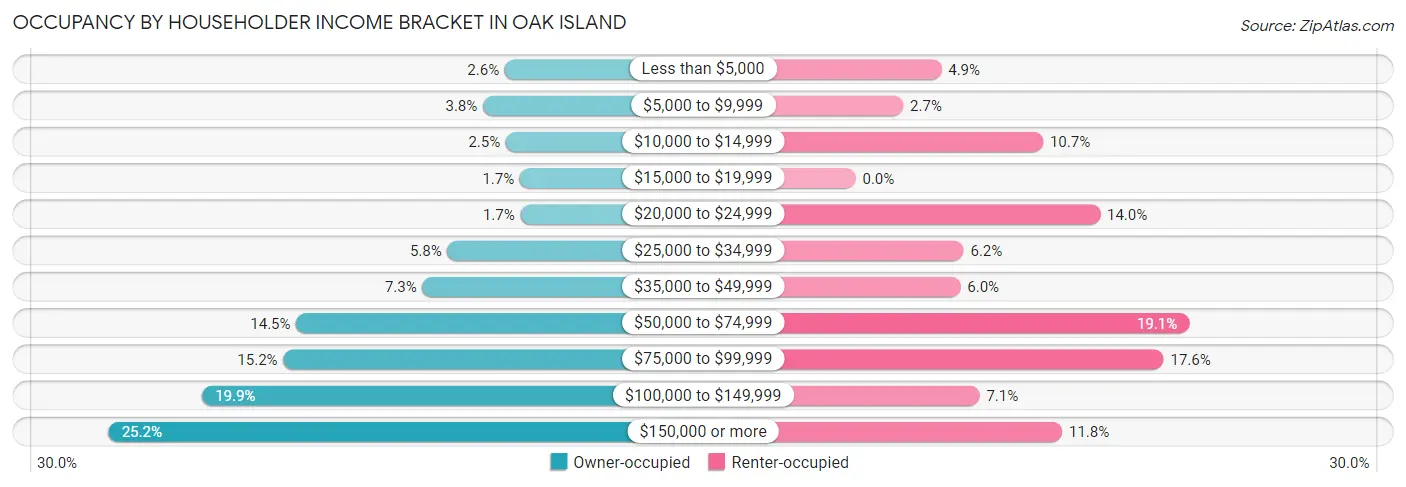
| Income Bracket | Owner-occupied | Renter-occupied |
| Less than $5,000 | 89 (2.5%) | 27 (4.9%) |
| $5,000 to $9,999 | 133 (3.8%) | 15 (2.7%) |
| $10,000 to $14,999 | 87 (2.5%) | 59 (10.7%) |
| $15,000 to $19,999 | 59 (1.7%) | 0 (0.0%) |
| $20,000 to $24,999 | 58 (1.7%) | 77 (14.0%) |
| $25,000 to $34,999 | 204 (5.8%) | 34 (6.2%) |
| $35,000 to $49,999 | 254 (7.3%) | 33 (6.0%) |
| $50,000 to $74,999 | 506 (14.5%) | 105 (19.1%) |
| $75,000 to $99,999 | 532 (15.2%) | 97 (17.6%) |
| $100,000 to $149,999 | 694 (19.9%) | 39 (7.1%) |
| $150,000 or more | 881 (25.2%) | 65 (11.8%) |
| Total | 3,497 (100.0%) | 551 (100.0%) |
Monthly Housing Cost Tiers in Oak Island
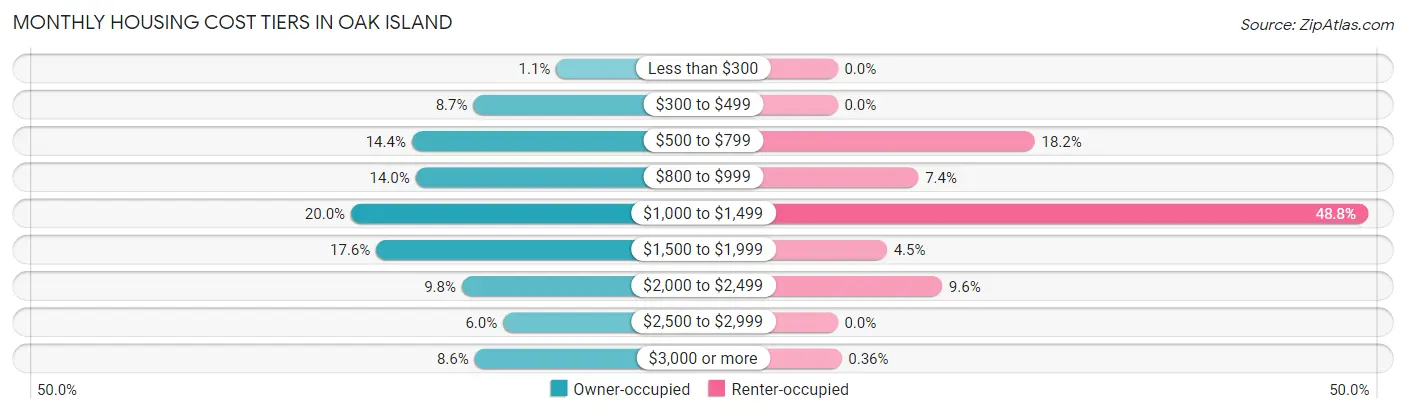
| Monthly Cost | Owner-occupied | Renter-occupied |
| Less than $300 | 37 (1.1%) | 0 (0.0%) |
| $300 to $499 | 304 (8.7%) | 0 (0.0%) |
| $500 to $799 | 502 (14.4%) | 100 (18.1%) |
| $800 to $999 | 490 (14.0%) | 41 (7.4%) |
| $1,000 to $1,499 | 698 (20.0%) | 269 (48.8%) |
| $1,500 to $1,999 | 617 (17.6%) | 25 (4.5%) |
| $2,000 to $2,499 | 341 (9.8%) | 53 (9.6%) |
| $2,500 to $2,999 | 208 (5.9%) | 0 (0.0%) |
| $3,000 or more | 300 (8.6%) | 2 (0.4%) |
| Total | 3,497 (100.0%) | 551 (100.0%) |
Physical Housing Characteristics in Oak Island
Housing Structures in Oak Island
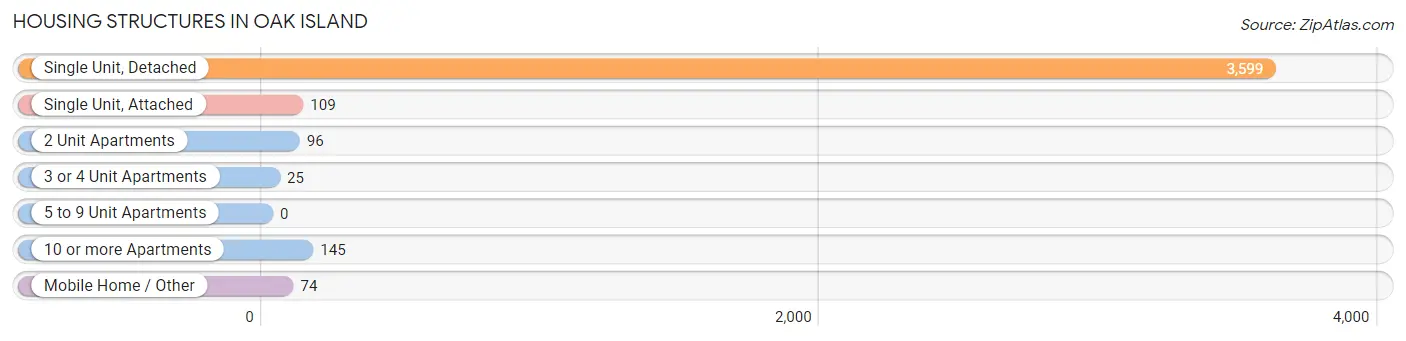
| Structure Type | # Housing Units | % Housing Units |
| Single Unit, Detached | 3,599 | 88.9% |
| Single Unit, Attached | 109 | 2.7% |
| 2 Unit Apartments | 96 | 2.4% |
| 3 or 4 Unit Apartments | 25 | 0.6% |
| 5 to 9 Unit Apartments | 0 | 0.0% |
| 10 or more Apartments | 145 | 3.6% |
| Mobile Home / Other | 74 | 1.8% |
| Total | 4,048 | 100.0% |
Housing Structures by Occupancy in Oak Island
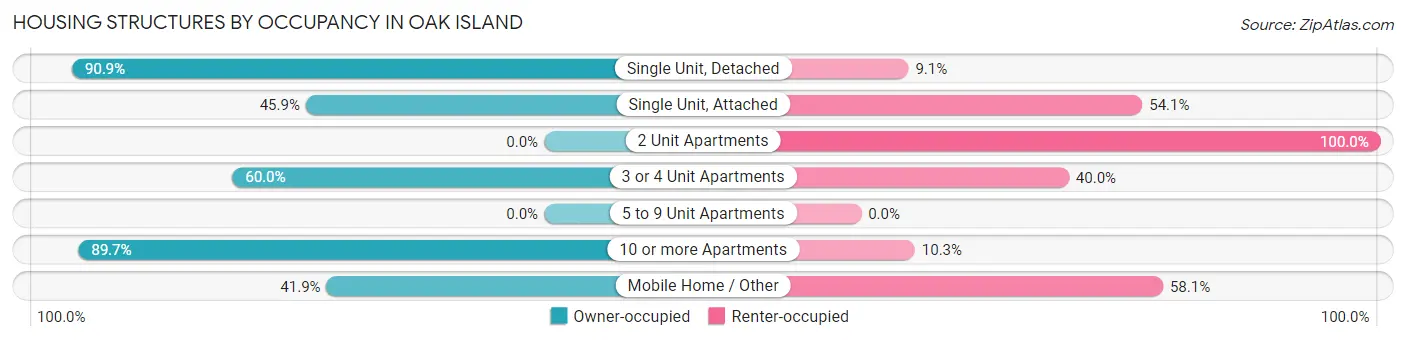
| Structure Type | Owner-occupied | Renter-occupied |
| Single Unit, Detached | 3,271 (90.9%) | 328 (9.1%) |
| Single Unit, Attached | 50 (45.9%) | 59 (54.1%) |
| 2 Unit Apartments | 0 (0.0%) | 96 (100.0%) |
| 3 or 4 Unit Apartments | 15 (60.0%) | 10 (40.0%) |
| 5 to 9 Unit Apartments | 0 (0.0%) | 0 (0.0%) |
| 10 or more Apartments | 130 (89.7%) | 15 (10.3%) |
| Mobile Home / Other | 31 (41.9%) | 43 (58.1%) |
| Total | 3,497 (86.4%) | 551 (13.6%) |
Housing Structures by Number of Rooms in Oak Island
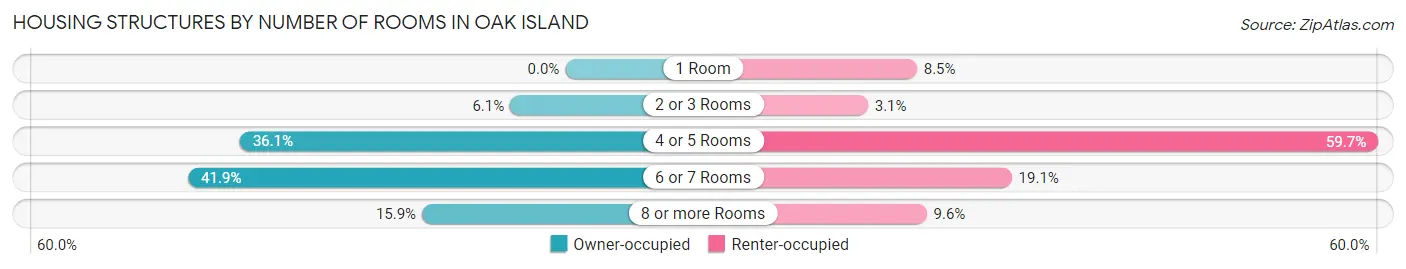
| Number of Rooms | Owner-occupied | Renter-occupied |
| 1 Room | 0 (0.0%) | 47 (8.5%) |
| 2 or 3 Rooms | 214 (6.1%) | 17 (3.1%) |
| 4 or 5 Rooms | 1,263 (36.1%) | 329 (59.7%) |
| 6 or 7 Rooms | 1,464 (41.9%) | 105 (19.1%) |
| 8 or more Rooms | 556 (15.9%) | 53 (9.6%) |
| Total | 3,497 (100.0%) | 551 (100.0%) |
Housing Structure by Heating Type in Oak Island
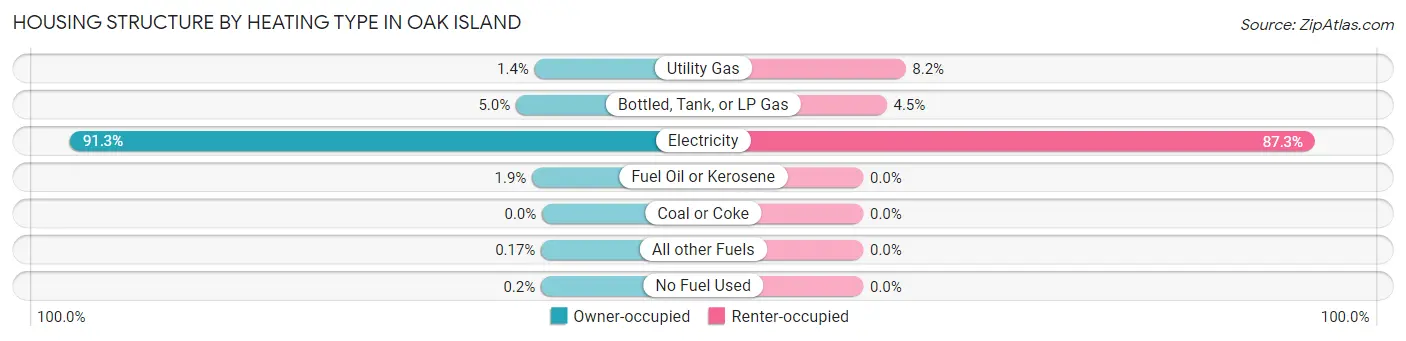
| Heating Type | Owner-occupied | Renter-occupied |
| Utility Gas | 50 (1.4%) | 45 (8.2%) |
| Bottled, Tank, or LP Gas | 176 (5.0%) | 25 (4.5%) |
| Electricity | 3,191 (91.2%) | 481 (87.3%) |
| Fuel Oil or Kerosene | 67 (1.9%) | 0 (0.0%) |
| Coal or Coke | 0 (0.0%) | 0 (0.0%) |
| All other Fuels | 6 (0.2%) | 0 (0.0%) |
| No Fuel Used | 7 (0.2%) | 0 (0.0%) |
| Total | 3,497 (100.0%) | 551 (100.0%) |
Household Vehicle Usage in Oak Island
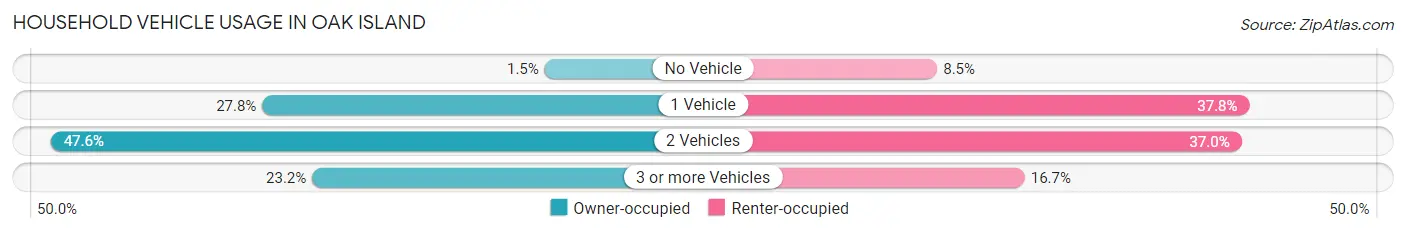
| Vehicles per Household | Owner-occupied | Renter-occupied |
| No Vehicle | 51 (1.5%) | 47 (8.5%) |
| 1 Vehicle | 973 (27.8%) | 208 (37.8%) |
| 2 Vehicles | 1,663 (47.6%) | 204 (37.0%) |
| 3 or more Vehicles | 810 (23.2%) | 92 (16.7%) |
| Total | 3,497 (100.0%) | 551 (100.0%) |
Real Estate & Mortgages in Oak Island
Real Estate and Mortgage Overview in Oak Island
| Characteristic | Without Mortgage | With Mortgage |
| Housing Units | 1,336 | 2,161 |
| Median Property Value | $356,300 | $340,700 |
| Median Household Income | $65,588 | $675 |
| Monthly Housing Costs | $707 | $292 |
| Real Estate Taxes | $2,798 | $0 |
Property Value by Mortgage Status in Oak Island
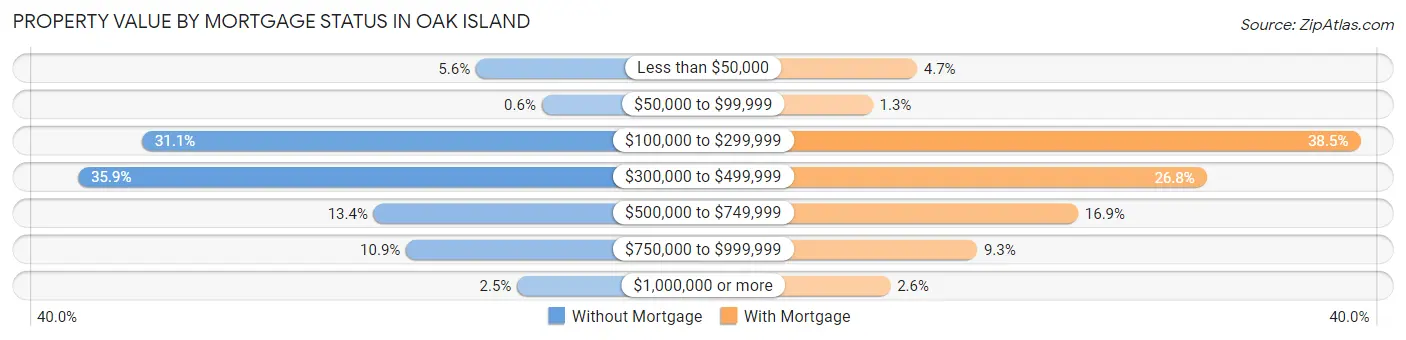
| Property Value | Without Mortgage | With Mortgage |
| Less than $50,000 | 75 (5.6%) | 101 (4.7%) |
| $50,000 to $99,999 | 8 (0.6%) | 28 (1.3%) |
| $100,000 to $299,999 | 415 (31.1%) | 831 (38.5%) |
| $300,000 to $499,999 | 480 (35.9%) | 578 (26.8%) |
| $500,000 to $749,999 | 179 (13.4%) | 366 (16.9%) |
| $750,000 to $999,999 | 146 (10.9%) | 200 (9.2%) |
| $1,000,000 or more | 33 (2.5%) | 57 (2.6%) |
| Total | 1,336 (100.0%) | 2,161 (100.0%) |
Household Income by Mortgage Status in Oak Island
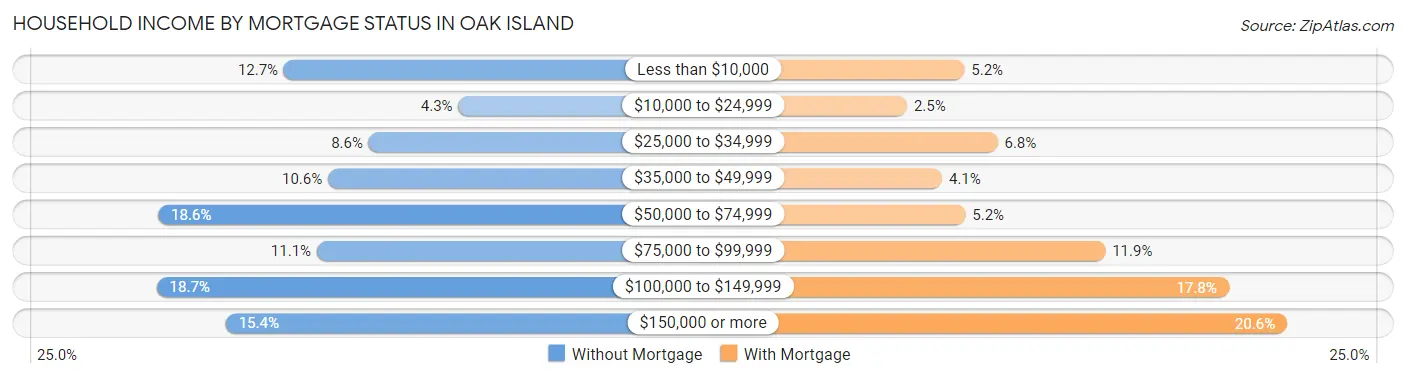
| Household Income | Without Mortgage | With Mortgage |
| Less than $10,000 | 169 (12.7%) | 112 (5.2%) |
| $10,000 to $24,999 | 58 (4.3%) | 53 (2.5%) |
| $25,000 to $34,999 | 115 (8.6%) | 146 (6.8%) |
| $35,000 to $49,999 | 141 (10.5%) | 89 (4.1%) |
| $50,000 to $74,999 | 249 (18.6%) | 113 (5.2%) |
| $75,000 to $99,999 | 148 (11.1%) | 257 (11.9%) |
| $100,000 to $149,999 | 250 (18.7%) | 384 (17.8%) |
| $150,000 or more | 206 (15.4%) | 444 (20.5%) |
| Total | 1,336 (100.0%) | 2,161 (100.0%) |
Property Value to Household Income Ratio in Oak Island
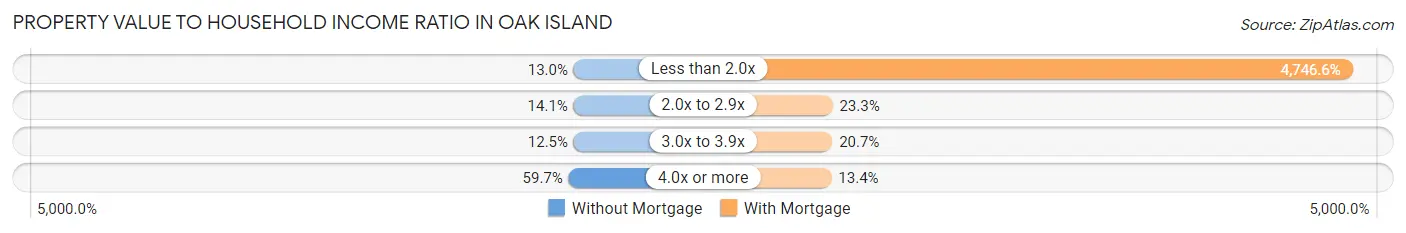
| Value-to-Income Ratio | Without Mortgage | With Mortgage |
| Less than 2.0x | 173 (13.0%) | 102,574 (4,746.6%) |
| 2.0x to 2.9x | 188 (14.1%) | 503 (23.3%) |
| 3.0x to 3.9x | 167 (12.5%) | 448 (20.7%) |
| 4.0x or more | 797 (59.7%) | 289 (13.4%) |
| Total | 1,336 (100.0%) | 2,161 (100.0%) |
Real Estate Taxes by Mortgage Status in Oak Island
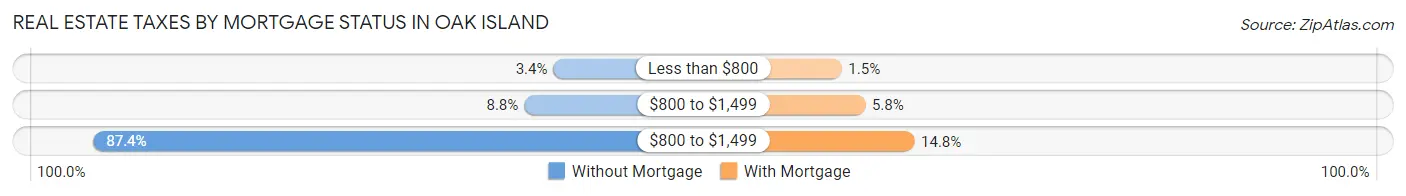
| Property Taxes | Without Mortgage | With Mortgage |
| Less than $800 | 46 (3.4%) | 33 (1.5%) |
| $800 to $1,499 | 117 (8.8%) | 126 (5.8%) |
| $800 to $1,499 | 1,168 (87.4%) | 320 (14.8%) |
| Total | 1,336 (100.0%) | 2,161 (100.0%) |
Health & Disability in Oak Island
Health Insurance Coverage by Age in Oak Island
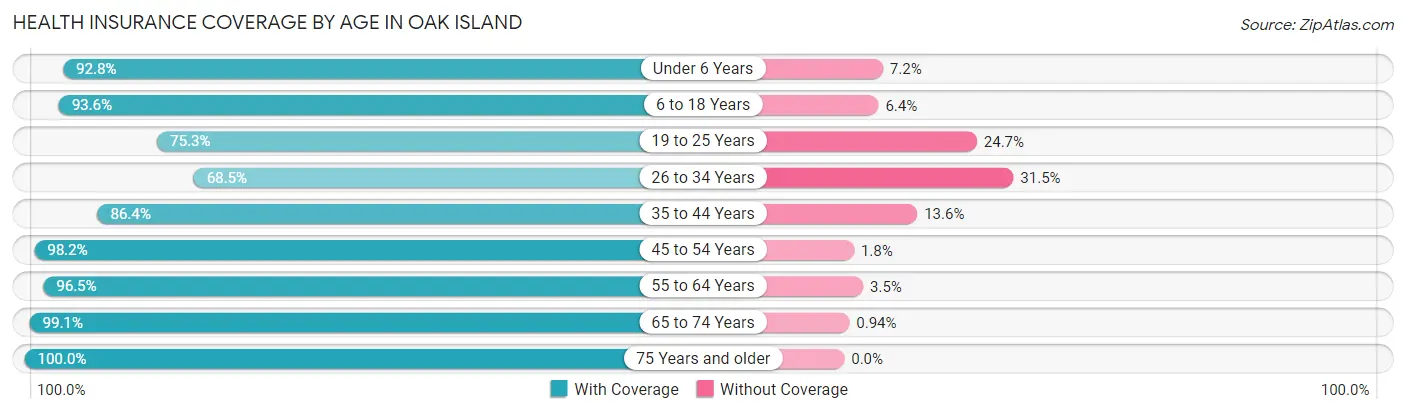
| Age Bracket | With Coverage | Without Coverage |
| Under 6 Years | 116 (92.8%) | 9 (7.2%) |
| 6 to 18 Years | 573 (93.6%) | 39 (6.4%) |
| 19 to 25 Years | 201 (75.3%) | 66 (24.7%) |
| 26 to 34 Years | 254 (68.5%) | 117 (31.5%) |
| 35 to 44 Years | 324 (86.4%) | 51 (13.6%) |
| 45 to 54 Years | 1,191 (98.2%) | 22 (1.8%) |
| 55 to 64 Years | 2,308 (96.5%) | 84 (3.5%) |
| 65 to 74 Years | 2,119 (99.1%) | 20 (0.9%) |
| 75 Years and older | 1,070 (100.0%) | 0 (0.0%) |
| Total | 8,156 (95.2%) | 408 (4.8%) |
Health Insurance Coverage by Citizenship Status in Oak Island
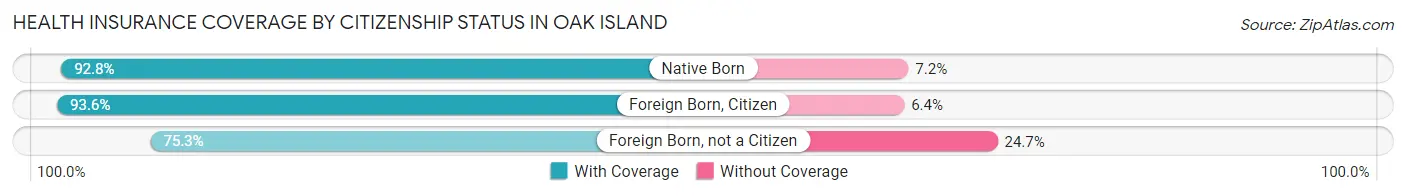
| Citizenship Status | With Coverage | Without Coverage |
| Native Born | 116 (92.8%) | 9 (7.2%) |
| Foreign Born, Citizen | 573 (93.6%) | 39 (6.4%) |
| Foreign Born, not a Citizen | 201 (75.3%) | 66 (24.7%) |
Health Insurance Coverage by Household Income in Oak Island
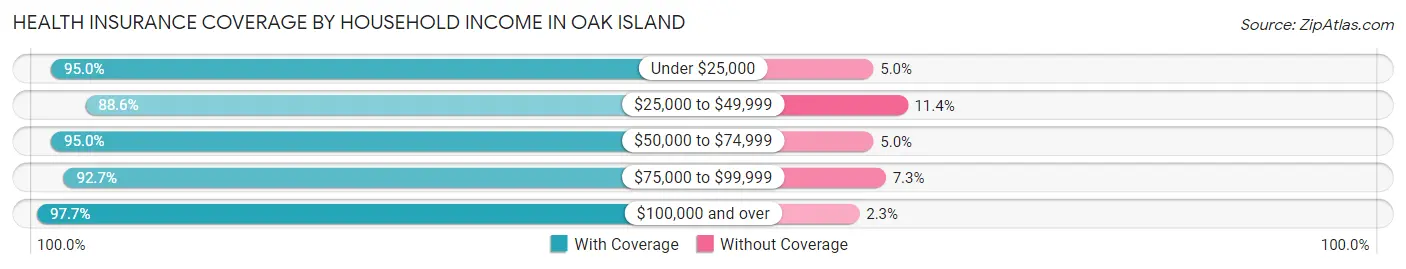
| Household Income | With Coverage | Without Coverage |
| Under $25,000 | 919 (95.0%) | 48 (5.0%) |
| $25,000 to $49,999 | 686 (88.6%) | 88 (11.4%) |
| $50,000 to $74,999 | 1,430 (95.0%) | 75 (5.0%) |
| $75,000 to $99,999 | 1,358 (92.7%) | 107 (7.3%) |
| $100,000 and over | 3,763 (97.7%) | 90 (2.3%) |
Public vs Private Health Insurance Coverage by Age in Oak Island
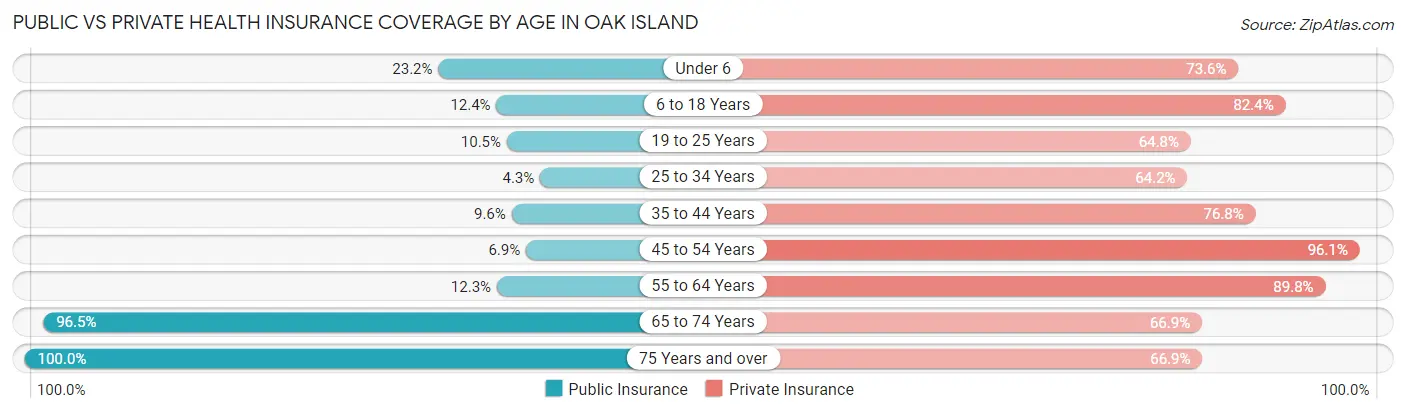
| Age Bracket | Public Insurance | Private Insurance |
| Under 6 | 29 (23.2%) | 92 (73.6%) |
| 6 to 18 Years | 76 (12.4%) | 504 (82.4%) |
| 19 to 25 Years | 28 (10.5%) | 173 (64.8%) |
| 25 to 34 Years | 16 (4.3%) | 238 (64.1%) |
| 35 to 44 Years | 36 (9.6%) | 288 (76.8%) |
| 45 to 54 Years | 84 (6.9%) | 1,166 (96.1%) |
| 55 to 64 Years | 295 (12.3%) | 2,147 (89.8%) |
| 65 to 74 Years | 2,065 (96.5%) | 1,430 (66.8%) |
| 75 Years and over | 1,070 (100.0%) | 716 (66.9%) |
| Total | 3,699 (43.2%) | 6,754 (78.9%) |
Disability Status by Sex by Age in Oak Island
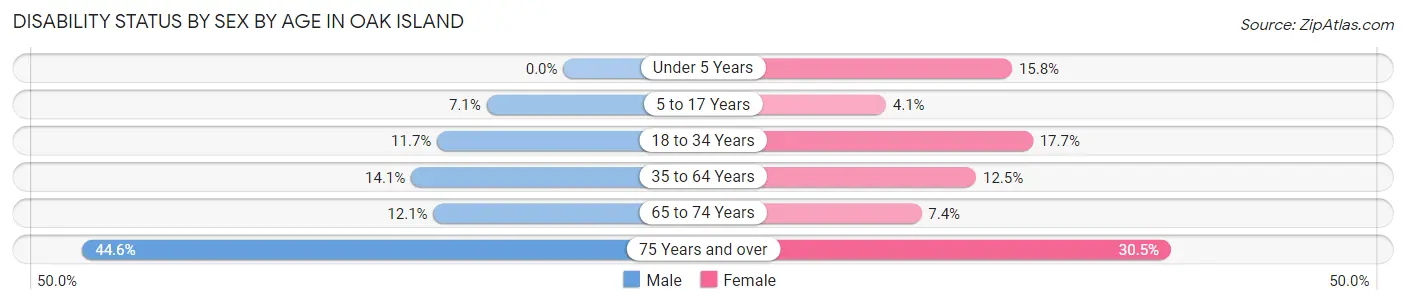
| Age Bracket | Male | Female |
| Under 5 Years | 0 (0.0%) | 3 (15.8%) |
| 5 to 17 Years | 21 (7.1%) | 13 (4.1%) |
| 18 to 34 Years | 50 (11.7%) | 42 (17.7%) |
| 35 to 64 Years | 254 (14.1%) | 272 (12.5%) |
| 65 to 74 Years | 119 (12.1%) | 85 (7.4%) |
| 75 Years and over | 254 (44.6%) | 153 (30.5%) |
Disability Class by Sex by Age in Oak Island
Disability Class: Hearing Difficulty
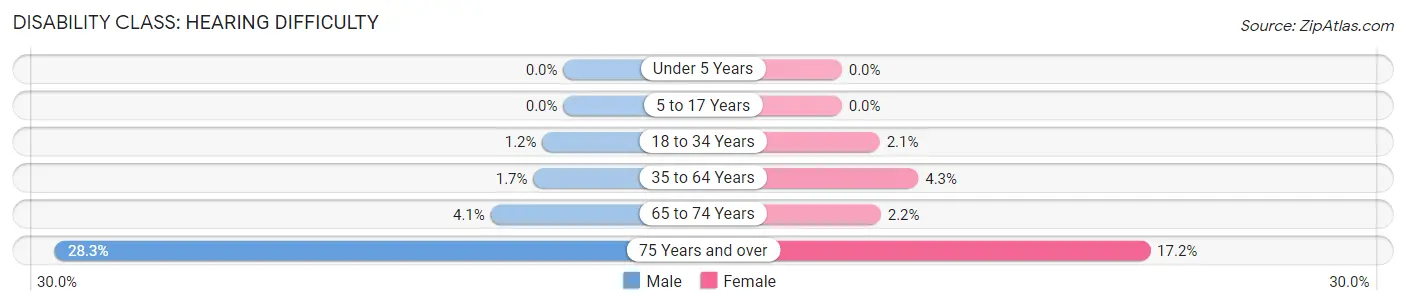
| Age Bracket | Male | Female |
| Under 5 Years | 0 (0.0%) | 0 (0.0%) |
| 5 to 17 Years | 0 (0.0%) | 0 (0.0%) |
| 18 to 34 Years | 5 (1.2%) | 5 (2.1%) |
| 35 to 64 Years | 30 (1.7%) | 93 (4.3%) |
| 65 to 74 Years | 40 (4.1%) | 25 (2.2%) |
| 75 Years and over | 161 (28.3%) | 86 (17.2%) |
Disability Class: Vision Difficulty
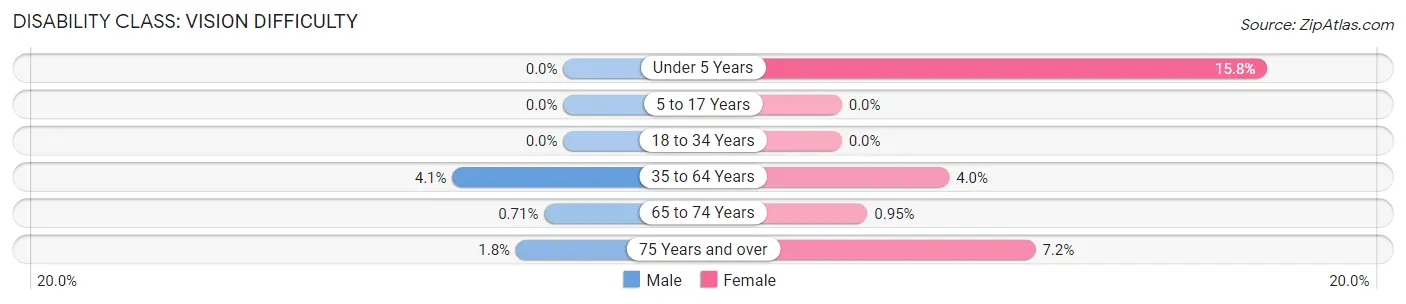
| Age Bracket | Male | Female |
| Under 5 Years | 0 (0.0%) | 3 (15.8%) |
| 5 to 17 Years | 0 (0.0%) | 0 (0.0%) |
| 18 to 34 Years | 0 (0.0%) | 0 (0.0%) |
| 35 to 64 Years | 74 (4.1%) | 87 (4.0%) |
| 65 to 74 Years | 7 (0.7%) | 11 (0.9%) |
| 75 Years and over | 10 (1.8%) | 36 (7.2%) |
Disability Class: Cognitive Difficulty
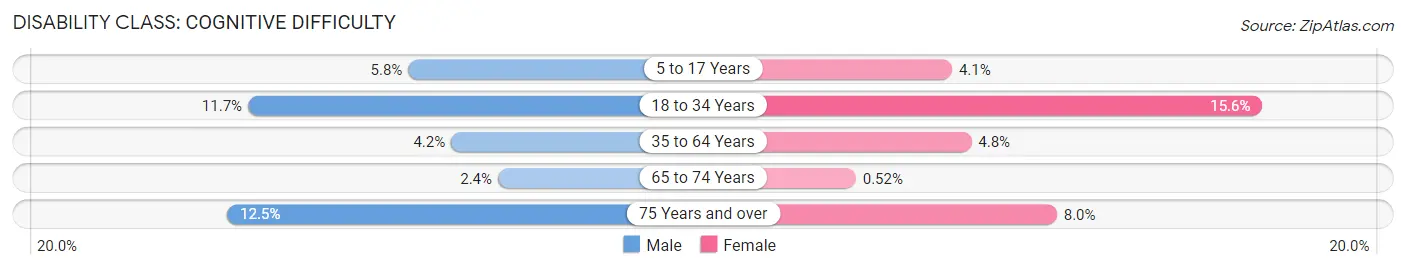
| Age Bracket | Male | Female |
| 5 to 17 Years | 17 (5.8%) | 13 (4.1%) |
| 18 to 34 Years | 50 (11.7%) | 37 (15.6%) |
| 35 to 64 Years | 75 (4.2%) | 105 (4.8%) |
| 65 to 74 Years | 24 (2.4%) | 6 (0.5%) |
| 75 Years and over | 71 (12.5%) | 40 (8.0%) |
Disability Class: Ambulatory Difficulty
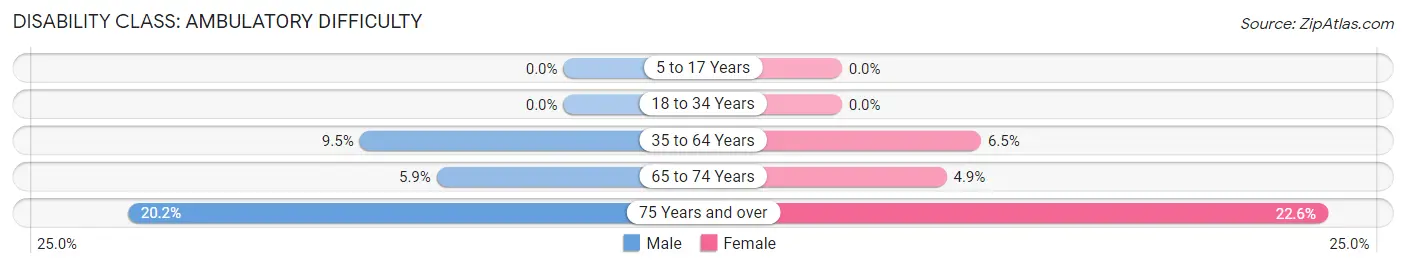
| Age Bracket | Male | Female |
| 5 to 17 Years | 0 (0.0%) | 0 (0.0%) |
| 18 to 34 Years | 0 (0.0%) | 0 (0.0%) |
| 35 to 64 Years | 170 (9.5%) | 141 (6.5%) |
| 65 to 74 Years | 58 (5.9%) | 56 (4.9%) |
| 75 Years and over | 115 (20.2%) | 113 (22.6%) |
Disability Class: Self-Care Difficulty
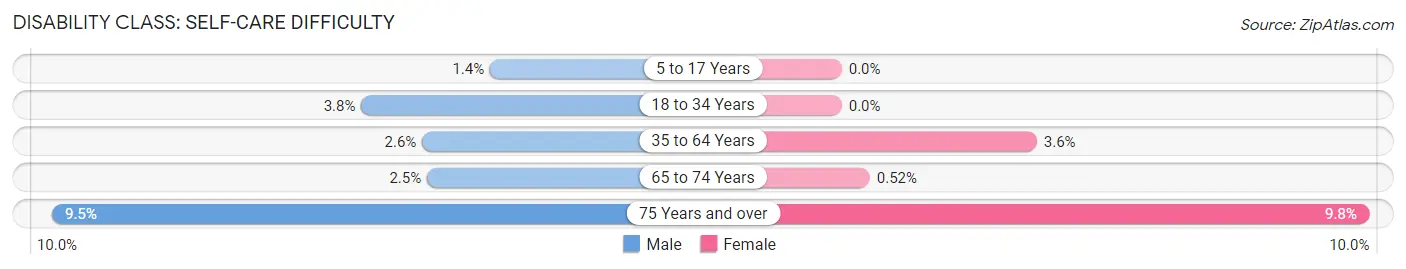
| Age Bracket | Male | Female |
| 5 to 17 Years | 4 (1.4%) | 0 (0.0%) |
| 18 to 34 Years | 16 (3.7%) | 0 (0.0%) |
| 35 to 64 Years | 47 (2.6%) | 79 (3.6%) |
| 65 to 74 Years | 25 (2.5%) | 6 (0.5%) |
| 75 Years and over | 54 (9.5%) | 49 (9.8%) |
Technology Access in Oak Island
Computing Device Access in Oak Island
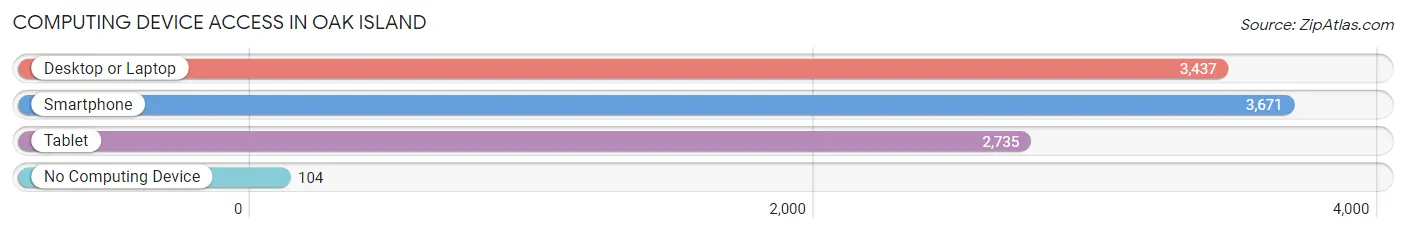
| Device Type | # Households | % Households |
| Desktop or Laptop | 3,437 | 84.9% |
| Smartphone | 3,671 | 90.7% |
| Tablet | 2,735 | 67.6% |
| No Computing Device | 104 | 2.6% |
| Total | 4,048 | 100.0% |
Internet Access in Oak Island
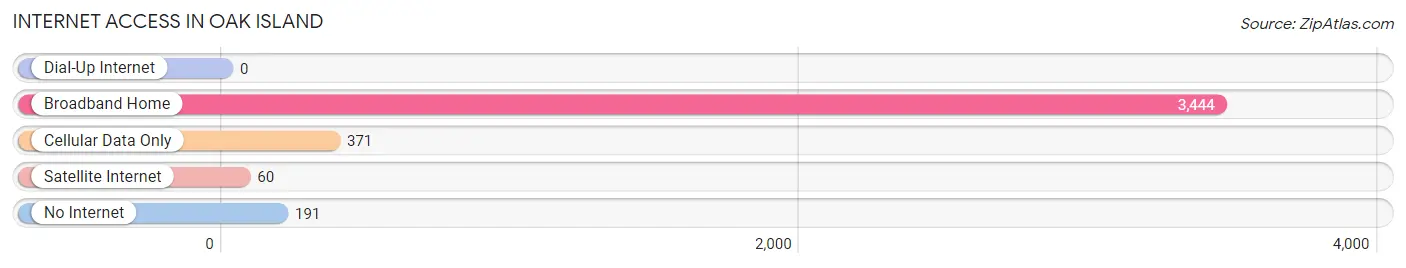
| Internet Type | # Households | % Households |
| Dial-Up Internet | 0 | 0.0% |
| Broadband Home | 3,444 | 85.1% |
| Cellular Data Only | 371 | 9.2% |
| Satellite Internet | 60 | 1.5% |
| No Internet | 191 | 4.7% |
| Total | 4,048 | 100.0% |
Oak Island Summary
Introduction
Oak Island is a small town located in Brunswick County, North Carolina. It is situated on the Atlantic Ocean and is part of the Southport-Oak Island area. The town has a population of approximately 8,000 people and is a popular tourist destination. It is known for its beautiful beaches, fishing, and other outdoor activities.
History
Oak Island was first settled in the late 1700s by a group of settlers from the British Isles. The town was originally called Smithville, but was later changed to Oak Island in 1845. The town was incorporated in 1887 and has been a popular tourist destination ever since.
The town was originally a fishing village, but it has since become a popular beach destination. In the early 1900s, the town was a popular spot for vacationers from the nearby cities of Wilmington and Southport. The town was also home to a number of resorts, including the Oak Island Hotel, which was built in the 1920s.
The town was also home to a number of military installations during World War II. The town was home to a Coast Guard station, a Navy base, and a Marine Corps base. The town was also home to a number of military personnel during the war.
Geography
Oak Island is located in Brunswick County, North Carolina. It is situated on the Atlantic Ocean and is part of the Southport-Oak Island area. The town is located on the barrier island of Oak Island, which is approximately 11 miles long and 1.5 miles wide. The town is bordered by the Intracoastal Waterway to the west and the Atlantic Ocean to the east.
The town is home to a number of beaches, including the Oak Island Beach, which is a popular spot for swimming, sunbathing, and other beach activities. The town is also home to a number of parks, including the Oak Island Nature Park, which is a popular spot for bird watching and other outdoor activities.
Economy
Oak Island is a popular tourist destination and the town’s economy is largely based on tourism. The town is home to a number of hotels, restaurants, and other businesses that cater to tourists. The town is also home to a number of marinas, which are popular spots for fishing and other water activities.
The town is also home to a number of manufacturing and industrial businesses. The town is home to a number of seafood processing plants, which are popular spots for employment. The town is also home to a number of boat builders, which are popular spots for employment.
Demographics
As of the 2010 census, the population of Oak Island was 8,099. The town has a population that is largely white (90.2%) and the median age is 47. The town has a median household income of $50,945 and the median home value is $250,000.
Conclusion
Oak Island is a small town located in Brunswick County, North Carolina. It is situated on the Atlantic Ocean and is part of the Southport-Oak Island area. The town has a population of approximately 8,000 people and is a popular tourist destination. It is known for its beautiful beaches, fishing, and other outdoor activities. The town’s economy is largely based on tourism and the town is home to a number of hotels, restaurants, and other businesses that cater to tourists. The town is also home to a number of manufacturing and industrial businesses. The town has a population that is largely white and the median age is 47.
Common Questions
What is Per Capita Income in Oak Island?
Per Capita income in Oak Island is $56,481.
What is the Median Family Income in Oak Island?
Median Family Income in Oak Island is $97,481.
What is the Median Household income in Oak Island?
Median Household Income in Oak Island is $85,513.
What is Income or Wage Gap in Oak Island?
Income or Wage Gap in Oak Island is 4.0%.
Women in Oak Island earn 96.0 cents for every dollar earned by a man.
What is Inequality or Gini Index in Oak Island?
Inequality or Gini Index in Oak Island is 0.48.
What is the Total Population of Oak Island?
Total Population of Oak Island is 8,564.
What is the Total Male Population of Oak Island?
Total Male Population of Oak Island is 4,154.
What is the Total Female Population of Oak Island?
Total Female Population of Oak Island is 4,410.
What is the Ratio of Males per 100 Females in Oak Island?
There are 94.20 Males per 100 Females in Oak Island.
What is the Ratio of Females per 100 Males in Oak Island?
There are 106.16 Females per 100 Males in Oak Island.
What is the Median Population Age in Oak Island?
Median Population Age in Oak Island is 60.7 Years.
What is the Average Family Size in Oak Island
Average Family Size in Oak Island is 2.5 People.
What is the Average Household Size in Oak Island
Average Household Size in Oak Island is 2.1 People.
How Large is the Labor Force in Oak Island?
There are 3,824 People in the Labor Forcein in Oak Island.
What is the Percentage of People in the Labor Force in Oak Island?
48.5% of People are in the Labor Force in Oak Island.
What is the Unemployment Rate in Oak Island?
Unemployment Rate in Oak Island is 4.9%.