Fletcher, NC Map & Demographics
Fletcher Map
Fletcher Overview
$36,056
PER CAPITA INCOME
$88,775
AVG FAMILY INCOME
$74,483
AVG HOUSEHOLD INCOME
24.0%
WAGE / INCOME GAP [ % ]
76.0¢/ $1
WAGE / INCOME GAP [ $ ]
$10,636
FAMILY INCOME DEFICIT
0.31
INEQUALITY / GINI INDEX
8,000
TOTAL POPULATION
3,705
MALE POPULATION
4,295
FEMALE POPULATION
86.26
MALES / 100 FEMALES
115.92
FEMALES / 100 MALES
46.6
MEDIAN AGE
2.7
AVG FAMILY SIZE
2.3
AVG HOUSEHOLD SIZE
4,033
LABOR FORCE [ PEOPLE ]
59.3%
PERCENT IN LABOR FORCE
3.1%
UNEMPLOYMENT RATE
Fletcher Zip Codes
Fletcher Area Codes
Income in Fletcher
Income Overview in Fletcher
Per Capita Income in Fletcher is $36,056, while median incomes of families and households are $88,775 and $74,483 respectively.
| Characteristic | Number | Measure |
| Per Capita Income | 8,000 | $36,056 |
| Median Family Income | 2,447 | $88,775 |
| Mean Family Income | 2,447 | $92,013 |
| Median Household Income | 3,417 | $74,483 |
| Mean Household Income | 3,417 | $81,265 |
| Income Deficit | 2,447 | $10,636 |
| Wage / Income Gap (%) | 8,000 | 24.01% |
| Wage / Income Gap ($) | 8,000 | 75.99¢ per $1 |
| Gini / Inequality Index | 8,000 | 0.31 |
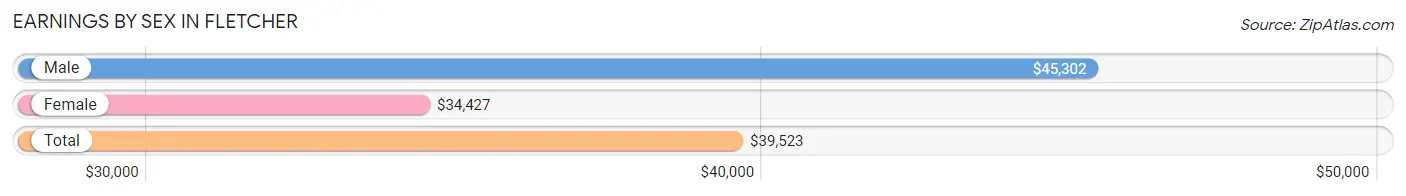
Earnings by Sex in Fletcher
Average Earnings in Fletcher are $39,523, $45,302 for men and $34,427 for women, a difference of 24.0%.
| Sex | Number | Average Earnings |
| Male | 2,175 (47.7%) | $45,302 |
| Female | 2,387 (52.3%) | $34,427 |
| Total | 4,562 (100.0%) | $39,523 |
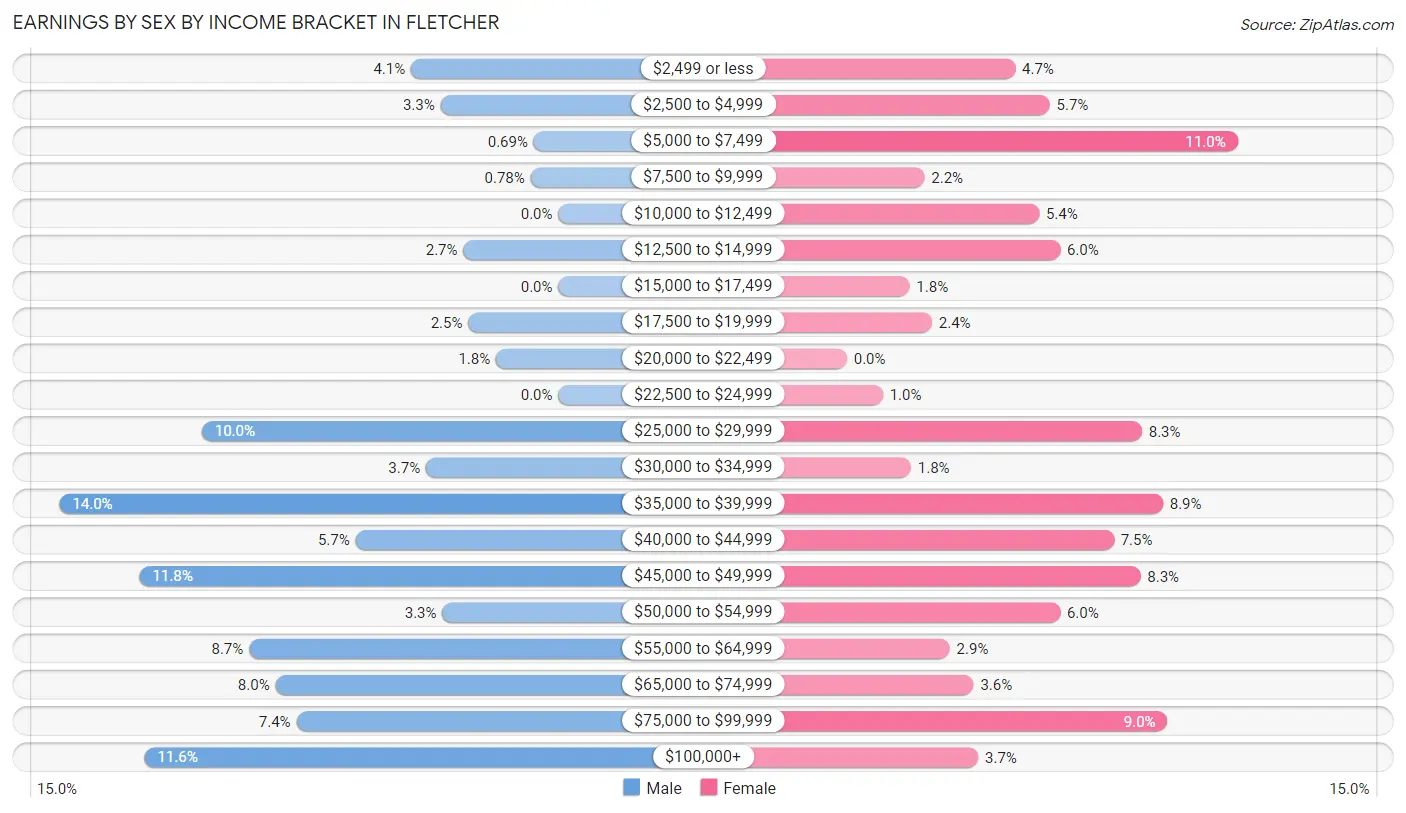
Earnings by Sex by Income Bracket in Fletcher
The most common earnings brackets in Fletcher are $35,000 to $39,999 for men (305 | 14.0%) and $5,000 to $7,499 for women (262 | 11.0%).
| Income | Male | Female |
| $2,499 or less | 90 (4.1%) | 113 (4.7%) |
| $2,500 to $4,999 | 72 (3.3%) | 136 (5.7%) |
| $5,000 to $7,499 | 15 (0.7%) | 262 (11.0%) |
| $7,500 to $9,999 | 17 (0.8%) | 52 (2.2%) |
| $10,000 to $12,499 | 0 (0.0%) | 129 (5.4%) |
| $12,500 to $14,999 | 58 (2.7%) | 143 (6.0%) |
| $15,000 to $17,499 | 0 (0.0%) | 42 (1.8%) |
| $17,500 to $19,999 | 55 (2.5%) | 57 (2.4%) |
| $20,000 to $22,499 | 38 (1.8%) | 0 (0.0%) |
| $22,500 to $24,999 | 0 (0.0%) | 24 (1.0%) |
| $25,000 to $29,999 | 218 (10.0%) | 198 (8.3%) |
| $30,000 to $34,999 | 81 (3.7%) | 43 (1.8%) |
| $35,000 to $39,999 | 305 (14.0%) | 212 (8.9%) |
| $40,000 to $44,999 | 124 (5.7%) | 179 (7.5%) |
| $45,000 to $49,999 | 256 (11.8%) | 197 (8.3%) |
| $50,000 to $54,999 | 71 (3.3%) | 143 (6.0%) |
| $55,000 to $64,999 | 189 (8.7%) | 69 (2.9%) |
| $65,000 to $74,999 | 173 (8.0%) | 85 (3.6%) |
| $75,000 to $99,999 | 160 (7.4%) | 215 (9.0%) |
| $100,000+ | 253 (11.6%) | 88 (3.7%) |
| Total | 2,175 (100.0%) | 2,387 (100.0%) |
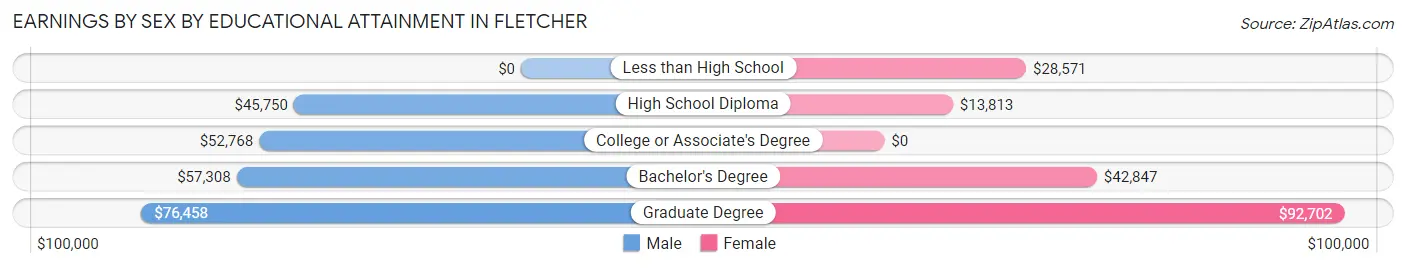
Earnings by Sex by Educational Attainment in Fletcher
Average earnings in Fletcher are $48,842 for men and $36,887 for women, a difference of 24.5%. Men with an educational attainment of graduate degree enjoy the highest average annual earnings of $76,458, while those with high school diploma education earn the least with $45,750. Women with an educational attainment of graduate degree earn the most with the average annual earnings of $92,702, while those with high school diploma education have the smallest earnings of $13,813.
| Educational Attainment | Male Income | Female Income |
| Less than High School | - | - |
| High School Diploma | $45,750 | $13,813 |
| College or Associate's Degree | $52,768 | $0 |
| Bachelor's Degree | $57,308 | $42,847 |
| Graduate Degree | $76,458 | $92,702 |
| Total | $48,842 | $36,887 |
Family Income in Fletcher
Family Income Brackets in Fletcher
According to the Fletcher family income data, there are 756 families falling into the $100,000 to $149,999 income range, which is the most common income bracket and makes up 30.9% of all families. Conversely, the $10,000 to $14,999 income bracket is the least frequent group with only 15 families (0.6%) belonging to this category.
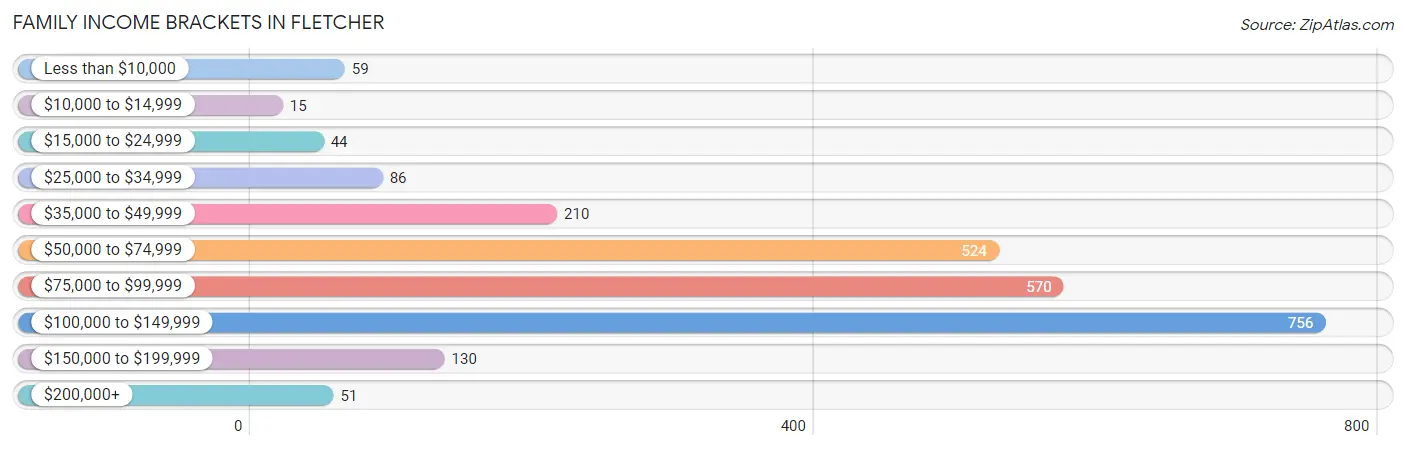
| Income Bracket | # Families | % Families |
| Less than $10,000 | 59 | 2.4% |
| $10,000 to $14,999 | 15 | 0.6% |
| $15,000 to $24,999 | 44 | 1.8% |
| $25,000 to $34,999 | 86 | 3.5% |
| $35,000 to $49,999 | 210 | 8.6% |
| $50,000 to $74,999 | 524 | 21.4% |
| $75,000 to $99,999 | 570 | 23.3% |
| $100,000 to $149,999 | 756 | 30.9% |
| $150,000 to $199,999 | 130 | 5.3% |
| $200,000+ | 51 | 2.1% |
Family Income by Famaliy Size in Fletcher
3-person families (367 | 15.0%) account for the highest median family income in Fletcher with $99,864 per family, while 2-person families (1,624 | 66.4%) have the highest median income of $39,701 per family member.
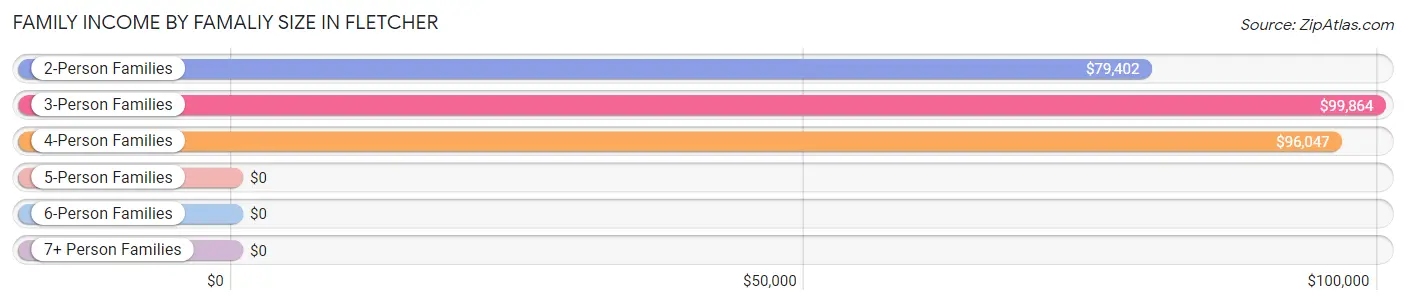
| Income Bracket | # Families | Median Income |
| 2-Person Families | 1,624 (66.4%) | $79,402 |
| 3-Person Families | 367 (15.0%) | $99,864 |
| 4-Person Families | 420 (17.2%) | $96,047 |
| 5-Person Families | 20 (0.8%) | $0 |
| 6-Person Families | 16 (0.6%) | $0 |
| 7+ Person Families | 0 (0.0%) | $0 |
| Total | 2,447 (100.0%) | $88,775 |
Family Income by Number of Earners in Fletcher
The median family income in Fletcher is $88,775, with families comprising 3+ earners (216) having the highest median family income of $103,594, while families with no earners (465) have the lowest median family income of $70,179, accounting for 8.8% and 19.0% of families, respectively.
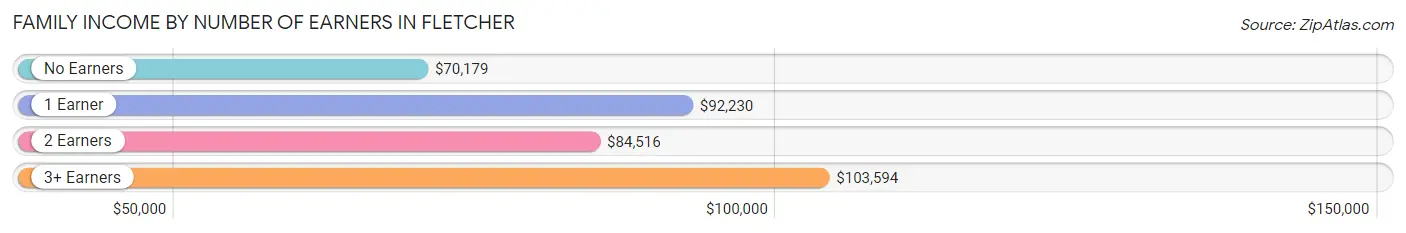
| Number of Earners | # Families | Median Income |
| No Earners | 465 (19.0%) | $70,179 |
| 1 Earner | 618 (25.3%) | $92,230 |
| 2 Earners | 1,148 (46.9%) | $84,516 |
| 3+ Earners | 216 (8.8%) | $103,594 |
| Total | 2,447 (100.0%) | $88,775 |
Household Income in Fletcher
Household Income Brackets in Fletcher
With 878 households falling in the category, the $100,000 to $149,999 income range is the most frequent in Fletcher, accounting for 25.7% of all households. In contrast, only 51 households (1.5%) fall into the $200,000+ income bracket, making it the least populous group.
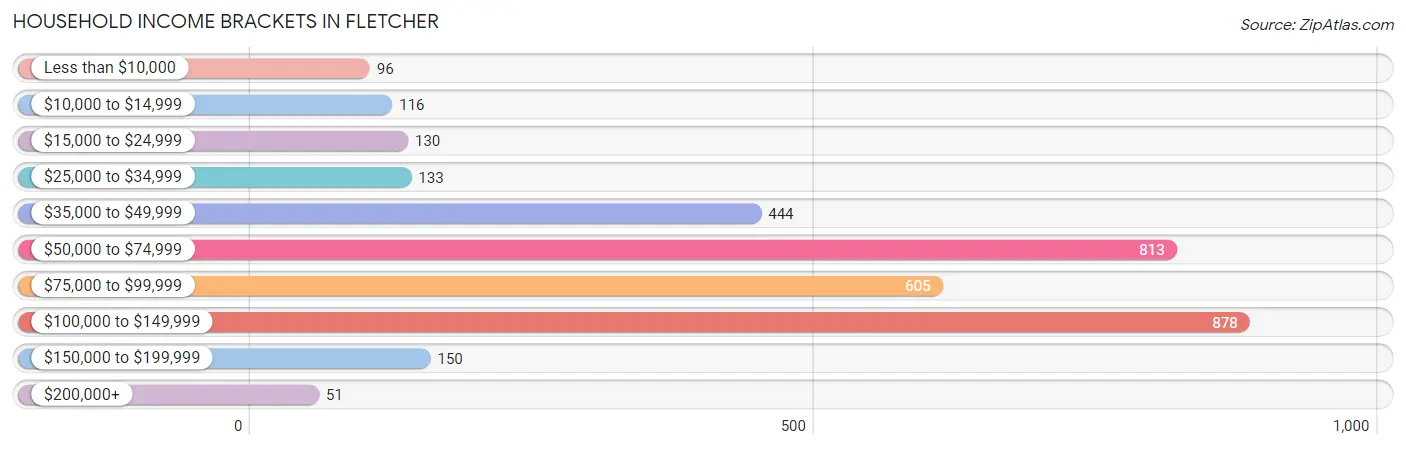
| Income Bracket | # Households | % Households |
| Less than $10,000 | 96 | 2.8% |
| $10,000 to $14,999 | 116 | 3.4% |
| $15,000 to $24,999 | 130 | 3.8% |
| $25,000 to $34,999 | 133 | 3.9% |
| $35,000 to $49,999 | 444 | 13.0% |
| $50,000 to $74,999 | 813 | 23.8% |
| $75,000 to $99,999 | 605 | 17.7% |
| $100,000 to $149,999 | 878 | 25.7% |
| $150,000 to $199,999 | 150 | 4.4% |
| $200,000+ | 51 | 1.5% |
Household Income by Householder Age in Fletcher
The median household income in Fletcher is $74,483, with the highest median household income of $96,559 found in the 45 to 64 years age bracket for the primary householder. A total of 1,279 households (37.4%) fall into this category. Meanwhile, the 15 to 24 years age bracket for the primary householder has the lowest median household income of $0, with 103 households (3.0%) in this group.
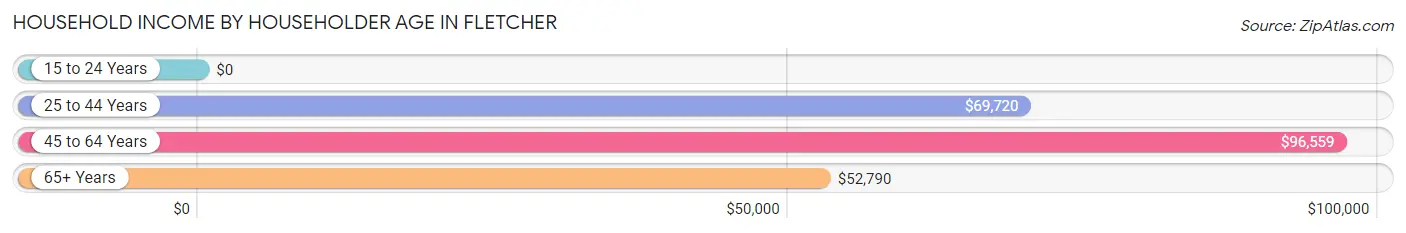
| Income Bracket | # Households | Median Income |
| 15 to 24 Years | 103 (3.0%) | $0 |
| 25 to 44 Years | 916 (26.8%) | $69,720 |
| 45 to 64 Years | 1,279 (37.4%) | $96,559 |
| 65+ Years | 1,119 (32.8%) | $52,790 |
| Total | 3,417 (100.0%) | $74,483 |
Poverty in Fletcher
Income Below Poverty by Sex and Age in Fletcher
With 6.6% poverty level for males and 7.9% for females among the residents of Fletcher, 12 to 14 year old males and 18 to 24 year old females are the most vulnerable to poverty, with 11 males (42.3%) and 107 females (23.0%) in their respective age groups living below the poverty level.
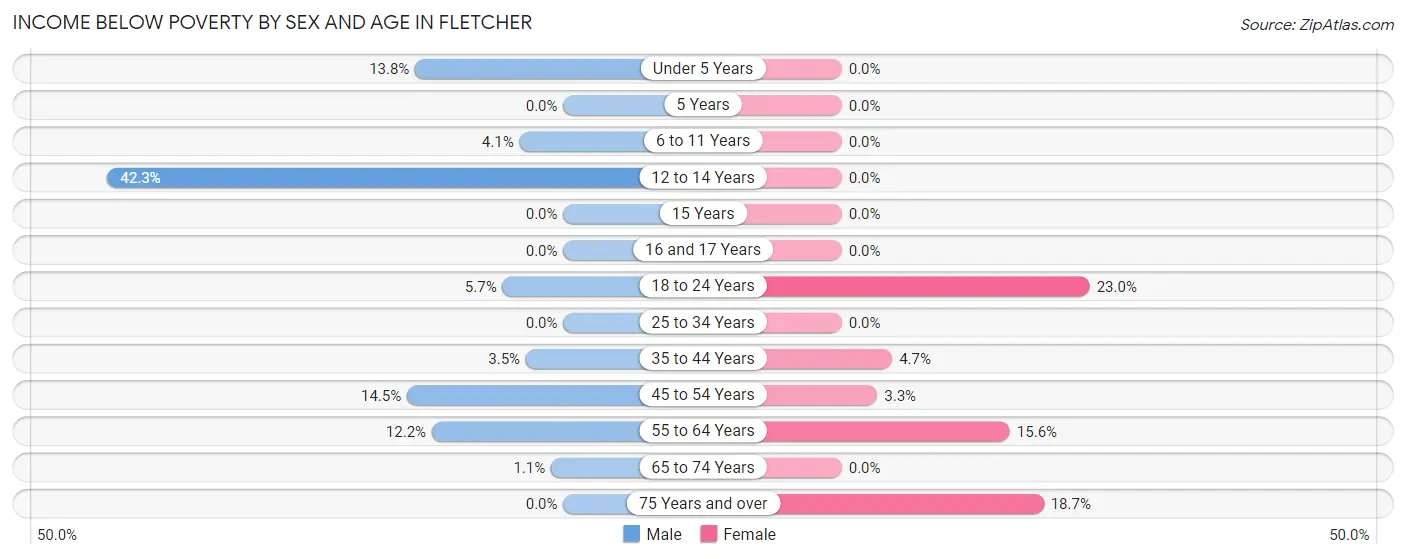
| Age Bracket | Male | Female |
| Under 5 Years | 22 (13.8%) | 0 (0.0%) |
| 5 Years | 0 (0.0%) | 0 (0.0%) |
| 6 to 11 Years | 11 (4.1%) | 0 (0.0%) |
| 12 to 14 Years | 11 (42.3%) | 0 (0.0%) |
| 15 Years | 0 (0.0%) | 0 (0.0%) |
| 16 and 17 Years | 0 (0.0%) | 0 (0.0%) |
| 18 to 24 Years | 21 (5.7%) | 107 (23.0%) |
| 25 to 34 Years | 0 (0.0%) | 0 (0.0%) |
| 35 to 44 Years | 25 (3.5%) | 26 (4.7%) |
| 45 to 54 Years | 64 (14.5%) | 14 (3.3%) |
| 55 to 64 Years | 81 (12.2%) | 102 (15.6%) |
| 65 to 74 Years | 6 (1.1%) | 0 (0.0%) |
| 75 Years and over | 0 (0.0%) | 80 (18.7%) |
| Total | 241 (6.6%) | 329 (7.9%) |
Income Above Poverty by Sex and Age in Fletcher
According to the poverty statistics in Fletcher, males aged 5 years and females aged under 5 years are the age groups that are most secure financially, with 100.0% of males and 100.0% of females in these age groups living above the poverty line.
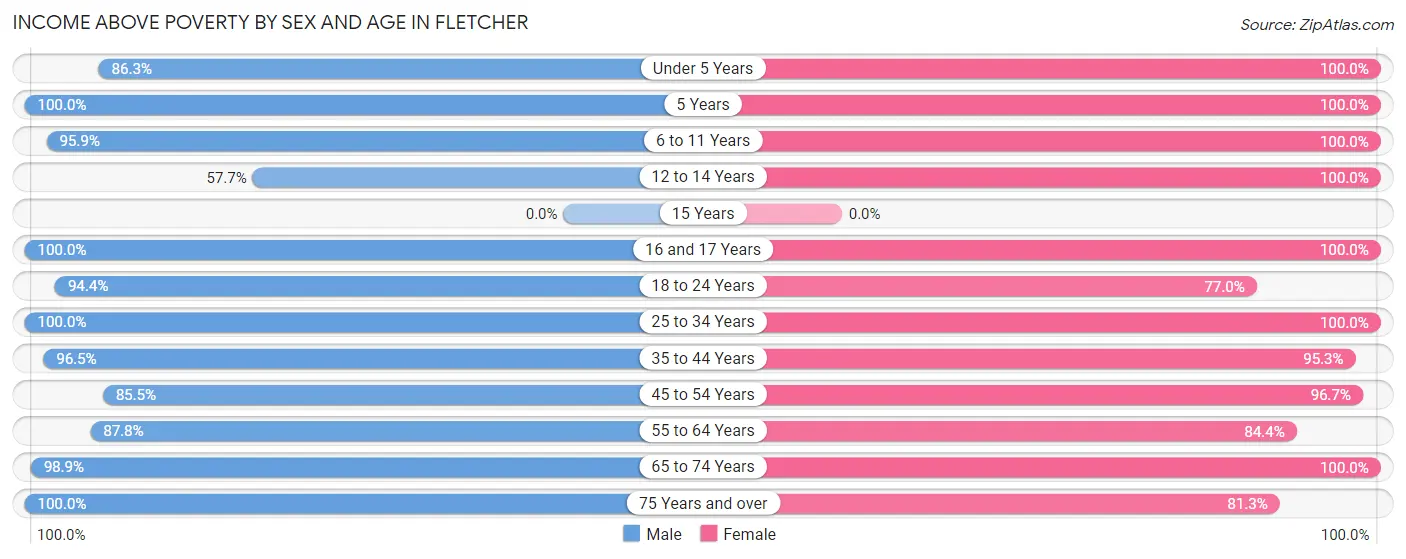
| Age Bracket | Male | Female |
| Under 5 Years | 138 (86.3%) | 118 (100.0%) |
| 5 Years | 14 (100.0%) | 65 (100.0%) |
| 6 to 11 Years | 259 (95.9%) | 332 (100.0%) |
| 12 to 14 Years | 15 (57.7%) | 103 (100.0%) |
| 15 Years | 0 (0.0%) | 0 (0.0%) |
| 16 and 17 Years | 18 (100.0%) | 12 (100.0%) |
| 18 to 24 Years | 351 (94.4%) | 358 (77.0%) |
| 25 to 34 Years | 185 (100.0%) | 351 (100.0%) |
| 35 to 44 Years | 695 (96.5%) | 529 (95.3%) |
| 45 to 54 Years | 377 (85.5%) | 410 (96.7%) |
| 55 to 64 Years | 583 (87.8%) | 552 (84.4%) |
| 65 to 74 Years | 519 (98.9%) | 653 (100.0%) |
| 75 Years and over | 249 (100.0%) | 347 (81.3%) |
| Total | 3,403 (93.4%) | 3,830 (92.1%) |
Income Below Poverty Among Married-Couple Families in Fletcher
The poverty statistics for married-couple families in Fletcher show that 6.7% or 130 of the total 1,947 families live below the poverty line. Families with no children have the highest poverty rate of 7.1%, comprising of 103 families. On the other hand, families with 3 or 4 children have the lowest poverty rate of 0.0%, which includes 0 families.
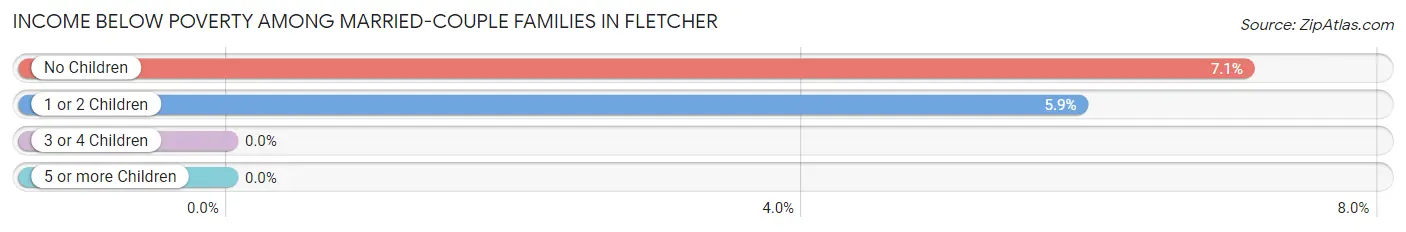
| Children | Above Poverty | Below Poverty |
| No Children | 1,352 (92.9%) | 103 (7.1%) |
| 1 or 2 Children | 429 (94.1%) | 27 (5.9%) |
| 3 or 4 Children | 36 (100.0%) | 0 (0.0%) |
| 5 or more Children | 0 (0.0%) | 0 (0.0%) |
| Total | 1,817 (93.3%) | 130 (6.7%) |
Income Below Poverty Among Single-Parent Households in Fletcher
| Children | Single Father | Single Mother |
| No Children | 0 (0.0%) | 0 (0.0%) |
| 1 or 2 Children | 0 (0.0%) | 0 (0.0%) |
| 3 or 4 Children | 0 (0.0%) | 0 (0.0%) |
| 5 or more Children | 0 (0.0%) | 0 (0.0%) |
| Total | 0 (0.0%) | 0 (0.0%) |
Income Below Poverty Among Married-Couple vs Single-Parent Households in Fletcher
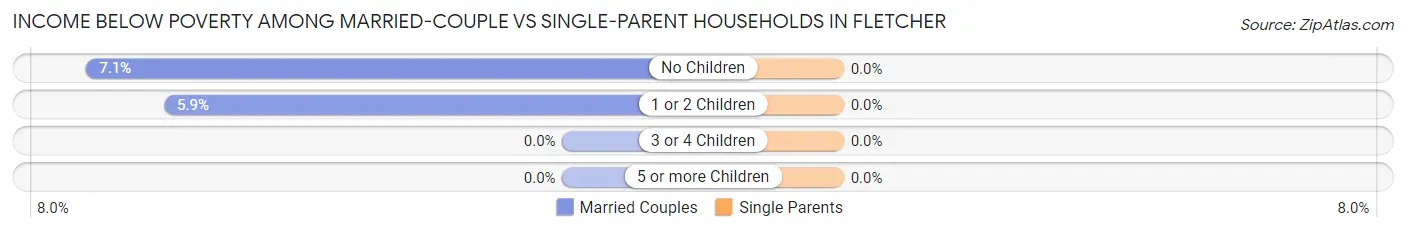
| Children | Married-Couple Families | Single-Parent Households |
| No Children | 103 (7.1%) | 0 (0.0%) |
| 1 or 2 Children | 27 (5.9%) | 0 (0.0%) |
| 3 or 4 Children | 0 (0.0%) | 0 (0.0%) |
| 5 or more Children | 0 (0.0%) | 0 (0.0%) |
| Total | 130 (6.7%) | 0 (0.0%) |
Race in Fletcher
The most populous races in Fletcher are White / Caucasian (6,591 | 82.4%), Hispanic or Latino (620 | 7.7%), and Black / African American (370 | 4.6%).
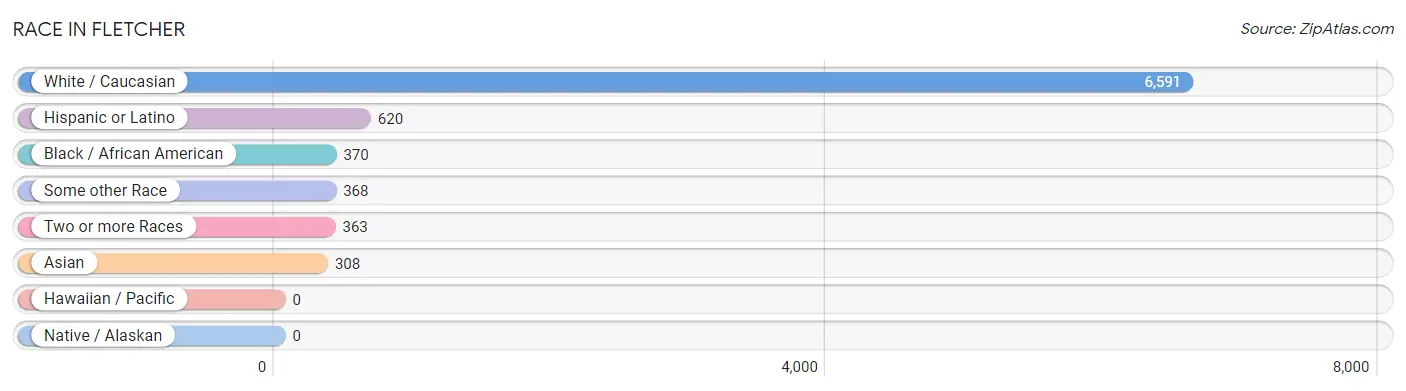
| Race | # Population | % Population |
| Asian | 308 | 3.8% |
| Black / African American | 370 | 4.6% |
| Hawaiian / Pacific | 0 | 0.0% |
| Hispanic or Latino | 620 | 7.7% |
| Native / Alaskan | 0 | 0.0% |
| White / Caucasian | 6,591 | 82.4% |
| Two or more Races | 363 | 4.5% |
| Some other Race | 368 | 4.6% |
| Total | 8,000 | 100.0% |
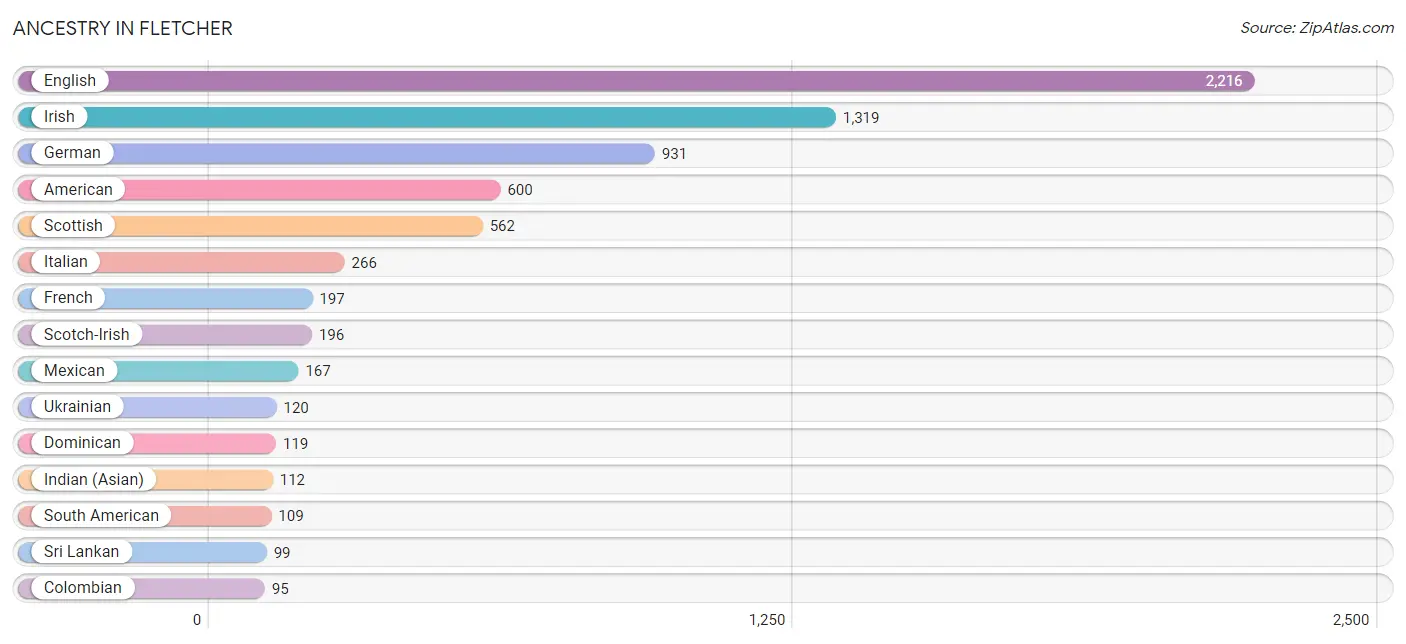
Ancestry in Fletcher
The most populous ancestries reported in Fletcher are English (2,216 | 27.7%), Irish (1,319 | 16.5%), German (931 | 11.6%), American (600 | 7.5%), and Scottish (562 | 7.0%), together accounting for 70.4% of all Fletcher residents.
| Ancestry | # Population | % Population |
| American | 600 | 7.5% |
| Arab | 60 | 0.7% |
| Austrian | 51 | 0.6% |
| British | 37 | 0.5% |
| Burmese | 32 | 0.4% |
| Canadian | 18 | 0.2% |
| Central American | 89 | 1.1% |
| Cherokee | 20 | 0.3% |
| Chilean | 8 | 0.1% |
| Colombian | 95 | 1.2% |
| Costa Rican | 32 | 0.4% |
| Dominican | 119 | 1.5% |
| Dutch | 37 | 0.5% |
| English | 2,216 | 27.7% |
| European | 45 | 0.6% |
| Finnish | 14 | 0.2% |
| French | 197 | 2.5% |
| French Canadian | 41 | 0.5% |
| German | 931 | 11.6% |
| Greek | 15 | 0.2% |
| Hungarian | 88 | 1.1% |
| Indian (Asian) | 112 | 1.4% |
| Irish | 1,319 | 16.5% |
| Italian | 266 | 3.3% |
| Jamaican | 17 | 0.2% |
| Korean | 85 | 1.1% |
| Lebanese | 14 | 0.2% |
| Macedonian | 15 | 0.2% |
| Mexican | 167 | 2.1% |
| Moroccan | 46 | 0.6% |
| Nicaraguan | 24 | 0.3% |
| Northern European | 15 | 0.2% |
| Norwegian | 51 | 0.6% |
| Polish | 41 | 0.5% |
| Puerto Rican | 71 | 0.9% |
| Russian | 5 | 0.1% |
| Salvadoran | 33 | 0.4% |
| Scotch-Irish | 196 | 2.5% |
| Scottish | 562 | 7.0% |
| South African | 16 | 0.2% |
| South American | 109 | 1.4% |
| Sri Lankan | 99 | 1.2% |
| Subsaharan African | 16 | 0.2% |
| Swedish | 89 | 1.1% |
| Thai | 36 | 0.4% |
| Ukrainian | 120 | 1.5% |
| Venezuelan | 6 | 0.1% |
| Welsh | 39 | 0.5% | View All 48 Rows |
Immigrants in Fletcher
The most numerous immigrant groups reported in Fletcher came from Asia (315 | 3.9%), Europe (192 | 2.4%), Eastern Asia (158 | 2.0%), South Eastern Asia (143 | 1.8%), and Eastern Europe (137 | 1.7%), together accounting for 11.8% of all Fletcher residents.
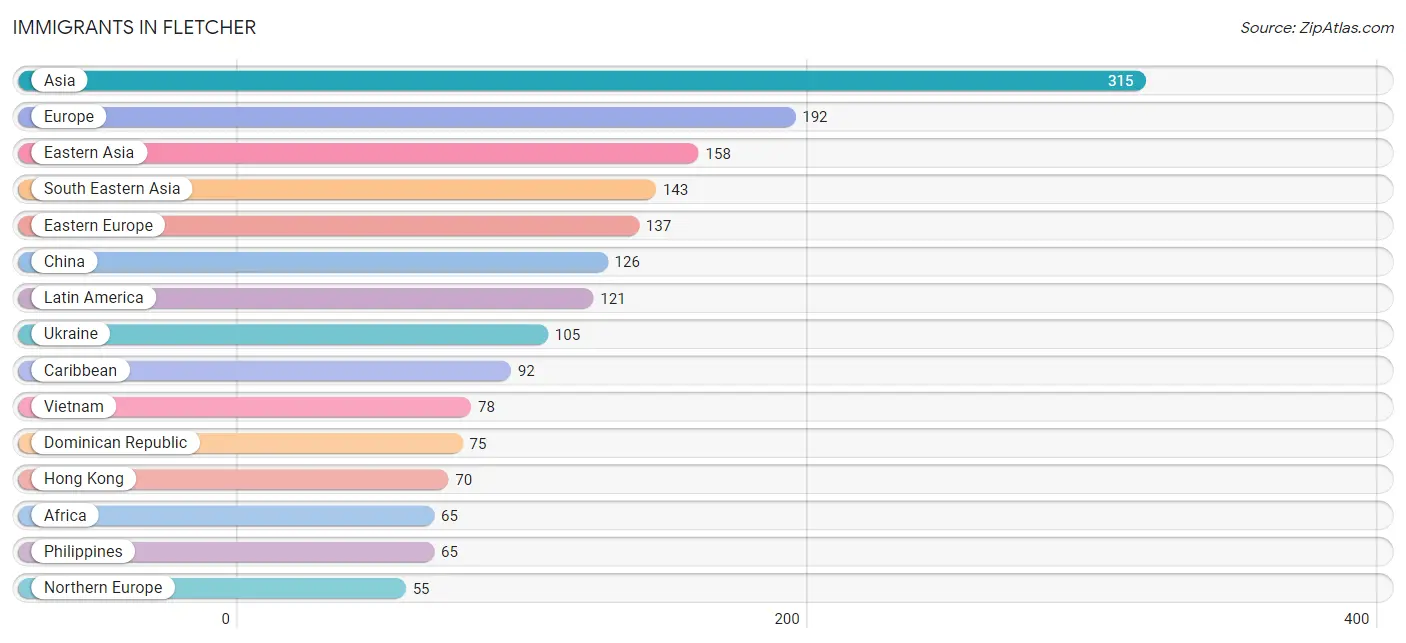
| Immigration Origin | # Population | % Population |
| Africa | 65 | 0.8% |
| Asia | 315 | 3.9% |
| Canada | 21 | 0.3% |
| Caribbean | 92 | 1.1% |
| Central America | 15 | 0.2% |
| Chile | 8 | 0.1% |
| China | 126 | 1.6% |
| Dominican Republic | 75 | 0.9% |
| Eastern Asia | 158 | 2.0% |
| Eastern Europe | 137 | 1.7% |
| El Salvador | 15 | 0.2% |
| England | 6 | 0.1% |
| Europe | 192 | 2.4% |
| Hong Kong | 70 | 0.9% |
| Jamaica | 17 | 0.2% |
| Korea | 32 | 0.4% |
| Latin America | 121 | 1.5% |
| Lebanon | 14 | 0.2% |
| Morocco | 46 | 0.6% |
| North Macedonia | 15 | 0.2% |
| Northern Africa | 46 | 0.6% |
| Northern Europe | 55 | 0.7% |
| Philippines | 65 | 0.8% |
| Romania | 17 | 0.2% |
| South Africa | 19 | 0.2% |
| South America | 14 | 0.2% |
| South Eastern Asia | 143 | 1.8% |
| Ukraine | 105 | 1.3% |
| Venezuela | 6 | 0.1% |
| Vietnam | 78 | 1.0% |
| Western Asia | 14 | 0.2% | View All 31 Rows |
Sex and Age in Fletcher
Sex and Age in Fletcher
The most populous age groups in Fletcher are 40 to 44 Years (489 | 13.2%) for men and 20 to 24 Years (454 | 10.6%) for women.
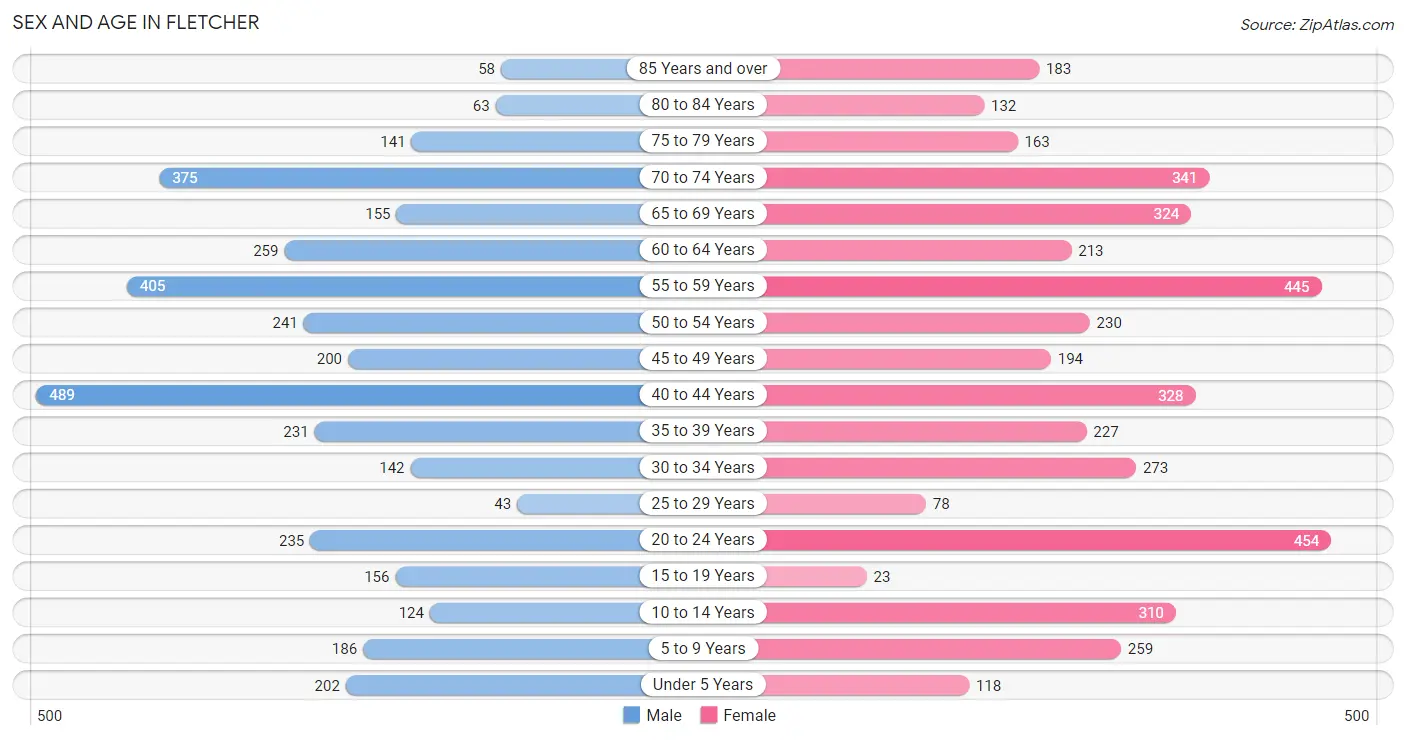
| Age Bracket | Male | Female |
| Under 5 Years | 202 (5.4%) | 118 (2.8%) |
| 5 to 9 Years | 186 (5.0%) | 259 (6.0%) |
| 10 to 14 Years | 124 (3.4%) | 310 (7.2%) |
| 15 to 19 Years | 156 (4.2%) | 23 (0.5%) |
| 20 to 24 Years | 235 (6.3%) | 454 (10.6%) |
| 25 to 29 Years | 43 (1.2%) | 78 (1.8%) |
| 30 to 34 Years | 142 (3.8%) | 273 (6.4%) |
| 35 to 39 Years | 231 (6.2%) | 227 (5.3%) |
| 40 to 44 Years | 489 (13.2%) | 328 (7.6%) |
| 45 to 49 Years | 200 (5.4%) | 194 (4.5%) |
| 50 to 54 Years | 241 (6.5%) | 230 (5.4%) |
| 55 to 59 Years | 405 (10.9%) | 445 (10.4%) |
| 60 to 64 Years | 259 (7.0%) | 213 (5.0%) |
| 65 to 69 Years | 155 (4.2%) | 324 (7.5%) |
| 70 to 74 Years | 375 (10.1%) | 341 (7.9%) |
| 75 to 79 Years | 141 (3.8%) | 163 (3.8%) |
| 80 to 84 Years | 63 (1.7%) | 132 (3.1%) |
| 85 Years and over | 58 (1.6%) | 183 (4.3%) |
| Total | 3,705 (100.0%) | 4,295 (100.0%) |
Families and Households in Fletcher
Median Family Size in Fletcher
The median family size in Fletcher is 2.73 persons per family, with single male/father families (124 | 5.1%) accounting for the largest median family size of 2.85 persons per family. On the other hand, single female/mother families (376 | 15.4%) represent the smallest median family size with 2.65 persons per family.
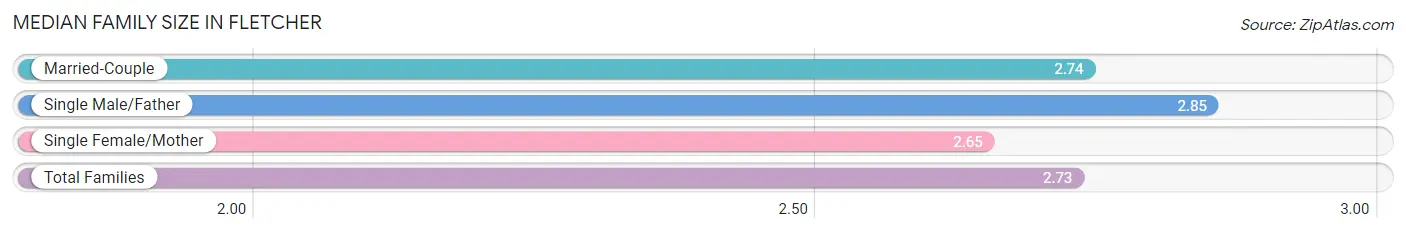
| Family Type | # Families | Family Size |
| Married-Couple | 1,947 (79.6%) | 2.74 |
| Single Male/Father | 124 (5.1%) | 2.85 |
| Single Female/Mother | 376 (15.4%) | 2.65 |
| Total Families | 2,447 (100.0%) | 2.73 |
Median Household Size in Fletcher
The median household size in Fletcher is 2.32 persons per household, with single male/father households (124 | 3.6%) accounting for the largest median household size of 2.85 persons per household. non-family households (970 | 28.4%) represent the smallest median household size with 1.19 persons per household.
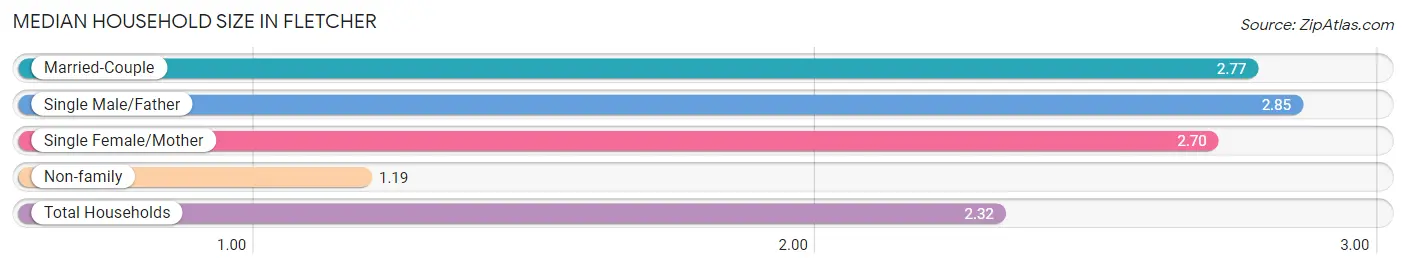
| Household Type | # Households | Household Size |
| Married-Couple | 1,947 (57.0%) | 2.77 |
| Single Male/Father | 124 (3.6%) | 2.85 |
| Single Female/Mother | 376 (11.0%) | 2.70 |
| Non-family | 970 (28.4%) | 1.19 |
| Total Households | 3,417 (100.0%) | 2.32 |
Household Size by Marriage Status in Fletcher
Out of a total of 3,417 households in Fletcher, 2,447 (71.6%) are family households, while 970 (28.4%) are nonfamily households. The most numerous type of family households are 2-person households, comprising 1,551, and the most common type of nonfamily households are 1-person households, comprising 830.
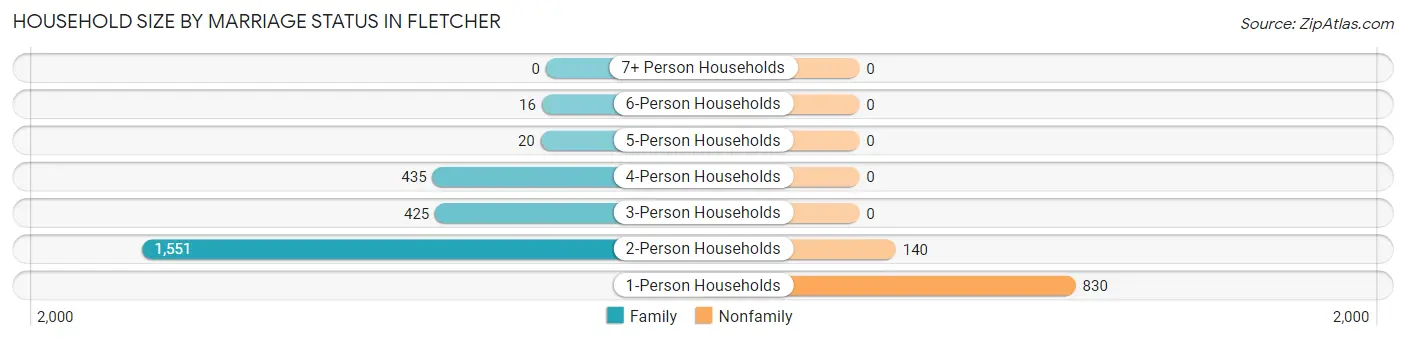
| Household Size | Family Households | Nonfamily Households |
| 1-Person Households | - | 830 (24.3%) |
| 2-Person Households | 1,551 (45.4%) | 140 (4.1%) |
| 3-Person Households | 425 (12.4%) | 0 (0.0%) |
| 4-Person Households | 435 (12.7%) | 0 (0.0%) |
| 5-Person Households | 20 (0.6%) | 0 (0.0%) |
| 6-Person Households | 16 (0.5%) | 0 (0.0%) |
| 7+ Person Households | 0 (0.0%) | 0 (0.0%) |
| Total | 2,447 (71.6%) | 970 (28.4%) |
Female Fertility in Fletcher
Fertility by Age in Fletcher
Average fertility rate in Fletcher is 15.0 births per 1,000 women. Women in the age bracket of 35 to 50 years have the highest fertility rate with 31.0 births per 1,000 women. Women in the age bracket of 35 to 50 years acount for 100.0% of all women with births.
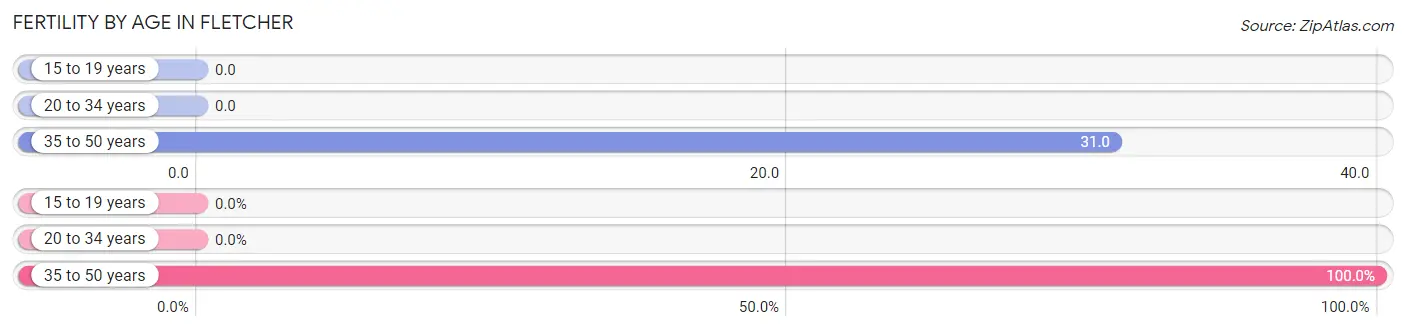
| Age Bracket | Women with Births | Births / 1,000 Women |
| 15 to 19 years | 0 (0.0%) | 0.0 |
| 20 to 34 years | 0 (0.0%) | 0.0 |
| 35 to 50 years | 24 (100.0%) | 31.0 |
| Total | 24 (100.0%) | 15.0 |
Fertility by Age by Marriage Status in Fletcher
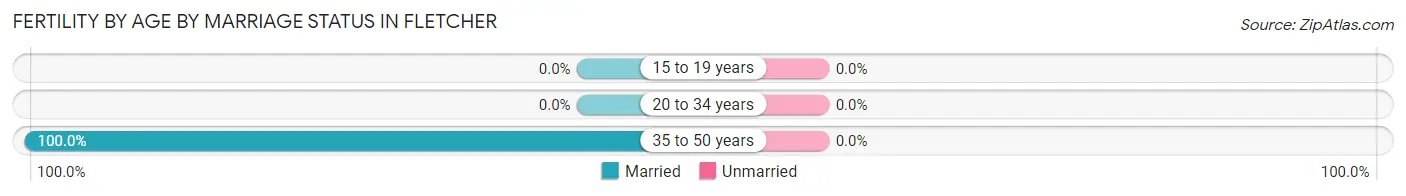
| Age Bracket | Married | Unmarried |
| 15 to 19 years | 0 (0.0%) | 0 (0.0%) |
| 20 to 34 years | 0 (0.0%) | 0 (0.0%) |
| 35 to 50 years | 24 (100.0%) | 0 (0.0%) |
| Total | 24 (100.0%) | 0 (0.0%) |
Fertility by Education in Fletcher
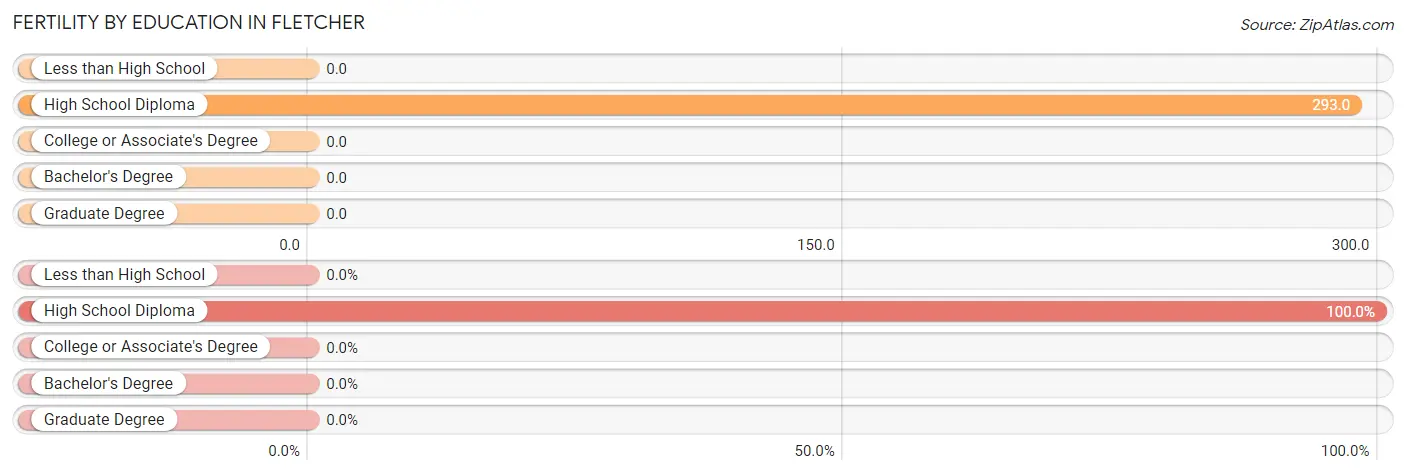
| Educational Attainment | Women with Births | Births / 1,000 Women |
| Less than High School | 0 (0.0%) | 0.0 |
| High School Diploma | 24 (100.0%) | 293.0 |
| College or Associate's Degree | 0 (0.0%) | 0.0 |
| Bachelor's Degree | 0 (0.0%) | 0.0 |
| Graduate Degree | 0 (0.0%) | 0.0 |
| Total | 24 (100.0%) | 15.0 |
Fertility by Education by Marriage Status in Fletcher
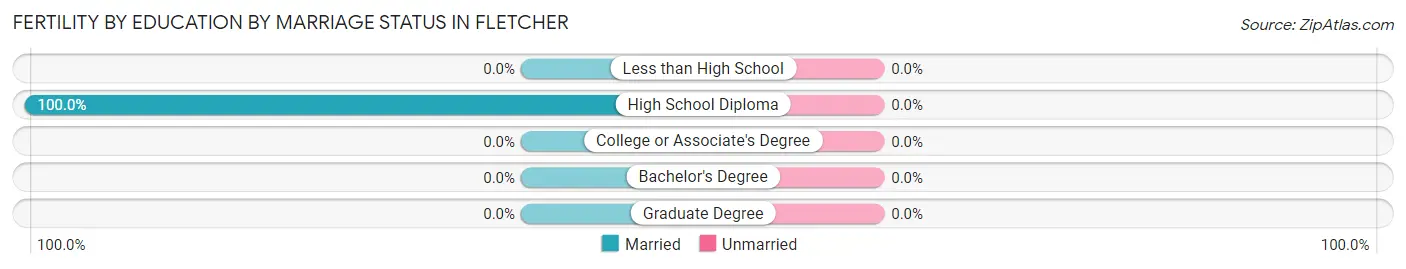
| Educational Attainment | Married | Unmarried |
| Less than High School | 0 (0.0%) | 0 (0.0%) |
| High School Diploma | 24 (100.0%) | 0 (0.0%) |
| College or Associate's Degree | 0 (0.0%) | 0 (0.0%) |
| Bachelor's Degree | 0 (0.0%) | 0 (0.0%) |
| Graduate Degree | 0 (0.0%) | 0 (0.0%) |
| Total | 24 (100.0%) | 0 (0.0%) |
Employment Characteristics in Fletcher
Employment by Class of Employer in Fletcher
Among the 3,838 employed individuals in Fletcher, private company employees (2,832 | 73.8%), not-for-profit organizations (239 | 6.2%), and self-employed (not incorporated) (201 | 5.2%) make up the most common classes of employment.
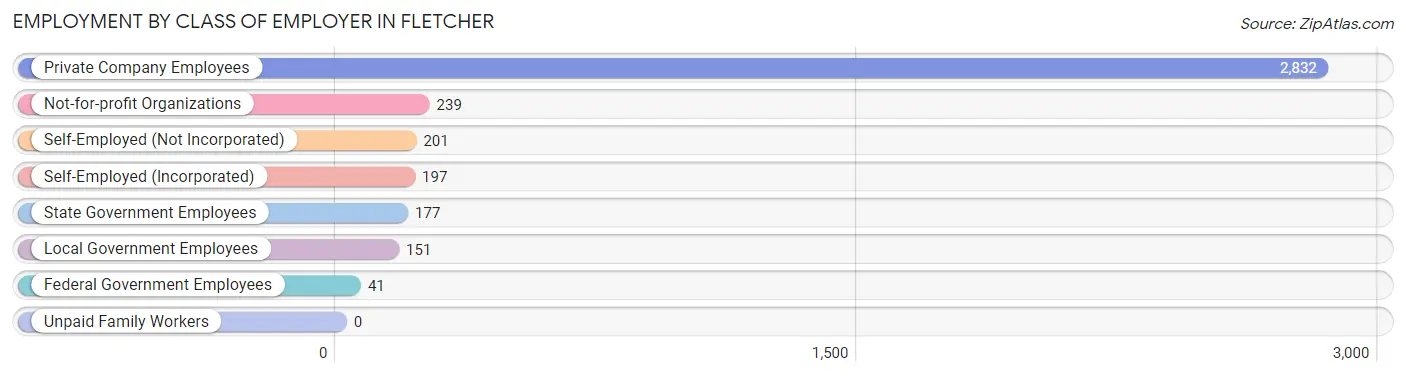
| Employer Class | # Employees | % Employees |
| Private Company Employees | 2,832 | 73.8% |
| Self-Employed (Incorporated) | 197 | 5.1% |
| Self-Employed (Not Incorporated) | 201 | 5.2% |
| Not-for-profit Organizations | 239 | 6.2% |
| Local Government Employees | 151 | 3.9% |
| State Government Employees | 177 | 4.6% |
| Federal Government Employees | 41 | 1.1% |
| Unpaid Family Workers | 0 | 0.0% |
| Total | 3,838 | 100.0% |
Employment Status by Age in Fletcher
According to the labor force statistics for Fletcher, out of the total population over 16 years of age (6,801), 59.3% or 4,033 individuals are in the labor force, with 3.1% or 125 of them unemployed. The age group with the highest labor force participation rate is 25 to 29 years, with 100.0% or 121 individuals in the labor force. Within the labor force, the 65 to 74 years age range has the highest percentage of unemployed individuals, with 13.2% or 35 of them being unemployed.
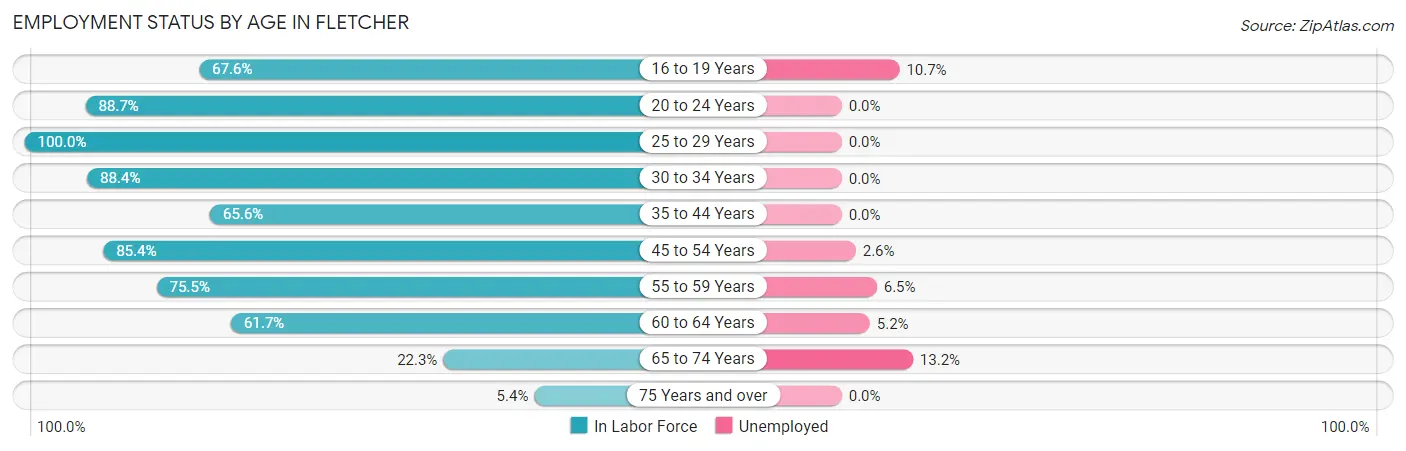
| Age Bracket | In Labor Force | Unemployed |
| 16 to 19 Years | 121 (67.6%) | 13 (10.7%) |
| 20 to 24 Years | 611 (88.7%) | 0 (0.0%) |
| 25 to 29 Years | 121 (100.0%) | 0 (0.0%) |
| 30 to 34 Years | 367 (88.4%) | 0 (0.0%) |
| 35 to 44 Years | 836 (65.6%) | 0 (0.0%) |
| 45 to 54 Years | 739 (85.4%) | 19 (2.6%) |
| 55 to 59 Years | 642 (75.5%) | 42 (6.5%) |
| 60 to 64 Years | 291 (61.7%) | 15 (5.2%) |
| 65 to 74 Years | 266 (22.3%) | 35 (13.2%) |
| 75 Years and over | 40 (5.4%) | 0 (0.0%) |
| Total | 4,033 (59.3%) | 125 (3.1%) |
Employment Status by Educational Attainment in Fletcher
According to labor force statistics for Fletcher, 75.0% of individuals (2,998) out of the total population between 25 and 64 years of age (3,998) are in the labor force, with 2.5% or 75 of them being unemployed. The group with the highest labor force participation rate are those with the educational attainment of bachelor's degree or higher, with 83.1% or 1,217 individuals in the labor force. Within the labor force, individuals with bachelor's degree or higher education have the highest percentage of unemployment, with 4.4% or 54 of them being unemployed.
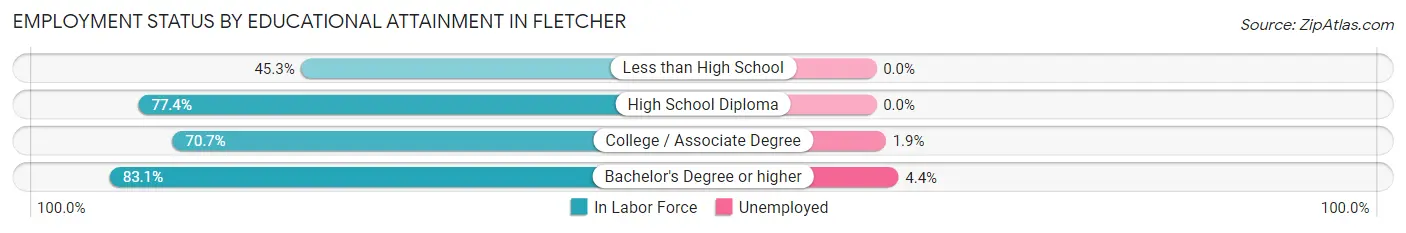
| Educational Attainment | In Labor Force | Unemployed |
| Less than High School | 102 (45.3%) | 0 (0.0%) |
| High School Diploma | 533 (77.4%) | 0 (0.0%) |
| College / Associate Degree | 1,145 (70.7%) | 31 (1.9%) |
| Bachelor's Degree or higher | 1,217 (83.1%) | 64 (4.4%) |
| Total | 2,998 (75.0%) | 100 (2.5%) |
Employment Occupations by Sex in Fletcher
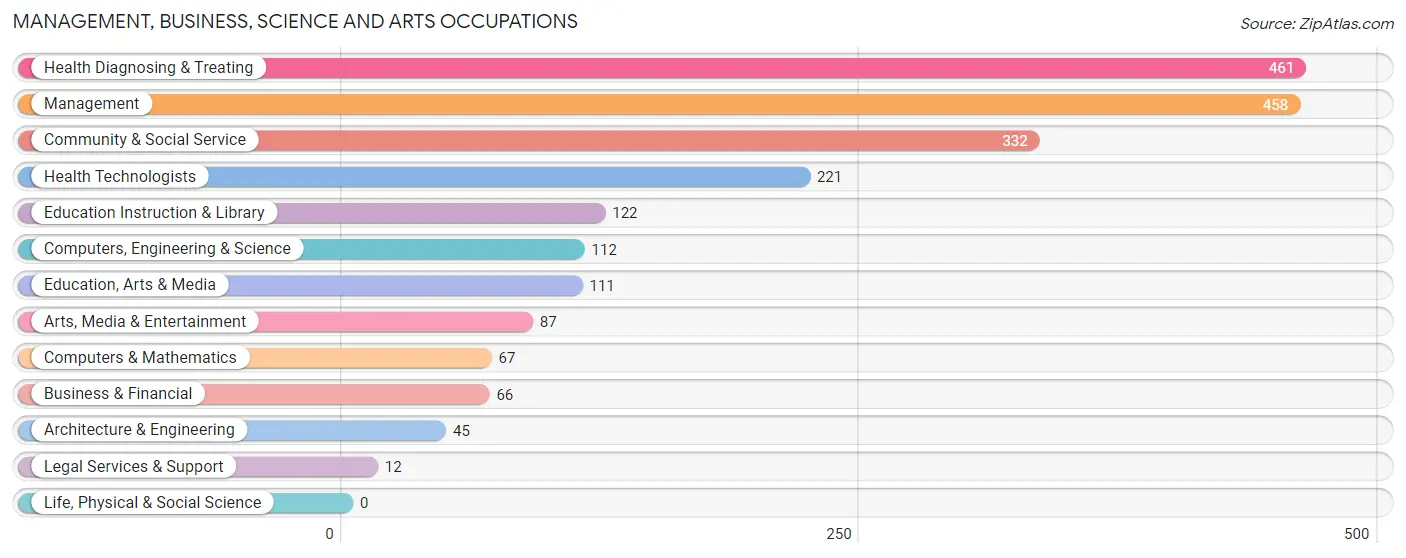
Management, Business, Science and Arts Occupations
The most common Management, Business, Science and Arts occupations in Fletcher are Health Diagnosing & Treating (461 | 11.8%), Management (458 | 11.7%), Community & Social Service (332 | 8.5%), Health Technologists (221 | 5.7%), and Education Instruction & Library (122 | 3.1%).
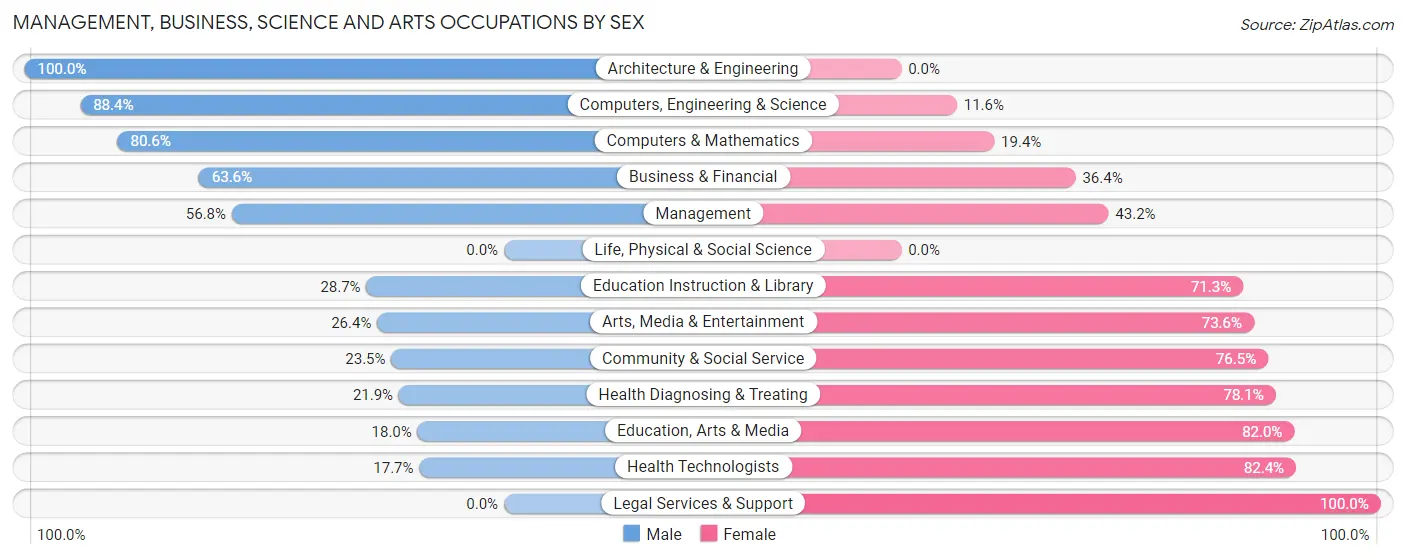
Management, Business, Science and Arts Occupations by Sex
Within the Management, Business, Science and Arts occupations in Fletcher, the most male-oriented occupations are Architecture & Engineering (100.0%), Computers, Engineering & Science (88.4%), and Computers & Mathematics (80.6%), while the most female-oriented occupations are Legal Services & Support (100.0%), Health Technologists (82.4%), and Education, Arts & Media (82.0%).
| Occupation | Male | Female |
| Management | 260 (56.8%) | 198 (43.2%) |
| Business & Financial | 42 (63.6%) | 24 (36.4%) |
| Computers, Engineering & Science | 99 (88.4%) | 13 (11.6%) |
| Computers & Mathematics | 54 (80.6%) | 13 (19.4%) |
| Architecture & Engineering | 45 (100.0%) | 0 (0.0%) |
| Life, Physical & Social Science | 0 (0.0%) | 0 (0.0%) |
| Community & Social Service | 78 (23.5%) | 254 (76.5%) |
| Education, Arts & Media | 20 (18.0%) | 91 (82.0%) |
| Legal Services & Support | 0 (0.0%) | 12 (100.0%) |
| Education Instruction & Library | 35 (28.7%) | 87 (71.3%) |
| Arts, Media & Entertainment | 23 (26.4%) | 64 (73.6%) |
| Health Diagnosing & Treating | 101 (21.9%) | 360 (78.1%) |
| Health Technologists | 39 (17.6%) | 182 (82.4%) |
| Total (Category) | 580 (40.6%) | 849 (59.4%) |
| Total (Overall) | 2,095 (53.6%) | 1,816 (46.4%) |
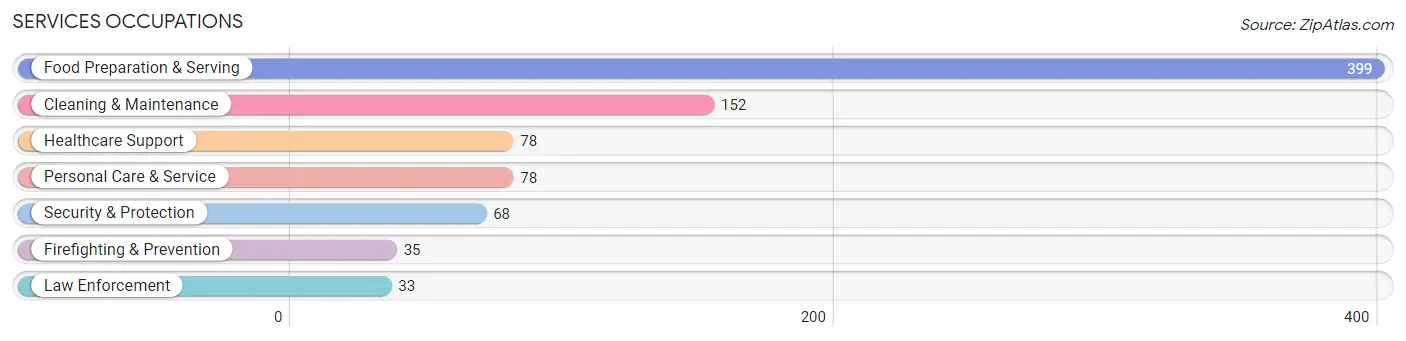
Services Occupations
The most common Services occupations in Fletcher are Food Preparation & Serving (399 | 10.2%), Cleaning & Maintenance (152 | 3.9%), Healthcare Support (78 | 2.0%), Personal Care & Service (78 | 2.0%), and Security & Protection (68 | 1.7%).
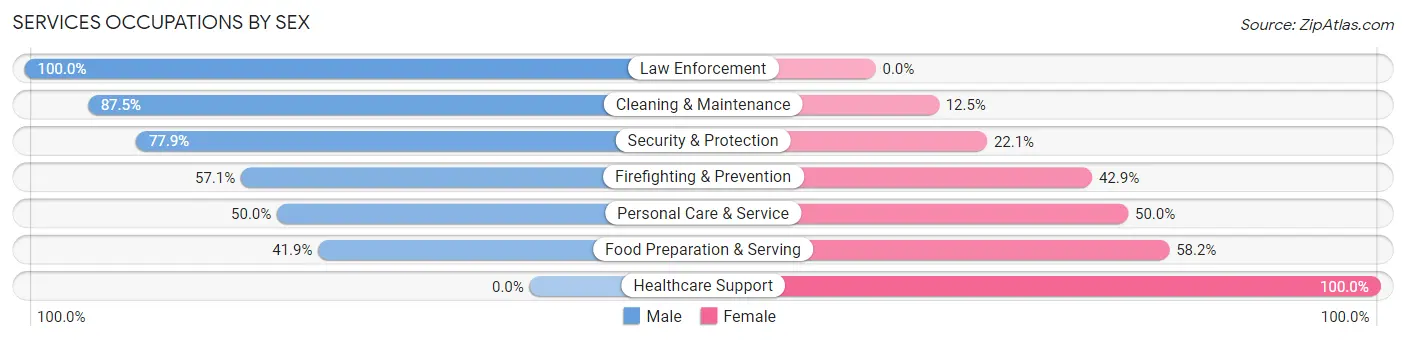
Services Occupations by Sex
Within the Services occupations in Fletcher, the most male-oriented occupations are Law Enforcement (100.0%), Cleaning & Maintenance (87.5%), and Security & Protection (77.9%), while the most female-oriented occupations are Healthcare Support (100.0%), Food Preparation & Serving (58.2%), and Personal Care & Service (50.0%).
| Occupation | Male | Female |
| Healthcare Support | 0 (0.0%) | 78 (100.0%) |
| Security & Protection | 53 (77.9%) | 15 (22.1%) |
| Firefighting & Prevention | 20 (57.1%) | 15 (42.9%) |
| Law Enforcement | 33 (100.0%) | 0 (0.0%) |
| Food Preparation & Serving | 167 (41.8%) | 232 (58.2%) |
| Cleaning & Maintenance | 133 (87.5%) | 19 (12.5%) |
| Personal Care & Service | 39 (50.0%) | 39 (50.0%) |
| Total (Category) | 392 (50.6%) | 383 (49.4%) |
| Total (Overall) | 2,095 (53.6%) | 1,816 (46.4%) |
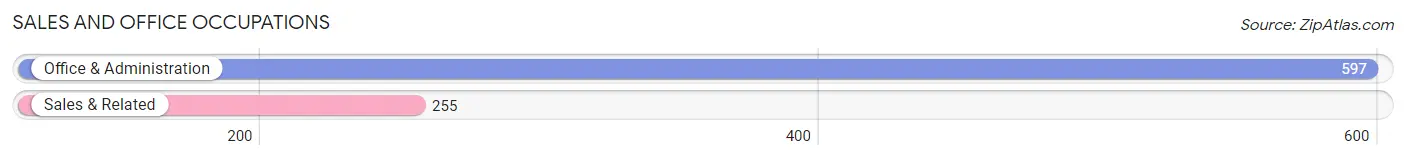
Sales and Office Occupations
The most common Sales and Office occupations in Fletcher are Office & Administration (597 | 15.3%), and Sales & Related (255 | 6.5%).
Sales and Office Occupations by Sex
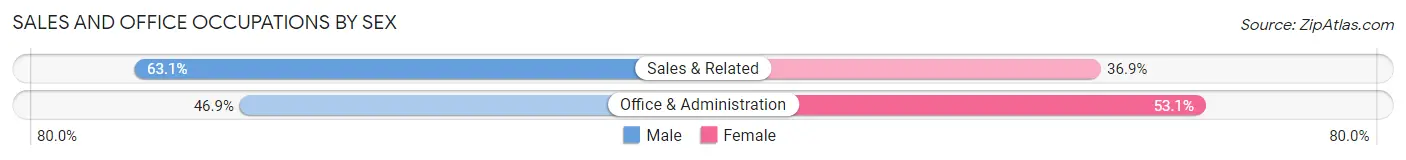
| Occupation | Male | Female |
| Sales & Related | 161 (63.1%) | 94 (36.9%) |
| Office & Administration | 280 (46.9%) | 317 (53.1%) |
| Total (Category) | 441 (51.8%) | 411 (48.2%) |
| Total (Overall) | 2,095 (53.6%) | 1,816 (46.4%) |
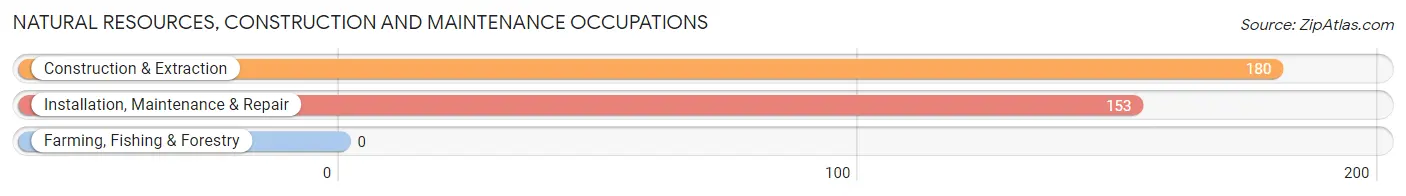
Natural Resources, Construction and Maintenance Occupations
The most common Natural Resources, Construction and Maintenance occupations in Fletcher are Construction & Extraction (180 | 4.6%), and Installation, Maintenance & Repair (153 | 3.9%).
Natural Resources, Construction and Maintenance Occupations by Sex
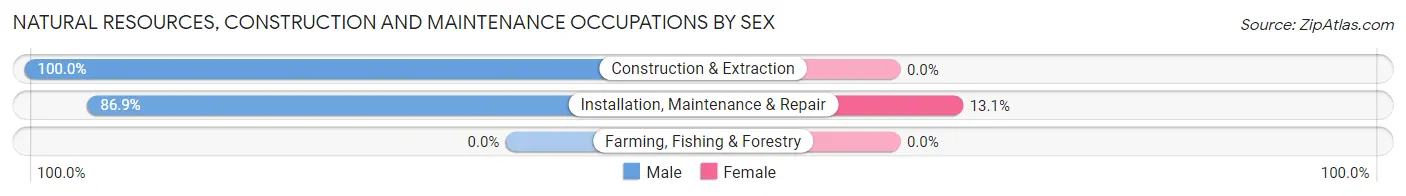
| Occupation | Male | Female |
| Farming, Fishing & Forestry | 0 (0.0%) | 0 (0.0%) |
| Construction & Extraction | 180 (100.0%) | 0 (0.0%) |
| Installation, Maintenance & Repair | 133 (86.9%) | 20 (13.1%) |
| Total (Category) | 313 (94.0%) | 20 (6.0%) |
| Total (Overall) | 2,095 (53.6%) | 1,816 (46.4%) |
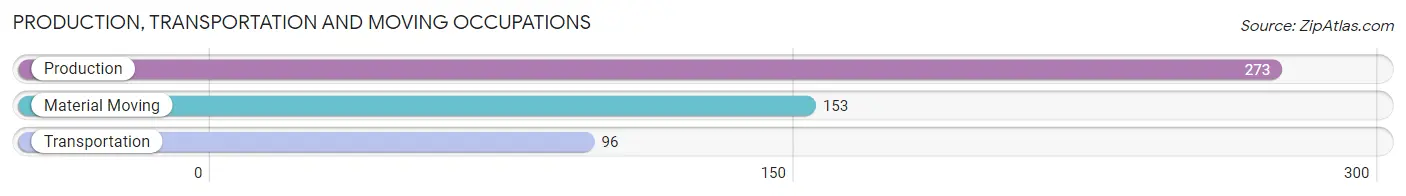
Production, Transportation and Moving Occupations
The most common Production, Transportation and Moving occupations in Fletcher are Production (273 | 7.0%), Material Moving (153 | 3.9%), and Transportation (96 | 2.5%).
Production, Transportation and Moving Occupations by Sex
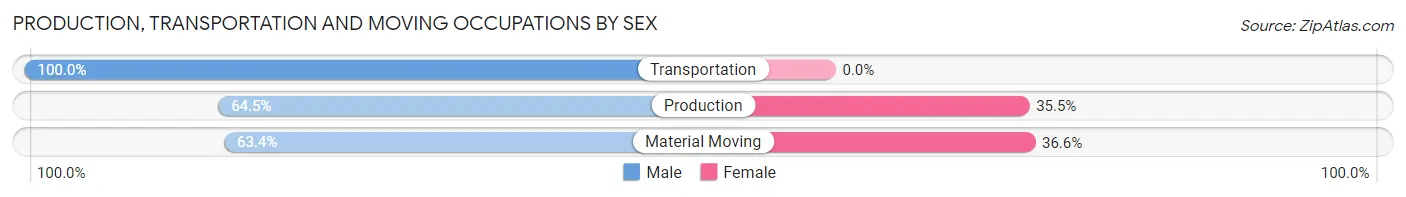
| Occupation | Male | Female |
| Production | 176 (64.5%) | 97 (35.5%) |
| Transportation | 96 (100.0%) | 0 (0.0%) |
| Material Moving | 97 (63.4%) | 56 (36.6%) |
| Total (Category) | 369 (70.7%) | 153 (29.3%) |
| Total (Overall) | 2,095 (53.6%) | 1,816 (46.4%) |
Employment Industries by Sex in Fletcher
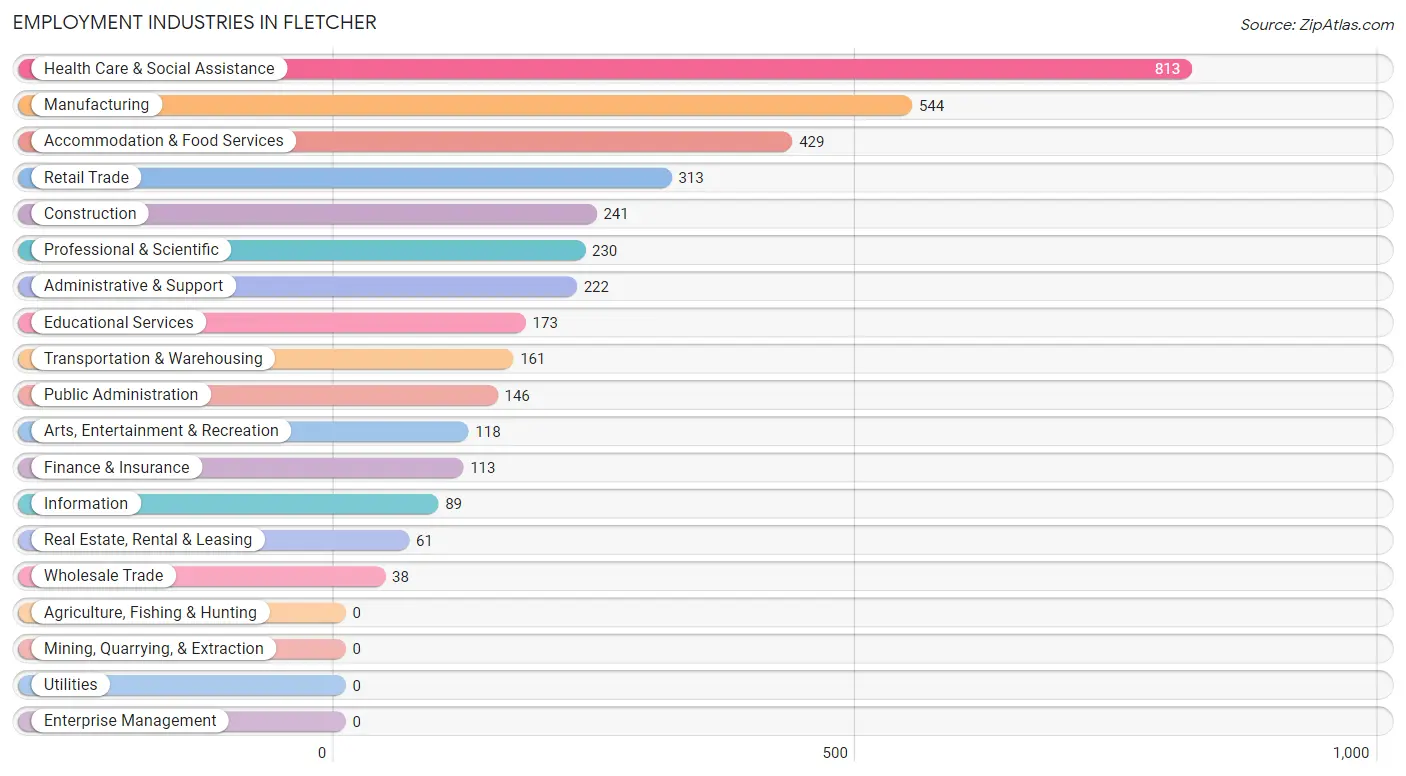
Employment Industries in Fletcher
The major employment industries in Fletcher include Health Care & Social Assistance (813 | 20.8%), Manufacturing (544 | 13.9%), Accommodation & Food Services (429 | 11.0%), Retail Trade (313 | 8.0%), and Construction (241 | 6.2%).
Employment Industries by Sex in Fletcher
The Fletcher industries that see more men than women are Wholesale Trade (100.0%), Real Estate, Rental & Leasing (100.0%), and Arts, Entertainment & Recreation (100.0%), whereas the industries that tend to have a higher number of women are Finance & Insurance (100.0%), Public Administration (77.4%), and Health Care & Social Assistance (76.5%).
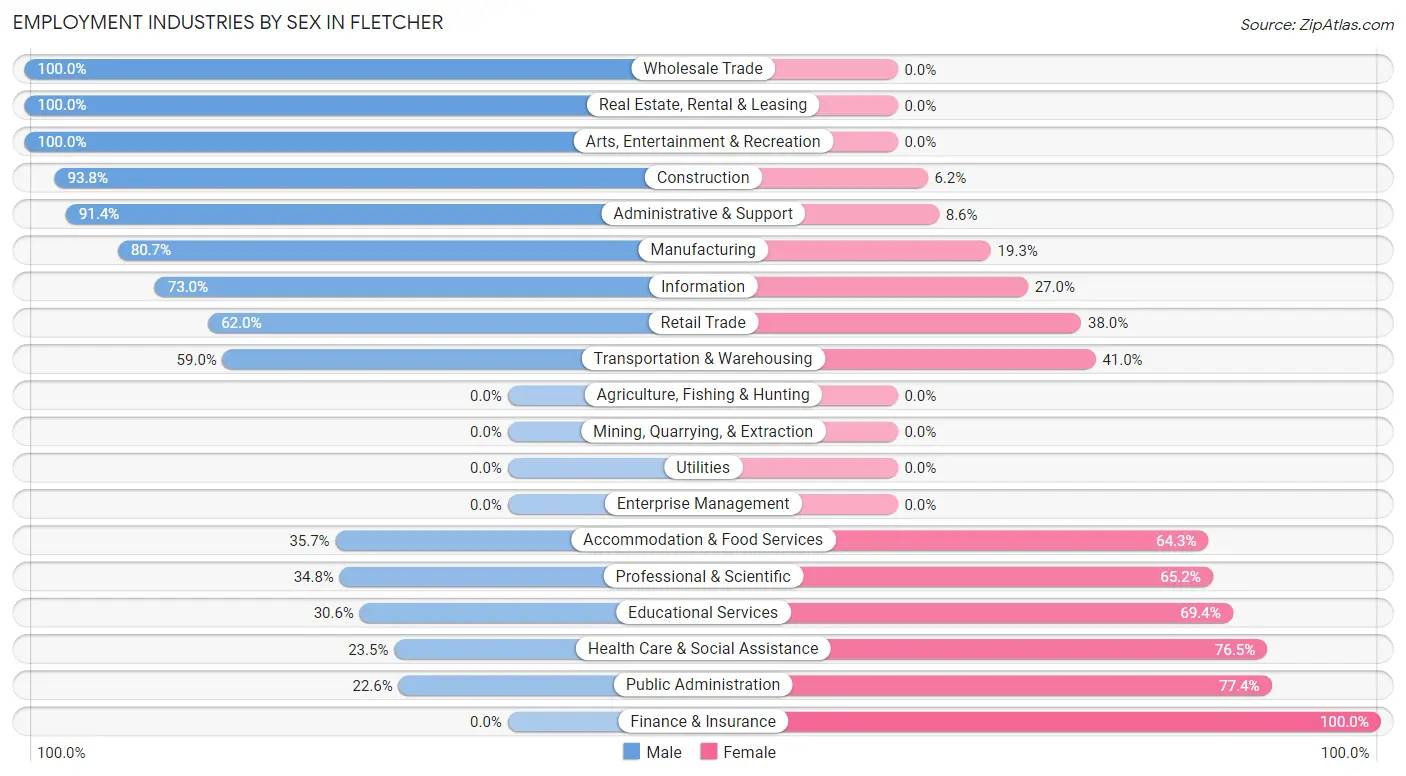
| Industry | Male | Female |
| Agriculture, Fishing & Hunting | 0 (0.0%) | 0 (0.0%) |
| Mining, Quarrying, & Extraction | 0 (0.0%) | 0 (0.0%) |
| Construction | 226 (93.8%) | 15 (6.2%) |
| Manufacturing | 439 (80.7%) | 105 (19.3%) |
| Wholesale Trade | 38 (100.0%) | 0 (0.0%) |
| Retail Trade | 194 (62.0%) | 119 (38.0%) |
| Transportation & Warehousing | 95 (59.0%) | 66 (41.0%) |
| Utilities | 0 (0.0%) | 0 (0.0%) |
| Information | 65 (73.0%) | 24 (27.0%) |
| Finance & Insurance | 0 (0.0%) | 113 (100.0%) |
| Real Estate, Rental & Leasing | 61 (100.0%) | 0 (0.0%) |
| Professional & Scientific | 80 (34.8%) | 150 (65.2%) |
| Enterprise Management | 0 (0.0%) | 0 (0.0%) |
| Administrative & Support | 203 (91.4%) | 19 (8.6%) |
| Educational Services | 53 (30.6%) | 120 (69.4%) |
| Health Care & Social Assistance | 191 (23.5%) | 622 (76.5%) |
| Arts, Entertainment & Recreation | 118 (100.0%) | 0 (0.0%) |
| Accommodation & Food Services | 153 (35.7%) | 276 (64.3%) |
| Public Administration | 33 (22.6%) | 113 (77.4%) |
| Total | 2,095 (53.6%) | 1,816 (46.4%) |
Education in Fletcher
School Enrollment in Fletcher
The most common levels of schooling among the 1,545 students in Fletcher are college / undergraduate (515 | 33.3%), elementary school (409 | 26.5%), and middle school (269 | 17.4%).
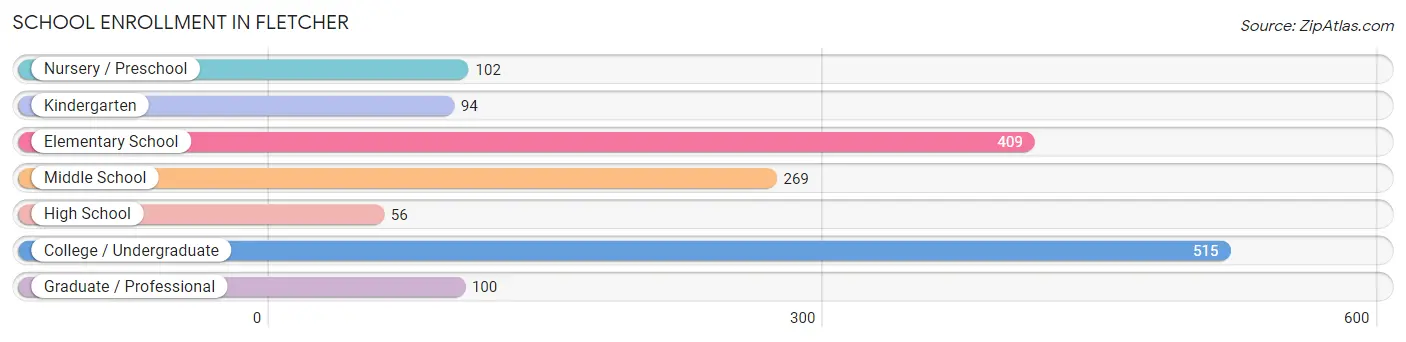
| School Level | # Students | % Students |
| Nursery / Preschool | 102 | 6.6% |
| Kindergarten | 94 | 6.1% |
| Elementary School | 409 | 26.5% |
| Middle School | 269 | 17.4% |
| High School | 56 | 3.6% |
| College / Undergraduate | 515 | 33.3% |
| Graduate / Professional | 100 | 6.5% |
| Total | 1,545 | 100.0% |
School Enrollment by Age by Funding Source in Fletcher
Out of a total of 1,545 students who are enrolled in schools in Fletcher, 320 (20.7%) attend a private institution, while the remaining 1,225 (79.3%) are enrolled in public schools. The age group of 3 to 4 year olds has the highest likelihood of being enrolled in private schools, with 62 (60.8% in the age bracket) enrolled. Conversely, the age group of 15 to 17 year olds has the lowest likelihood of being enrolled in a private school, with 30 (100.0% in the age bracket) attending a public institution.
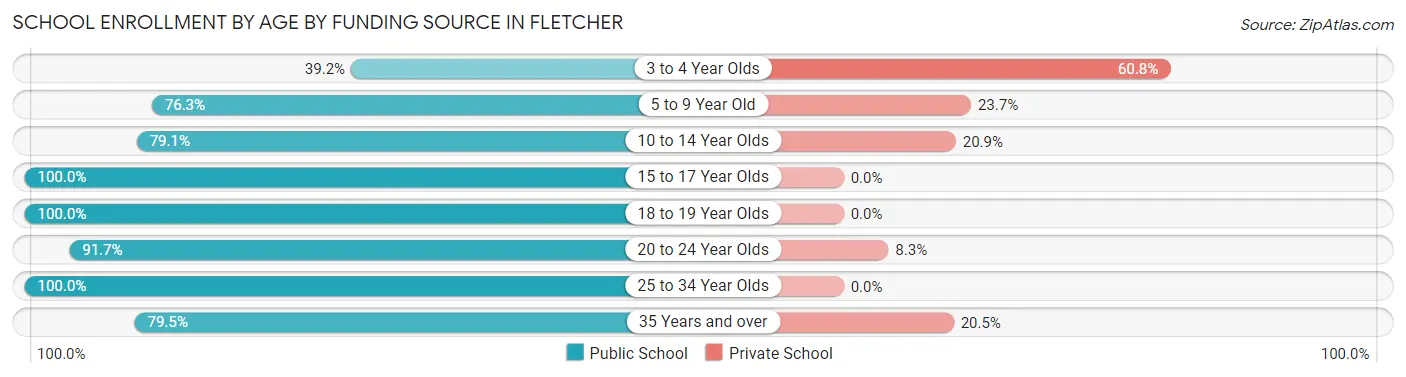
| Age Bracket | Public School | Private School |
| 3 to 4 Year Olds | 40 (39.2%) | 62 (60.8%) |
| 5 to 9 Year Old | 325 (76.3%) | 101 (23.7%) |
| 10 to 14 Year Olds | 284 (79.1%) | 75 (20.9%) |
| 15 to 17 Year Olds | 30 (100.0%) | 0 (0.0%) |
| 18 to 19 Year Olds | 39 (100.0%) | 0 (0.0%) |
| 20 to 24 Year Olds | 264 (91.7%) | 24 (8.3%) |
| 25 to 34 Year Olds | 18 (100.0%) | 0 (0.0%) |
| 35 Years and over | 225 (79.5%) | 58 (20.5%) |
| Total | 1,225 (79.3%) | 320 (20.7%) |
Educational Attainment by Field of Study in Fletcher
Education (519 | 23.1%), science & technology (313 | 13.9%), business (285 | 12.7%), arts & humanities (181 | 8.0%), and visual & performing arts (145 | 6.4%) are the most common fields of study among 2,251 individuals in Fletcher who have obtained a bachelor's degree or higher.
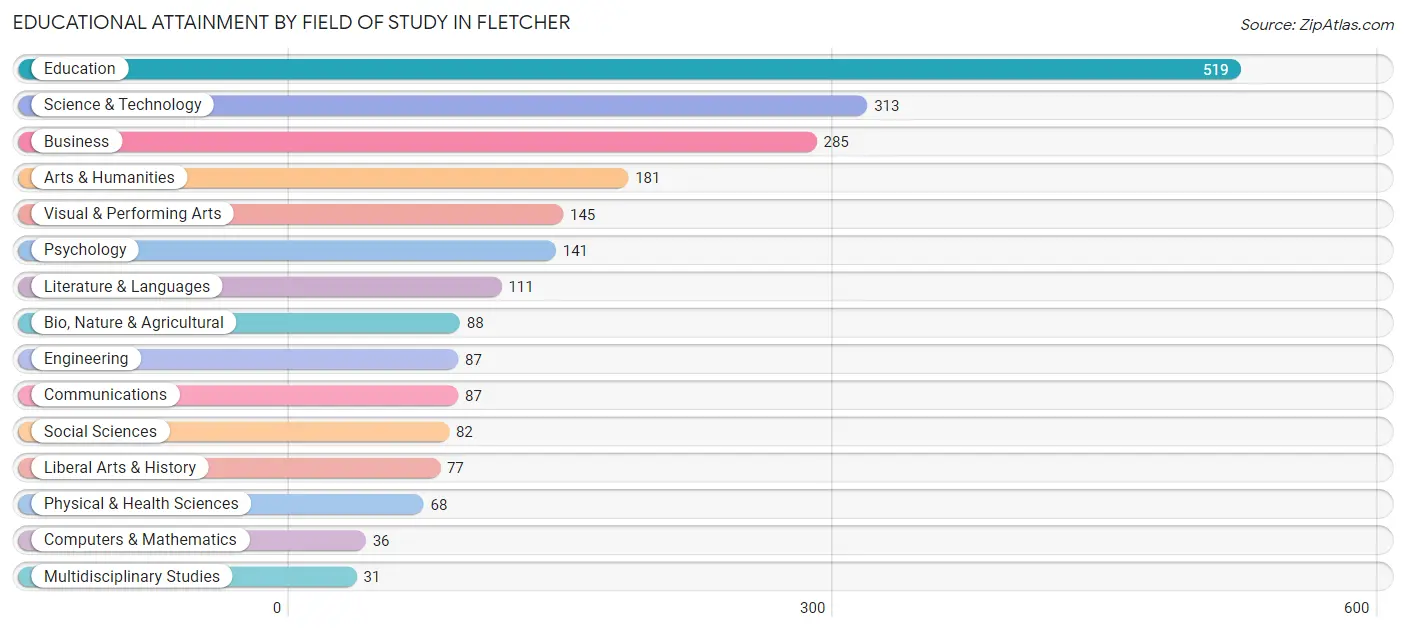
| Field of Study | # Graduates | % Graduates |
| Computers & Mathematics | 36 | 1.6% |
| Bio, Nature & Agricultural | 88 | 3.9% |
| Physical & Health Sciences | 68 | 3.0% |
| Psychology | 141 | 6.3% |
| Social Sciences | 82 | 3.6% |
| Engineering | 87 | 3.9% |
| Multidisciplinary Studies | 31 | 1.4% |
| Science & Technology | 313 | 13.9% |
| Business | 285 | 12.7% |
| Education | 519 | 23.1% |
| Literature & Languages | 111 | 4.9% |
| Liberal Arts & History | 77 | 3.4% |
| Visual & Performing Arts | 145 | 6.4% |
| Communications | 87 | 3.9% |
| Arts & Humanities | 181 | 8.0% |
| Total | 2,251 | 100.0% |
Transportation & Commute in Fletcher
Vehicle Availability by Sex in Fletcher
The most prevalent vehicle ownership categories in Fletcher are males with 2 vehicles (912, accounting for 45.1%) and females with 2 vehicles (1,044, making up 50.2%).
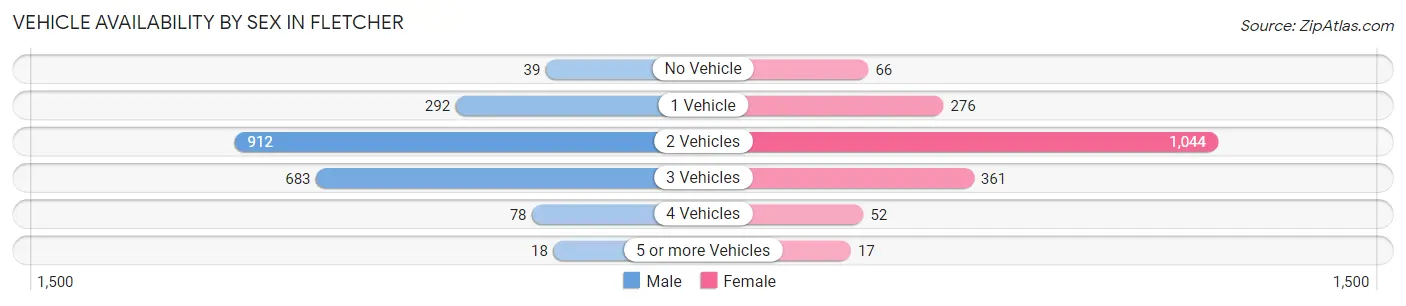
| Vehicles Available | Male | Female |
| No Vehicle | 39 (1.9%) | 66 (3.6%) |
| 1 Vehicle | 292 (14.4%) | 276 (15.2%) |
| 2 Vehicles | 912 (45.1%) | 1,044 (57.5%) |
| 3 Vehicles | 683 (33.8%) | 361 (19.9%) |
| 4 Vehicles | 78 (3.9%) | 52 (2.9%) |
| 5 or more Vehicles | 18 (0.9%) | 17 (0.9%) |
| Total | 2,022 (100.0%) | 1,816 (100.0%) |
Commute Time in Fletcher
The most frequently occuring commute durations in Fletcher are 20 to 24 minutes (814 commuters, 22.5%), 5 to 9 minutes (597 commuters, 16.5%), and 30 to 34 minutes (567 commuters, 15.7%).
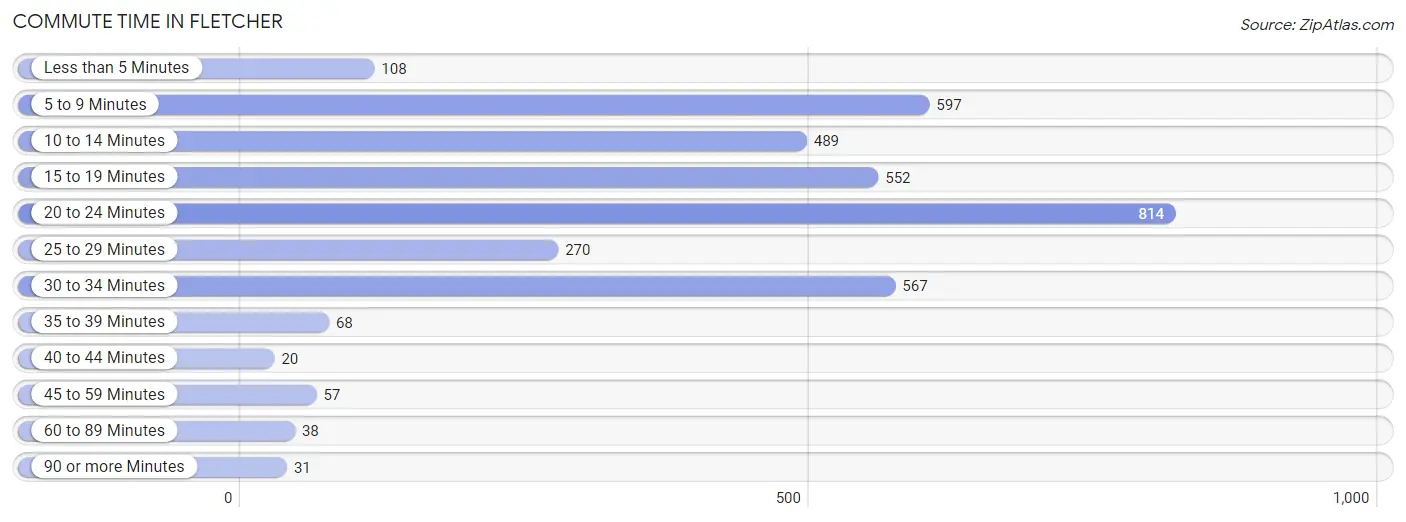
| Commute Time | # Commuters | % Commuters |
| Less than 5 Minutes | 108 | 3.0% |
| 5 to 9 Minutes | 597 | 16.5% |
| 10 to 14 Minutes | 489 | 13.5% |
| 15 to 19 Minutes | 552 | 15.3% |
| 20 to 24 Minutes | 814 | 22.5% |
| 25 to 29 Minutes | 270 | 7.5% |
| 30 to 34 Minutes | 567 | 15.7% |
| 35 to 39 Minutes | 68 | 1.9% |
| 40 to 44 Minutes | 20 | 0.5% |
| 45 to 59 Minutes | 57 | 1.6% |
| 60 to 89 Minutes | 38 | 1.1% |
| 90 or more Minutes | 31 | 0.9% |
Commute Time by Sex in Fletcher
The most common commute times in Fletcher are 20 to 24 minutes (444 commuters, 23.0%) for males and 20 to 24 minutes (370 commuters, 22.0%) for females.
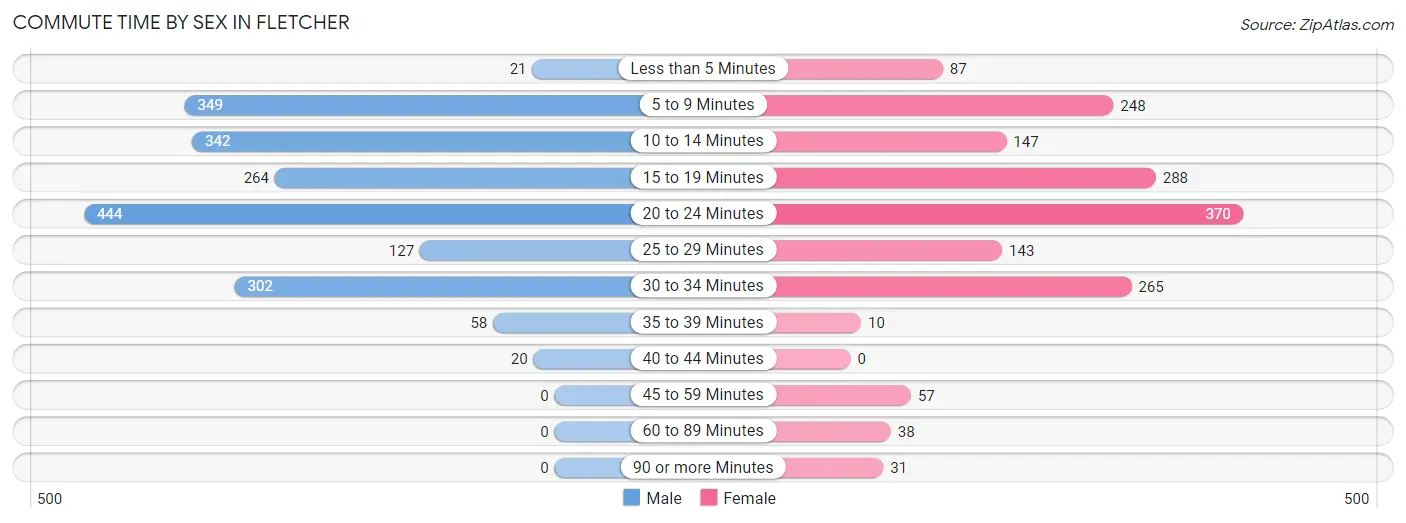
| Commute Time | Male | Female |
| Less than 5 Minutes | 21 (1.1%) | 87 (5.2%) |
| 5 to 9 Minutes | 349 (18.1%) | 248 (14.7%) |
| 10 to 14 Minutes | 342 (17.7%) | 147 (8.7%) |
| 15 to 19 Minutes | 264 (13.7%) | 288 (17.1%) |
| 20 to 24 Minutes | 444 (23.0%) | 370 (22.0%) |
| 25 to 29 Minutes | 127 (6.6%) | 143 (8.5%) |
| 30 to 34 Minutes | 302 (15.7%) | 265 (15.7%) |
| 35 to 39 Minutes | 58 (3.0%) | 10 (0.6%) |
| 40 to 44 Minutes | 20 (1.0%) | 0 (0.0%) |
| 45 to 59 Minutes | 0 (0.0%) | 57 (3.4%) |
| 60 to 89 Minutes | 0 (0.0%) | 38 (2.3%) |
| 90 or more Minutes | 0 (0.0%) | 31 (1.8%) |
Time of Departure to Work by Sex in Fletcher
The most frequent times of departure to work in Fletcher are 7:00 AM to 7:29 AM (411, 21.3%) for males and 7:00 AM to 7:29 AM (294, 17.5%) for females.
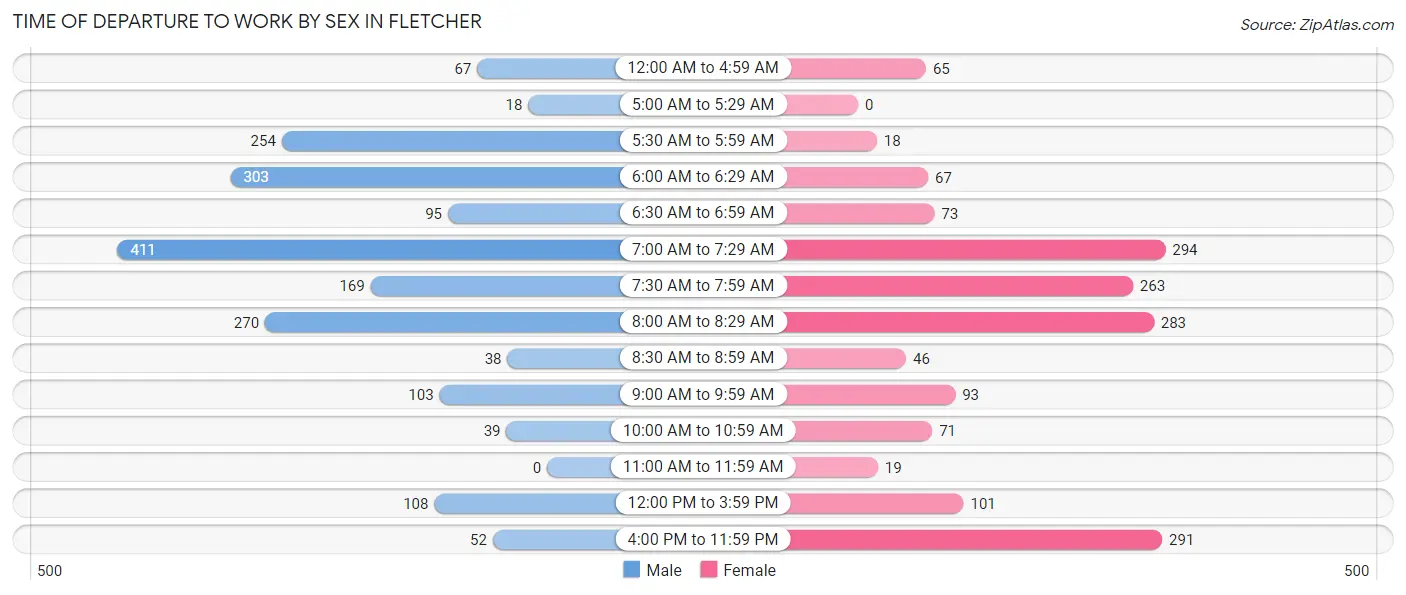
| Time of Departure | Male | Female |
| 12:00 AM to 4:59 AM | 67 (3.5%) | 65 (3.9%) |
| 5:00 AM to 5:29 AM | 18 (0.9%) | 0 (0.0%) |
| 5:30 AM to 5:59 AM | 254 (13.2%) | 18 (1.1%) |
| 6:00 AM to 6:29 AM | 303 (15.7%) | 67 (4.0%) |
| 6:30 AM to 6:59 AM | 95 (4.9%) | 73 (4.3%) |
| 7:00 AM to 7:29 AM | 411 (21.3%) | 294 (17.5%) |
| 7:30 AM to 7:59 AM | 169 (8.8%) | 263 (15.6%) |
| 8:00 AM to 8:29 AM | 270 (14.0%) | 283 (16.8%) |
| 8:30 AM to 8:59 AM | 38 (2.0%) | 46 (2.7%) |
| 9:00 AM to 9:59 AM | 103 (5.3%) | 93 (5.5%) |
| 10:00 AM to 10:59 AM | 39 (2.0%) | 71 (4.2%) |
| 11:00 AM to 11:59 AM | 0 (0.0%) | 19 (1.1%) |
| 12:00 PM to 3:59 PM | 108 (5.6%) | 101 (6.0%) |
| 4:00 PM to 11:59 PM | 52 (2.7%) | 291 (17.3%) |
| Total | 1,927 (100.0%) | 1,684 (100.0%) |
Housing Occupancy in Fletcher
Occupancy by Ownership in Fletcher
Of the total 3,417 dwellings in Fletcher, owner-occupied units account for 2,684 (78.5%), while renter-occupied units make up 733 (21.4%).
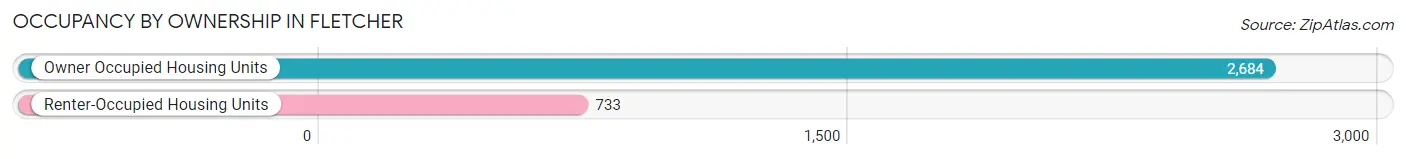
| Occupancy | # Housing Units | % Housing Units |
| Owner Occupied Housing Units | 2,684 | 78.5% |
| Renter-Occupied Housing Units | 733 | 21.4% |
| Total Occupied Housing Units | 3,417 | 100.0% |
Occupancy by Household Size in Fletcher
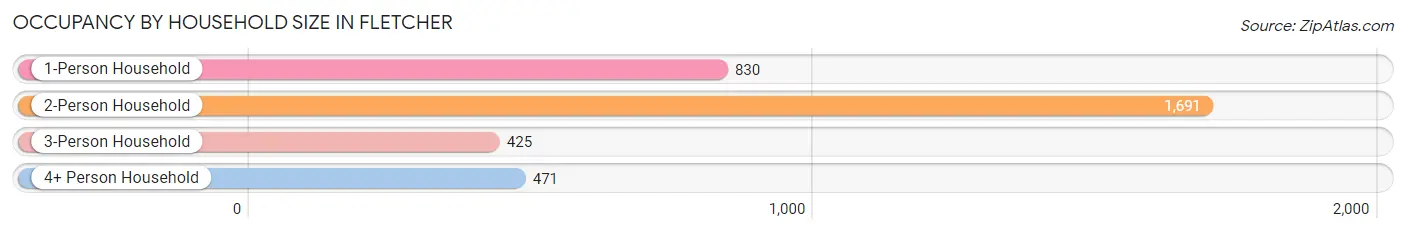
| Household Size | # Housing Units | % Housing Units |
| 1-Person Household | 830 | 24.3% |
| 2-Person Household | 1,691 | 49.5% |
| 3-Person Household | 425 | 12.4% |
| 4+ Person Household | 471 | 13.8% |
| Total Housing Units | 3,417 | 100.0% |
Occupancy by Ownership by Household Size in Fletcher
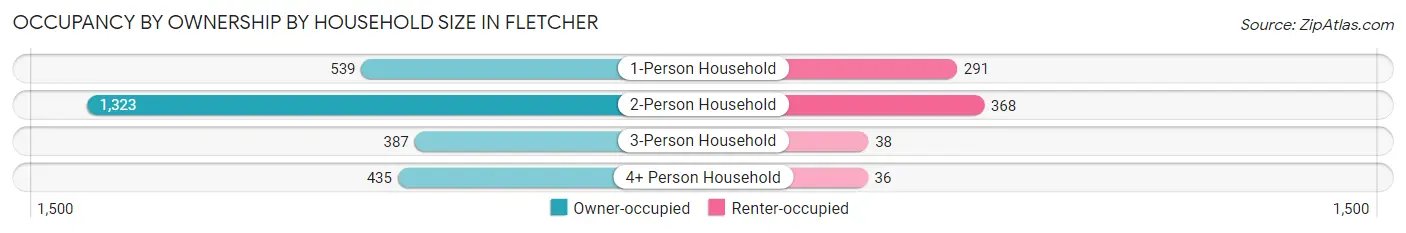
| Household Size | Owner-occupied | Renter-occupied |
| 1-Person Household | 539 (64.9%) | 291 (35.1%) |
| 2-Person Household | 1,323 (78.2%) | 368 (21.8%) |
| 3-Person Household | 387 (91.1%) | 38 (8.9%) |
| 4+ Person Household | 435 (92.4%) | 36 (7.6%) |
| Total Housing Units | 2,684 (78.5%) | 733 (21.4%) |
Occupancy by Educational Attainment in Fletcher
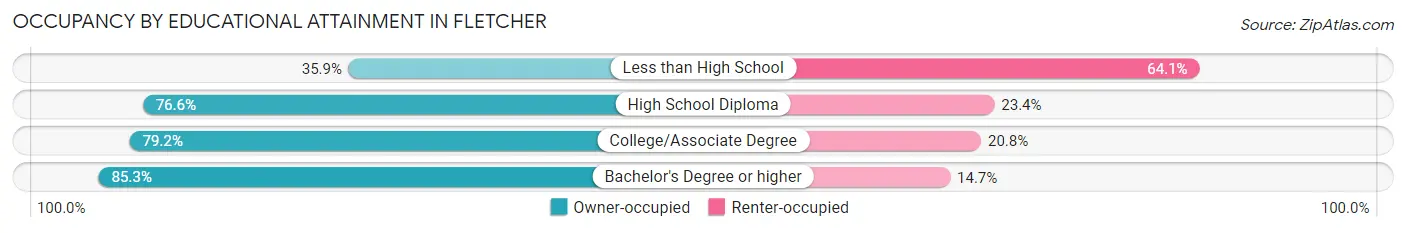
| Household Size | Owner-occupied | Renter-occupied |
| Less than High School | 74 (35.9%) | 132 (64.1%) |
| High School Diploma | 477 (76.6%) | 146 (23.4%) |
| College/Associate Degree | 975 (79.2%) | 256 (20.8%) |
| Bachelor's Degree or higher | 1,158 (85.3%) | 199 (14.7%) |
Occupancy by Age of Householder in Fletcher
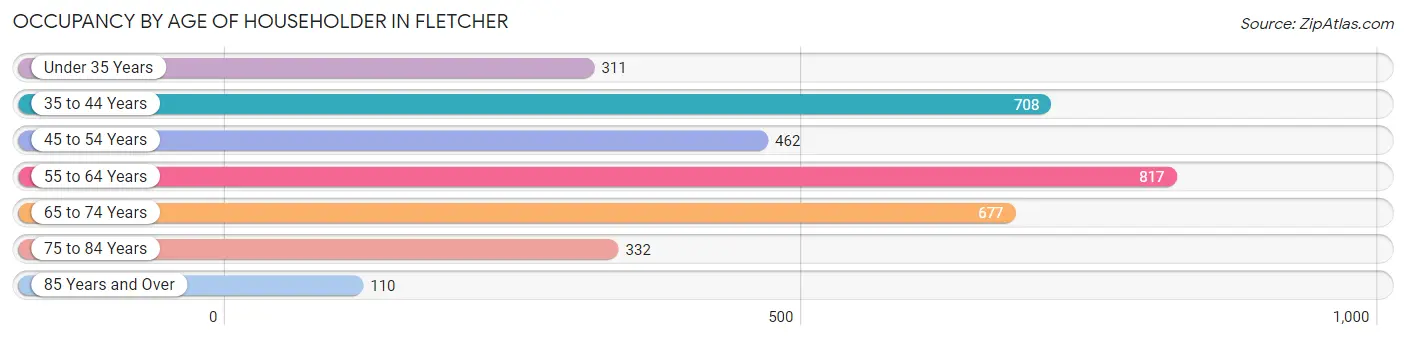
| Age Bracket | # Households | % Households |
| Under 35 Years | 311 | 9.1% |
| 35 to 44 Years | 708 | 20.7% |
| 45 to 54 Years | 462 | 13.5% |
| 55 to 64 Years | 817 | 23.9% |
| 65 to 74 Years | 677 | 19.8% |
| 75 to 84 Years | 332 | 9.7% |
| 85 Years and Over | 110 | 3.2% |
| Total | 3,417 | 100.0% |
Housing Finances in Fletcher
Median Income by Occupancy in Fletcher
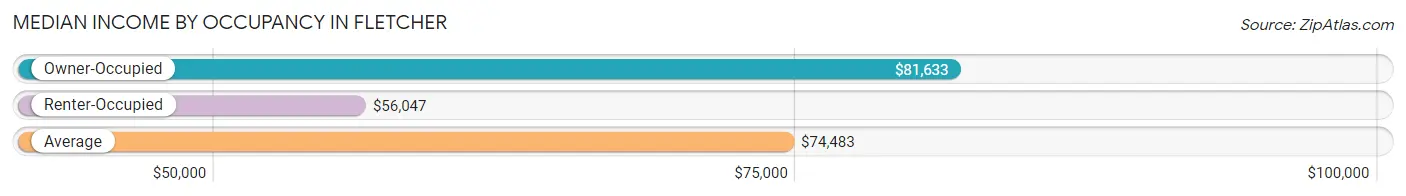
| Occupancy Type | # Households | Median Income |
| Owner-Occupied | 2,684 (78.5%) | $81,633 |
| Renter-Occupied | 733 (21.4%) | $56,047 |
| Average | 3,417 (100.0%) | $74,483 |
Occupancy by Householder Income Bracket in Fletcher
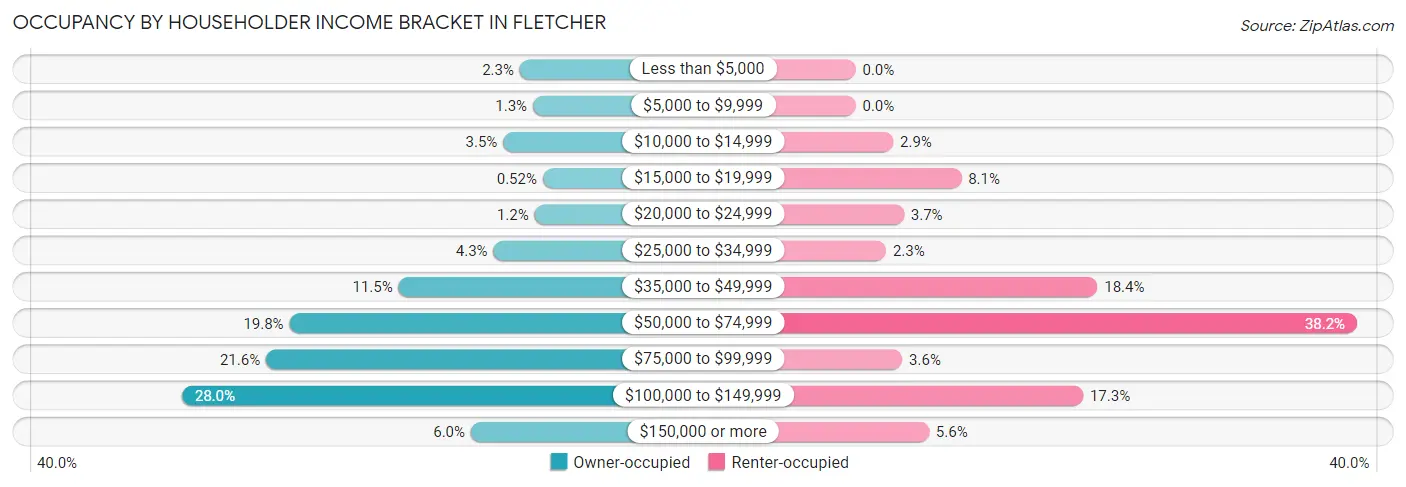
| Income Bracket | Owner-occupied | Renter-occupied |
| Less than $5,000 | 61 (2.3%) | 0 (0.0%) |
| $5,000 to $9,999 | 34 (1.3%) | 0 (0.0%) |
| $10,000 to $14,999 | 95 (3.5%) | 21 (2.9%) |
| $15,000 to $19,999 | 14 (0.5%) | 59 (8.1%) |
| $20,000 to $24,999 | 31 (1.1%) | 27 (3.7%) |
| $25,000 to $34,999 | 115 (4.3%) | 17 (2.3%) |
| $35,000 to $49,999 | 309 (11.5%) | 135 (18.4%) |
| $50,000 to $74,999 | 532 (19.8%) | 280 (38.2%) |
| $75,000 to $99,999 | 580 (21.6%) | 26 (3.5%) |
| $100,000 to $149,999 | 752 (28.0%) | 127 (17.3%) |
| $150,000 or more | 161 (6.0%) | 41 (5.6%) |
| Total | 2,684 (100.0%) | 733 (100.0%) |
Monthly Housing Cost Tiers in Fletcher
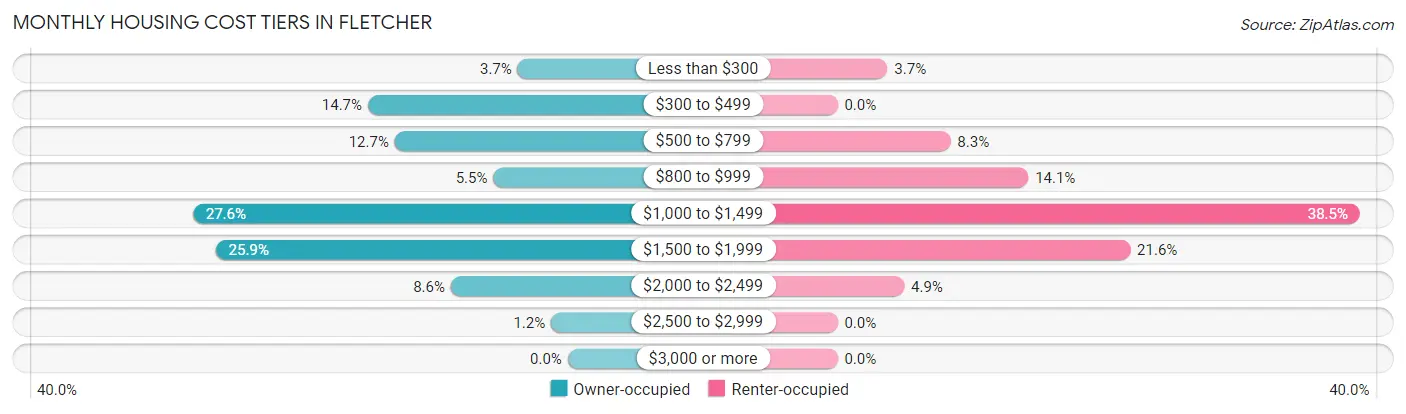
| Monthly Cost | Owner-occupied | Renter-occupied |
| Less than $300 | 99 (3.7%) | 27 (3.7%) |
| $300 to $499 | 395 (14.7%) | 0 (0.0%) |
| $500 to $799 | 342 (12.7%) | 61 (8.3%) |
| $800 to $999 | 147 (5.5%) | 103 (14.1%) |
| $1,000 to $1,499 | 741 (27.6%) | 282 (38.5%) |
| $1,500 to $1,999 | 696 (25.9%) | 158 (21.6%) |
| $2,000 to $2,499 | 231 (8.6%) | 36 (4.9%) |
| $2,500 to $2,999 | 33 (1.2%) | 0 (0.0%) |
| $3,000 or more | 0 (0.0%) | 0 (0.0%) |
| Total | 2,684 (100.0%) | 733 (100.0%) |
Physical Housing Characteristics in Fletcher
Housing Structures in Fletcher
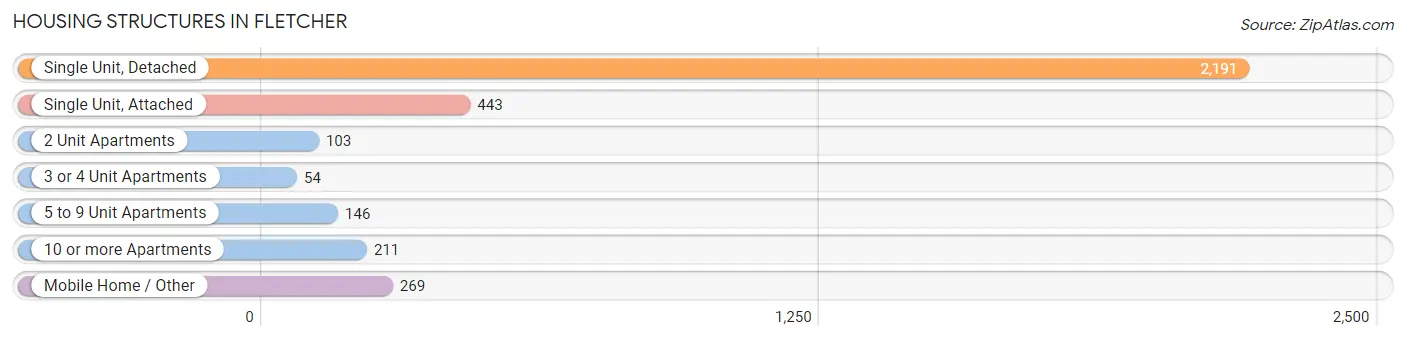
| Structure Type | # Housing Units | % Housing Units |
| Single Unit, Detached | 2,191 | 64.1% |
| Single Unit, Attached | 443 | 13.0% |
| 2 Unit Apartments | 103 | 3.0% |
| 3 or 4 Unit Apartments | 54 | 1.6% |
| 5 to 9 Unit Apartments | 146 | 4.3% |
| 10 or more Apartments | 211 | 6.2% |
| Mobile Home / Other | 269 | 7.9% |
| Total | 3,417 | 100.0% |
Housing Structures by Occupancy in Fletcher
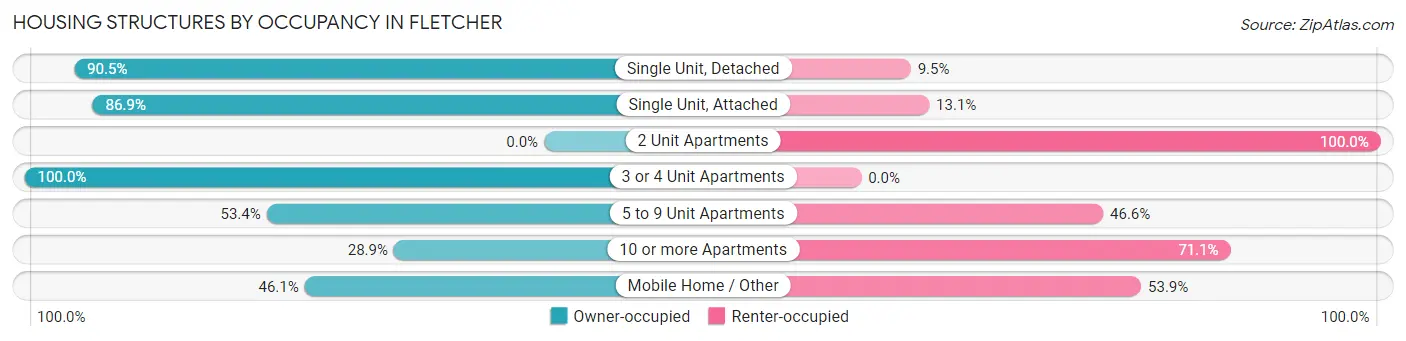
| Structure Type | Owner-occupied | Renter-occupied |
| Single Unit, Detached | 1,982 (90.5%) | 209 (9.5%) |
| Single Unit, Attached | 385 (86.9%) | 58 (13.1%) |
| 2 Unit Apartments | 0 (0.0%) | 103 (100.0%) |
| 3 or 4 Unit Apartments | 54 (100.0%) | 0 (0.0%) |
| 5 to 9 Unit Apartments | 78 (53.4%) | 68 (46.6%) |
| 10 or more Apartments | 61 (28.9%) | 150 (71.1%) |
| Mobile Home / Other | 124 (46.1%) | 145 (53.9%) |
| Total | 2,684 (78.5%) | 733 (21.4%) |
Housing Structures by Number of Rooms in Fletcher
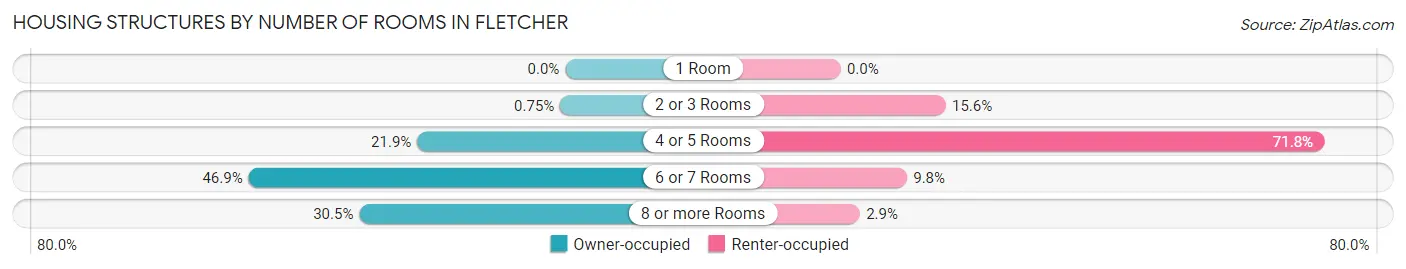
| Number of Rooms | Owner-occupied | Renter-occupied |
| 1 Room | 0 (0.0%) | 0 (0.0%) |
| 2 or 3 Rooms | 20 (0.7%) | 114 (15.5%) |
| 4 or 5 Rooms | 588 (21.9%) | 526 (71.8%) |
| 6 or 7 Rooms | 1,258 (46.9%) | 72 (9.8%) |
| 8 or more Rooms | 818 (30.5%) | 21 (2.9%) |
| Total | 2,684 (100.0%) | 733 (100.0%) |
Housing Structure by Heating Type in Fletcher
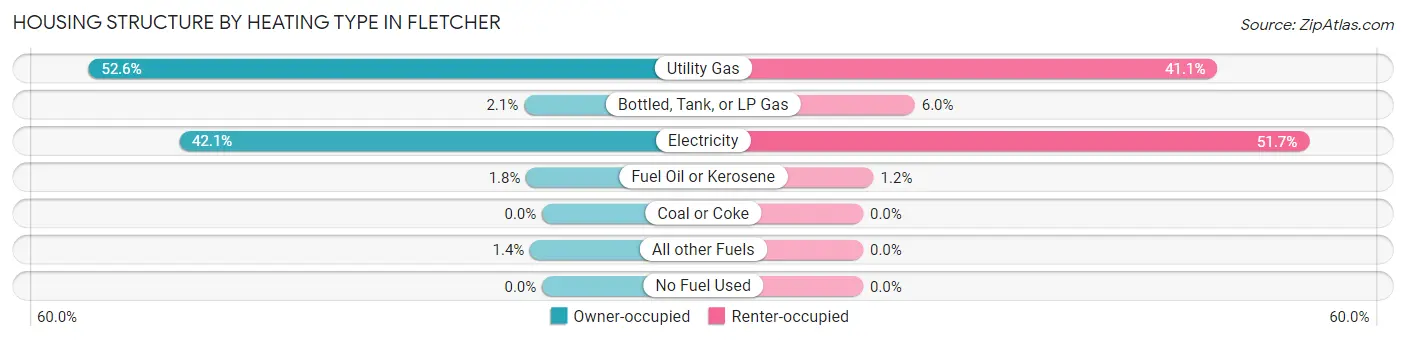
| Heating Type | Owner-occupied | Renter-occupied |
| Utility Gas | 1,412 (52.6%) | 301 (41.1%) |
| Bottled, Tank, or LP Gas | 56 (2.1%) | 44 (6.0%) |
| Electricity | 1,130 (42.1%) | 379 (51.7%) |
| Fuel Oil or Kerosene | 49 (1.8%) | 9 (1.2%) |
| Coal or Coke | 0 (0.0%) | 0 (0.0%) |
| All other Fuels | 37 (1.4%) | 0 (0.0%) |
| No Fuel Used | 0 (0.0%) | 0 (0.0%) |
| Total | 2,684 (100.0%) | 733 (100.0%) |
Household Vehicle Usage in Fletcher
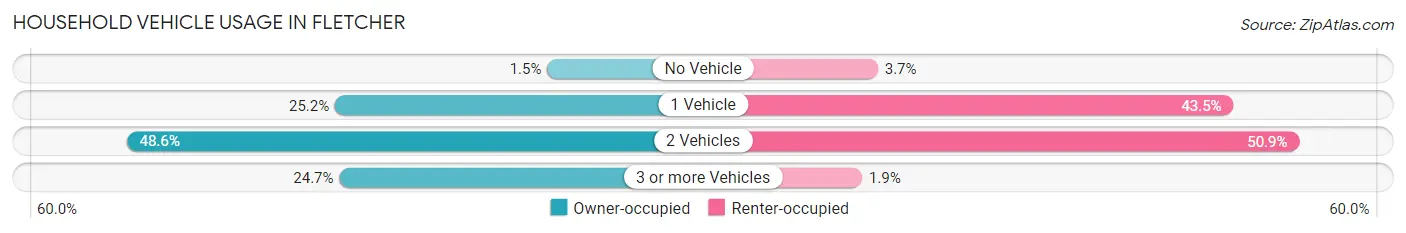
| Vehicles per Household | Owner-occupied | Renter-occupied |
| No Vehicle | 39 (1.5%) | 27 (3.7%) |
| 1 Vehicle | 677 (25.2%) | 319 (43.5%) |
| 2 Vehicles | 1,304 (48.6%) | 373 (50.9%) |
| 3 or more Vehicles | 664 (24.7%) | 14 (1.9%) |
| Total | 2,684 (100.0%) | 733 (100.0%) |
Real Estate & Mortgages in Fletcher
Real Estate and Mortgage Overview in Fletcher
| Characteristic | Without Mortgage | With Mortgage |
| Housing Units | 736 | 1,948 |
| Median Property Value | $303,100 | $298,000 |
| Median Household Income | $66,176 | $125 |
| Monthly Housing Costs | $455 | $0 |
| Real Estate Taxes | $2,099 | $103 |
Property Value by Mortgage Status in Fletcher
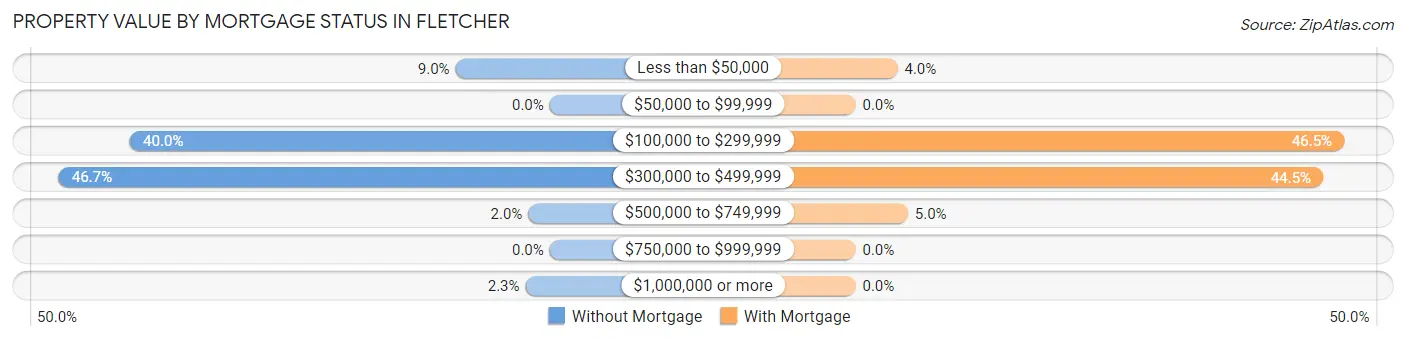
| Property Value | Without Mortgage | With Mortgage |
| Less than $50,000 | 66 (9.0%) | 78 (4.0%) |
| $50,000 to $99,999 | 0 (0.0%) | 0 (0.0%) |
| $100,000 to $299,999 | 294 (40.0%) | 906 (46.5%) |
| $300,000 to $499,999 | 344 (46.7%) | 867 (44.5%) |
| $500,000 to $749,999 | 15 (2.0%) | 97 (5.0%) |
| $750,000 to $999,999 | 0 (0.0%) | 0 (0.0%) |
| $1,000,000 or more | 17 (2.3%) | 0 (0.0%) |
| Total | 736 (100.0%) | 1,948 (100.0%) |
Household Income by Mortgage Status in Fletcher
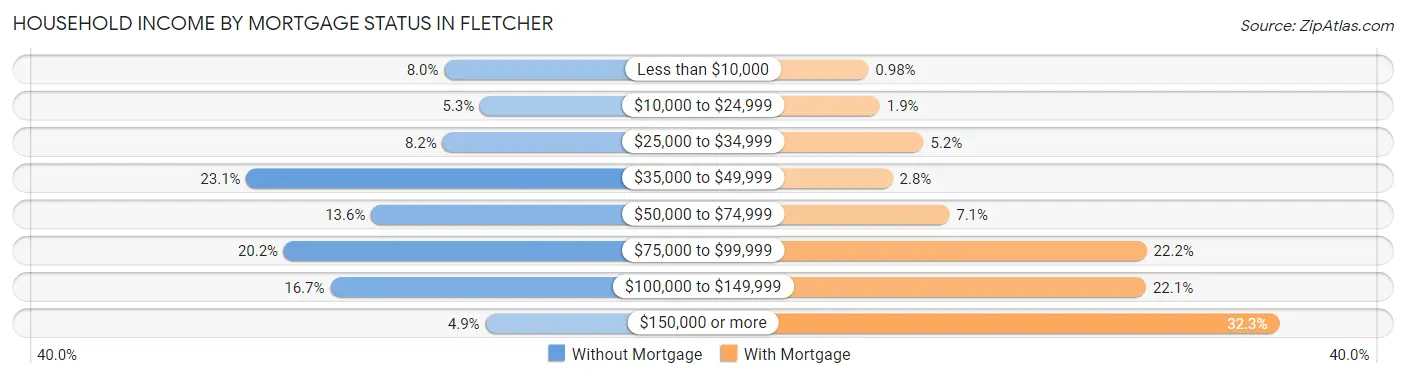
| Household Income | Without Mortgage | With Mortgage |
| Less than $10,000 | 59 (8.0%) | 19 (1.0%) |
| $10,000 to $24,999 | 39 (5.3%) | 36 (1.8%) |
| $25,000 to $34,999 | 60 (8.2%) | 101 (5.2%) |
| $35,000 to $49,999 | 170 (23.1%) | 55 (2.8%) |
| $50,000 to $74,999 | 100 (13.6%) | 139 (7.1%) |
| $75,000 to $99,999 | 149 (20.2%) | 432 (22.2%) |
| $100,000 to $149,999 | 123 (16.7%) | 431 (22.1%) |
| $150,000 or more | 36 (4.9%) | 629 (32.3%) |
| Total | 736 (100.0%) | 1,948 (100.0%) |
Property Value to Household Income Ratio in Fletcher
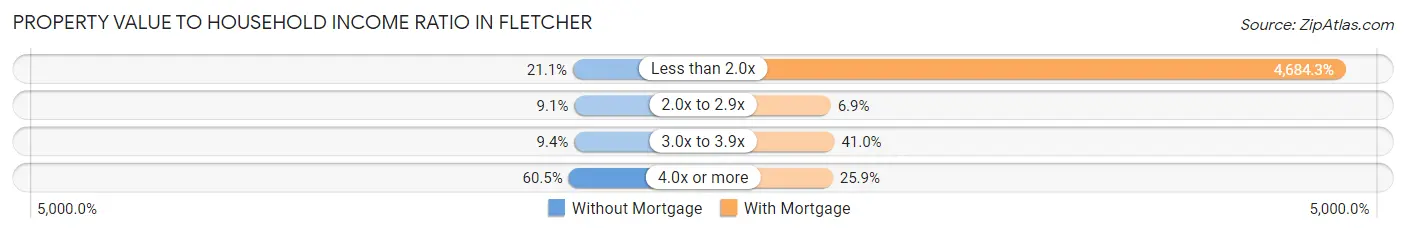
| Value-to-Income Ratio | Without Mortgage | With Mortgage |
| Less than 2.0x | 155 (21.1%) | 91,250 (4,684.3%) |
| 2.0x to 2.9x | 67 (9.1%) | 135 (6.9%) |
| 3.0x to 3.9x | 69 (9.4%) | 799 (41.0%) |
| 4.0x or more | 445 (60.5%) | 505 (25.9%) |
| Total | 736 (100.0%) | 1,948 (100.0%) |
Real Estate Taxes by Mortgage Status in Fletcher
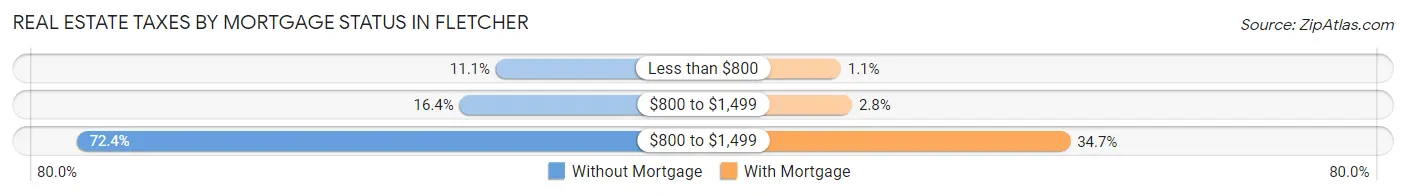
| Property Taxes | Without Mortgage | With Mortgage |
| Less than $800 | 82 (11.1%) | 22 (1.1%) |
| $800 to $1,499 | 121 (16.4%) | 54 (2.8%) |
| $800 to $1,499 | 533 (72.4%) | 675 (34.6%) |
| Total | 736 (100.0%) | 1,948 (100.0%) |
Health & Disability in Fletcher
Health Insurance Coverage by Age in Fletcher

| Age Bracket | With Coverage | Without Coverage |
| Under 6 Years | 359 (90.0%) | 40 (10.0%) |
| 6 to 18 Years | 816 (88.2%) | 109 (11.8%) |
| 19 to 25 Years | 712 (93.7%) | 48 (6.3%) |
| 26 to 34 Years | 485 (93.6%) | 33 (6.4%) |
| 35 to 44 Years | 1,113 (87.3%) | 162 (12.7%) |
| 45 to 54 Years | 784 (90.6%) | 81 (9.4%) |
| 55 to 64 Years | 1,205 (91.4%) | 113 (8.6%) |
| 65 to 74 Years | 1,178 (100.0%) | 0 (0.0%) |
| 75 Years and older | 656 (97.0%) | 20 (3.0%) |
| Total | 7,308 (92.3%) | 606 (7.7%) |
Health Insurance Coverage by Citizenship Status in Fletcher
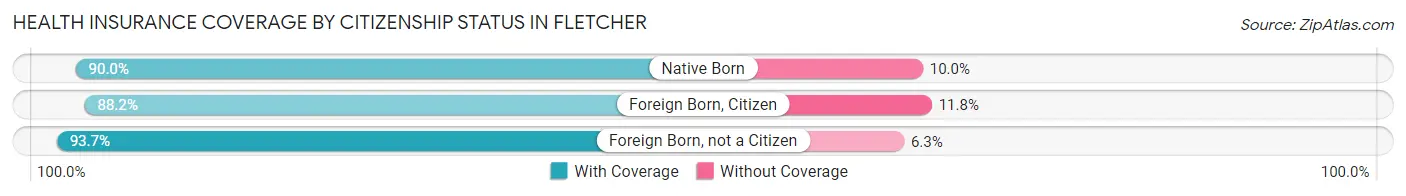
| Citizenship Status | With Coverage | Without Coverage |
| Native Born | 359 (90.0%) | 40 (10.0%) |
| Foreign Born, Citizen | 816 (88.2%) | 109 (11.8%) |
| Foreign Born, not a Citizen | 712 (93.7%) | 48 (6.3%) |
Health Insurance Coverage by Household Income in Fletcher
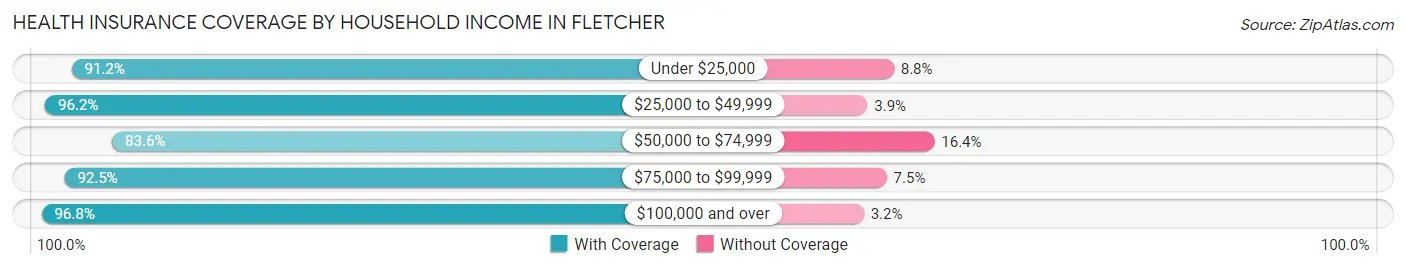
| Household Income | With Coverage | Without Coverage |
| Under $25,000 | 456 (91.2%) | 44 (8.8%) |
| $25,000 to $49,999 | 1,075 (96.2%) | 43 (3.8%) |
| $50,000 to $74,999 | 1,549 (83.6%) | 304 (16.4%) |
| $75,000 to $99,999 | 1,598 (92.5%) | 129 (7.5%) |
| $100,000 and over | 2,630 (96.8%) | 86 (3.2%) |
Public vs Private Health Insurance Coverage by Age in Fletcher
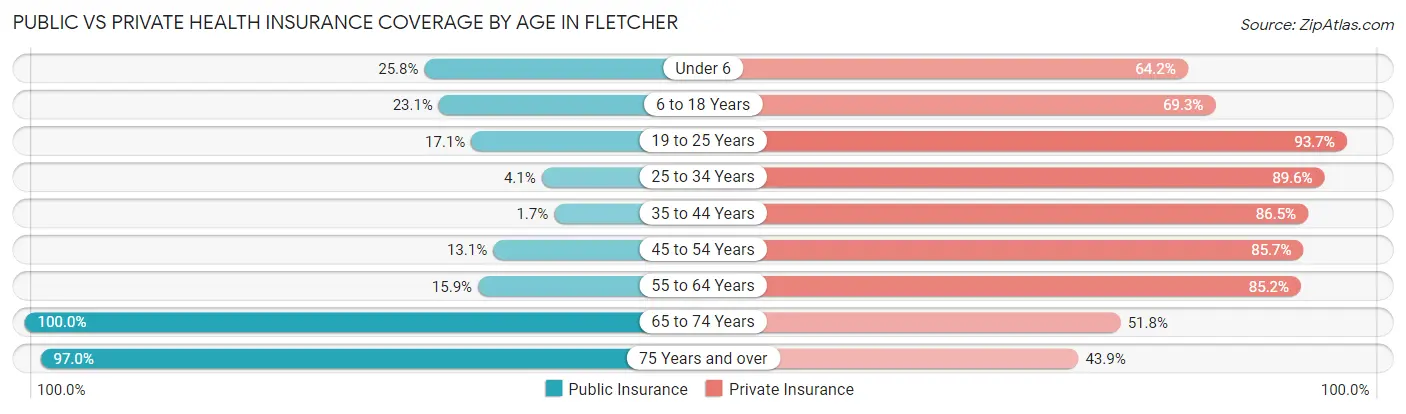
| Age Bracket | Public Insurance | Private Insurance |
| Under 6 | 103 (25.8%) | 256 (64.2%) |
| 6 to 18 Years | 214 (23.1%) | 641 (69.3%) |
| 19 to 25 Years | 130 (17.1%) | 712 (93.7%) |
| 25 to 34 Years | 21 (4.1%) | 464 (89.6%) |
| 35 to 44 Years | 22 (1.7%) | 1,103 (86.5%) |
| 45 to 54 Years | 113 (13.1%) | 741 (85.7%) |
| 55 to 64 Years | 209 (15.9%) | 1,123 (85.2%) |
| 65 to 74 Years | 1,178 (100.0%) | 610 (51.8%) |
| 75 Years and over | 656 (97.0%) | 297 (43.9%) |
| Total | 2,646 (33.4%) | 5,947 (75.1%) |
Disability Status by Sex by Age in Fletcher
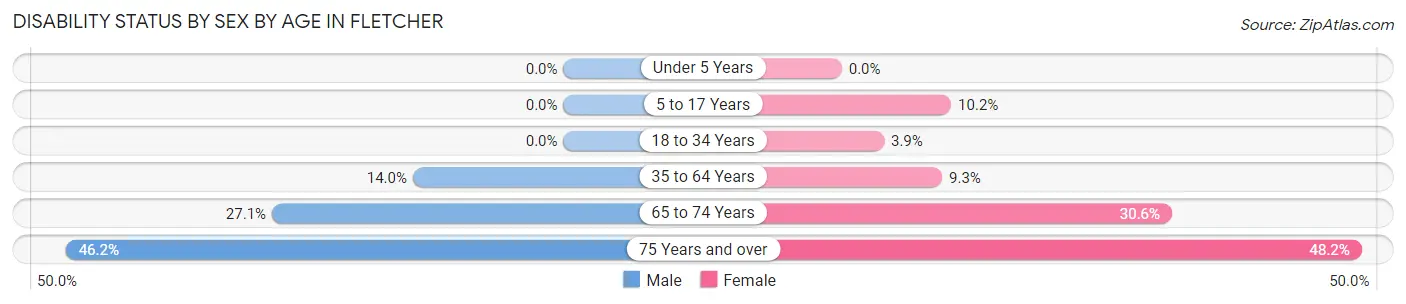
| Age Bracket | Male | Female |
| Under 5 Years | 0 (0.0%) | 0 (0.0%) |
| 5 to 17 Years | 0 (0.0%) | 59 (10.2%) |
| 18 to 34 Years | 0 (0.0%) | 32 (3.9%) |
| 35 to 64 Years | 255 (14.0%) | 152 (9.3%) |
| 65 to 74 Years | 142 (27.1%) | 200 (30.6%) |
| 75 Years and over | 115 (46.2%) | 206 (48.2%) |
Disability Class by Sex by Age in Fletcher
Disability Class: Hearing Difficulty
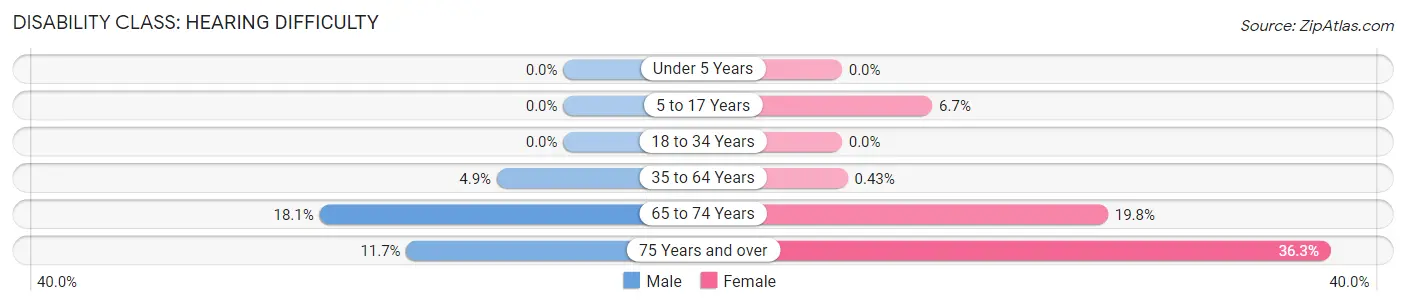
| Age Bracket | Male | Female |
| Under 5 Years | 0 (0.0%) | 0 (0.0%) |
| 5 to 17 Years | 0 (0.0%) | 39 (6.7%) |
| 18 to 34 Years | 0 (0.0%) | 0 (0.0%) |
| 35 to 64 Years | 90 (4.9%) | 7 (0.4%) |
| 65 to 74 Years | 95 (18.1%) | 129 (19.8%) |
| 75 Years and over | 29 (11.7%) | 155 (36.3%) |
Disability Class: Vision Difficulty
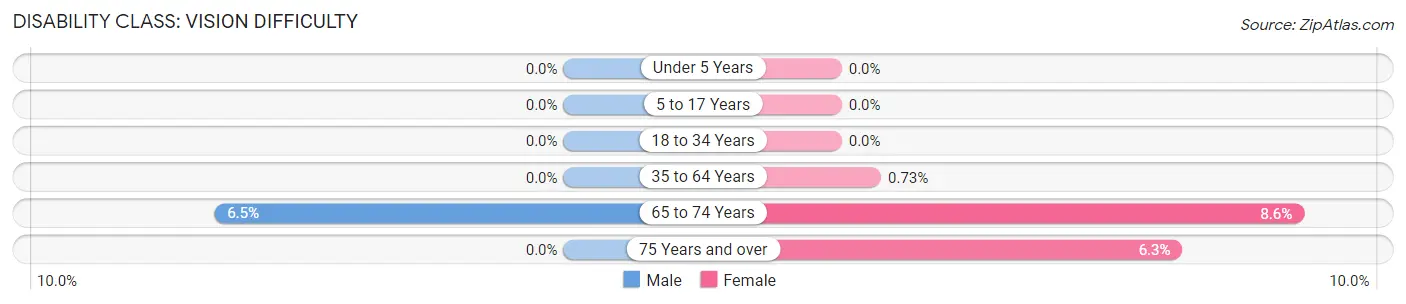
| Age Bracket | Male | Female |
| Under 5 Years | 0 (0.0%) | 0 (0.0%) |
| 5 to 17 Years | 0 (0.0%) | 0 (0.0%) |
| 18 to 34 Years | 0 (0.0%) | 0 (0.0%) |
| 35 to 64 Years | 0 (0.0%) | 12 (0.7%) |
| 65 to 74 Years | 34 (6.5%) | 56 (8.6%) |
| 75 Years and over | 0 (0.0%) | 27 (6.3%) |
Disability Class: Cognitive Difficulty
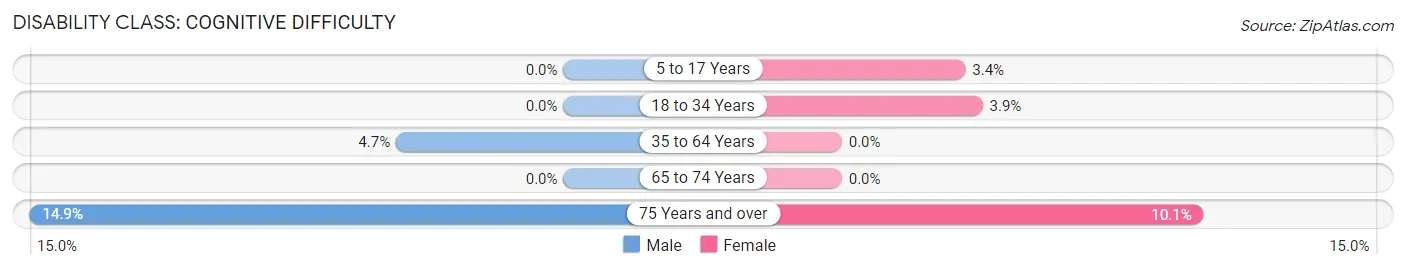
| Age Bracket | Male | Female |
| 5 to 17 Years | 0 (0.0%) | 20 (3.4%) |
| 18 to 34 Years | 0 (0.0%) | 32 (3.9%) |
| 35 to 64 Years | 85 (4.7%) | 0 (0.0%) |
| 65 to 74 Years | 0 (0.0%) | 0 (0.0%) |
| 75 Years and over | 37 (14.9%) | 43 (10.1%) |
Disability Class: Ambulatory Difficulty
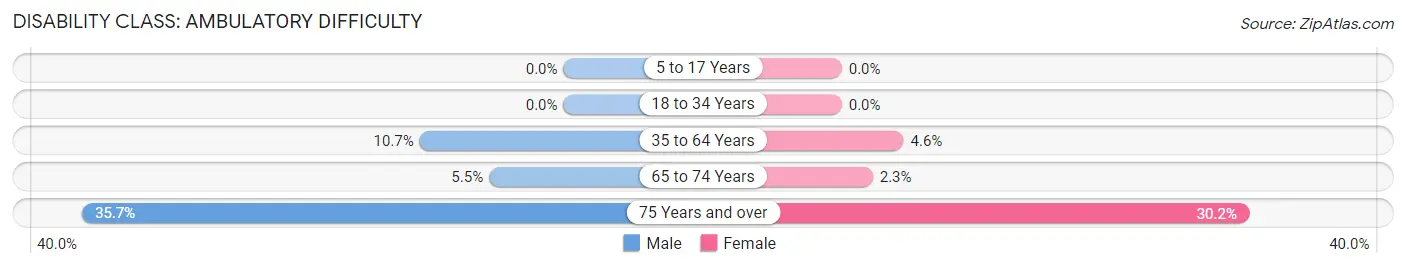
| Age Bracket | Male | Female |
| 5 to 17 Years | 0 (0.0%) | 0 (0.0%) |
| 18 to 34 Years | 0 (0.0%) | 0 (0.0%) |
| 35 to 64 Years | 195 (10.7%) | 75 (4.6%) |
| 65 to 74 Years | 29 (5.5%) | 15 (2.3%) |
| 75 Years and over | 89 (35.7%) | 129 (30.2%) |
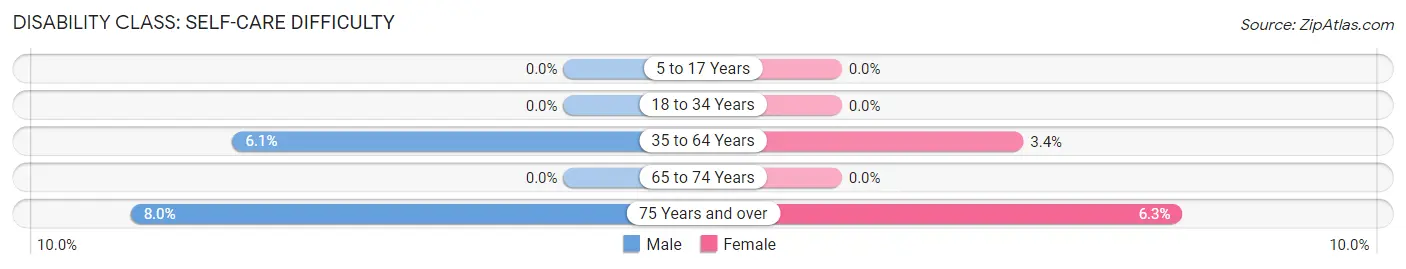
Disability Class: Self-Care Difficulty
| Age Bracket | Male | Female |
| 5 to 17 Years | 0 (0.0%) | 0 (0.0%) |
| 18 to 34 Years | 0 (0.0%) | 0 (0.0%) |
| 35 to 64 Years | 112 (6.1%) | 55 (3.4%) |
| 65 to 74 Years | 0 (0.0%) | 0 (0.0%) |
| 75 Years and over | 20 (8.0%) | 27 (6.3%) |
Technology Access in Fletcher
Computing Device Access in Fletcher
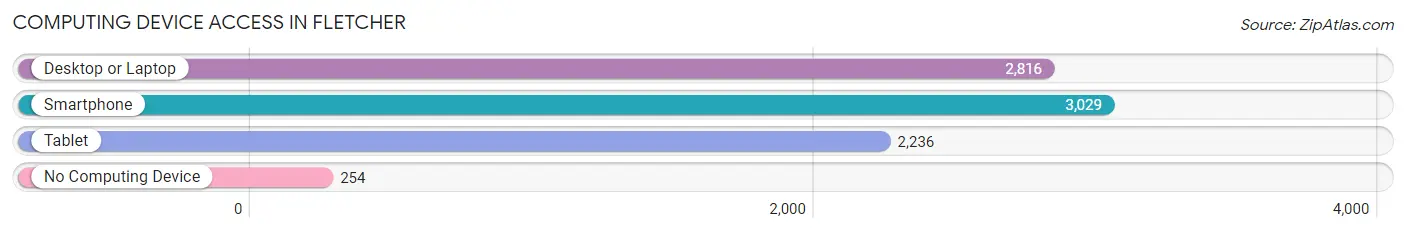
| Device Type | # Households | % Households |
| Desktop or Laptop | 2,816 | 82.4% |
| Smartphone | 3,029 | 88.6% |
| Tablet | 2,236 | 65.4% |
| No Computing Device | 254 | 7.4% |
| Total | 3,417 | 100.0% |
Internet Access in Fletcher
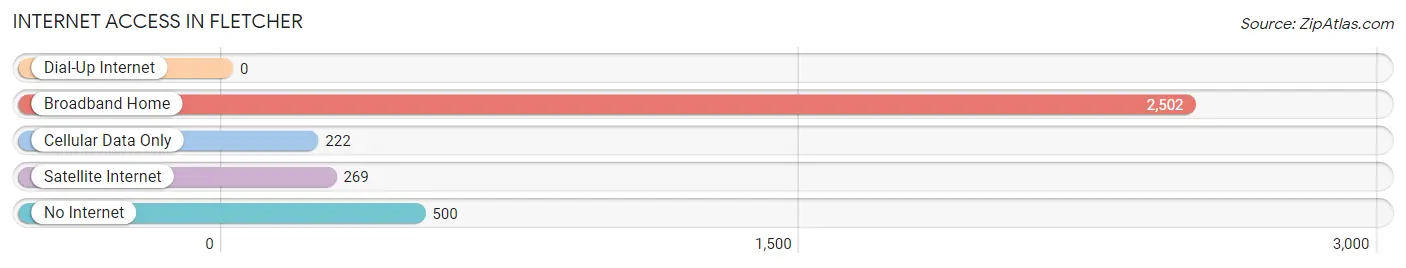
| Internet Type | # Households | % Households |
| Dial-Up Internet | 0 | 0.0% |
| Broadband Home | 2,502 | 73.2% |
| Cellular Data Only | 222 | 6.5% |
| Satellite Internet | 269 | 7.9% |
| No Internet | 500 | 14.6% |
| Total | 3,417 | 100.0% |
Fletcher Summary
Fletcher is a town located in Henderson County, North Carolina. It is situated in the Blue Ridge Mountains, just south of Asheville. The town was founded in 1887 and was named after a local landowner, William Fletcher. The town has a population of 8,400 people, as of the 2010 census.
Geography
Fletcher is located in the Blue Ridge Mountains of western North Carolina. It is situated in the French Broad River Valley, just south of Asheville. The town is located at an elevation of 2,000 feet above sea level. The town is surrounded by the Pisgah National Forest and is close to the Great Smoky Mountains National Park. The town is located at the intersection of Interstate 26 and U.S. Route 25.
Climate
Fletcher has a humid subtropical climate, with hot summers and mild winters. The average annual temperature is around 60°F. The average annual precipitation is around 45 inches.
Demographics
As of the 2010 census, the population of Fletcher was 8,400 people. The racial makeup of the town was 90.3% White, 4.2% African American, 0.7% Native American, 1.2% Asian, 0.1% Pacific Islander, and 3.5% from other races. The median household income was $45,000.
Economy
Fletcher is home to several large employers, including the Fletcher Business Park, which is home to several manufacturing and distribution companies. The town is also home to several small businesses, including restaurants, retail stores, and professional services. The town is also home to several tourist attractions, including the Blue Ridge Parkway, the Biltmore Estate, and the Carl Sandburg Home National Historic Site.
Education
Fletcher is served by the Henderson County Public Schools system. The town is home to two elementary schools, one middle school, and one high school. The town is also home to several private schools, including the Fletcher Academy and the Fletcher Christian Academy.
Conclusion
Fletcher is a small town located in the Blue Ridge Mountains of western North Carolina. It is situated in the French Broad River Valley, just south of Asheville. The town has a population of 8,400 people, as of the 2010 census. The town is home to several large employers, including the Fletcher Business Park, and is also home to several tourist attractions. The town is served by the Henderson County Public Schools system, and is also home to several private schools.
Common Questions
What is Per Capita Income in Fletcher?
Per Capita income in Fletcher is $36,056.
What is the Median Family Income in Fletcher?
Median Family Income in Fletcher is $88,775.
What is the Median Household income in Fletcher?
Median Household Income in Fletcher is $74,483.
What is Income or Wage Gap in Fletcher?
Income or Wage Gap in Fletcher is 24.0%.
Women in Fletcher earn 76.0 cents for every dollar earned by a man.
What is Family Income Deficit in Fletcher?
Family Income Deficit in Fletcher is $10,636.
Families that are below poverty line in Fletcher earn $10,636 less on average than the poverty threshold level.
What is Inequality or Gini Index in Fletcher?
Inequality or Gini Index in Fletcher is 0.31.
What is the Total Population of Fletcher?
Total Population of Fletcher is 8,000.
What is the Total Male Population of Fletcher?
Total Male Population of Fletcher is 3,705.
What is the Total Female Population of Fletcher?
Total Female Population of Fletcher is 4,295.
What is the Ratio of Males per 100 Females in Fletcher?
There are 86.26 Males per 100 Females in Fletcher.
What is the Ratio of Females per 100 Males in Fletcher?
There are 115.92 Females per 100 Males in Fletcher.
What is the Median Population Age in Fletcher?
Median Population Age in Fletcher is 46.6 Years.
What is the Average Family Size in Fletcher
Average Family Size in Fletcher is 2.7 People.
What is the Average Household Size in Fletcher
Average Household Size in Fletcher is 2.3 People.
How Large is the Labor Force in Fletcher?
There are 4,033 People in the Labor Forcein in Fletcher.
What is the Percentage of People in the Labor Force in Fletcher?
59.3% of People are in the Labor Force in Fletcher.
What is the Unemployment Rate in Fletcher?
Unemployment Rate in Fletcher is 3.1%.