Rocky Mount, NC Map & Demographics
Rocky Mount Map
Rocky Mount Overview
$28,885
PER CAPITA INCOME
$56,751
AVG FAMILY INCOME
$50,092
AVG HOUSEHOLD INCOME
15.8%
WAGE / INCOME GAP [ % ]
84.2¢/ $1
WAGE / INCOME GAP [ $ ]
$10,531
FAMILY INCOME DEFICIT
0.47
INEQUALITY / GINI INDEX
54,260
TOTAL POPULATION
26,007
MALE POPULATION
28,253
FEMALE POPULATION
92.05
MALES / 100 FEMALES
108.64
FEMALES / 100 MALES
40.4
MEDIAN AGE
3.0
AVG FAMILY SIZE
2.4
AVG HOUSEHOLD SIZE
26,064
LABOR FORCE [ PEOPLE ]
59.4%
PERCENT IN LABOR FORCE
7.8%
UNEMPLOYMENT RATE
Rocky Mount Area Codes
Income in Rocky Mount
Income Overview in Rocky Mount
Per Capita Income in Rocky Mount is $28,885, while median incomes of families and households are $56,751 and $50,092 respectively.
| Characteristic | Number | Measure |
| Per Capita Income | 54,260 | $28,885 |
| Median Family Income | 13,614 | $56,751 |
| Mean Family Income | 13,614 | $79,843 |
| Median Household Income | 22,666 | $50,092 |
| Mean Household Income | 22,666 | $67,118 |
| Income Deficit | 13,614 | $10,531 |
| Wage / Income Gap (%) | 54,260 | 15.79% |
| Wage / Income Gap ($) | 54,260 | 84.21¢ per $1 |
| Gini / Inequality Index | 54,260 | 0.47 |
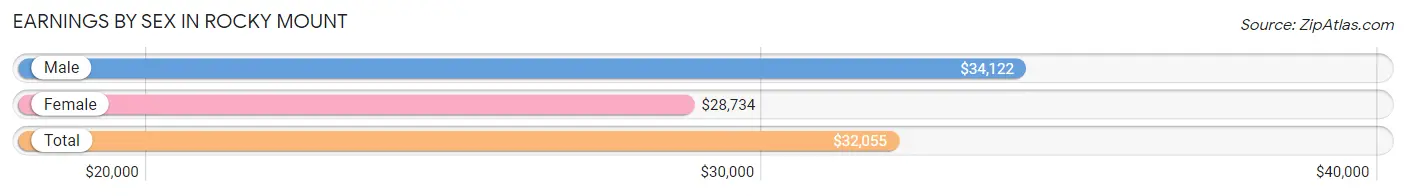
Earnings by Sex in Rocky Mount
Average Earnings in Rocky Mount are $32,055, $34,122 for men and $28,734 for women, a difference of 15.8%.
| Sex | Number | Average Earnings |
| Male | 12,949 (47.8%) | $34,122 |
| Female | 14,137 (52.2%) | $28,734 |
| Total | 27,086 (100.0%) | $32,055 |
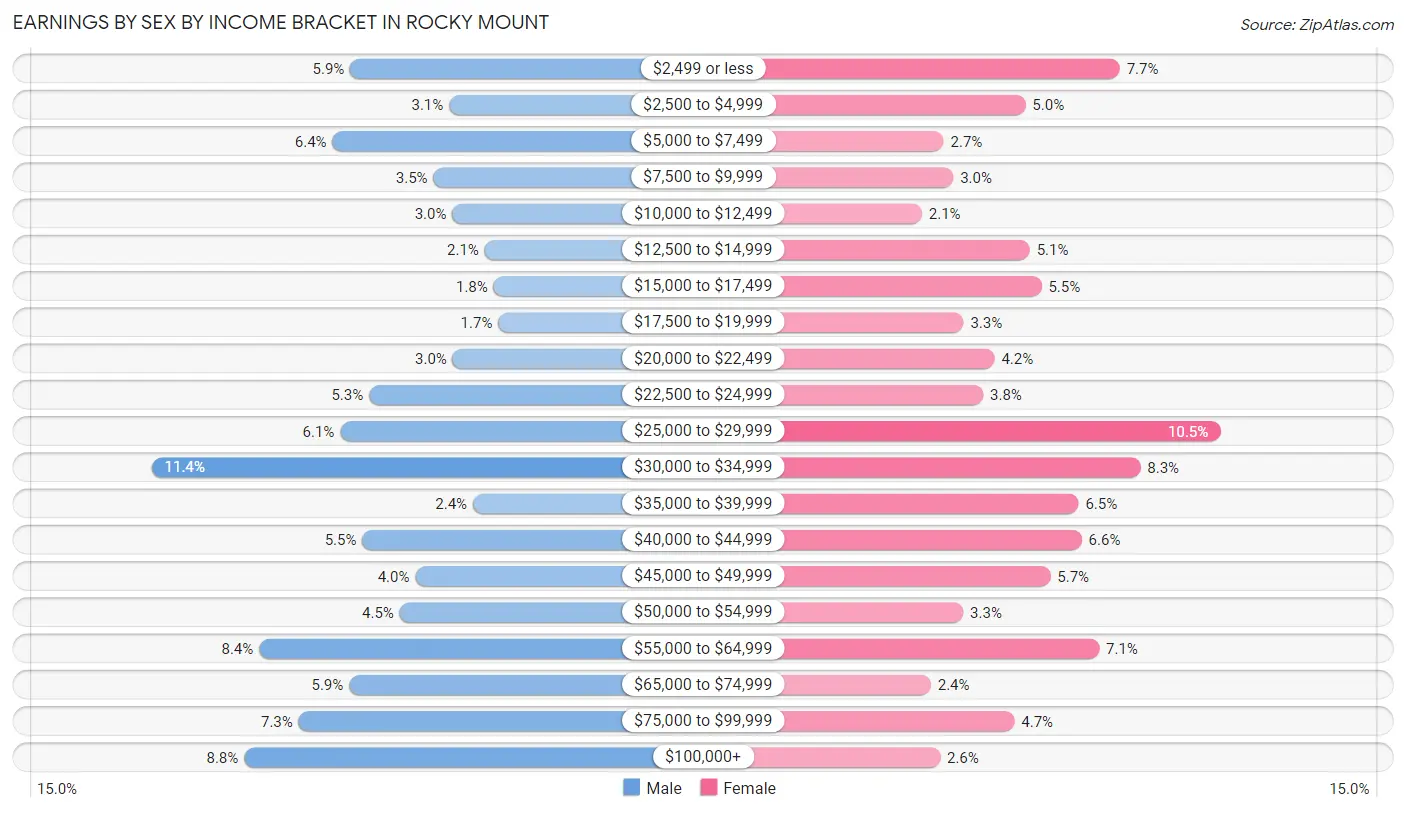
Earnings by Sex by Income Bracket in Rocky Mount
The most common earnings brackets in Rocky Mount are $30,000 to $34,999 for men (1,480 | 11.4%) and $25,000 to $29,999 for women (1,483 | 10.5%).
| Income | Male | Female |
| $2,499 or less | 757 (5.9%) | 1,085 (7.7%) |
| $2,500 to $4,999 | 398 (3.1%) | 709 (5.0%) |
| $5,000 to $7,499 | 822 (6.4%) | 385 (2.7%) |
| $7,500 to $9,999 | 454 (3.5%) | 423 (3.0%) |
| $10,000 to $12,499 | 386 (3.0%) | 298 (2.1%) |
| $12,500 to $14,999 | 268 (2.1%) | 727 (5.1%) |
| $15,000 to $17,499 | 236 (1.8%) | 773 (5.5%) |
| $17,500 to $19,999 | 219 (1.7%) | 464 (3.3%) |
| $20,000 to $22,499 | 384 (3.0%) | 587 (4.2%) |
| $22,500 to $24,999 | 689 (5.3%) | 541 (3.8%) |
| $25,000 to $29,999 | 794 (6.1%) | 1,483 (10.5%) |
| $30,000 to $34,999 | 1,480 (11.4%) | 1,166 (8.3%) |
| $35,000 to $39,999 | 311 (2.4%) | 920 (6.5%) |
| $40,000 to $44,999 | 714 (5.5%) | 933 (6.6%) |
| $45,000 to $49,999 | 521 (4.0%) | 809 (5.7%) |
| $50,000 to $54,999 | 578 (4.5%) | 462 (3.3%) |
| $55,000 to $64,999 | 1,089 (8.4%) | 1,002 (7.1%) |
| $65,000 to $74,999 | 761 (5.9%) | 333 (2.4%) |
| $75,000 to $99,999 | 945 (7.3%) | 666 (4.7%) |
| $100,000+ | 1,143 (8.8%) | 371 (2.6%) |
| Total | 12,949 (100.0%) | 14,137 (100.0%) |
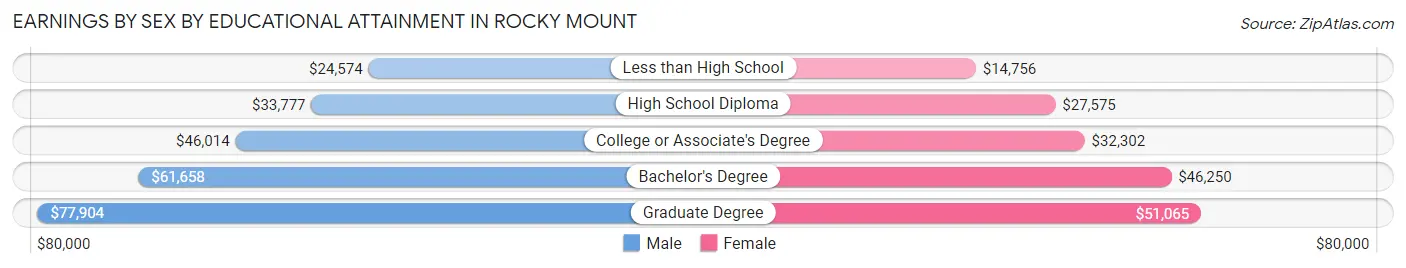
Earnings by Sex by Educational Attainment in Rocky Mount
Average earnings in Rocky Mount are $40,533 for men and $32,706 for women, a difference of 19.3%. Men with an educational attainment of graduate degree enjoy the highest average annual earnings of $77,904, while those with less than high school education earn the least with $24,574. Women with an educational attainment of graduate degree earn the most with the average annual earnings of $51,065, while those with less than high school education have the smallest earnings of $14,756.
| Educational Attainment | Male Income | Female Income |
| Less than High School | $24,574 | $14,756 |
| High School Diploma | $33,777 | $27,575 |
| College or Associate's Degree | $46,014 | $32,302 |
| Bachelor's Degree | $61,658 | $46,250 |
| Graduate Degree | $77,904 | $51,065 |
| Total | $40,533 | $32,706 |
Family Income in Rocky Mount
Family Income Brackets in Rocky Mount
According to the Rocky Mount family income data, there are 2,886 families falling into the $50,000 to $74,999 income range, which is the most common income bracket and makes up 21.2% of all families. Conversely, the $10,000 to $14,999 income bracket is the least frequent group with only 340 families (2.5%) belonging to this category.
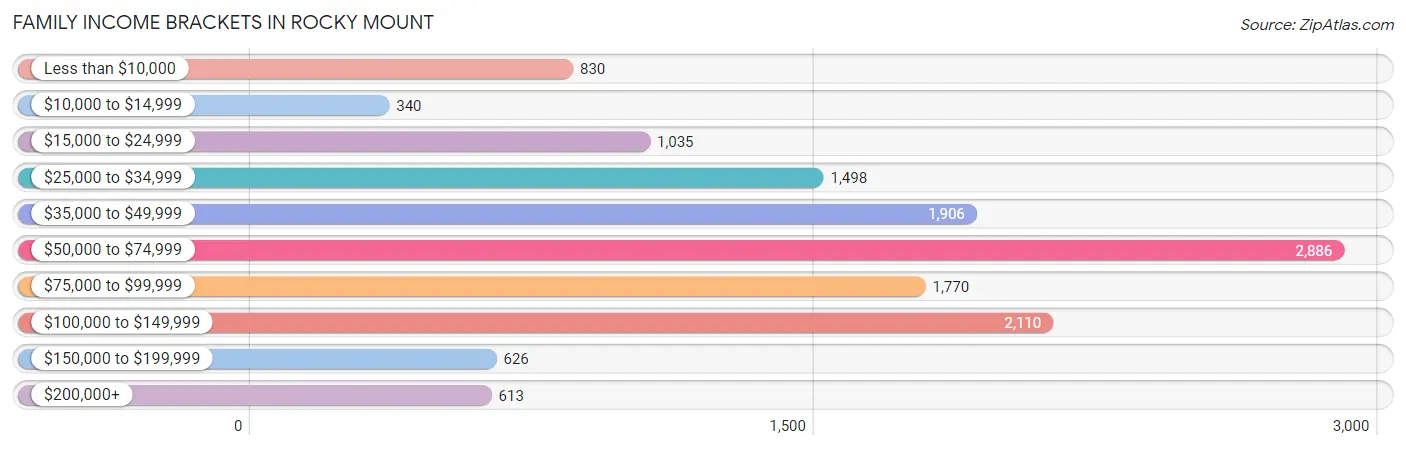
| Income Bracket | # Families | % Families |
| Less than $10,000 | 830 | 6.1% |
| $10,000 to $14,999 | 340 | 2.5% |
| $15,000 to $24,999 | 1,035 | 7.6% |
| $25,000 to $34,999 | 1,498 | 11.0% |
| $35,000 to $49,999 | 1,906 | 14.0% |
| $50,000 to $74,999 | 2,886 | 21.2% |
| $75,000 to $99,999 | 1,770 | 13.0% |
| $100,000 to $149,999 | 2,110 | 15.5% |
| $150,000 to $199,999 | 626 | 4.6% |
| $200,000+ | 613 | 4.5% |
Family Income by Famaliy Size in Rocky Mount
7+ person families (105 | 0.8%) account for the highest median family income in Rocky Mount with $106,484 per family, while 2-person families (6,981 | 51.3%) have the highest median income of $28,014 per family member.
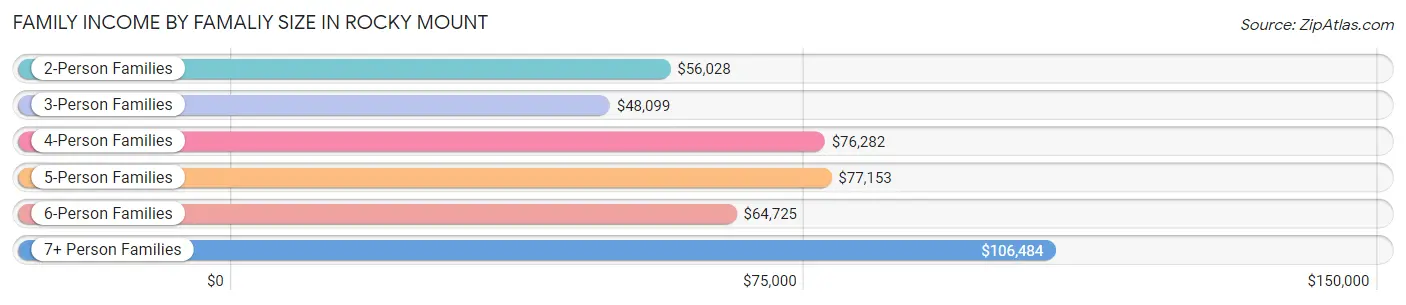
| Income Bracket | # Families | Median Income |
| 2-Person Families | 6,981 (51.3%) | $56,028 |
| 3-Person Families | 3,555 (26.1%) | $48,099 |
| 4-Person Families | 1,719 (12.6%) | $76,282 |
| 5-Person Families | 857 (6.3%) | $77,153 |
| 6-Person Families | 397 (2.9%) | $64,725 |
| 7+ Person Families | 105 (0.8%) | $106,484 |
| Total | 13,614 (100.0%) | $56,751 |
Family Income by Number of Earners in Rocky Mount
The median family income in Rocky Mount is $56,751, with families comprising 3+ earners (1,018) having the highest median family income of $122,788, while families with no earners (2,165) have the lowest median family income of $42,574, accounting for 7.5% and 15.9% of families, respectively.
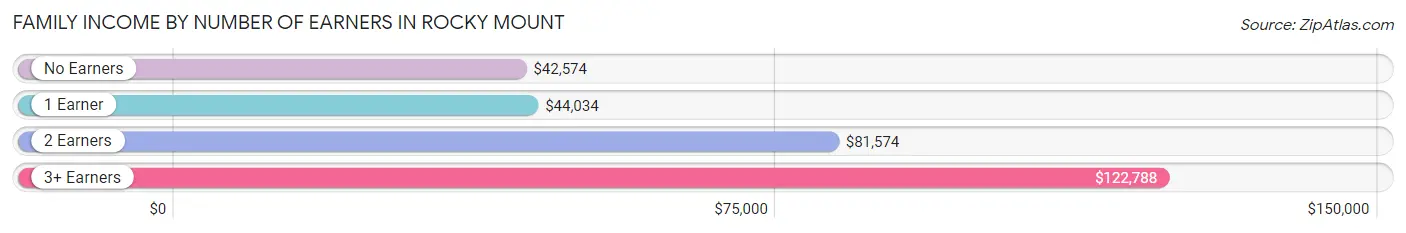
| Number of Earners | # Families | Median Income |
| No Earners | 2,165 (15.9%) | $42,574 |
| 1 Earner | 5,580 (41.0%) | $44,034 |
| 2 Earners | 4,851 (35.6%) | $81,574 |
| 3+ Earners | 1,018 (7.5%) | $122,788 |
| Total | 13,614 (100.0%) | $56,751 |
Household Income in Rocky Mount
Household Income Brackets in Rocky Mount
With 4,443 households falling in the category, the $50,000 to $74,999 income range is the most frequent in Rocky Mount, accounting for 19.6% of all households. In contrast, only 680 households (3.0%) fall into the $200,000+ income bracket, making it the least populous group.
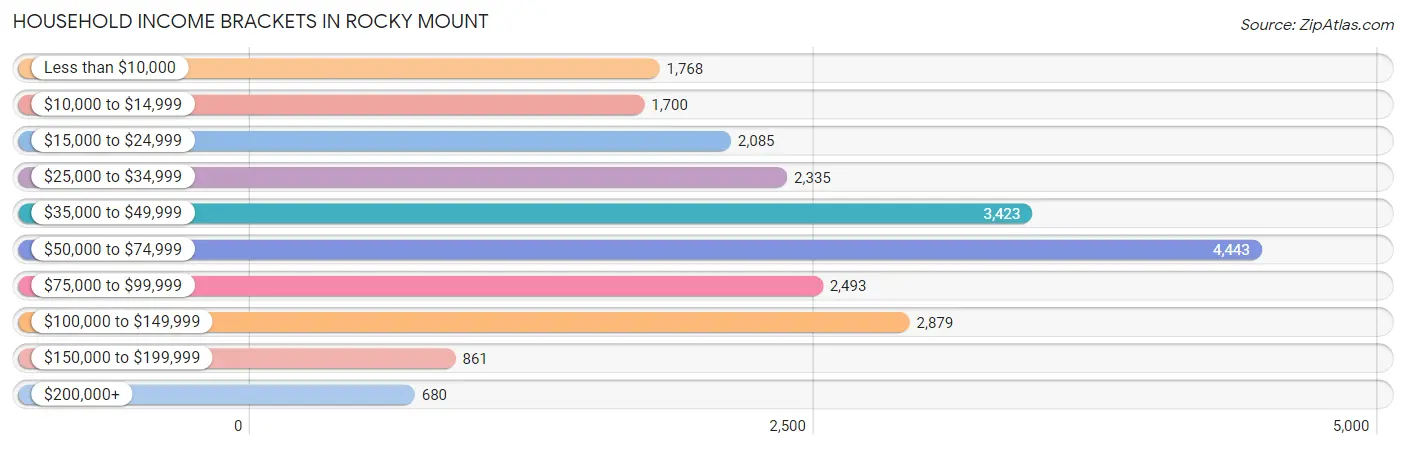
| Income Bracket | # Households | % Households |
| Less than $10,000 | 1,768 | 7.8% |
| $10,000 to $14,999 | 1,700 | 7.5% |
| $15,000 to $24,999 | 2,085 | 9.2% |
| $25,000 to $34,999 | 2,335 | 10.3% |
| $35,000 to $49,999 | 3,423 | 15.1% |
| $50,000 to $74,999 | 4,443 | 19.6% |
| $75,000 to $99,999 | 2,493 | 11.0% |
| $100,000 to $149,999 | 2,879 | 12.7% |
| $150,000 to $199,999 | 861 | 3.8% |
| $200,000+ | 680 | 3.0% |
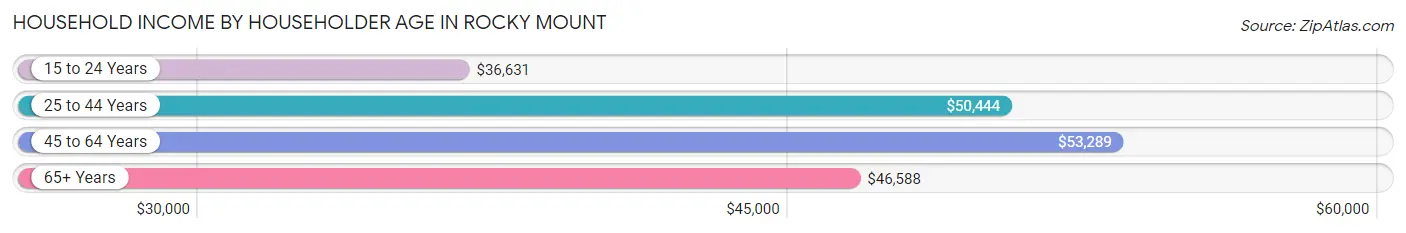
Household Income by Householder Age in Rocky Mount
The median household income in Rocky Mount is $50,092, with the highest median household income of $53,289 found in the 45 to 64 years age bracket for the primary householder. A total of 8,316 households (36.7%) fall into this category. Meanwhile, the 15 to 24 years age bracket for the primary householder has the lowest median household income of $36,631, with 849 households (3.7%) in this group.
| Income Bracket | # Households | Median Income |
| 15 to 24 Years | 849 (3.7%) | $36,631 |
| 25 to 44 Years | 6,319 (27.9%) | $50,444 |
| 45 to 64 Years | 8,316 (36.7%) | $53,289 |
| 65+ Years | 7,182 (31.7%) | $46,588 |
| Total | 22,666 (100.0%) | $50,092 |
Poverty in Rocky Mount
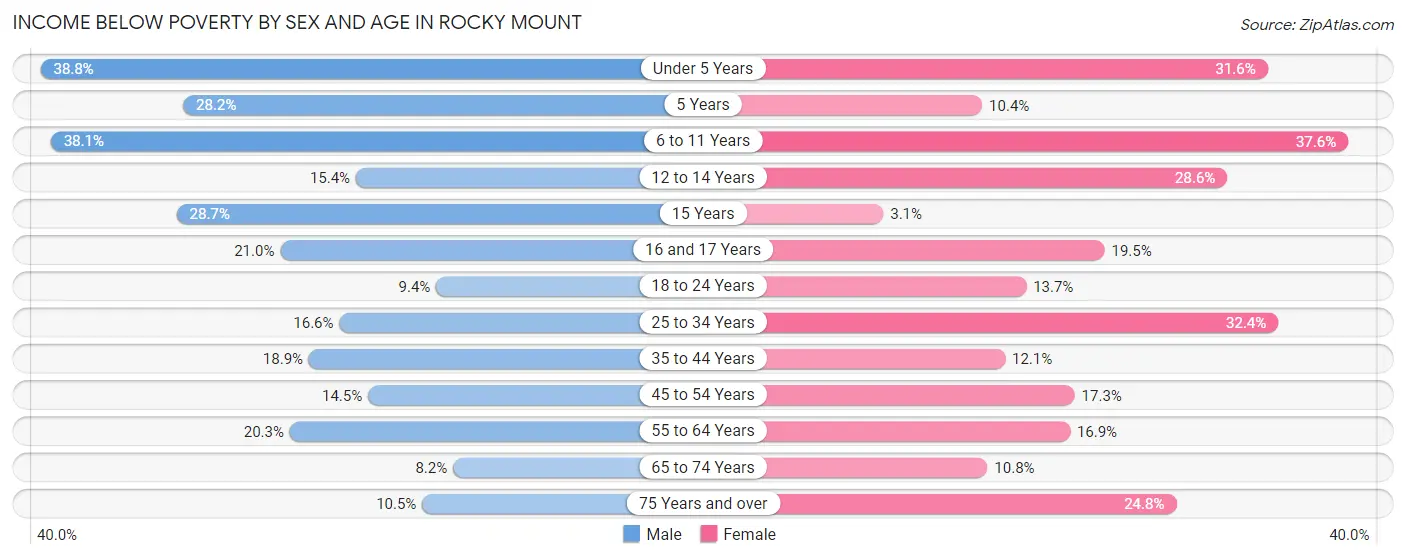
Income Below Poverty by Sex and Age in Rocky Mount
With 18.7% poverty level for males and 20.5% for females among the residents of Rocky Mount, under 5 year old males and 6 to 11 year old females are the most vulnerable to poverty, with 545 males (38.8%) and 732 females (37.6%) in their respective age groups living below the poverty level.
| Age Bracket | Male | Female |
| Under 5 Years | 545 (38.8%) | 435 (31.6%) |
| 5 Years | 59 (28.2%) | 27 (10.4%) |
| 6 to 11 Years | 956 (38.1%) | 732 (37.6%) |
| 12 to 14 Years | 209 (15.4%) | 208 (28.6%) |
| 15 Years | 60 (28.7%) | 8 (3.1%) |
| 16 and 17 Years | 177 (21.0%) | 103 (19.5%) |
| 18 to 24 Years | 231 (9.4%) | 342 (13.7%) |
| 25 to 34 Years | 528 (16.6%) | 1,106 (32.4%) |
| 35 to 44 Years | 552 (18.9%) | 390 (12.1%) |
| 45 to 54 Years | 398 (14.5%) | 605 (17.3%) |
| 55 to 64 Years | 678 (20.3%) | 734 (16.9%) |
| 65 to 74 Years | 241 (8.2%) | 322 (10.8%) |
| 75 Years and over | 156 (10.5%) | 657 (24.8%) |
| Total | 4,790 (18.7%) | 5,669 (20.5%) |
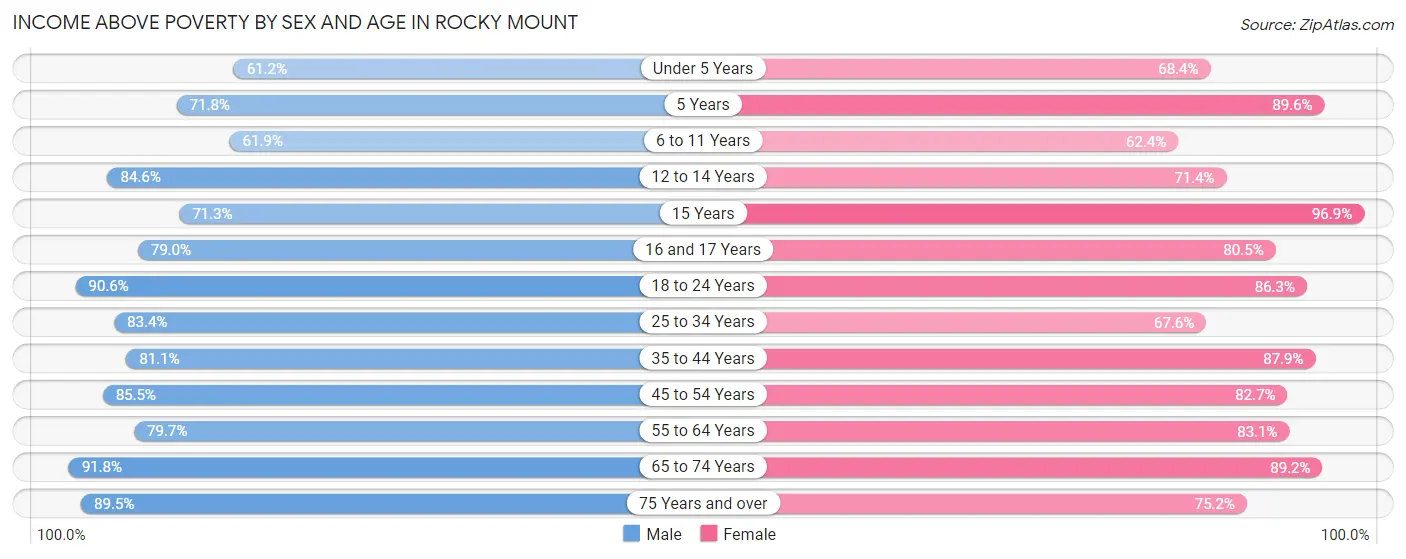
Income Above Poverty by Sex and Age in Rocky Mount
According to the poverty statistics in Rocky Mount, males aged 65 to 74 years and females aged 15 years are the age groups that are most secure financially, with 91.8% of males and 96.9% of females in these age groups living above the poverty line.
| Age Bracket | Male | Female |
| Under 5 Years | 859 (61.2%) | 941 (68.4%) |
| 5 Years | 150 (71.8%) | 232 (89.6%) |
| 6 to 11 Years | 1,556 (61.9%) | 1,216 (62.4%) |
| 12 to 14 Years | 1,148 (84.6%) | 519 (71.4%) |
| 15 Years | 149 (71.3%) | 252 (96.9%) |
| 16 and 17 Years | 665 (79.0%) | 425 (80.5%) |
| 18 to 24 Years | 2,217 (90.6%) | 2,157 (86.3%) |
| 25 to 34 Years | 2,647 (83.4%) | 2,309 (67.6%) |
| 35 to 44 Years | 2,370 (81.1%) | 2,829 (87.9%) |
| 45 to 54 Years | 2,346 (85.5%) | 2,895 (82.7%) |
| 55 to 64 Years | 2,660 (79.7%) | 3,598 (83.1%) |
| 65 to 74 Years | 2,703 (91.8%) | 2,657 (89.2%) |
| 75 Years and over | 1,332 (89.5%) | 1,989 (75.2%) |
| Total | 20,802 (81.3%) | 22,019 (79.5%) |
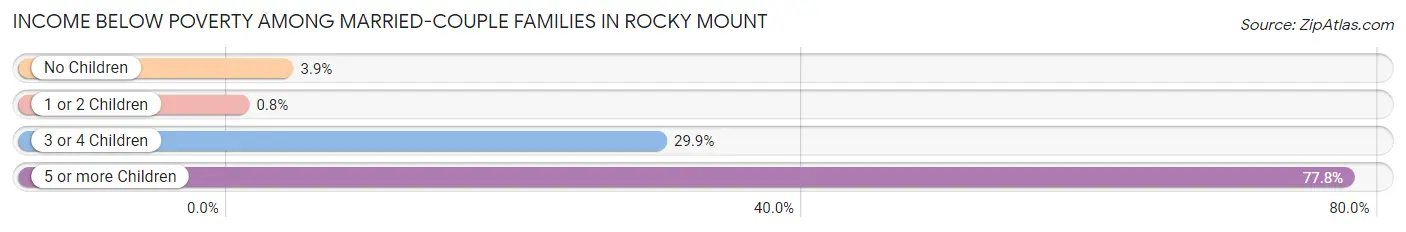
Income Below Poverty Among Married-Couple Families in Rocky Mount
The poverty statistics for married-couple families in Rocky Mount show that 5.7% or 400 of the total 7,016 families live below the poverty line. Families with 5 or more children have the highest poverty rate of 77.8%, comprising of 28 families. On the other hand, families with 1 or 2 children have the lowest poverty rate of 0.8%, which includes 14 families.
| Children | Above Poverty | Below Poverty |
| No Children | 4,450 (96.1%) | 179 (3.9%) |
| 1 or 2 Children | 1,738 (99.2%) | 14 (0.8%) |
| 3 or 4 Children | 420 (70.1%) | 179 (29.9%) |
| 5 or more Children | 8 (22.2%) | 28 (77.8%) |
| Total | 6,616 (94.3%) | 400 (5.7%) |
Income Below Poverty Among Single-Parent Households in Rocky Mount
According to the poverty data in Rocky Mount, 21.7% or 321 single-father households and 25.7% or 1,314 single-mother households are living below the poverty line. Among single-father households, those with no children have the highest poverty rate, with 158 households (22.7%) experiencing poverty. Likewise, among single-mother households, those with 3 or 4 children have the highest poverty rate, with 417 households (67.0%) falling below the poverty line.
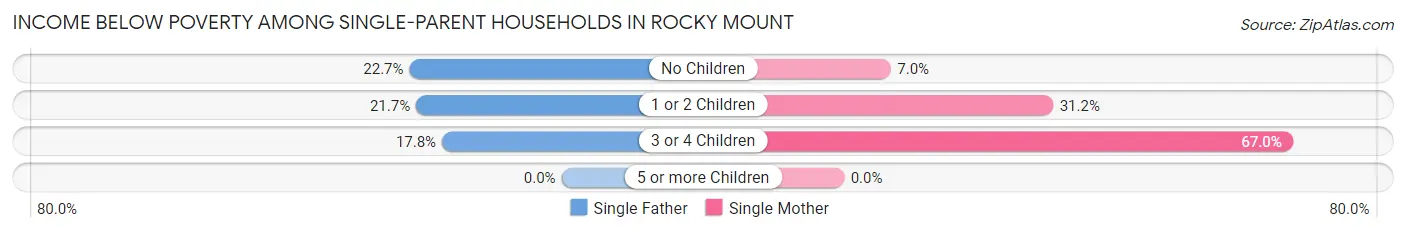
| Children | Single Father | Single Mother |
| No Children | 158 (22.7%) | 145 (7.0%) |
| 1 or 2 Children | 150 (21.7%) | 752 (31.1%) |
| 3 or 4 Children | 13 (17.8%) | 417 (67.0%) |
| 5 or more Children | 0 (0.0%) | 0 (0.0%) |
| Total | 321 (21.7%) | 1,314 (25.7%) |
Income Below Poverty Among Married-Couple vs Single-Parent Households in Rocky Mount
The poverty data for Rocky Mount shows that 400 of the married-couple family households (5.7%) and 1,635 of the single-parent households (24.8%) are living below the poverty level. Within the married-couple family households, those with 5 or more children have the highest poverty rate, with 28 households (77.8%) falling below the poverty line. Among the single-parent households, those with 3 or 4 children have the highest poverty rate, with 430 household (61.9%) living below poverty.
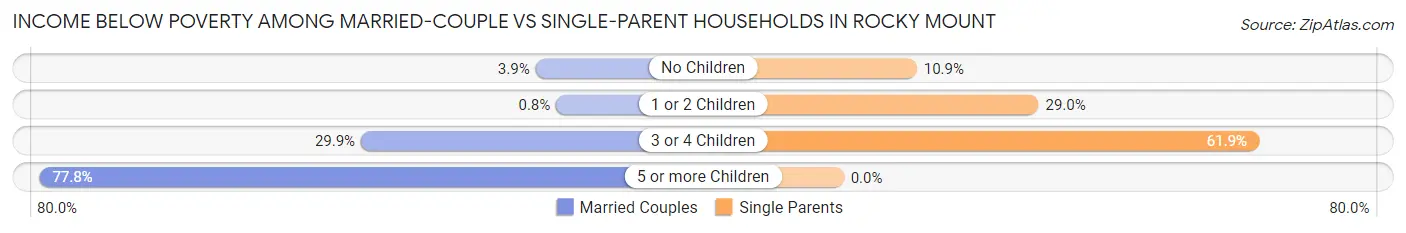
| Children | Married-Couple Families | Single-Parent Households |
| No Children | 179 (3.9%) | 303 (10.9%) |
| 1 or 2 Children | 14 (0.8%) | 902 (29.0%) |
| 3 or 4 Children | 179 (29.9%) | 430 (61.9%) |
| 5 or more Children | 28 (77.8%) | 0 (0.0%) |
| Total | 400 (5.7%) | 1,635 (24.8%) |
Race in Rocky Mount
The most populous races in Rocky Mount are Black / African American (33,720 | 62.2%), White / Caucasian (16,133 | 29.7%), and Hispanic or Latino (2,327 | 4.3%).
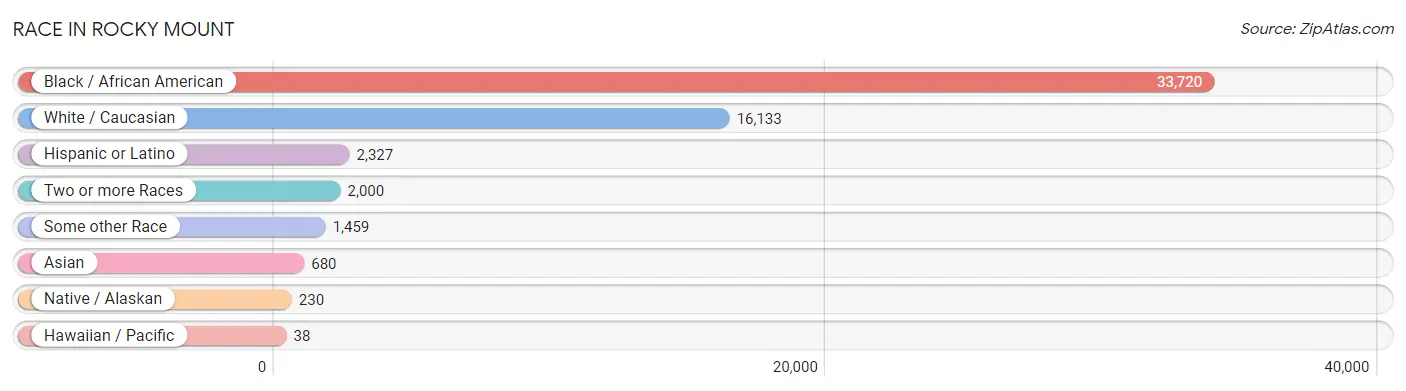
| Race | # Population | % Population |
| Asian | 680 | 1.3% |
| Black / African American | 33,720 | 62.2% |
| Hawaiian / Pacific | 38 | 0.1% |
| Hispanic or Latino | 2,327 | 4.3% |
| Native / Alaskan | 230 | 0.4% |
| White / Caucasian | 16,133 | 29.7% |
| Two or more Races | 2,000 | 3.7% |
| Some other Race | 1,459 | 2.7% |
| Total | 54,260 | 100.0% |
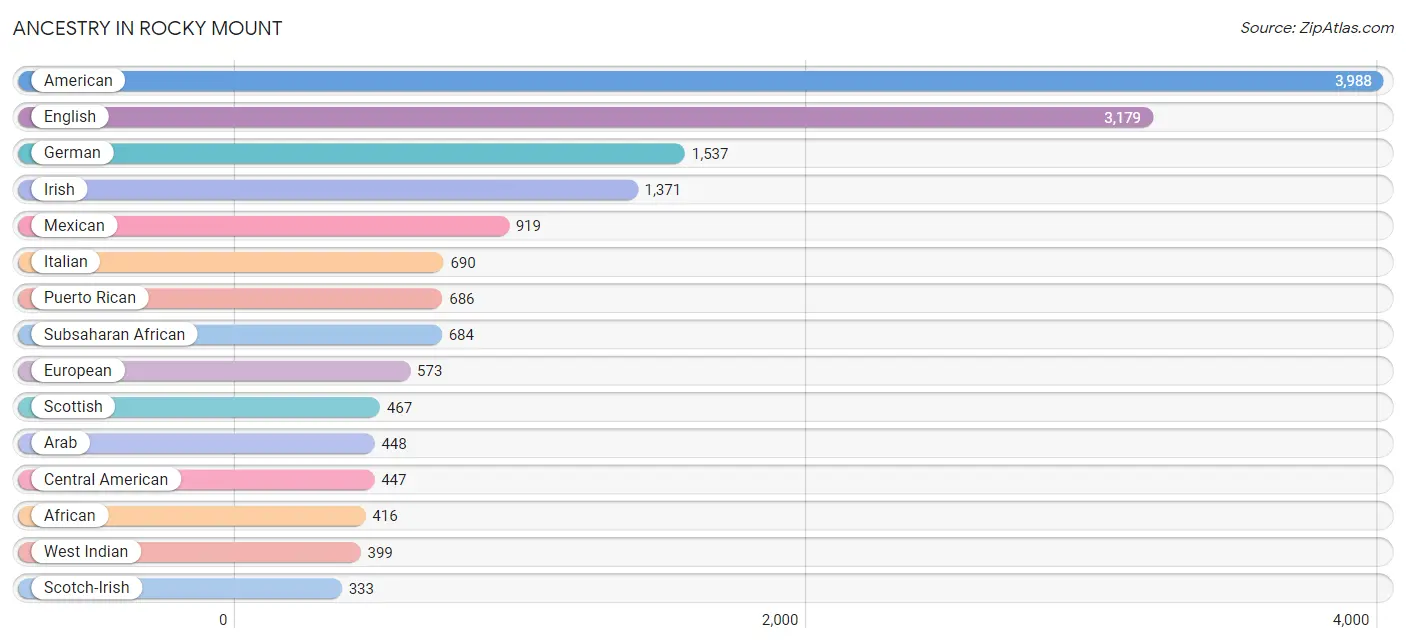
Ancestry in Rocky Mount
The most populous ancestries reported in Rocky Mount are American (3,988 | 7.3%), English (3,179 | 5.9%), German (1,537 | 2.8%), Irish (1,371 | 2.5%), and Mexican (919 | 1.7%), together accounting for 20.3% of all Rocky Mount residents.
| Ancestry | # Population | % Population |
| African | 416 | 0.8% |
| American | 3,988 | 7.3% |
| Arab | 448 | 0.8% |
| Australian | 11 | 0.0% |
| Bhutanese | 94 | 0.2% |
| Blackfeet | 125 | 0.2% |
| British | 193 | 0.4% |
| British West Indian | 28 | 0.1% |
| Burmese | 8 | 0.0% |
| Central American | 447 | 0.8% |
| Central American Indian | 6 | 0.0% |
| Cherokee | 92 | 0.2% |
| Cheyenne | 18 | 0.0% |
| Colombian | 150 | 0.3% |
| Costa Rican | 10 | 0.0% |
| Creek | 20 | 0.0% |
| Croatian | 40 | 0.1% |
| Cuban | 18 | 0.0% |
| Czech | 7 | 0.0% |
| Czechoslovakian | 18 | 0.0% |
| Danish | 20 | 0.0% |
| Dutch | 261 | 0.5% |
| Eastern European | 47 | 0.1% |
| English | 3,179 | 5.9% |
| European | 573 | 1.1% |
| Filipino | 11 | 0.0% |
| French | 232 | 0.4% |
| French Canadian | 49 | 0.1% |
| German | 1,537 | 2.8% |
| Greek | 42 | 0.1% |
| Guatemalan | 52 | 0.1% |
| Haitian | 164 | 0.3% |
| Honduran | 256 | 0.5% |
| Hungarian | 34 | 0.1% |
| Indian (Asian) | 162 | 0.3% |
| Irish | 1,371 | 2.5% |
| Italian | 690 | 1.3% |
| Jamaican | 87 | 0.2% |
| Korean | 97 | 0.2% |
| Lebanese | 33 | 0.1% |
| Lumbee | 152 | 0.3% |
| Maltese | 7 | 0.0% |
| Mexican | 919 | 1.7% |
| Moroccan | 55 | 0.1% |
| Native Hawaiian | 15 | 0.0% |
| Navajo | 55 | 0.1% |
| Nigerian | 268 | 0.5% |
| Northern European | 120 | 0.2% |
| Norwegian | 83 | 0.2% |
| Palestinian | 239 | 0.4% |
| Panamanian | 31 | 0.1% |
| Peruvian | 24 | 0.0% |
| Polish | 158 | 0.3% |
| Puerto Rican | 686 | 1.3% |
| Salvadoran | 2 | 0.0% |
| Samoan | 164 | 0.3% |
| Scotch-Irish | 333 | 0.6% |
| Scottish | 467 | 0.9% |
| South American | 201 | 0.4% |
| South American Indian | 17 | 0.0% |
| Spaniard | 3 | 0.0% |
| Spanish | 6 | 0.0% |
| Spanish American | 32 | 0.1% |
| Sri Lankan | 52 | 0.1% |
| Subsaharan African | 684 | 1.3% |
| Swedish | 27 | 0.1% |
| Thai | 223 | 0.4% |
| Ukrainian | 24 | 0.0% |
| Venezuelan | 27 | 0.1% |
| Welsh | 24 | 0.0% |
| West Indian | 399 | 0.7% | View All 71 Rows |
Immigrants in Rocky Mount
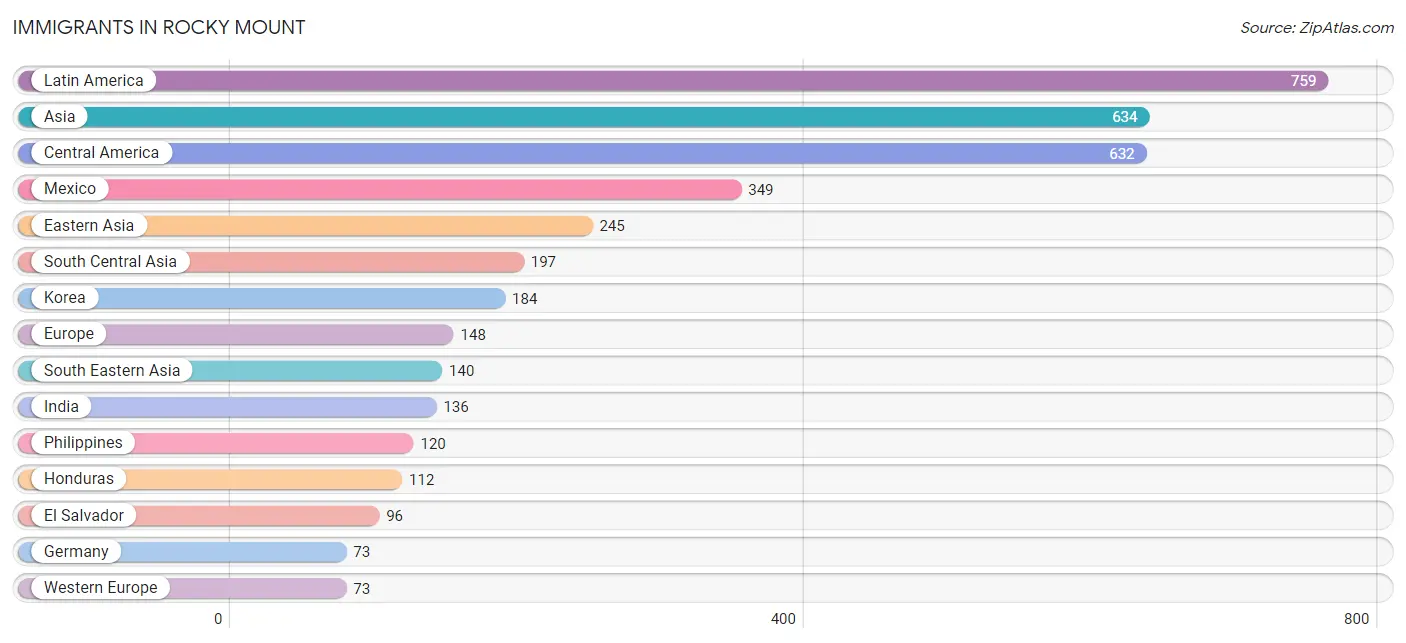
The most numerous immigrant groups reported in Rocky Mount came from Latin America (759 | 1.4%), Asia (634 | 1.2%), Central America (632 | 1.2%), Mexico (349 | 0.6%), and Eastern Asia (245 | 0.4%), together accounting for 4.8% of all Rocky Mount residents.
| Immigration Origin | # Population | % Population |
| Africa | 58 | 0.1% |
| Asia | 634 | 1.2% |
| Australia | 9 | 0.0% |
| Barbados | 7 | 0.0% |
| Canada | 33 | 0.1% |
| Caribbean | 55 | 0.1% |
| Central America | 632 | 1.2% |
| China | 42 | 0.1% |
| Colombia | 48 | 0.1% |
| Costa Rica | 10 | 0.0% |
| Cuba | 31 | 0.1% |
| Eastern Asia | 245 | 0.4% |
| Eastern Europe | 16 | 0.0% |
| El Salvador | 96 | 0.2% |
| England | 49 | 0.1% |
| Europe | 148 | 0.3% |
| Germany | 73 | 0.1% |
| Guatemala | 52 | 0.1% |
| Honduras | 112 | 0.2% |
| India | 136 | 0.3% |
| Japan | 19 | 0.0% |
| Jordan | 43 | 0.1% |
| Korea | 184 | 0.3% |
| Latin America | 759 | 1.4% |
| Latvia | 16 | 0.0% |
| Malaysia | 9 | 0.0% |
| Mexico | 349 | 0.6% |
| Northern Africa | 37 | 0.1% |
| Northern Europe | 49 | 0.1% |
| Oceania | 9 | 0.0% |
| Pakistan | 13 | 0.0% |
| Panama | 13 | 0.0% |
| Peru | 24 | 0.0% |
| Philippines | 120 | 0.2% |
| South America | 72 | 0.1% |
| South Central Asia | 197 | 0.4% |
| South Eastern Asia | 140 | 0.3% |
| Southern Europe | 10 | 0.0% |
| Sri Lanka | 48 | 0.1% |
| Sudan | 37 | 0.1% |
| Taiwan | 11 | 0.0% |
| Turkey | 9 | 0.0% |
| Vietnam | 11 | 0.0% |
| Western Asia | 52 | 0.1% |
| Western Europe | 73 | 0.1% | View All 45 Rows |
Sex and Age in Rocky Mount
Sex and Age in Rocky Mount
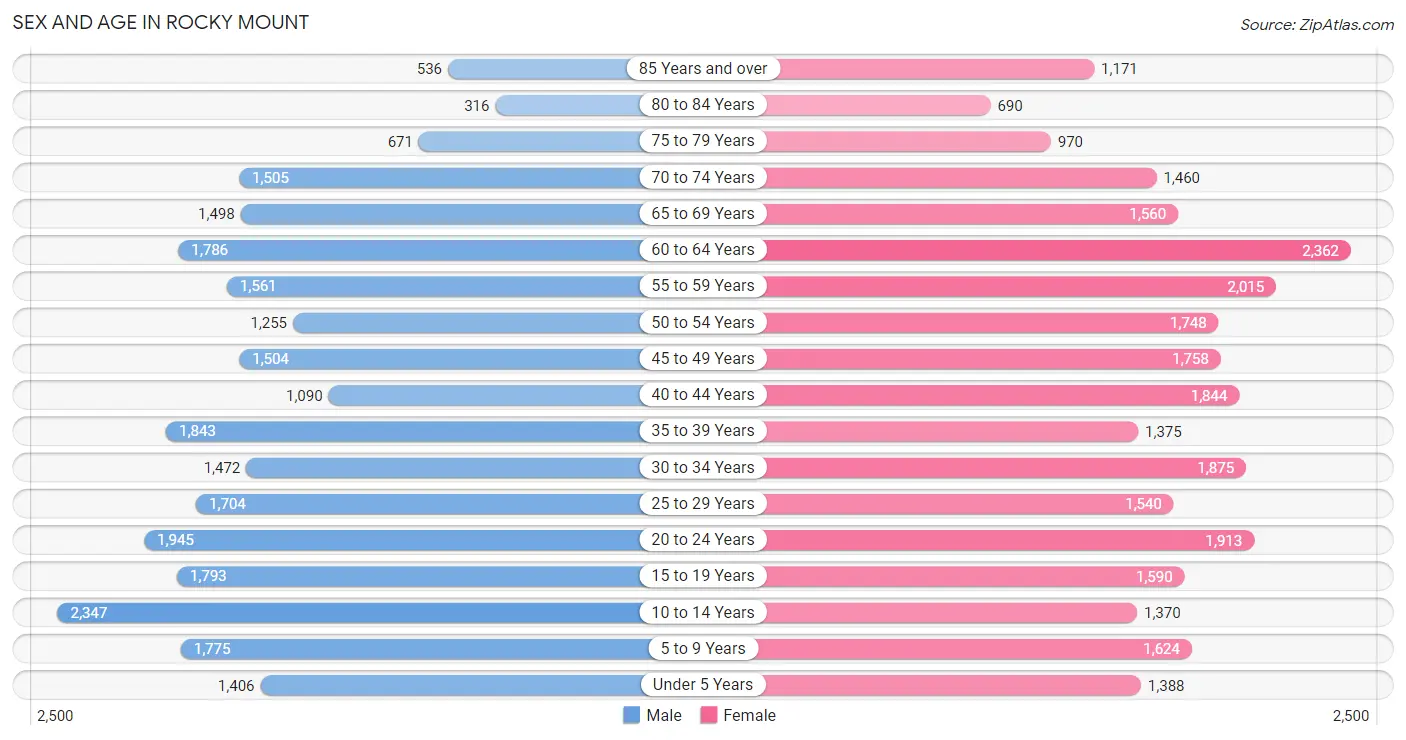
The most populous age groups in Rocky Mount are 10 to 14 Years (2,347 | 9.0%) for men and 60 to 64 Years (2,362 | 8.4%) for women.
| Age Bracket | Male | Female |
| Under 5 Years | 1,406 (5.4%) | 1,388 (4.9%) |
| 5 to 9 Years | 1,775 (6.8%) | 1,624 (5.8%) |
| 10 to 14 Years | 2,347 (9.0%) | 1,370 (4.9%) |
| 15 to 19 Years | 1,793 (6.9%) | 1,590 (5.6%) |
| 20 to 24 Years | 1,945 (7.5%) | 1,913 (6.8%) |
| 25 to 29 Years | 1,704 (6.6%) | 1,540 (5.4%) |
| 30 to 34 Years | 1,472 (5.7%) | 1,875 (6.6%) |
| 35 to 39 Years | 1,843 (7.1%) | 1,375 (4.9%) |
| 40 to 44 Years | 1,090 (4.2%) | 1,844 (6.5%) |
| 45 to 49 Years | 1,504 (5.8%) | 1,758 (6.2%) |
| 50 to 54 Years | 1,255 (4.8%) | 1,748 (6.2%) |
| 55 to 59 Years | 1,561 (6.0%) | 2,015 (7.1%) |
| 60 to 64 Years | 1,786 (6.9%) | 2,362 (8.4%) |
| 65 to 69 Years | 1,498 (5.8%) | 1,560 (5.5%) |
| 70 to 74 Years | 1,505 (5.8%) | 1,460 (5.2%) |
| 75 to 79 Years | 671 (2.6%) | 970 (3.4%) |
| 80 to 84 Years | 316 (1.2%) | 690 (2.4%) |
| 85 Years and over | 536 (2.1%) | 1,171 (4.1%) |
| Total | 26,007 (100.0%) | 28,253 (100.0%) |
Families and Households in Rocky Mount
Median Family Size in Rocky Mount
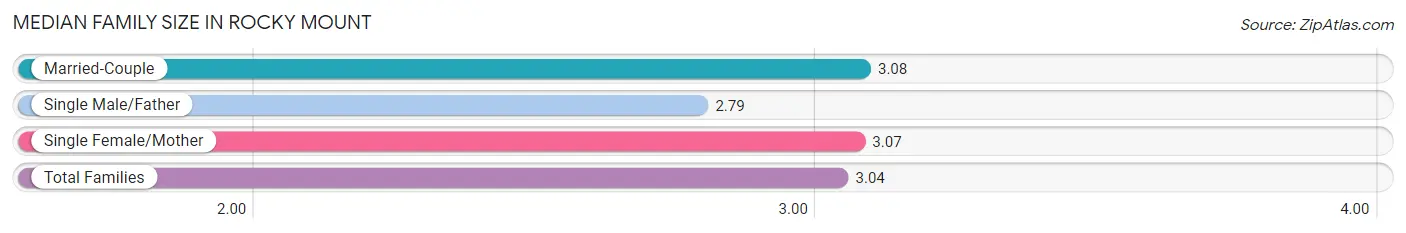
The median family size in Rocky Mount is 3.04 persons per family, with married-couple families (7,016 | 51.5%) accounting for the largest median family size of 3.08 persons per family. On the other hand, single male/father families (1,479 | 10.9%) represent the smallest median family size with 2.79 persons per family.
| Family Type | # Families | Family Size |
| Married-Couple | 7,016 (51.5%) | 3.08 |
| Single Male/Father | 1,479 (10.9%) | 2.79 |
| Single Female/Mother | 5,119 (37.6%) | 3.07 |
| Total Families | 13,614 (100.0%) | 3.04 |
Median Household Size in Rocky Mount
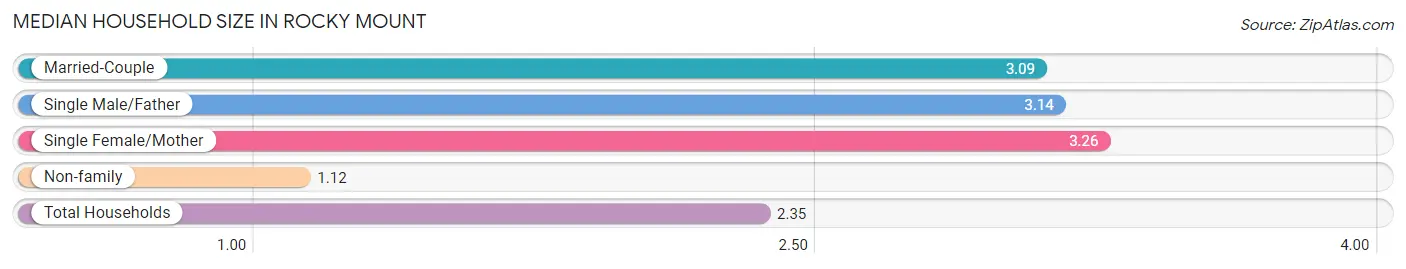
The median household size in Rocky Mount is 2.35 persons per household, with single female/mother households (5,119 | 22.6%) accounting for the largest median household size of 3.26 persons per household. non-family households (9,052 | 39.9%) represent the smallest median household size with 1.12 persons per household.
| Household Type | # Households | Household Size |
| Married-Couple | 7,016 (30.9%) | 3.09 |
| Single Male/Father | 1,479 (6.5%) | 3.14 |
| Single Female/Mother | 5,119 (22.6%) | 3.26 |
| Non-family | 9,052 (39.9%) | 1.12 |
| Total Households | 22,666 (100.0%) | 2.35 |
Household Size by Marriage Status in Rocky Mount
Out of a total of 22,666 households in Rocky Mount, 13,614 (60.1%) are family households, while 9,052 (39.9%) are nonfamily households. The most numerous type of family households are 2-person households, comprising 6,334, and the most common type of nonfamily households are 1-person households, comprising 8,070.
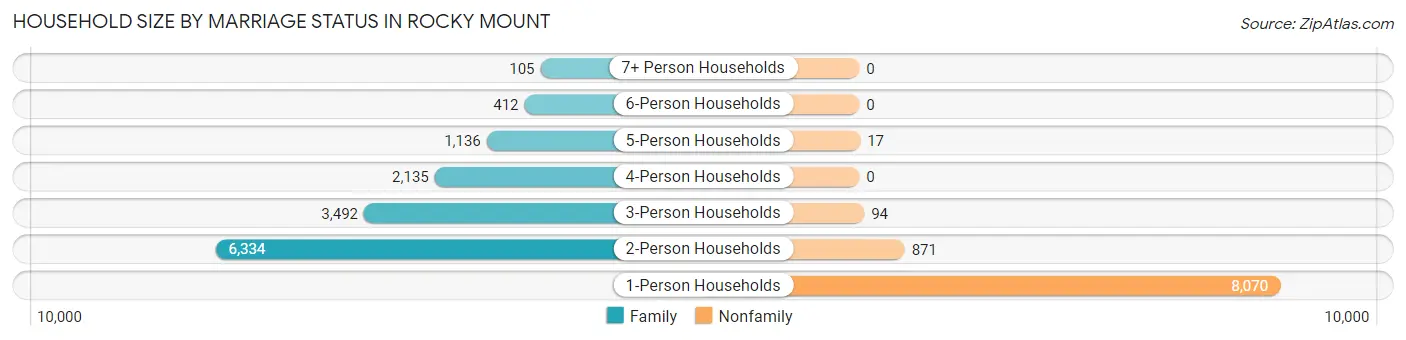
| Household Size | Family Households | Nonfamily Households |
| 1-Person Households | - | 8,070 (35.6%) |
| 2-Person Households | 6,334 (27.9%) | 871 (3.8%) |
| 3-Person Households | 3,492 (15.4%) | 94 (0.4%) |
| 4-Person Households | 2,135 (9.4%) | 0 (0.0%) |
| 5-Person Households | 1,136 (5.0%) | 17 (0.1%) |
| 6-Person Households | 412 (1.8%) | 0 (0.0%) |
| 7+ Person Households | 105 (0.5%) | 0 (0.0%) |
| Total | 13,614 (60.1%) | 9,052 (39.9%) |
Female Fertility in Rocky Mount
Fertility by Age in Rocky Mount
Average fertility rate in Rocky Mount is 23.0 births per 1,000 women. Women in the age bracket of 15 to 19 years have the highest fertility rate with 34.0 births per 1,000 women. Women in the age bracket of 35 to 50 years acount for 41.8% of all women with births.
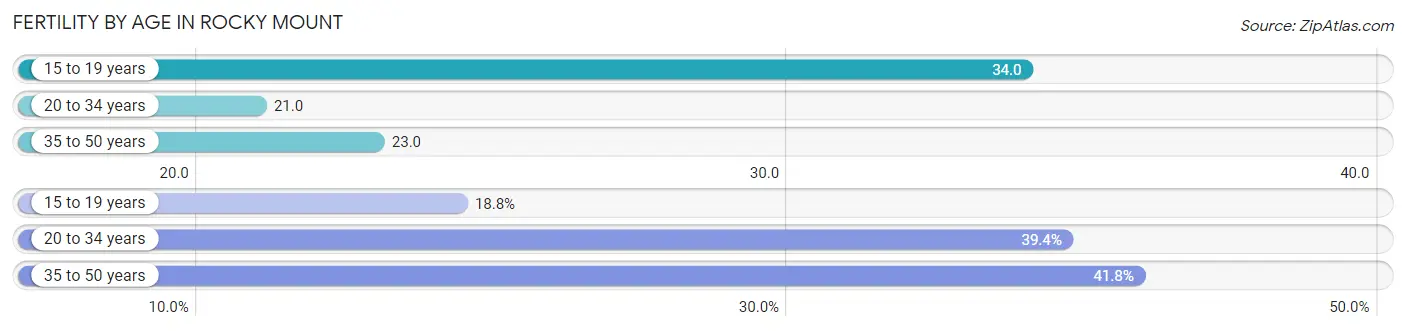
| Age Bracket | Women with Births | Births / 1,000 Women |
| 15 to 19 years | 54 (18.8%) | 34.0 |
| 20 to 34 years | 113 (39.4%) | 21.0 |
| 35 to 50 years | 120 (41.8%) | 23.0 |
| Total | 287 (100.0%) | 23.0 |
Fertility by Age by Marriage Status in Rocky Mount
87.5% of women with births (287) in Rocky Mount are married. The highest percentage of unmarried women with births falls into 20 to 34 years age bracket with 31.9% of them unmarried at the time of birth, while the lowest percentage of unmarried women with births belong to 15 to 19 years age bracket with 0.0% of them unmarried.
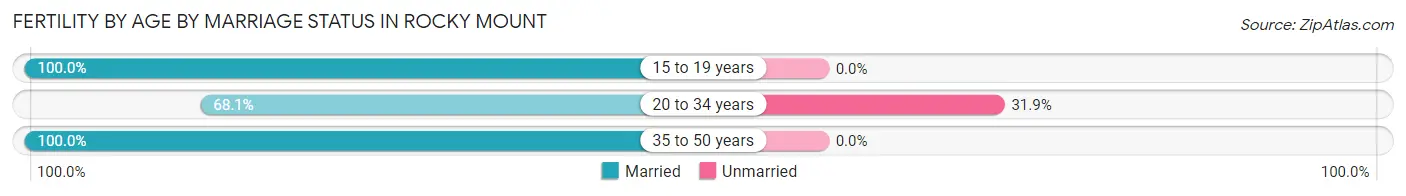
| Age Bracket | Married | Unmarried |
| 15 to 19 years | 54 (100.0%) | 0 (0.0%) |
| 20 to 34 years | 77 (68.1%) | 36 (31.9%) |
| 35 to 50 years | 120 (100.0%) | 0 (0.0%) |
| Total | 251 (87.5%) | 36 (12.5%) |
Fertility by Education in Rocky Mount
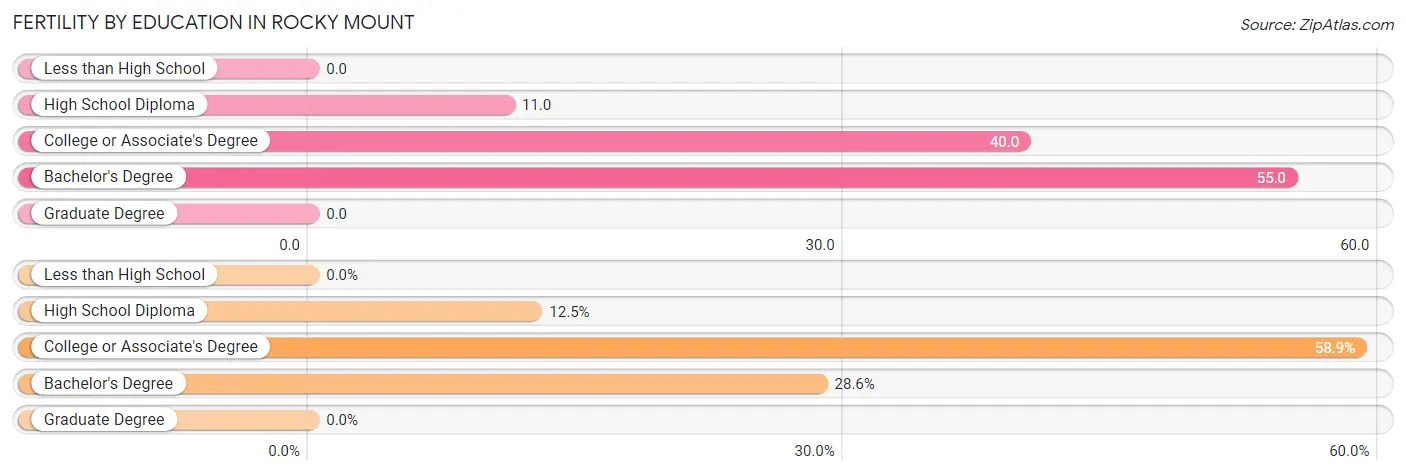
| Educational Attainment | Women with Births | Births / 1,000 Women |
| Less than High School | 0 (0.0%) | 0.0 |
| High School Diploma | 36 (12.5%) | 11.0 |
| College or Associate's Degree | 169 (58.9%) | 40.0 |
| Bachelor's Degree | 82 (28.6%) | 55.0 |
| Graduate Degree | 0 (0.0%) | 0.0 |
| Total | 287 (100.0%) | 23.0 |
Fertility by Education by Marriage Status in Rocky Mount
12.5% of women with births in Rocky Mount are unmarried. Women with the educational attainment of college or associate's degree are most likely to be married with 100.0% of them married at childbirth, while women with the educational attainment of high school diploma are least likely to be married with 100.0% of them unmarried at childbirth.
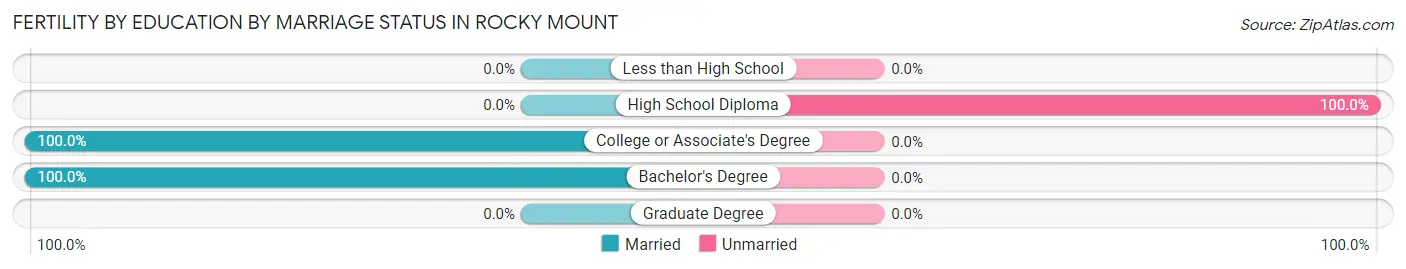
| Educational Attainment | Married | Unmarried |
| Less than High School | 0 (0.0%) | 0 (0.0%) |
| High School Diploma | 0 (0.0%) | 36 (100.0%) |
| College or Associate's Degree | 169 (100.0%) | 0 (0.0%) |
| Bachelor's Degree | 82 (100.0%) | 0 (0.0%) |
| Graduate Degree | 0 (0.0%) | 0 (0.0%) |
| Total | 251 (87.5%) | 36 (12.5%) |
Employment Characteristics in Rocky Mount
Employment by Class of Employer in Rocky Mount
Among the 23,457 employed individuals in Rocky Mount, private company employees (17,910 | 76.3%), local government employees (1,507 | 6.4%), and not-for-profit organizations (1,129 | 4.8%) make up the most common classes of employment.
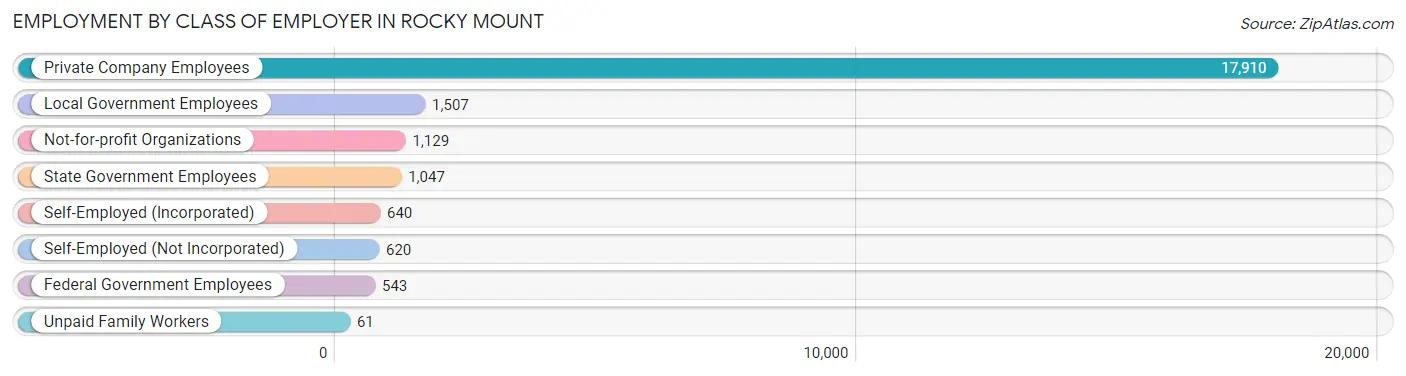
| Employer Class | # Employees | % Employees |
| Private Company Employees | 17,910 | 76.3% |
| Self-Employed (Incorporated) | 640 | 2.7% |
| Self-Employed (Not Incorporated) | 620 | 2.6% |
| Not-for-profit Organizations | 1,129 | 4.8% |
| Local Government Employees | 1,507 | 6.4% |
| State Government Employees | 1,047 | 4.5% |
| Federal Government Employees | 543 | 2.3% |
| Unpaid Family Workers | 61 | 0.3% |
| Total | 23,457 | 100.0% |
Employment Status by Age in Rocky Mount
According to the labor force statistics for Rocky Mount, out of the total population over 16 years of age (43,879), 59.4% or 26,064 individuals are in the labor force, with 7.8% or 2,033 of them unemployed. The age group with the highest labor force participation rate is 30 to 34 years, with 81.7% or 2,734 individuals in the labor force. Within the labor force, the 16 to 19 years age range has the highest percentage of unemployed individuals, with 16.2% or 196 of them being unemployed.
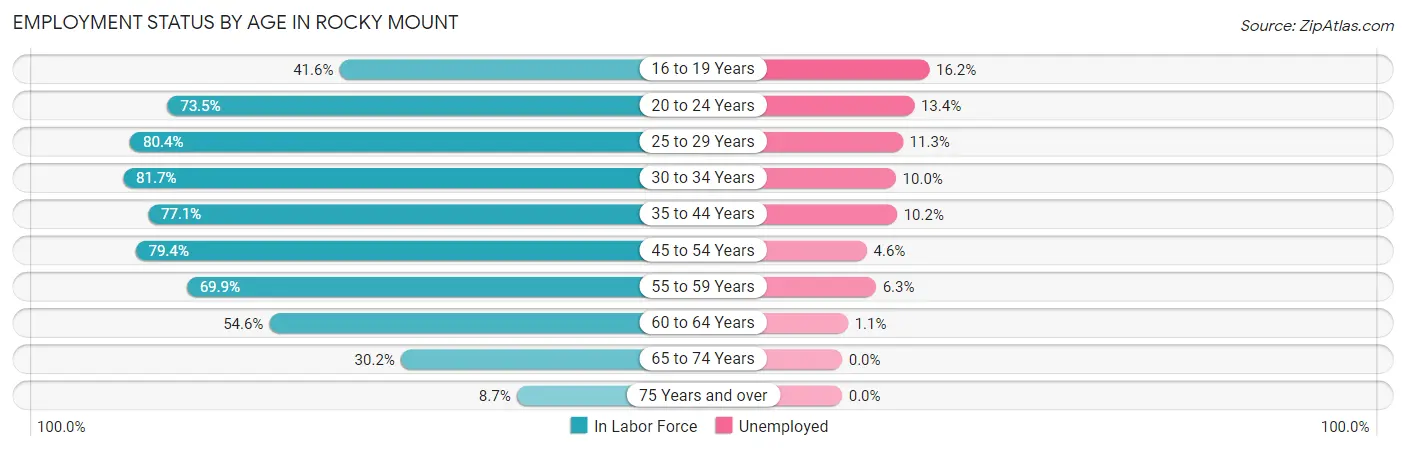
| Age Bracket | In Labor Force | Unemployed |
| 16 to 19 Years | 1,211 (41.6%) | 196 (16.2%) |
| 20 to 24 Years | 2,836 (73.5%) | 380 (13.4%) |
| 25 to 29 Years | 2,608 (80.4%) | 295 (11.3%) |
| 30 to 34 Years | 2,734 (81.7%) | 273 (10.0%) |
| 35 to 44 Years | 4,743 (77.1%) | 484 (10.2%) |
| 45 to 54 Years | 4,974 (79.4%) | 229 (4.6%) |
| 55 to 59 Years | 2,500 (69.9%) | 158 (6.3%) |
| 60 to 64 Years | 2,265 (54.6%) | 25 (1.1%) |
| 65 to 74 Years | 1,819 (30.2%) | 0 (0.0%) |
| 75 Years and over | 379 (8.7%) | 0 (0.0%) |
| Total | 26,064 (59.4%) | 2,033 (7.8%) |
Employment Status by Educational Attainment in Rocky Mount
According to labor force statistics for Rocky Mount, 74.1% of individuals (19,808) out of the total population between 25 and 64 years of age (26,732) are in the labor force, with 7.4% or 1,466 of them being unemployed. The group with the highest labor force participation rate are those with the educational attainment of college / associate degree, with 82.6% or 6,944 individuals in the labor force. Within the labor force, individuals with less than high school education have the highest percentage of unemployment, with 10.8% or 149 of them being unemployed.
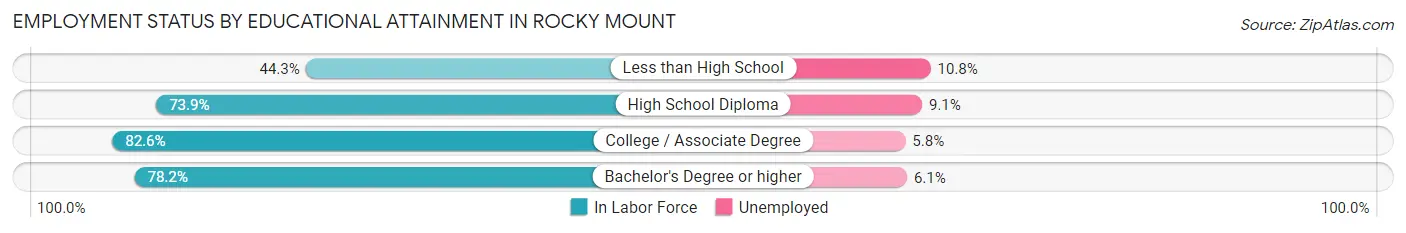
| Educational Attainment | In Labor Force | Unemployed |
| Less than High School | 1,379 (44.3%) | 336 (10.8%) |
| High School Diploma | 6,979 (73.9%) | 859 (9.1%) |
| College / Associate Degree | 6,944 (82.6%) | 488 (5.8%) |
| Bachelor's Degree or higher | 4,511 (78.2%) | 352 (6.1%) |
| Total | 19,808 (74.1%) | 1,978 (7.4%) |
Employment Occupations by Sex in Rocky Mount
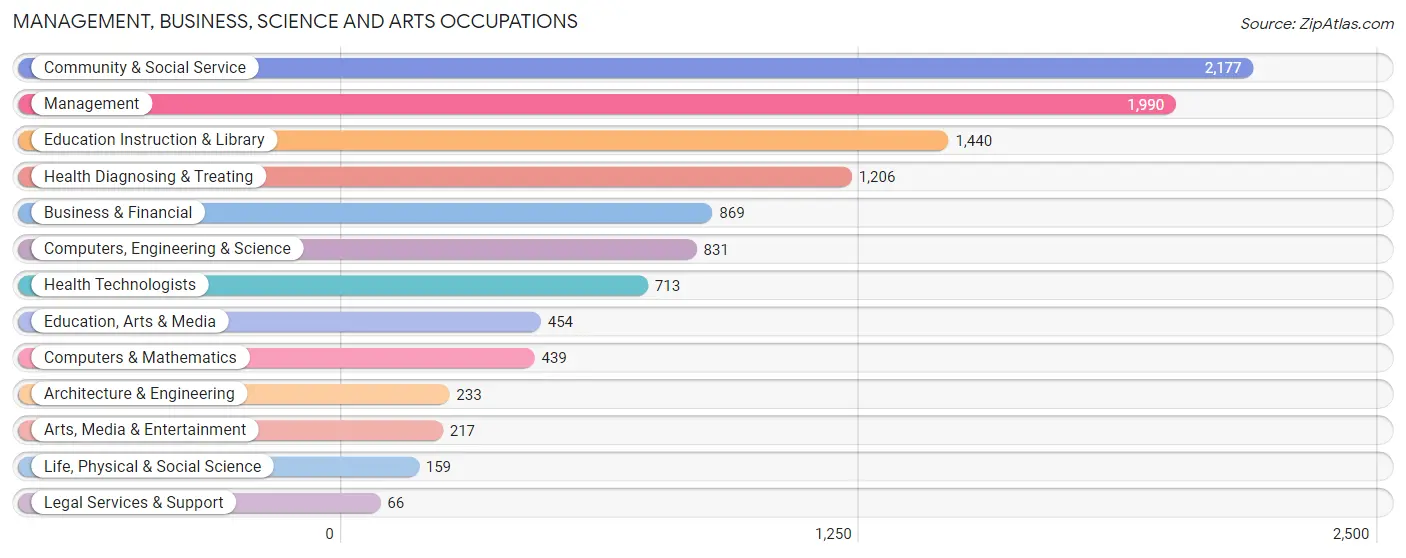
Management, Business, Science and Arts Occupations
The most common Management, Business, Science and Arts occupations in Rocky Mount are Community & Social Service (2,177 | 9.1%), Management (1,990 | 8.3%), Education Instruction & Library (1,440 | 6.0%), Health Diagnosing & Treating (1,206 | 5.0%), and Business & Financial (869 | 3.6%).
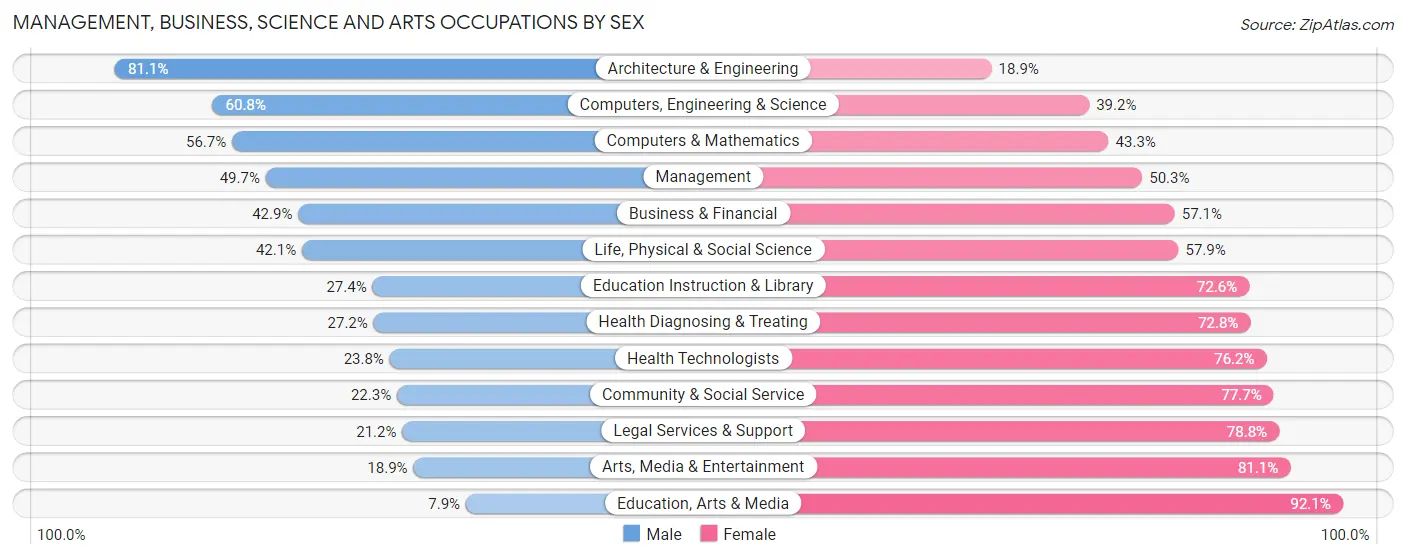
Management, Business, Science and Arts Occupations by Sex
Within the Management, Business, Science and Arts occupations in Rocky Mount, the most male-oriented occupations are Architecture & Engineering (81.1%), Computers, Engineering & Science (60.8%), and Computers & Mathematics (56.7%), while the most female-oriented occupations are Education, Arts & Media (92.1%), Arts, Media & Entertainment (81.1%), and Legal Services & Support (78.8%).
| Occupation | Male | Female |
| Management | 989 (49.7%) | 1,001 (50.3%) |
| Business & Financial | 373 (42.9%) | 496 (57.1%) |
| Computers, Engineering & Science | 505 (60.8%) | 326 (39.2%) |
| Computers & Mathematics | 249 (56.7%) | 190 (43.3%) |
| Architecture & Engineering | 189 (81.1%) | 44 (18.9%) |
| Life, Physical & Social Science | 67 (42.1%) | 92 (57.9%) |
| Community & Social Service | 486 (22.3%) | 1,691 (77.7%) |
| Education, Arts & Media | 36 (7.9%) | 418 (92.1%) |
| Legal Services & Support | 14 (21.2%) | 52 (78.8%) |
| Education Instruction & Library | 395 (27.4%) | 1,045 (72.6%) |
| Arts, Media & Entertainment | 41 (18.9%) | 176 (81.1%) |
| Health Diagnosing & Treating | 328 (27.2%) | 878 (72.8%) |
| Health Technologists | 170 (23.8%) | 543 (76.2%) |
| Total (Category) | 2,681 (37.9%) | 4,392 (62.1%) |
| Total (Overall) | 11,642 (48.5%) | 12,361 (51.5%) |
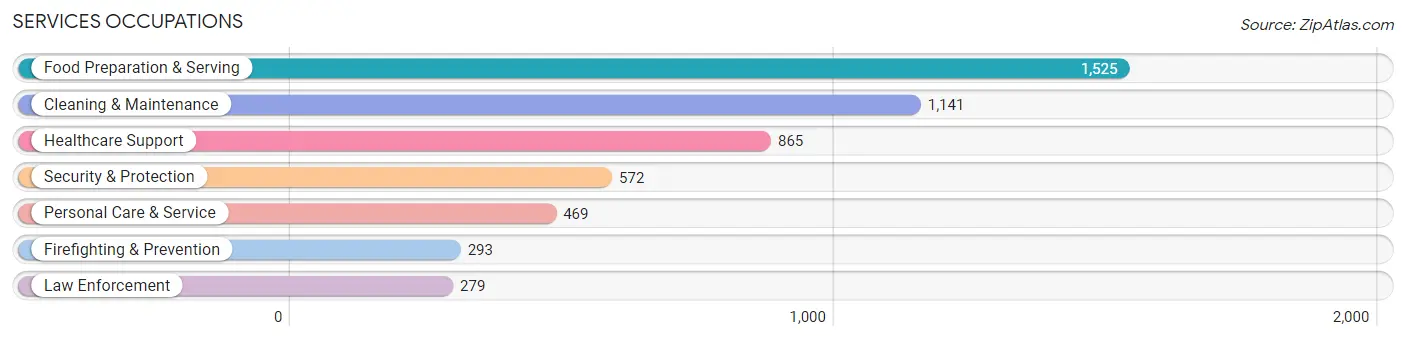
Services Occupations
The most common Services occupations in Rocky Mount are Food Preparation & Serving (1,525 | 6.4%), Cleaning & Maintenance (1,141 | 4.8%), Healthcare Support (865 | 3.6%), Security & Protection (572 | 2.4%), and Personal Care & Service (469 | 1.9%).
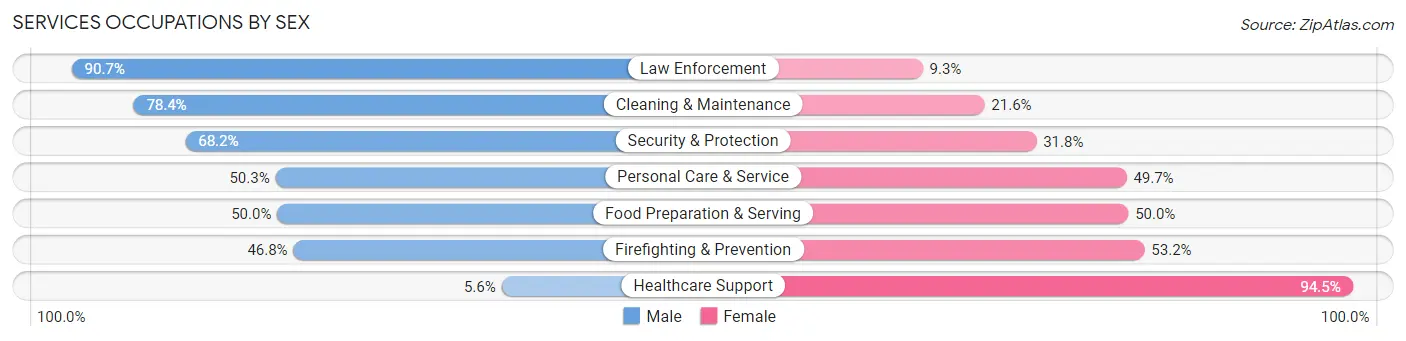
Services Occupations by Sex
Within the Services occupations in Rocky Mount, the most male-oriented occupations are Law Enforcement (90.7%), Cleaning & Maintenance (78.4%), and Security & Protection (68.2%), while the most female-oriented occupations are Healthcare Support (94.5%), Firefighting & Prevention (53.2%), and Food Preparation & Serving (50.0%).
| Occupation | Male | Female |
| Healthcare Support | 48 (5.6%) | 817 (94.5%) |
| Security & Protection | 390 (68.2%) | 182 (31.8%) |
| Firefighting & Prevention | 137 (46.8%) | 156 (53.2%) |
| Law Enforcement | 253 (90.7%) | 26 (9.3%) |
| Food Preparation & Serving | 762 (50.0%) | 763 (50.0%) |
| Cleaning & Maintenance | 895 (78.4%) | 246 (21.6%) |
| Personal Care & Service | 236 (50.3%) | 233 (49.7%) |
| Total (Category) | 2,331 (51.0%) | 2,241 (49.0%) |
| Total (Overall) | 11,642 (48.5%) | 12,361 (51.5%) |
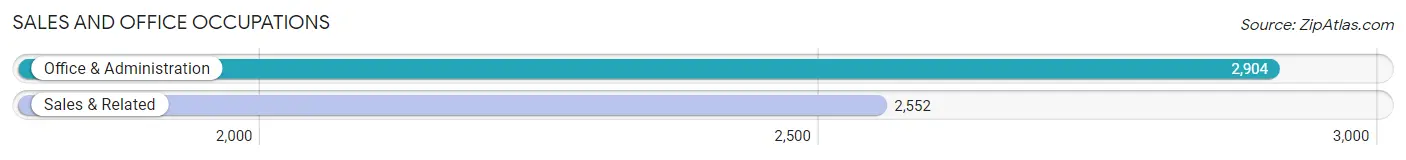
Sales and Office Occupations
The most common Sales and Office occupations in Rocky Mount are Office & Administration (2,904 | 12.1%), and Sales & Related (2,552 | 10.6%).
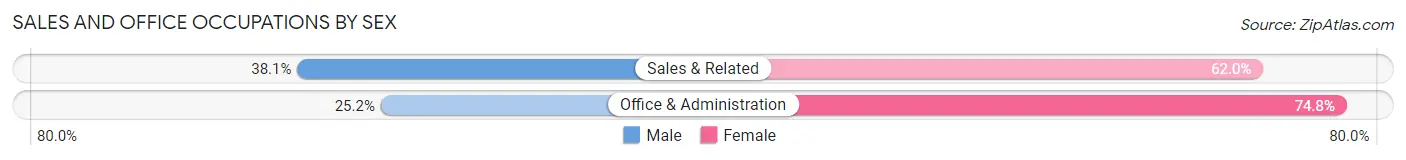
Sales and Office Occupations by Sex
| Occupation | Male | Female |
| Sales & Related | 971 (38.1%) | 1,581 (62.0%) |
| Office & Administration | 732 (25.2%) | 2,172 (74.8%) |
| Total (Category) | 1,703 (31.2%) | 3,753 (68.8%) |
| Total (Overall) | 11,642 (48.5%) | 12,361 (51.5%) |
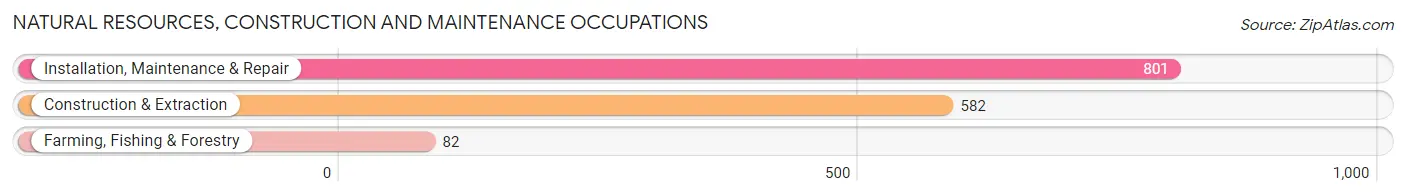
Natural Resources, Construction and Maintenance Occupations
The most common Natural Resources, Construction and Maintenance occupations in Rocky Mount are Installation, Maintenance & Repair (801 | 3.3%), Construction & Extraction (582 | 2.4%), and Farming, Fishing & Forestry (82 | 0.3%).
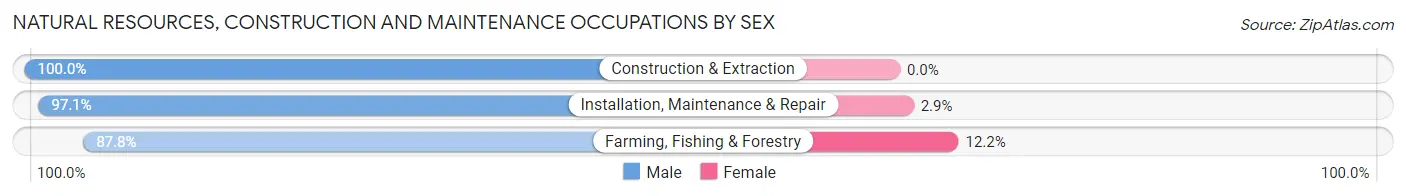
Natural Resources, Construction and Maintenance Occupations by Sex
| Occupation | Male | Female |
| Farming, Fishing & Forestry | 72 (87.8%) | 10 (12.2%) |
| Construction & Extraction | 582 (100.0%) | 0 (0.0%) |
| Installation, Maintenance & Repair | 778 (97.1%) | 23 (2.9%) |
| Total (Category) | 1,432 (97.8%) | 33 (2.2%) |
| Total (Overall) | 11,642 (48.5%) | 12,361 (51.5%) |
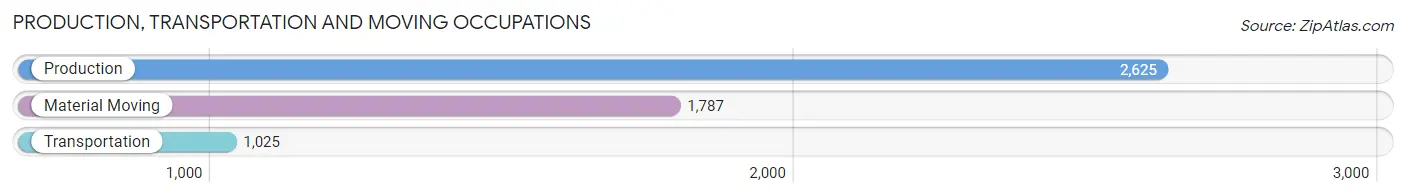
Production, Transportation and Moving Occupations
The most common Production, Transportation and Moving occupations in Rocky Mount are Production (2,625 | 10.9%), Material Moving (1,787 | 7.4%), and Transportation (1,025 | 4.3%).
Production, Transportation and Moving Occupations by Sex
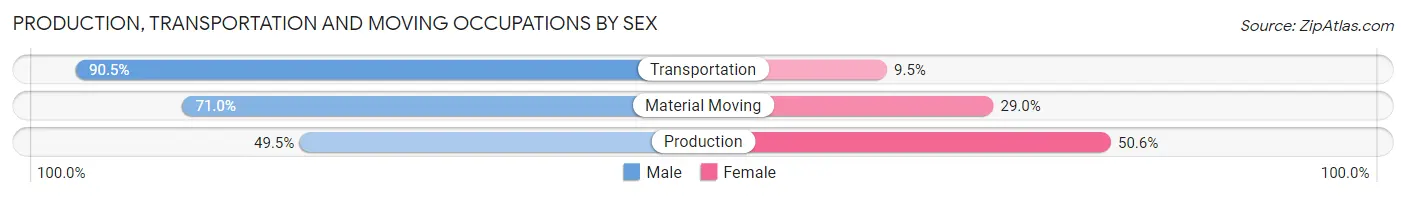
| Occupation | Male | Female |
| Production | 1,298 (49.4%) | 1,327 (50.5%) |
| Transportation | 928 (90.5%) | 97 (9.5%) |
| Material Moving | 1,269 (71.0%) | 518 (29.0%) |
| Total (Category) | 3,495 (64.3%) | 1,942 (35.7%) |
| Total (Overall) | 11,642 (48.5%) | 12,361 (51.5%) |
Employment Industries by Sex in Rocky Mount
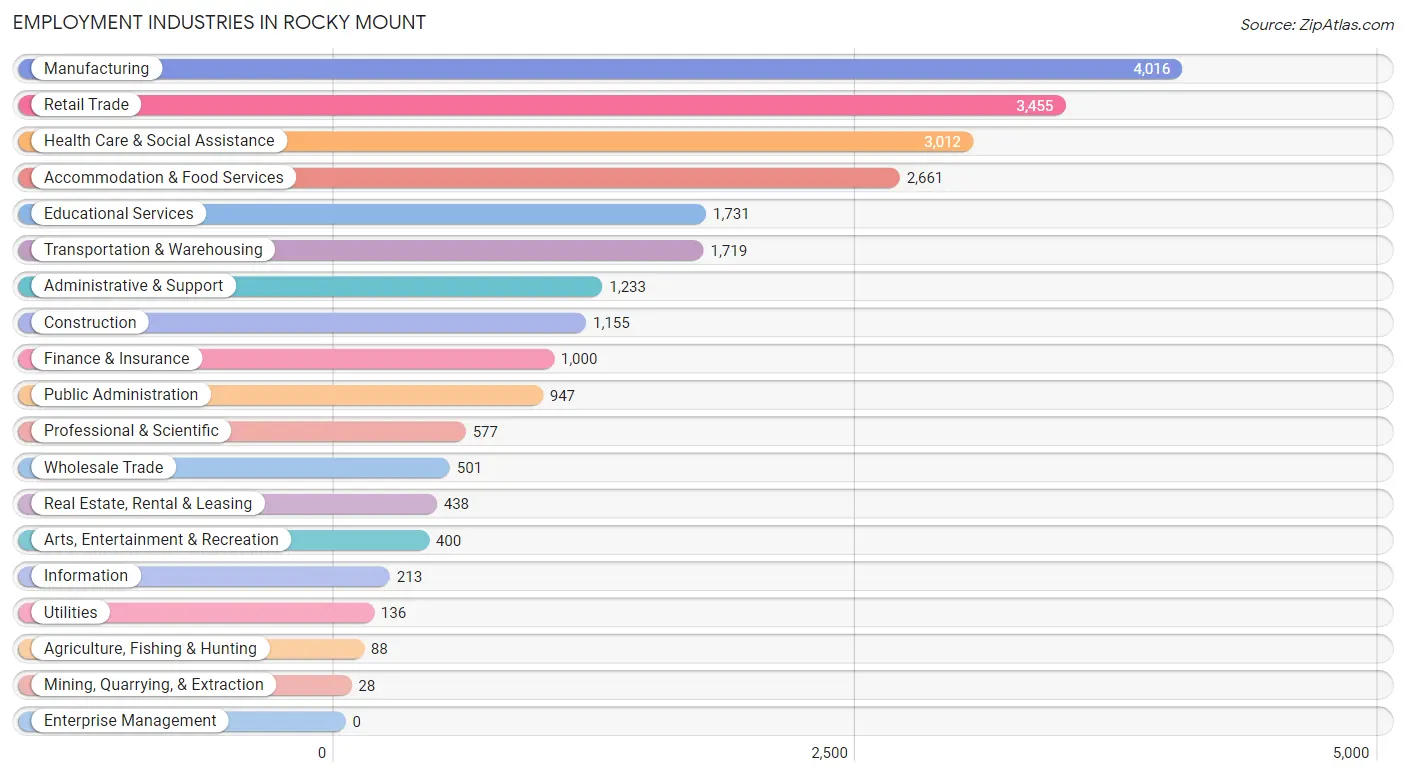
Employment Industries in Rocky Mount
The major employment industries in Rocky Mount include Manufacturing (4,016 | 16.7%), Retail Trade (3,455 | 14.4%), Health Care & Social Assistance (3,012 | 12.6%), Accommodation & Food Services (2,661 | 11.1%), and Educational Services (1,731 | 7.2%).
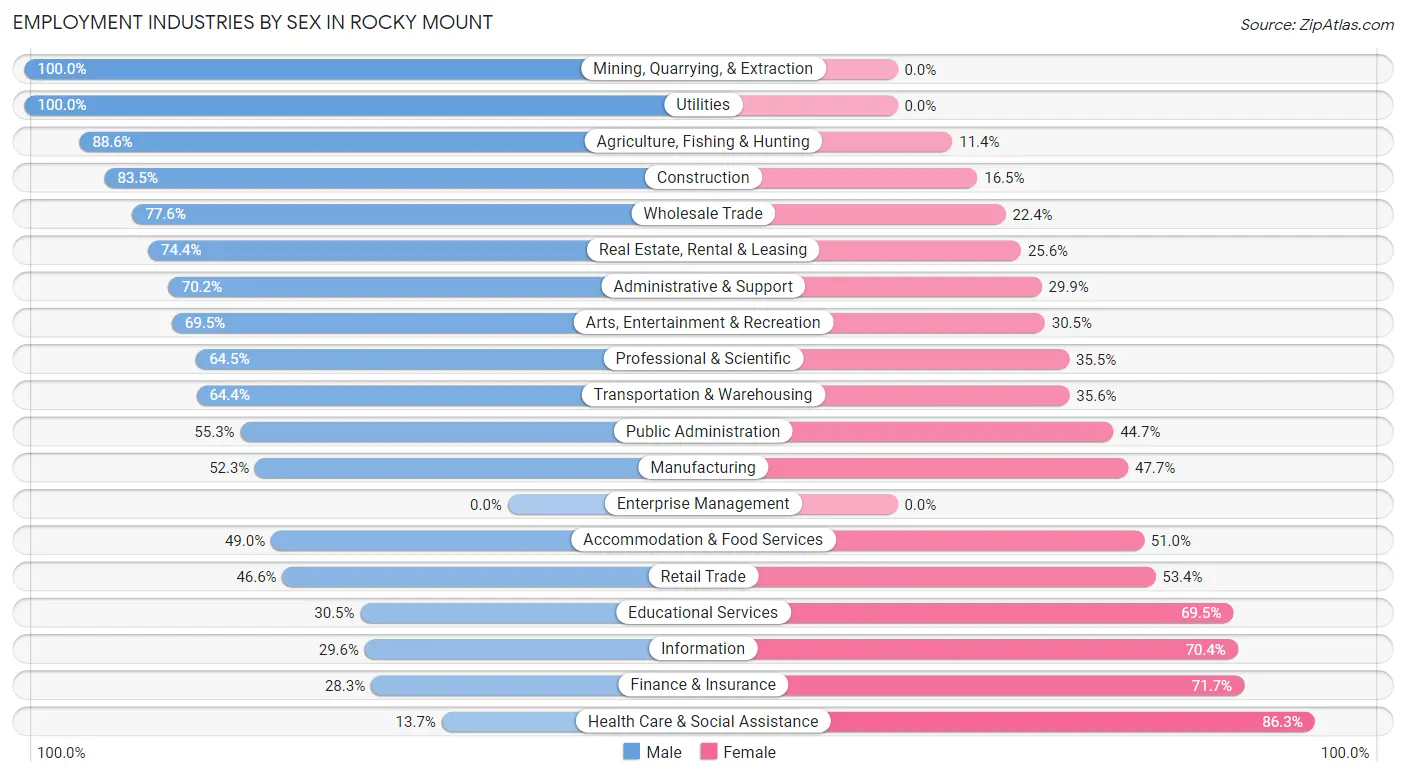
Employment Industries by Sex in Rocky Mount
The Rocky Mount industries that see more men than women are Mining, Quarrying, & Extraction (100.0%), Utilities (100.0%), and Agriculture, Fishing & Hunting (88.6%), whereas the industries that tend to have a higher number of women are Health Care & Social Assistance (86.3%), Finance & Insurance (71.7%), and Information (70.4%).
| Industry | Male | Female |
| Agriculture, Fishing & Hunting | 78 (88.6%) | 10 (11.4%) |
| Mining, Quarrying, & Extraction | 28 (100.0%) | 0 (0.0%) |
| Construction | 964 (83.5%) | 191 (16.5%) |
| Manufacturing | 2,099 (52.3%) | 1,917 (47.7%) |
| Wholesale Trade | 389 (77.6%) | 112 (22.4%) |
| Retail Trade | 1,611 (46.6%) | 1,844 (53.4%) |
| Transportation & Warehousing | 1,107 (64.4%) | 612 (35.6%) |
| Utilities | 136 (100.0%) | 0 (0.0%) |
| Information | 63 (29.6%) | 150 (70.4%) |
| Finance & Insurance | 283 (28.3%) | 717 (71.7%) |
| Real Estate, Rental & Leasing | 326 (74.4%) | 112 (25.6%) |
| Professional & Scientific | 372 (64.5%) | 205 (35.5%) |
| Enterprise Management | 0 (0.0%) | 0 (0.0%) |
| Administrative & Support | 865 (70.2%) | 368 (29.8%) |
| Educational Services | 528 (30.5%) | 1,203 (69.5%) |
| Health Care & Social Assistance | 412 (13.7%) | 2,600 (86.3%) |
| Arts, Entertainment & Recreation | 278 (69.5%) | 122 (30.5%) |
| Accommodation & Food Services | 1,304 (49.0%) | 1,357 (51.0%) |
| Public Administration | 524 (55.3%) | 423 (44.7%) |
| Total | 11,642 (48.5%) | 12,361 (51.5%) |
Education in Rocky Mount
School Enrollment in Rocky Mount
The most common levels of schooling among the 12,487 students in Rocky Mount are elementary school (2,729 | 21.8%), college / undergraduate (2,692 | 21.6%), and middle school (2,523 | 20.2%).
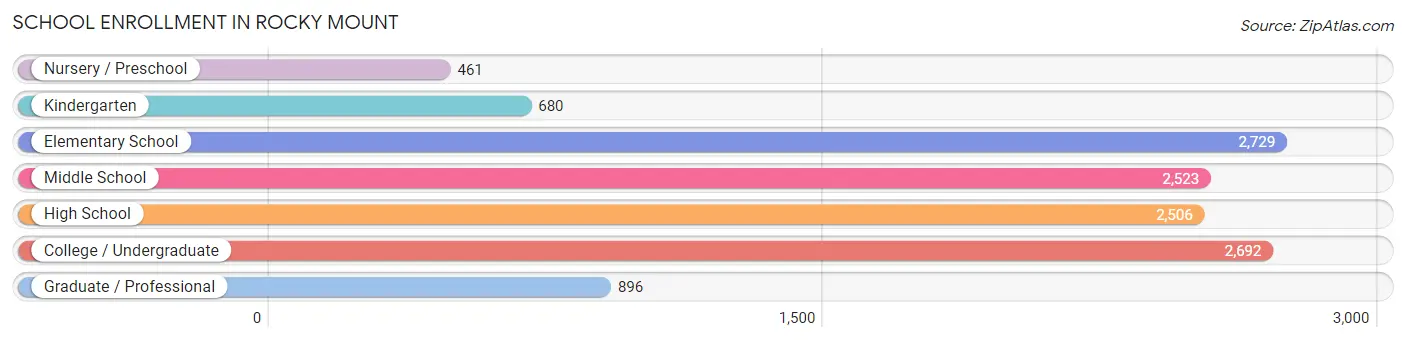
| School Level | # Students | % Students |
| Nursery / Preschool | 461 | 3.7% |
| Kindergarten | 680 | 5.4% |
| Elementary School | 2,729 | 21.8% |
| Middle School | 2,523 | 20.2% |
| High School | 2,506 | 20.1% |
| College / Undergraduate | 2,692 | 21.6% |
| Graduate / Professional | 896 | 7.2% |
| Total | 12,487 | 100.0% |
School Enrollment by Age by Funding Source in Rocky Mount
Out of a total of 12,487 students who are enrolled in schools in Rocky Mount, 1,935 (15.5%) attend a private institution, while the remaining 10,552 (84.5%) are enrolled in public schools. The age group of 20 to 24 year olds has the highest likelihood of being enrolled in private schools, with 355 (31.6% in the age bracket) enrolled. Conversely, the age group of 15 to 17 year olds has the lowest likelihood of being enrolled in a private school, with 1,516 (95.2% in the age bracket) attending a public institution.
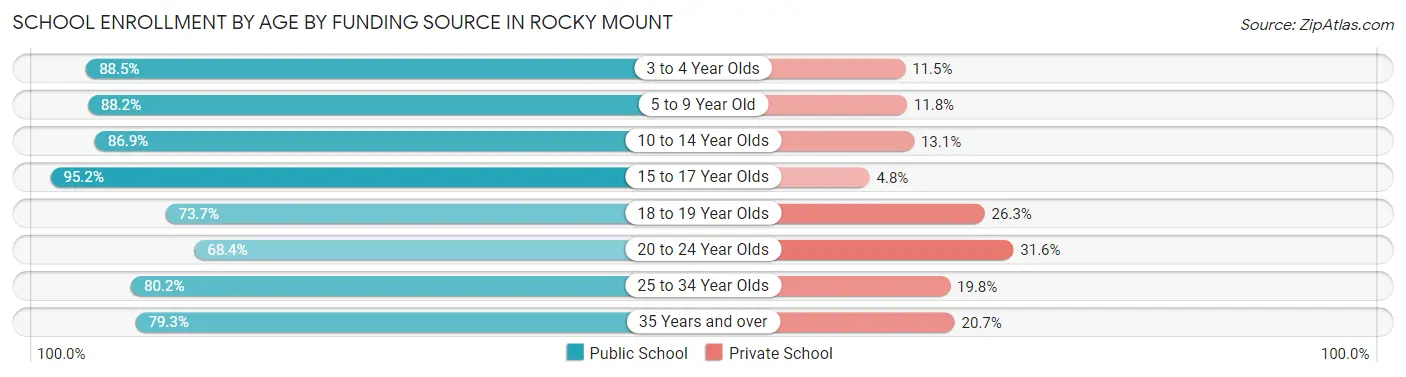
| Age Bracket | Public School | Private School |
| 3 to 4 Year Olds | 324 (88.5%) | 42 (11.5%) |
| 5 to 9 Year Old | 2,591 (88.2%) | 346 (11.8%) |
| 10 to 14 Year Olds | 3,132 (86.9%) | 472 (13.1%) |
| 15 to 17 Year Olds | 1,516 (95.2%) | 77 (4.8%) |
| 18 to 19 Year Olds | 685 (73.7%) | 244 (26.3%) |
| 20 to 24 Year Olds | 768 (68.4%) | 355 (31.6%) |
| 25 to 34 Year Olds | 554 (80.2%) | 137 (19.8%) |
| 35 Years and over | 987 (79.3%) | 257 (20.7%) |
| Total | 10,552 (84.5%) | 1,935 (15.5%) |
Educational Attainment by Field of Study in Rocky Mount
Education (1,825 | 20.8%), business (1,717 | 19.6%), science & technology (819 | 9.3%), social sciences (796 | 9.1%), and arts & humanities (739 | 8.4%) are the most common fields of study among 8,767 individuals in Rocky Mount who have obtained a bachelor's degree or higher.
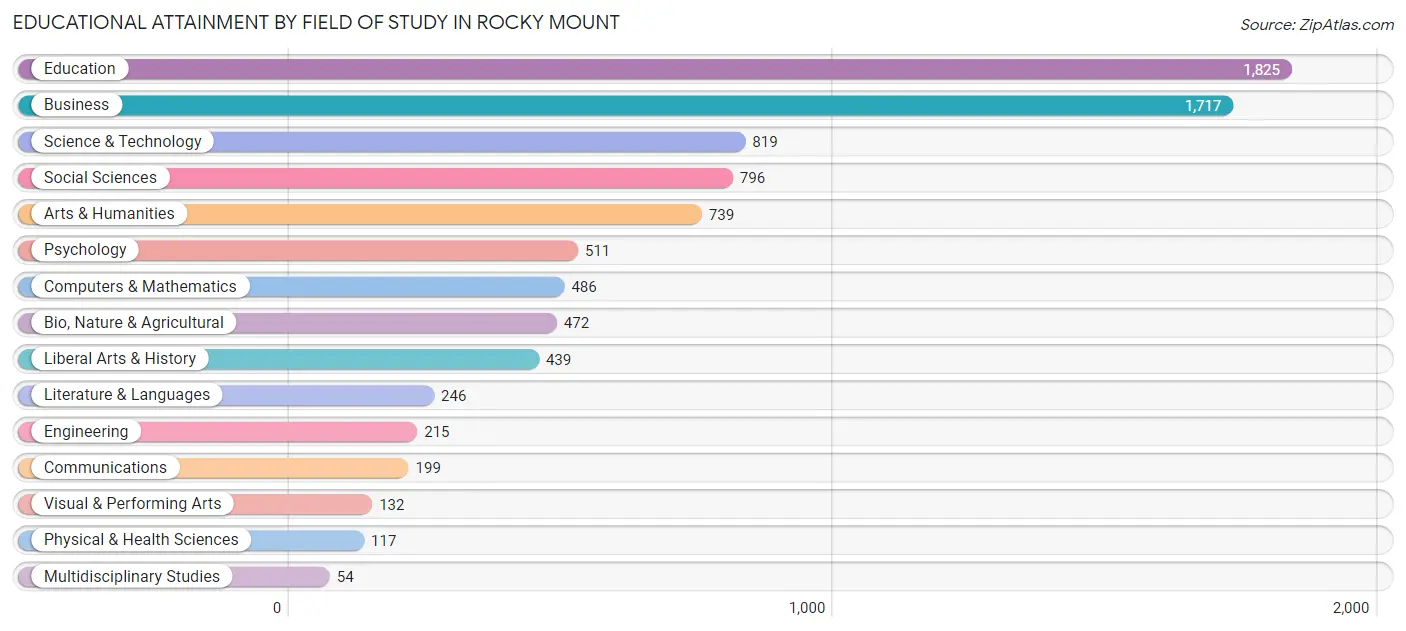
| Field of Study | # Graduates | % Graduates |
| Computers & Mathematics | 486 | 5.5% |
| Bio, Nature & Agricultural | 472 | 5.4% |
| Physical & Health Sciences | 117 | 1.3% |
| Psychology | 511 | 5.8% |
| Social Sciences | 796 | 9.1% |
| Engineering | 215 | 2.5% |
| Multidisciplinary Studies | 54 | 0.6% |
| Science & Technology | 819 | 9.3% |
| Business | 1,717 | 19.6% |
| Education | 1,825 | 20.8% |
| Literature & Languages | 246 | 2.8% |
| Liberal Arts & History | 439 | 5.0% |
| Visual & Performing Arts | 132 | 1.5% |
| Communications | 199 | 2.3% |
| Arts & Humanities | 739 | 8.4% |
| Total | 8,767 | 100.0% |
Transportation & Commute in Rocky Mount
Vehicle Availability by Sex in Rocky Mount
The most prevalent vehicle ownership categories in Rocky Mount are males with 2 vehicles (4,554, accounting for 40.2%) and females with 2 vehicles (4,132, making up 38.1%).
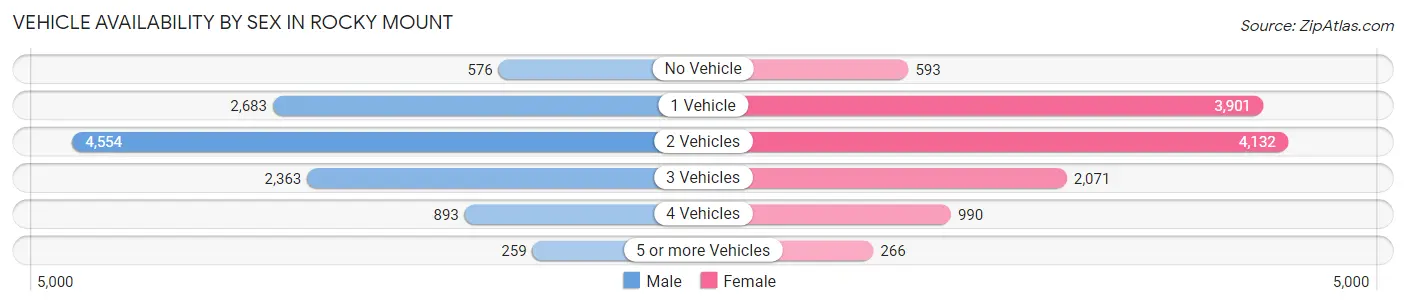
| Vehicles Available | Male | Female |
| No Vehicle | 576 (5.1%) | 593 (5.0%) |
| 1 Vehicle | 2,683 (23.7%) | 3,901 (32.6%) |
| 2 Vehicles | 4,554 (40.2%) | 4,132 (34.6%) |
| 3 Vehicles | 2,363 (20.9%) | 2,071 (17.3%) |
| 4 Vehicles | 893 (7.9%) | 990 (8.3%) |
| 5 or more Vehicles | 259 (2.3%) | 266 (2.2%) |
| Total | 11,328 (100.0%) | 11,953 (100.0%) |
Commute Time in Rocky Mount
The most frequently occuring commute durations in Rocky Mount are 10 to 14 minutes (5,503 commuters, 24.9%), 15 to 19 minutes (3,980 commuters, 18.0%), and 5 to 9 minutes (3,430 commuters, 15.5%).
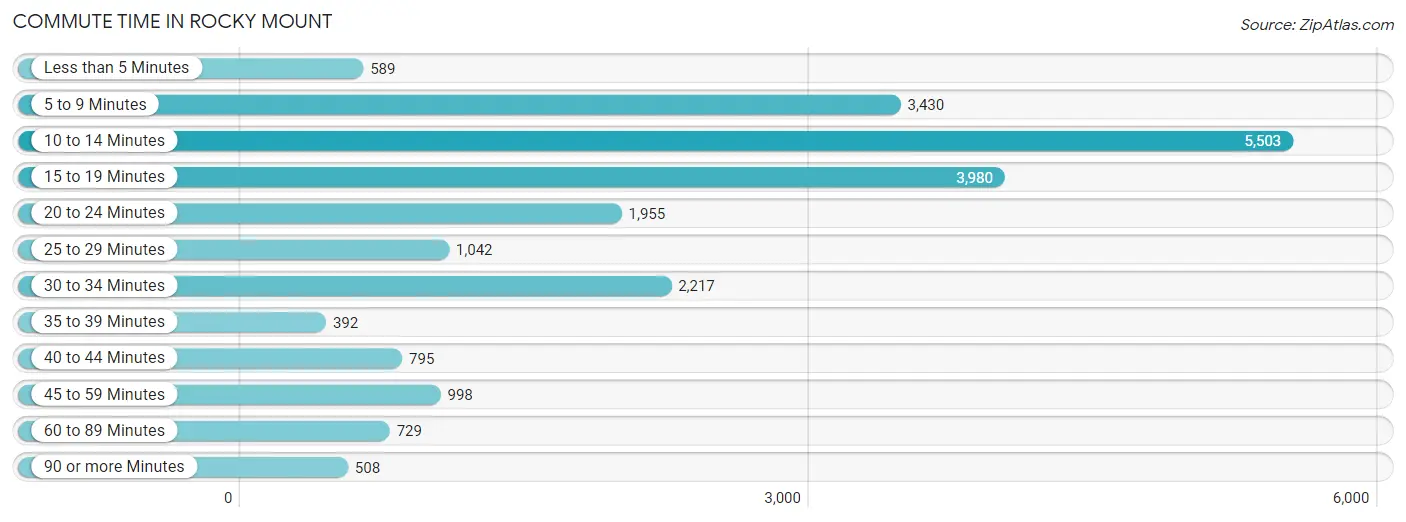
| Commute Time | # Commuters | % Commuters |
| Less than 5 Minutes | 589 | 2.7% |
| 5 to 9 Minutes | 3,430 | 15.5% |
| 10 to 14 Minutes | 5,503 | 24.9% |
| 15 to 19 Minutes | 3,980 | 18.0% |
| 20 to 24 Minutes | 1,955 | 8.8% |
| 25 to 29 Minutes | 1,042 | 4.7% |
| 30 to 34 Minutes | 2,217 | 10.0% |
| 35 to 39 Minutes | 392 | 1.8% |
| 40 to 44 Minutes | 795 | 3.6% |
| 45 to 59 Minutes | 998 | 4.5% |
| 60 to 89 Minutes | 729 | 3.3% |
| 90 or more Minutes | 508 | 2.3% |
Commute Time by Sex in Rocky Mount
The most common commute times in Rocky Mount are 10 to 14 minutes (3,138 commuters, 29.0%) for males and 15 to 19 minutes (2,446 commuters, 21.6%) for females.
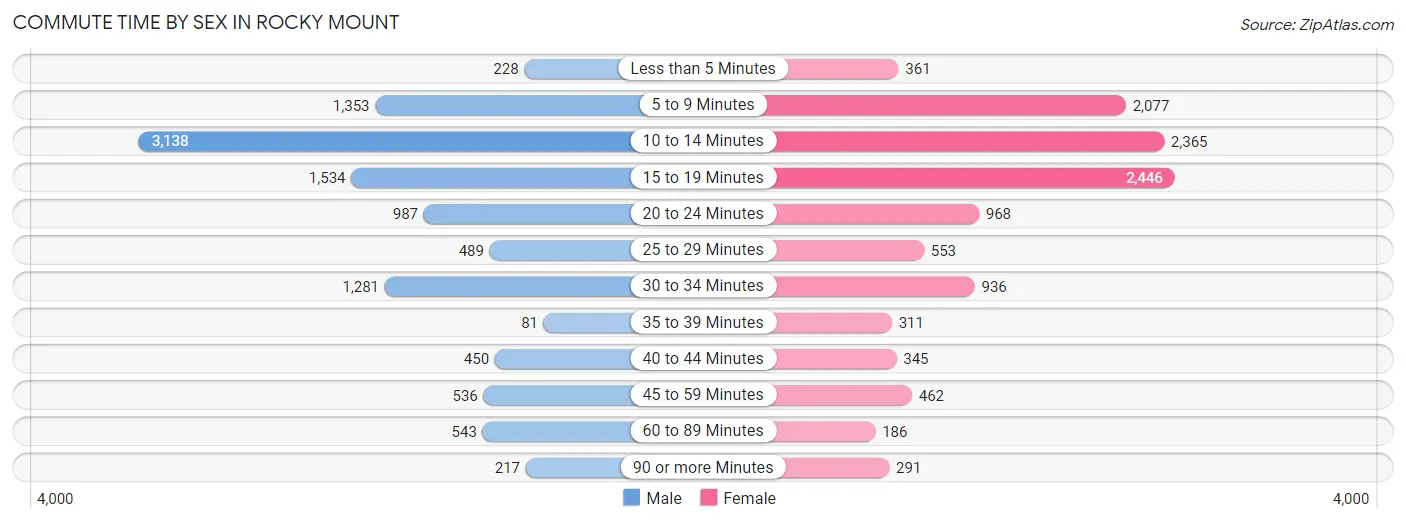
| Commute Time | Male | Female |
| Less than 5 Minutes | 228 (2.1%) | 361 (3.2%) |
| 5 to 9 Minutes | 1,353 (12.5%) | 2,077 (18.4%) |
| 10 to 14 Minutes | 3,138 (29.0%) | 2,365 (20.9%) |
| 15 to 19 Minutes | 1,534 (14.2%) | 2,446 (21.6%) |
| 20 to 24 Minutes | 987 (9.1%) | 968 (8.6%) |
| 25 to 29 Minutes | 489 (4.5%) | 553 (4.9%) |
| 30 to 34 Minutes | 1,281 (11.8%) | 936 (8.3%) |
| 35 to 39 Minutes | 81 (0.7%) | 311 (2.8%) |
| 40 to 44 Minutes | 450 (4.2%) | 345 (3.0%) |
| 45 to 59 Minutes | 536 (5.0%) | 462 (4.1%) |
| 60 to 89 Minutes | 543 (5.0%) | 186 (1.7%) |
| 90 or more Minutes | 217 (2.0%) | 291 (2.6%) |
Time of Departure to Work by Sex in Rocky Mount
The most frequent times of departure to work in Rocky Mount are 12:00 PM to 3:59 PM (1,496, 13.8%) for males and 7:00 AM to 7:29 AM (1,900, 16.8%) for females.
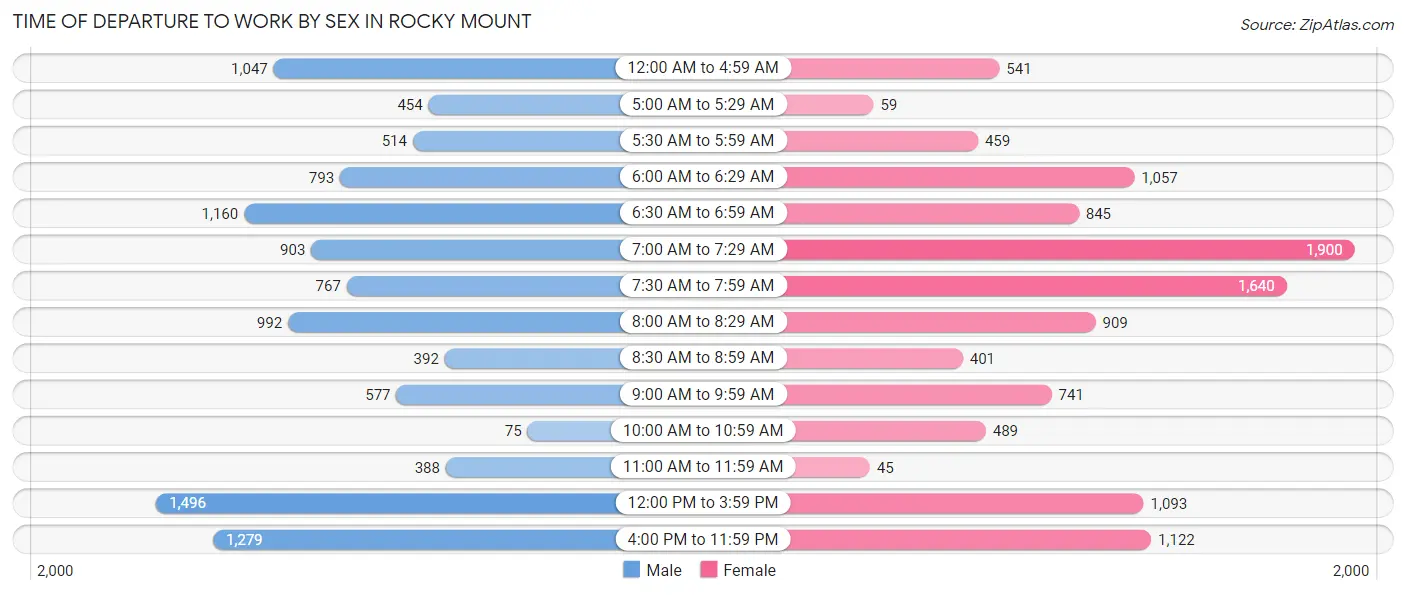
| Time of Departure | Male | Female |
| 12:00 AM to 4:59 AM | 1,047 (9.7%) | 541 (4.8%) |
| 5:00 AM to 5:29 AM | 454 (4.2%) | 59 (0.5%) |
| 5:30 AM to 5:59 AM | 514 (4.7%) | 459 (4.1%) |
| 6:00 AM to 6:29 AM | 793 (7.3%) | 1,057 (9.3%) |
| 6:30 AM to 6:59 AM | 1,160 (10.7%) | 845 (7.5%) |
| 7:00 AM to 7:29 AM | 903 (8.3%) | 1,900 (16.8%) |
| 7:30 AM to 7:59 AM | 767 (7.1%) | 1,640 (14.5%) |
| 8:00 AM to 8:29 AM | 992 (9.1%) | 909 (8.0%) |
| 8:30 AM to 8:59 AM | 392 (3.6%) | 401 (3.5%) |
| 9:00 AM to 9:59 AM | 577 (5.3%) | 741 (6.6%) |
| 10:00 AM to 10:59 AM | 75 (0.7%) | 489 (4.3%) |
| 11:00 AM to 11:59 AM | 388 (3.6%) | 45 (0.4%) |
| 12:00 PM to 3:59 PM | 1,496 (13.8%) | 1,093 (9.7%) |
| 4:00 PM to 11:59 PM | 1,279 (11.8%) | 1,122 (9.9%) |
| Total | 10,837 (100.0%) | 11,301 (100.0%) |
Housing Occupancy in Rocky Mount
Occupancy by Ownership in Rocky Mount
Of the total 22,666 dwellings in Rocky Mount, owner-occupied units account for 11,315 (49.9%), while renter-occupied units make up 11,351 (50.1%).
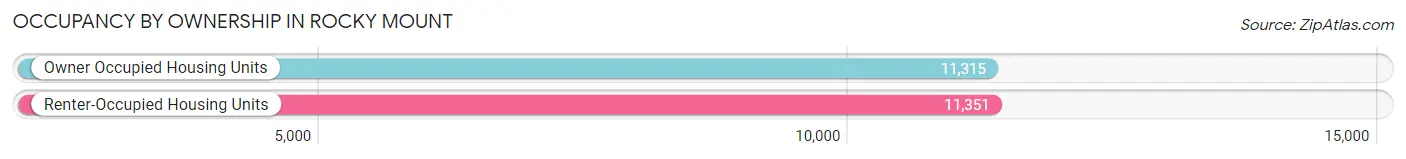
| Occupancy | # Housing Units | % Housing Units |
| Owner Occupied Housing Units | 11,315 | 49.9% |
| Renter-Occupied Housing Units | 11,351 | 50.1% |
| Total Occupied Housing Units | 22,666 | 100.0% |
Occupancy by Household Size in Rocky Mount
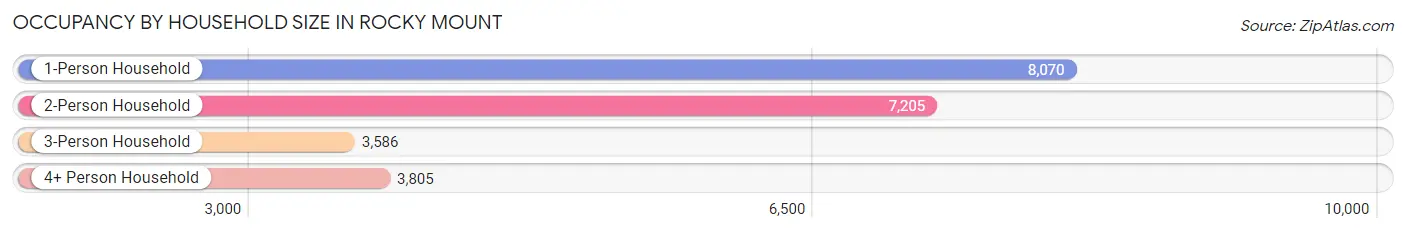
| Household Size | # Housing Units | % Housing Units |
| 1-Person Household | 8,070 | 35.6% |
| 2-Person Household | 7,205 | 31.8% |
| 3-Person Household | 3,586 | 15.8% |
| 4+ Person Household | 3,805 | 16.8% |
| Total Housing Units | 22,666 | 100.0% |
Occupancy by Ownership by Household Size in Rocky Mount
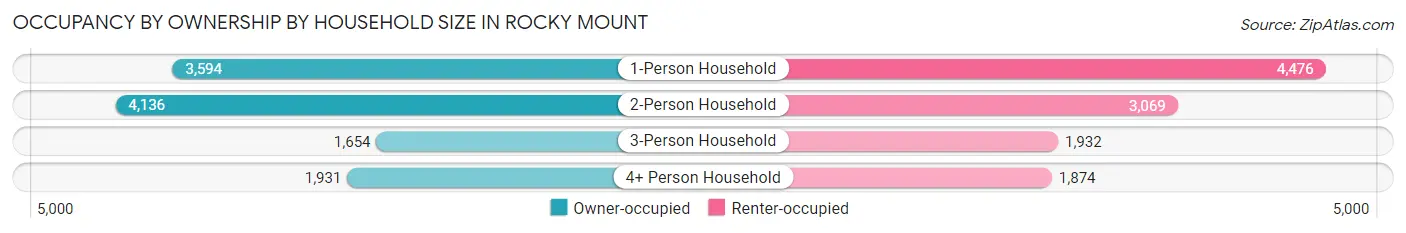
| Household Size | Owner-occupied | Renter-occupied |
| 1-Person Household | 3,594 (44.5%) | 4,476 (55.5%) |
| 2-Person Household | 4,136 (57.4%) | 3,069 (42.6%) |
| 3-Person Household | 1,654 (46.1%) | 1,932 (53.9%) |
| 4+ Person Household | 1,931 (50.7%) | 1,874 (49.2%) |
| Total Housing Units | 11,315 (49.9%) | 11,351 (50.1%) |
Occupancy by Educational Attainment in Rocky Mount
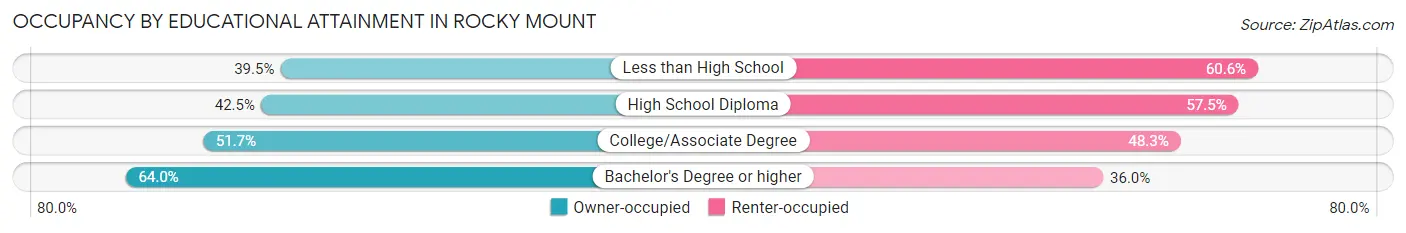
| Household Size | Owner-occupied | Renter-occupied |
| Less than High School | 1,150 (39.5%) | 1,765 (60.6%) |
| High School Diploma | 3,053 (42.5%) | 4,124 (57.5%) |
| College/Associate Degree | 3,942 (51.7%) | 3,679 (48.3%) |
| Bachelor's Degree or higher | 3,170 (64.0%) | 1,783 (36.0%) |
Occupancy by Age of Householder in Rocky Mount
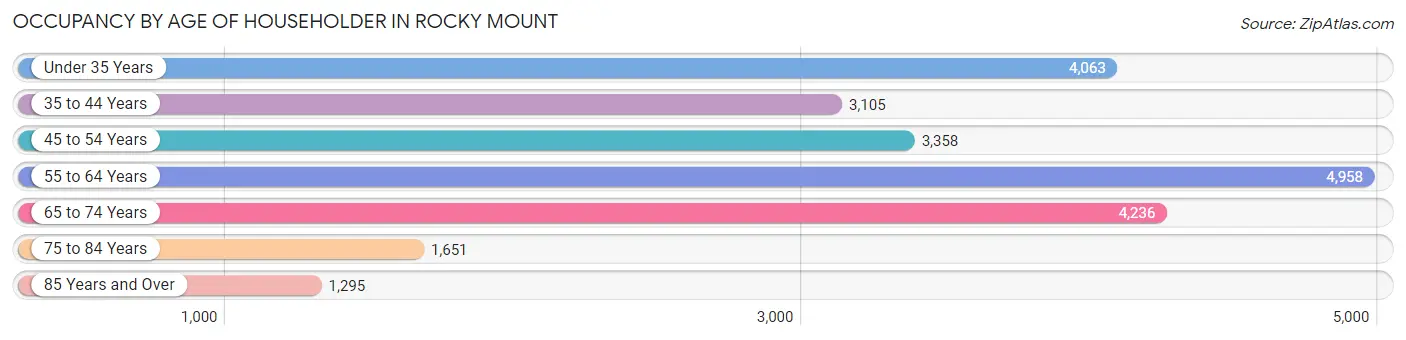
| Age Bracket | # Households | % Households |
| Under 35 Years | 4,063 | 17.9% |
| 35 to 44 Years | 3,105 | 13.7% |
| 45 to 54 Years | 3,358 | 14.8% |
| 55 to 64 Years | 4,958 | 21.9% |
| 65 to 74 Years | 4,236 | 18.7% |
| 75 to 84 Years | 1,651 | 7.3% |
| 85 Years and Over | 1,295 | 5.7% |
| Total | 22,666 | 100.0% |
Housing Finances in Rocky Mount
Median Income by Occupancy in Rocky Mount
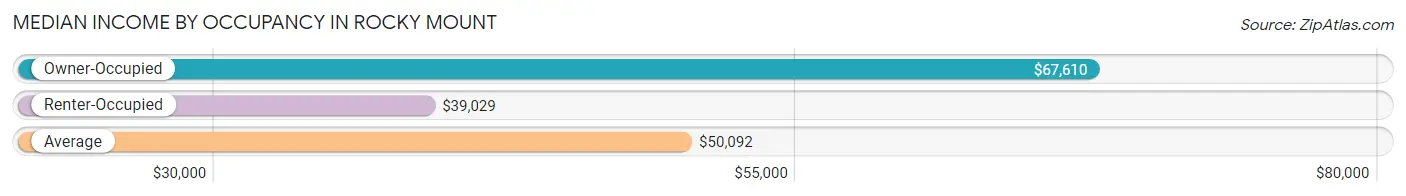
| Occupancy Type | # Households | Median Income |
| Owner-Occupied | 11,315 (49.9%) | $67,610 |
| Renter-Occupied | 11,351 (50.1%) | $39,029 |
| Average | 22,666 (100.0%) | $50,092 |
Occupancy by Householder Income Bracket in Rocky Mount
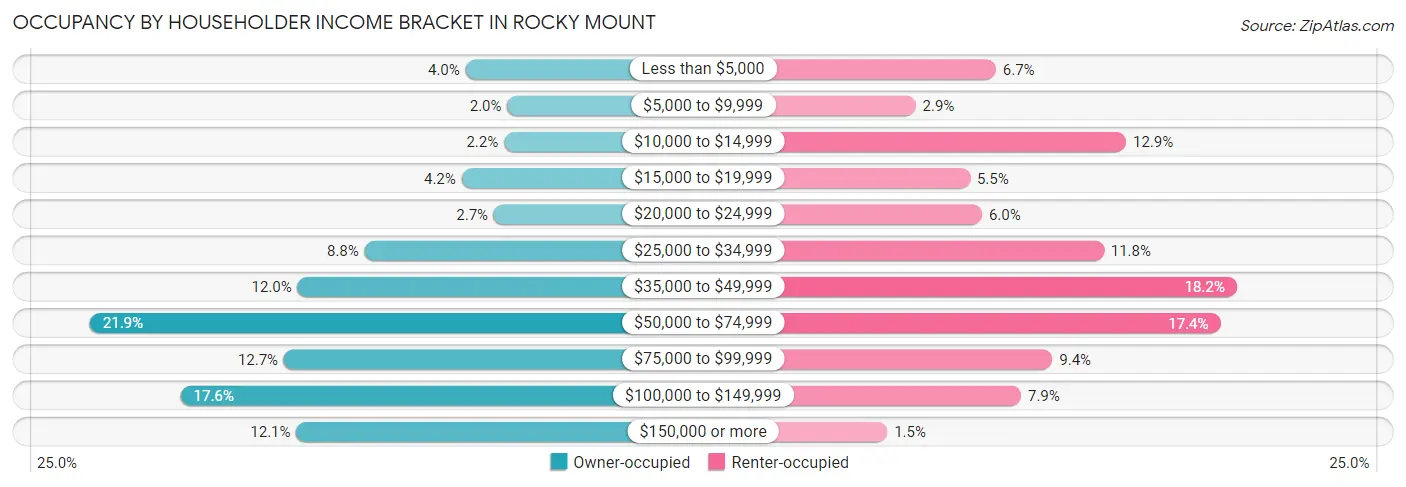
| Income Bracket | Owner-occupied | Renter-occupied |
| Less than $5,000 | 453 (4.0%) | 758 (6.7%) |
| $5,000 to $9,999 | 227 (2.0%) | 325 (2.9%) |
| $10,000 to $14,999 | 245 (2.2%) | 1,462 (12.9%) |
| $15,000 to $19,999 | 474 (4.2%) | 619 (5.4%) |
| $20,000 to $24,999 | 300 (2.6%) | 683 (6.0%) |
| $25,000 to $34,999 | 997 (8.8%) | 1,342 (11.8%) |
| $35,000 to $49,999 | 1,358 (12.0%) | 2,060 (18.1%) |
| $50,000 to $74,999 | 2,477 (21.9%) | 1,972 (17.4%) |
| $75,000 to $99,999 | 1,431 (12.7%) | 1,064 (9.4%) |
| $100,000 to $149,999 | 1,988 (17.6%) | 895 (7.9%) |
| $150,000 or more | 1,365 (12.1%) | 171 (1.5%) |
| Total | 11,315 (100.0%) | 11,351 (100.0%) |
Monthly Housing Cost Tiers in Rocky Mount
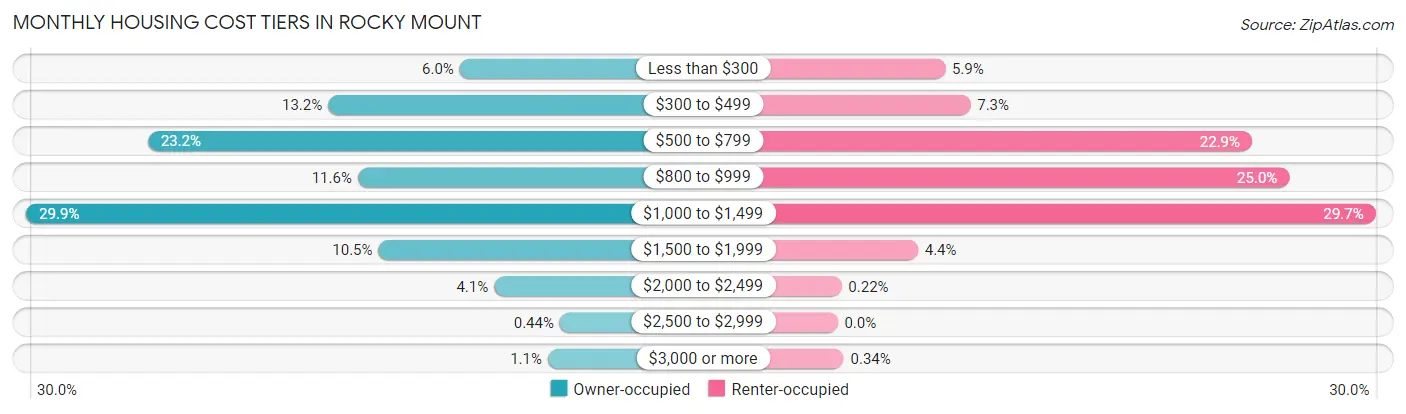
| Monthly Cost | Owner-occupied | Renter-occupied |
| Less than $300 | 676 (6.0%) | 674 (5.9%) |
| $300 to $499 | 1,498 (13.2%) | 833 (7.3%) |
| $500 to $799 | 2,625 (23.2%) | 2,598 (22.9%) |
| $800 to $999 | 1,312 (11.6%) | 2,832 (24.9%) |
| $1,000 to $1,499 | 3,385 (29.9%) | 3,374 (29.7%) |
| $1,500 to $1,999 | 1,184 (10.5%) | 504 (4.4%) |
| $2,000 to $2,499 | 461 (4.1%) | 25 (0.2%) |
| $2,500 to $2,999 | 50 (0.4%) | 0 (0.0%) |
| $3,000 or more | 124 (1.1%) | 39 (0.3%) |
| Total | 11,315 (100.0%) | 11,351 (100.0%) |
Physical Housing Characteristics in Rocky Mount
Housing Structures in Rocky Mount
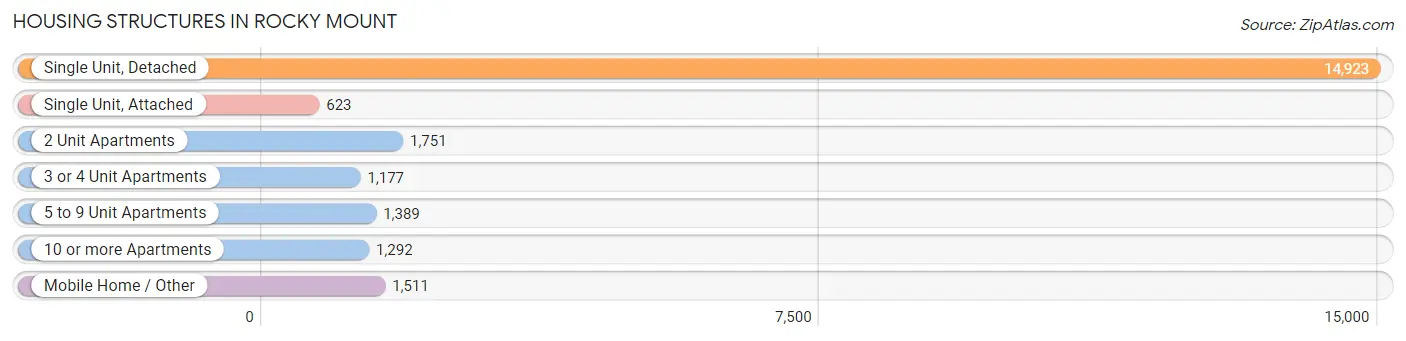
| Structure Type | # Housing Units | % Housing Units |
| Single Unit, Detached | 14,923 | 65.8% |
| Single Unit, Attached | 623 | 2.8% |
| 2 Unit Apartments | 1,751 | 7.7% |
| 3 or 4 Unit Apartments | 1,177 | 5.2% |
| 5 to 9 Unit Apartments | 1,389 | 6.1% |
| 10 or more Apartments | 1,292 | 5.7% |
| Mobile Home / Other | 1,511 | 6.7% |
| Total | 22,666 | 100.0% |
Housing Structures by Occupancy in Rocky Mount
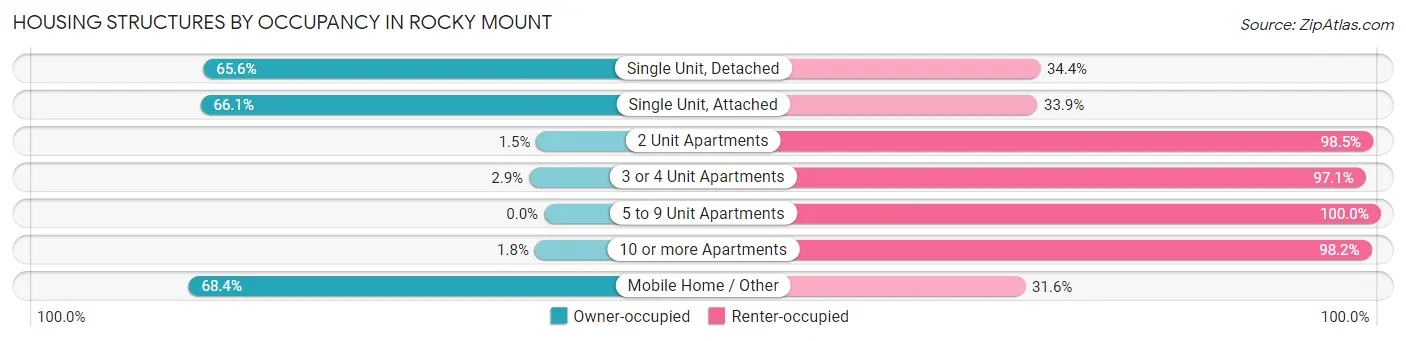
| Structure Type | Owner-occupied | Renter-occupied |
| Single Unit, Detached | 9,786 (65.6%) | 5,137 (34.4%) |
| Single Unit, Attached | 412 (66.1%) | 211 (33.9%) |
| 2 Unit Apartments | 26 (1.5%) | 1,725 (98.5%) |
| 3 or 4 Unit Apartments | 34 (2.9%) | 1,143 (97.1%) |
| 5 to 9 Unit Apartments | 0 (0.0%) | 1,389 (100.0%) |
| 10 or more Apartments | 23 (1.8%) | 1,269 (98.2%) |
| Mobile Home / Other | 1,034 (68.4%) | 477 (31.6%) |
| Total | 11,315 (49.9%) | 11,351 (50.1%) |
Housing Structures by Number of Rooms in Rocky Mount
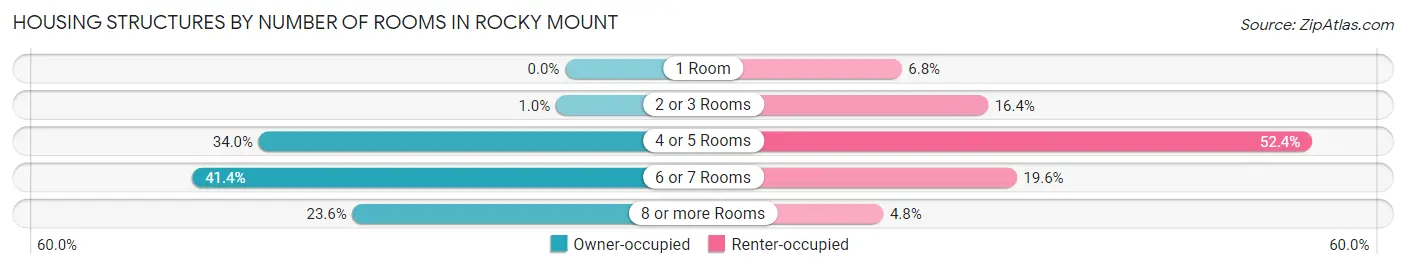
| Number of Rooms | Owner-occupied | Renter-occupied |
| 1 Room | 0 (0.0%) | 774 (6.8%) |
| 2 or 3 Rooms | 115 (1.0%) | 1,862 (16.4%) |
| 4 or 5 Rooms | 3,847 (34.0%) | 5,948 (52.4%) |
| 6 or 7 Rooms | 4,683 (41.4%) | 2,224 (19.6%) |
| 8 or more Rooms | 2,670 (23.6%) | 543 (4.8%) |
| Total | 11,315 (100.0%) | 11,351 (100.0%) |
Housing Structure by Heating Type in Rocky Mount
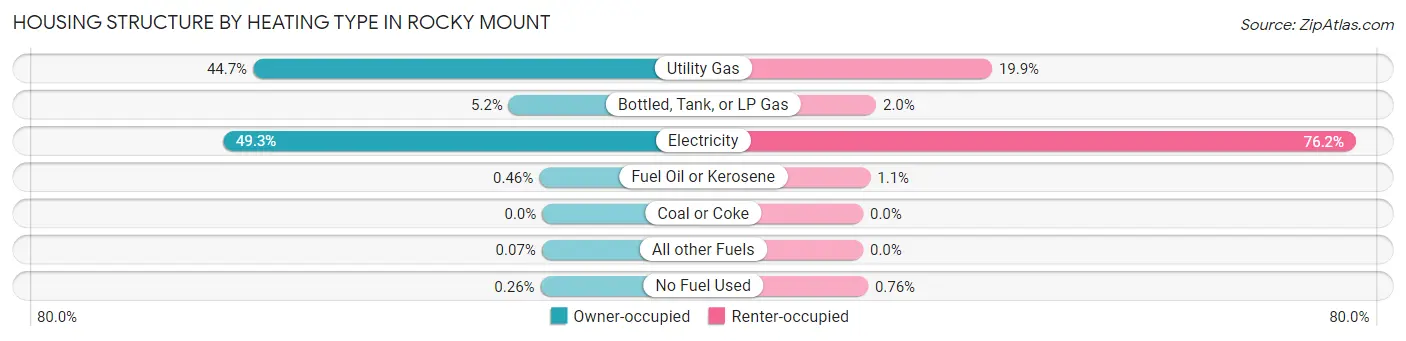
| Heating Type | Owner-occupied | Renter-occupied |
| Utility Gas | 5,058 (44.7%) | 2,262 (19.9%) |
| Bottled, Tank, or LP Gas | 585 (5.2%) | 228 (2.0%) |
| Electricity | 5,583 (49.3%) | 8,647 (76.2%) |
| Fuel Oil or Kerosene | 52 (0.5%) | 128 (1.1%) |
| Coal or Coke | 0 (0.0%) | 0 (0.0%) |
| All other Fuels | 8 (0.1%) | 0 (0.0%) |
| No Fuel Used | 29 (0.3%) | 86 (0.8%) |
| Total | 11,315 (100.0%) | 11,351 (100.0%) |
Household Vehicle Usage in Rocky Mount
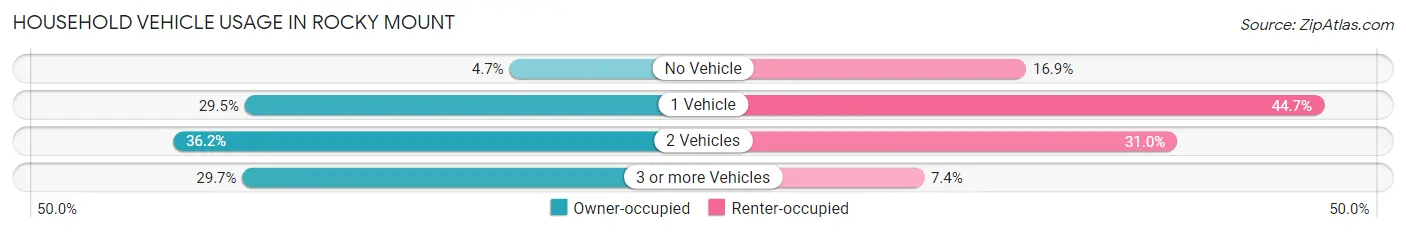
| Vehicles per Household | Owner-occupied | Renter-occupied |
| No Vehicle | 536 (4.7%) | 1,919 (16.9%) |
| 1 Vehicle | 3,332 (29.4%) | 5,074 (44.7%) |
| 2 Vehicles | 4,090 (36.1%) | 3,520 (31.0%) |
| 3 or more Vehicles | 3,357 (29.7%) | 838 (7.4%) |
| Total | 11,315 (100.0%) | 11,351 (100.0%) |
Real Estate & Mortgages in Rocky Mount
Real Estate and Mortgage Overview in Rocky Mount
| Characteristic | Without Mortgage | With Mortgage |
| Housing Units | 4,956 | 6,359 |
| Median Property Value | $121,100 | $145,700 |
| Median Household Income | $57,891 | $982 |
| Monthly Housing Costs | $554 | $124 |
| Real Estate Taxes | $1,319 | $114 |
Property Value by Mortgage Status in Rocky Mount
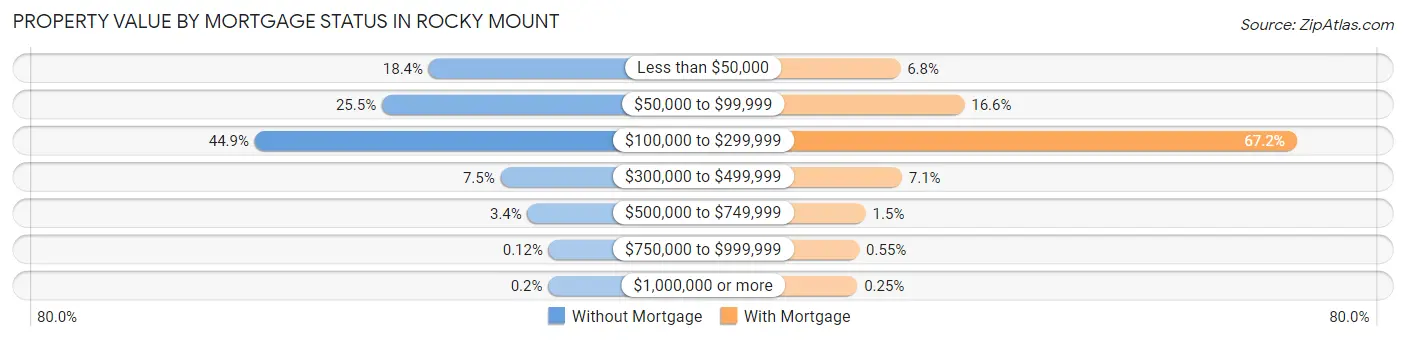
| Property Value | Without Mortgage | With Mortgage |
| Less than $50,000 | 912 (18.4%) | 433 (6.8%) |
| $50,000 to $99,999 | 1,266 (25.5%) | 1,054 (16.6%) |
| $100,000 to $299,999 | 2,226 (44.9%) | 4,274 (67.2%) |
| $300,000 to $499,999 | 370 (7.5%) | 449 (7.1%) |
| $500,000 to $749,999 | 166 (3.4%) | 98 (1.5%) |
| $750,000 to $999,999 | 6 (0.1%) | 35 (0.5%) |
| $1,000,000 or more | 10 (0.2%) | 16 (0.3%) |
| Total | 4,956 (100.0%) | 6,359 (100.0%) |
Household Income by Mortgage Status in Rocky Mount
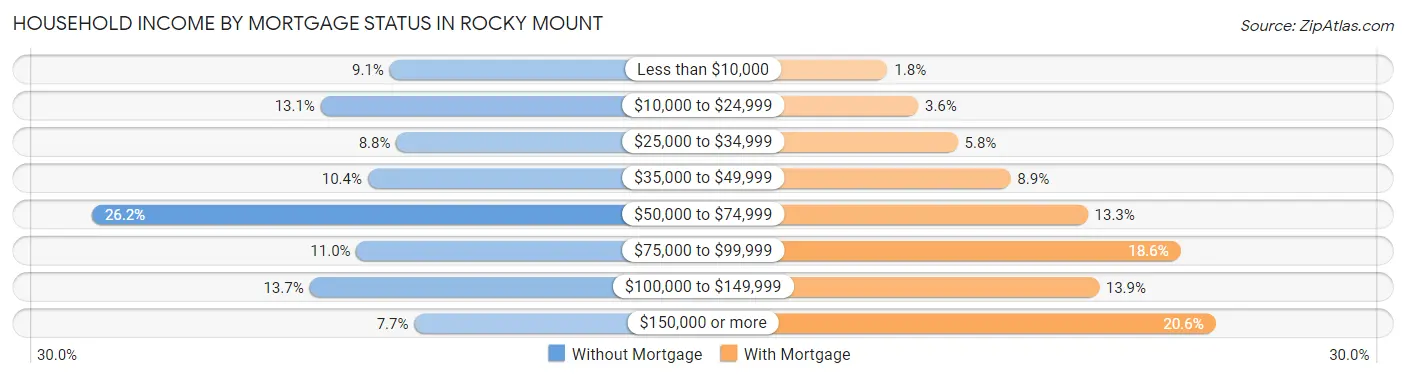
| Household Income | Without Mortgage | With Mortgage |
| Less than $10,000 | 453 (9.1%) | 116 (1.8%) |
| $10,000 to $24,999 | 648 (13.1%) | 227 (3.6%) |
| $25,000 to $34,999 | 434 (8.8%) | 371 (5.8%) |
| $35,000 to $49,999 | 515 (10.4%) | 563 (8.8%) |
| $50,000 to $74,999 | 1,296 (26.2%) | 843 (13.3%) |
| $75,000 to $99,999 | 547 (11.0%) | 1,181 (18.6%) |
| $100,000 to $149,999 | 680 (13.7%) | 884 (13.9%) |
| $150,000 or more | 383 (7.7%) | 1,308 (20.6%) |
| Total | 4,956 (100.0%) | 6,359 (100.0%) |
Property Value to Household Income Ratio in Rocky Mount
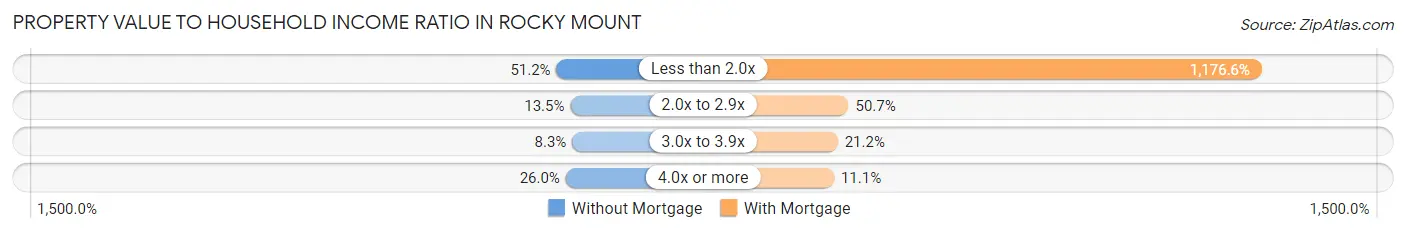
| Value-to-Income Ratio | Without Mortgage | With Mortgage |
| Less than 2.0x | 2,536 (51.2%) | 74,817 (1,176.5%) |
| 2.0x to 2.9x | 667 (13.5%) | 3,223 (50.7%) |
| 3.0x to 3.9x | 411 (8.3%) | 1,350 (21.2%) |
| 4.0x or more | 1,288 (26.0%) | 703 (11.1%) |
| Total | 4,956 (100.0%) | 6,359 (100.0%) |
Real Estate Taxes by Mortgage Status in Rocky Mount
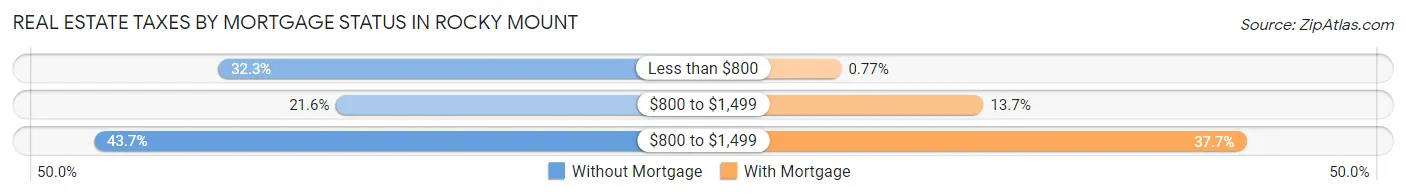
| Property Taxes | Without Mortgage | With Mortgage |
| Less than $800 | 1,603 (32.3%) | 49 (0.8%) |
| $800 to $1,499 | 1,072 (21.6%) | 874 (13.7%) |
| $800 to $1,499 | 2,164 (43.7%) | 2,399 (37.7%) |
| Total | 4,956 (100.0%) | 6,359 (100.0%) |
Health & Disability in Rocky Mount
Health Insurance Coverage by Age in Rocky Mount
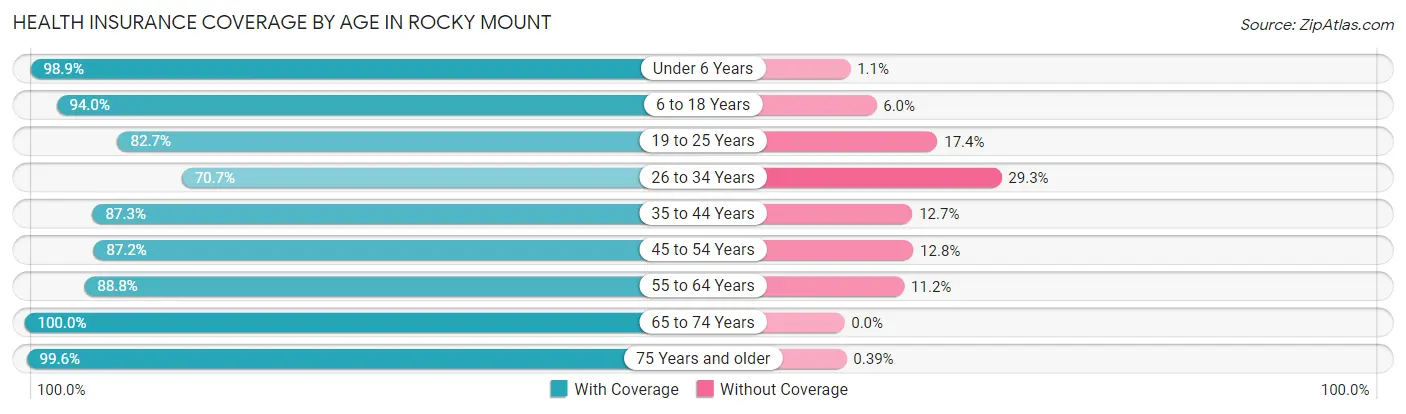
| Age Bracket | With Coverage | Without Coverage |
| Under 6 Years | 3,226 (98.9%) | 36 (1.1%) |
| 6 to 18 Years | 8,831 (94.0%) | 560 (6.0%) |
| 19 to 25 Years | 4,035 (82.7%) | 847 (17.3%) |
| 26 to 34 Years | 4,358 (70.7%) | 1,806 (29.3%) |
| 35 to 44 Years | 5,363 (87.3%) | 778 (12.7%) |
| 45 to 54 Years | 5,442 (87.2%) | 802 (12.8%) |
| 55 to 64 Years | 6,814 (88.8%) | 856 (11.2%) |
| 65 to 74 Years | 5,923 (100.0%) | 0 (0.0%) |
| 75 Years and older | 4,118 (99.6%) | 16 (0.4%) |
| Total | 48,110 (89.4%) | 5,701 (10.6%) |
Health Insurance Coverage by Citizenship Status in Rocky Mount
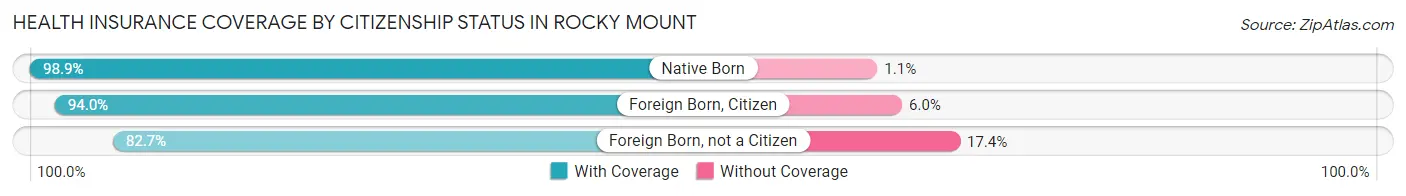
| Citizenship Status | With Coverage | Without Coverage |
| Native Born | 3,226 (98.9%) | 36 (1.1%) |
| Foreign Born, Citizen | 8,831 (94.0%) | 560 (6.0%) |
| Foreign Born, not a Citizen | 4,035 (82.7%) | 847 (17.3%) |
Health Insurance Coverage by Household Income in Rocky Mount
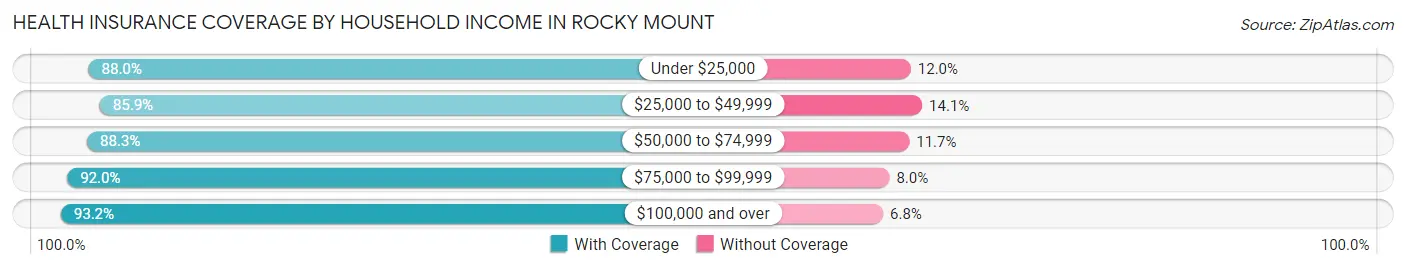
| Household Income | With Coverage | Without Coverage |
| Under $25,000 | 8,335 (88.0%) | 1,137 (12.0%) |
| $25,000 to $49,999 | 10,937 (85.9%) | 1,798 (14.1%) |
| $50,000 to $74,999 | 8,783 (88.3%) | 1,165 (11.7%) |
| $75,000 to $99,999 | 6,886 (92.0%) | 598 (8.0%) |
| $100,000 and over | 12,597 (93.2%) | 919 (6.8%) |
Public vs Private Health Insurance Coverage by Age in Rocky Mount
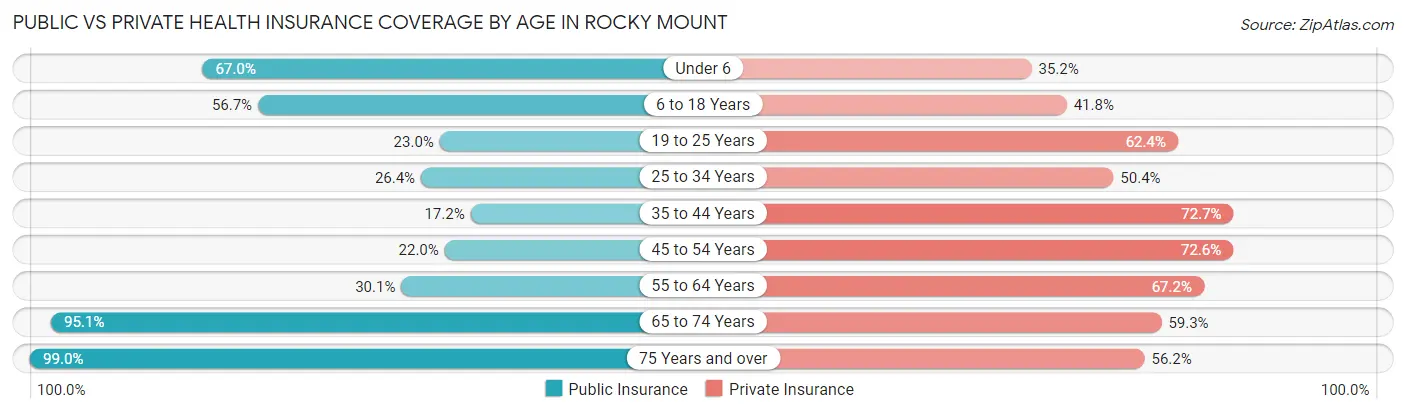
| Age Bracket | Public Insurance | Private Insurance |
| Under 6 | 2,185 (67.0%) | 1,149 (35.2%) |
| 6 to 18 Years | 5,324 (56.7%) | 3,921 (41.7%) |
| 19 to 25 Years | 1,121 (23.0%) | 3,044 (62.4%) |
| 25 to 34 Years | 1,629 (26.4%) | 3,107 (50.4%) |
| 35 to 44 Years | 1,059 (17.2%) | 4,463 (72.7%) |
| 45 to 54 Years | 1,376 (22.0%) | 4,534 (72.6%) |
| 55 to 64 Years | 2,308 (30.1%) | 5,153 (67.2%) |
| 65 to 74 Years | 5,632 (95.1%) | 3,514 (59.3%) |
| 75 Years and over | 4,091 (99.0%) | 2,323 (56.2%) |
| Total | 24,725 (46.0%) | 31,208 (58.0%) |
Disability Status by Sex by Age in Rocky Mount
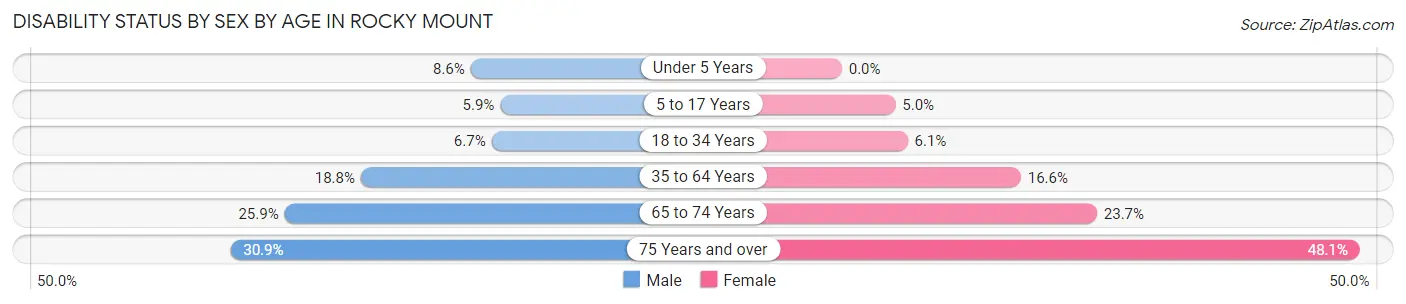
| Age Bracket | Male | Female |
| Under 5 Years | 121 (8.6%) | 0 (0.0%) |
| 5 to 17 Years | 303 (5.9%) | 188 (5.0%) |
| 18 to 34 Years | 389 (6.7%) | 374 (6.1%) |
| 35 to 64 Years | 1,693 (18.8%) | 1,836 (16.6%) |
| 65 to 74 Years | 762 (25.9%) | 705 (23.7%) |
| 75 Years and over | 460 (30.9%) | 1,272 (48.1%) |
Disability Class by Sex by Age in Rocky Mount
Disability Class: Hearing Difficulty
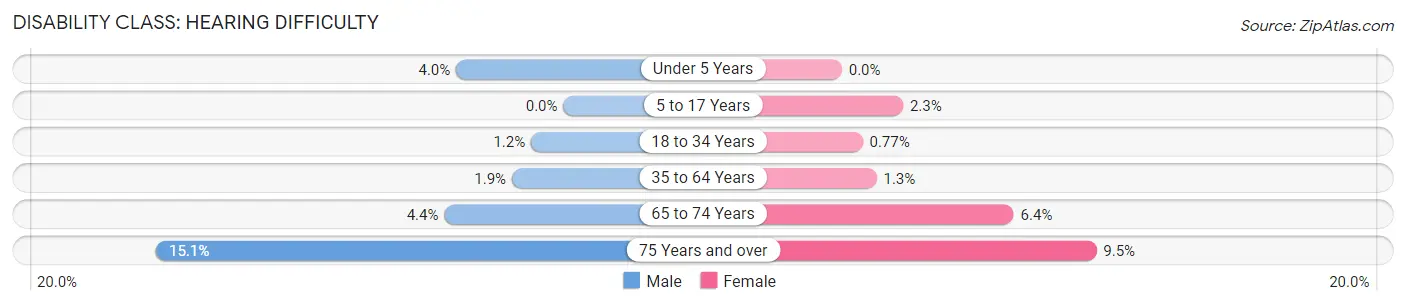
| Age Bracket | Male | Female |
| Under 5 Years | 56 (4.0%) | 0 (0.0%) |
| 5 to 17 Years | 0 (0.0%) | 86 (2.3%) |
| 18 to 34 Years | 70 (1.2%) | 47 (0.8%) |
| 35 to 64 Years | 172 (1.9%) | 143 (1.3%) |
| 65 to 74 Years | 130 (4.4%) | 190 (6.4%) |
| 75 Years and over | 225 (15.1%) | 250 (9.5%) |
Disability Class: Vision Difficulty
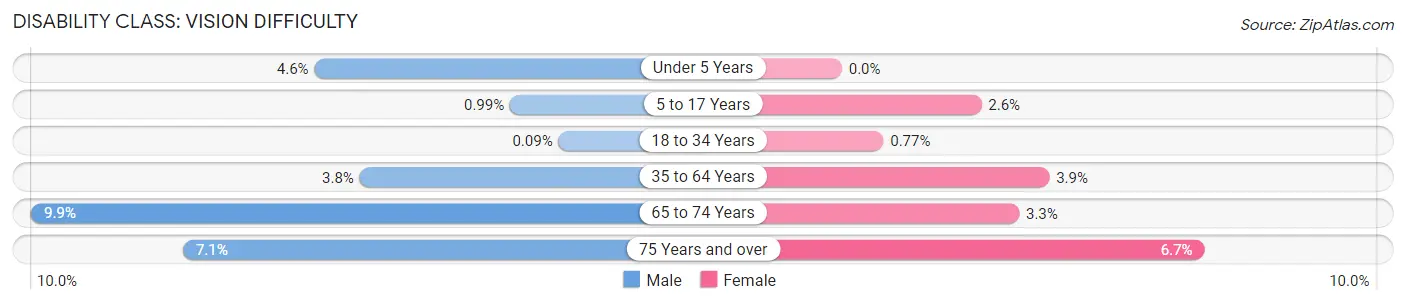
| Age Bracket | Male | Female |
| Under 5 Years | 65 (4.6%) | 0 (0.0%) |
| 5 to 17 Years | 51 (1.0%) | 98 (2.6%) |
| 18 to 34 Years | 5 (0.1%) | 47 (0.8%) |
| 35 to 64 Years | 340 (3.8%) | 426 (3.8%) |
| 65 to 74 Years | 291 (9.9%) | 98 (3.3%) |
| 75 Years and over | 105 (7.1%) | 178 (6.7%) |
Disability Class: Cognitive Difficulty
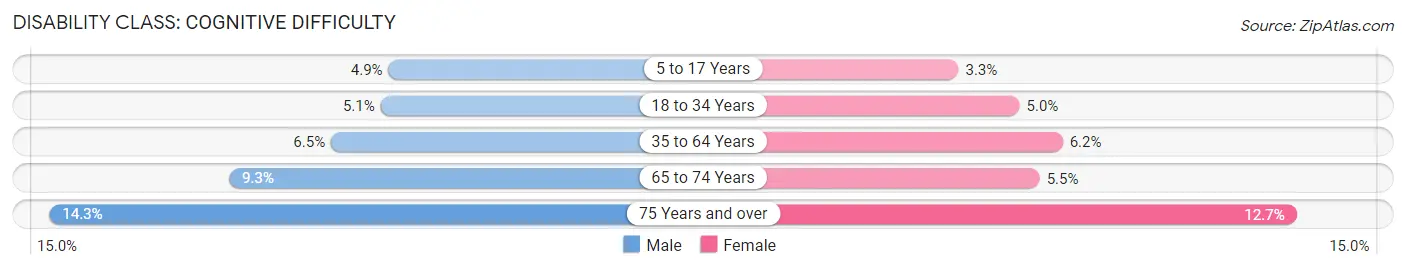
| Age Bracket | Male | Female |
| 5 to 17 Years | 252 (4.9%) | 123 (3.3%) |
| 18 to 34 Years | 297 (5.1%) | 303 (5.0%) |
| 35 to 64 Years | 583 (6.5%) | 680 (6.1%) |
| 65 to 74 Years | 274 (9.3%) | 164 (5.5%) |
| 75 Years and over | 213 (14.3%) | 335 (12.7%) |
Disability Class: Ambulatory Difficulty
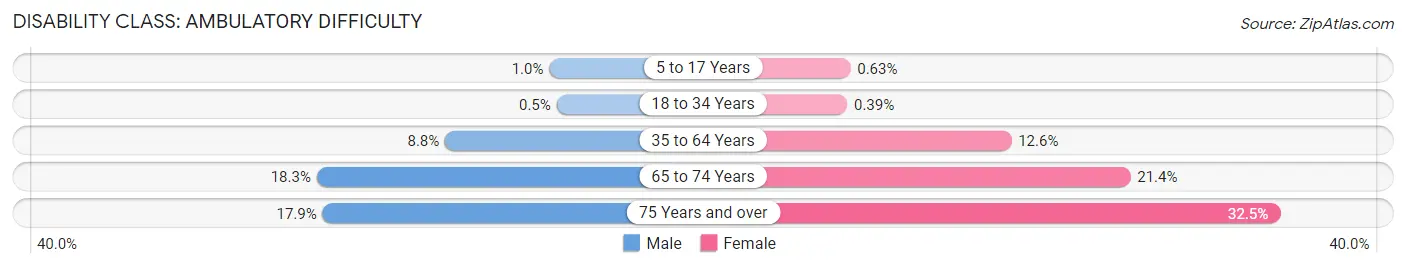
| Age Bracket | Male | Female |
| 5 to 17 Years | 54 (1.0%) | 24 (0.6%) |
| 18 to 34 Years | 29 (0.5%) | 24 (0.4%) |
| 35 to 64 Years | 791 (8.8%) | 1,390 (12.6%) |
| 65 to 74 Years | 539 (18.3%) | 638 (21.4%) |
| 75 Years and over | 266 (17.9%) | 861 (32.5%) |
Disability Class: Self-Care Difficulty
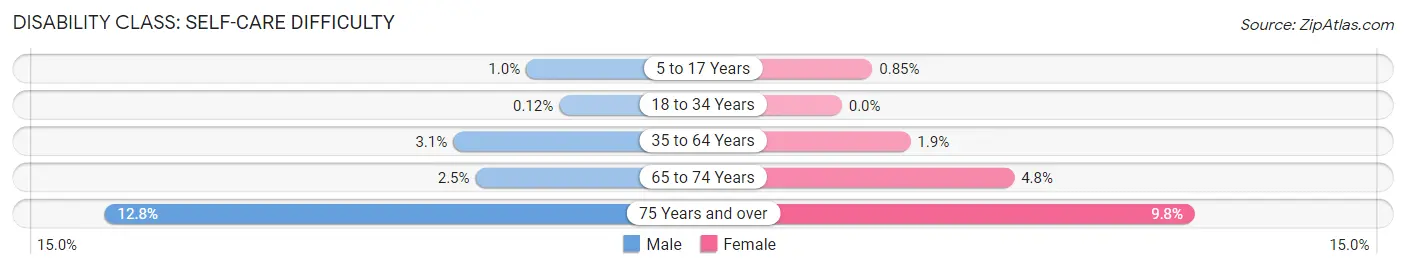
| Age Bracket | Male | Female |
| 5 to 17 Years | 54 (1.0%) | 32 (0.9%) |
| 18 to 34 Years | 7 (0.1%) | 0 (0.0%) |
| 35 to 64 Years | 276 (3.1%) | 211 (1.9%) |
| 65 to 74 Years | 72 (2.5%) | 143 (4.8%) |
| 75 Years and over | 190 (12.8%) | 260 (9.8%) |
Technology Access in Rocky Mount
Computing Device Access in Rocky Mount
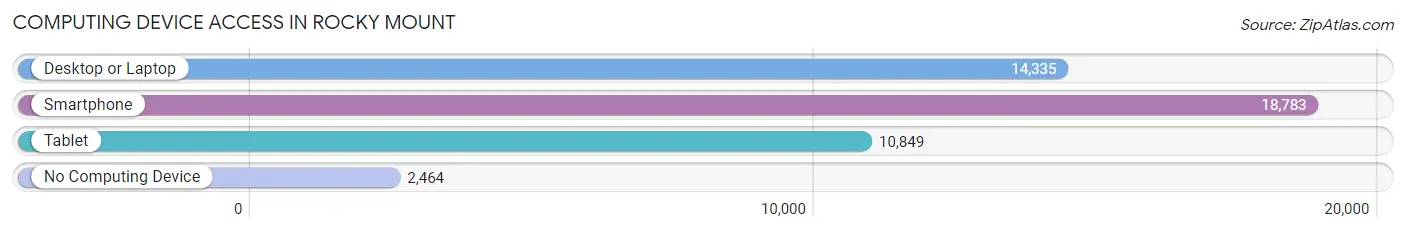
| Device Type | # Households | % Households |
| Desktop or Laptop | 14,335 | 63.2% |
| Smartphone | 18,783 | 82.9% |
| Tablet | 10,849 | 47.9% |
| No Computing Device | 2,464 | 10.9% |
| Total | 22,666 | 100.0% |
Internet Access in Rocky Mount
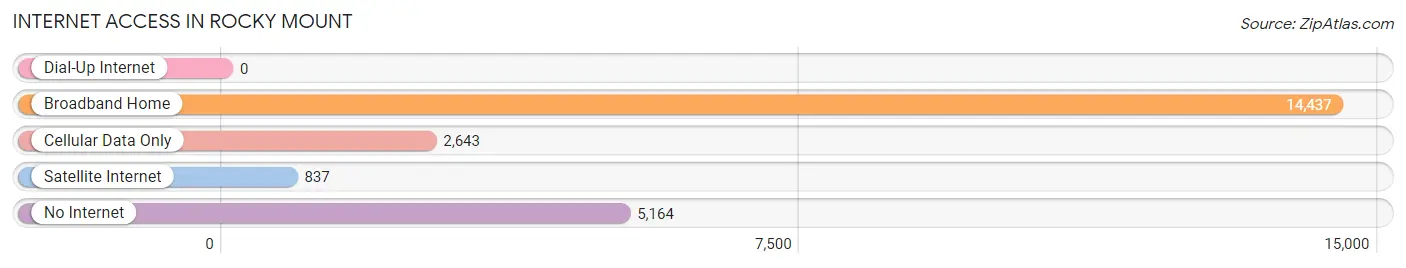
| Internet Type | # Households | % Households |
| Dial-Up Internet | 0 | 0.0% |
| Broadband Home | 14,437 | 63.7% |
| Cellular Data Only | 2,643 | 11.7% |
| Satellite Internet | 837 | 3.7% |
| No Internet | 5,164 | 22.8% |
| Total | 22,666 | 100.0% |
Rocky Mount Summary
Rocky Mount, North Carolina is a city located in the northeastern part of the state, in Nash and Edgecombe counties. It is the county seat of Edgecombe County and is part of the Rocky Mount Metropolitan Statistical Area. The city has a population of approximately 57,000 people, making it the tenth largest city in North Carolina.
Geography
Rocky Mount is located in the Coastal Plain region of North Carolina, approximately 40 miles east of Raleigh. The city is situated on the banks of the Tar River, which flows through the city and is a major source of water for the area. The city is surrounded by rolling hills and forests, and is located near the edge of the Atlantic Coastal Plain. The city has a humid subtropical climate, with hot, humid summers and mild winters.
History
Rocky Mount was first settled in 1760 by a group of settlers from Virginia. The town was originally known as Rocky Mount Station, and was a stop on the Wilmington and Weldon Railroad. The railroad was a major factor in the growth of the town, and it soon became a major hub for the production of tobacco and cotton. The town was officially incorporated in 1867, and the name was changed to Rocky Mount.
In the late 19th century, Rocky Mount became a major center for the textile industry, and the city's population grew rapidly. The city was also home to several major tobacco companies, including Liggett & Myers and R.J. Reynolds. In the early 20th century, Rocky Mount was a major center for the production of furniture and other wood products.
Economy
Today, Rocky Mount is a major center for manufacturing, with several major companies located in the city. The city is home to several major employers, including Nash Health Care Systems, Nash UNC Health Care, and Nash County Schools. The city is also home to several major retail stores, including Walmart, Target, and Lowe's.
The city is also home to several major educational institutions, including North Carolina Wesleyan College, Nash Community College, and Edgecombe Community College. The city is also home to several major medical facilities, including Nash General Hospital and Nash UNC Health Care.
Demographics
As of the 2010 census, the population of Rocky Mount was 57,477. The racial makeup of the city was 54.3% African American, 37.2% White, 0.4% Native American, 1.2% Asian, 0.1% Pacific Islander, and 6.8% from other races. The median household income was $33,945, and the median family income was $41,945.
Conclusion
Rocky Mount, North Carolina is a city located in the northeastern part of the state, in Nash and Edgecombe counties. It is the county seat of Edgecombe County and is part of the Rocky Mount Metropolitan Statistical Area. The city has a population of approximately 57,000 people, making it the tenth largest city in North Carolina. The city is a major center for manufacturing, with several major companies located in the city. The city is also home to several major educational institutions, medical facilities, and retail stores. The racial makeup of the city is 54.3% African American, 37.2% White, 0.4% Native American, 1.2% Asian, 0.1% Pacific Islander, and 6.8% from other races. The median household income was $33,945, and the median family income was $41,945.
Common Questions
What is Per Capita Income in Rocky Mount?
Per Capita income in Rocky Mount is $28,885.
What is the Median Family Income in Rocky Mount?
Median Family Income in Rocky Mount is $56,751.
What is the Median Household income in Rocky Mount?
Median Household Income in Rocky Mount is $50,092.
What is Income or Wage Gap in Rocky Mount?
Income or Wage Gap in Rocky Mount is 15.8%.
Women in Rocky Mount earn 84.2 cents for every dollar earned by a man.
What is Family Income Deficit in Rocky Mount?
Family Income Deficit in Rocky Mount is $10,531.
Families that are below poverty line in Rocky Mount earn $10,531 less on average than the poverty threshold level.
What is Inequality or Gini Index in Rocky Mount?
Inequality or Gini Index in Rocky Mount is 0.47.
What is the Total Population of Rocky Mount?
Total Population of Rocky Mount is 54,260.
What is the Total Male Population of Rocky Mount?
Total Male Population of Rocky Mount is 26,007.
What is the Total Female Population of Rocky Mount?
Total Female Population of Rocky Mount is 28,253.
What is the Ratio of Males per 100 Females in Rocky Mount?
There are 92.05 Males per 100 Females in Rocky Mount.
What is the Ratio of Females per 100 Males in Rocky Mount?
There are 108.64 Females per 100 Males in Rocky Mount.
What is the Median Population Age in Rocky Mount?
Median Population Age in Rocky Mount is 40.4 Years.
What is the Average Family Size in Rocky Mount
Average Family Size in Rocky Mount is 3.0 People.
What is the Average Household Size in Rocky Mount
Average Household Size in Rocky Mount is 2.4 People.
How Large is the Labor Force in Rocky Mount?
There are 26,064 People in the Labor Forcein in Rocky Mount.
What is the Percentage of People in the Labor Force in Rocky Mount?
59.4% of People are in the Labor Force in Rocky Mount.
What is the Unemployment Rate in Rocky Mount?
Unemployment Rate in Rocky Mount is 7.8%.