Elizabeth City, NC Map & Demographics
Elizabeth City Map
Elizabeth City Overview
$26,894
PER CAPITA INCOME
$68,704
AVG FAMILY INCOME
$50,155
AVG HOUSEHOLD INCOME
16.4%
WAGE / INCOME GAP [ % ]
83.6¢/ $1
WAGE / INCOME GAP [ $ ]
$8,942
FAMILY INCOME DEFICIT
0.45
INEQUALITY / GINI INDEX
18,570
TOTAL POPULATION
8,454
MALE POPULATION
10,116
FEMALE POPULATION
83.57
MALES / 100 FEMALES
119.66
FEMALES / 100 MALES
34.8
MEDIAN AGE
3.0
AVG FAMILY SIZE
2.4
AVG HOUSEHOLD SIZE
8,770
LABOR FORCE [ PEOPLE ]
59.3%
PERCENT IN LABOR FORCE
8.3%
UNEMPLOYMENT RATE
Elizabeth City Zip Codes
Elizabeth City Area Codes
Income in Elizabeth City
Income Overview in Elizabeth City
Per Capita Income in Elizabeth City is $26,894, while median incomes of families and households are $68,704 and $50,155 respectively.
| Characteristic | Number | Measure |
| Per Capita Income | 18,570 | $26,894 |
| Median Family Income | 4,232 | $68,704 |
| Mean Family Income | 4,232 | $79,307 |
| Median Household Income | 7,103 | $50,155 |
| Mean Household Income | 7,103 | $66,773 |
| Income Deficit | 4,232 | $8,942 |
| Wage / Income Gap (%) | 18,570 | 16.39% |
| Wage / Income Gap ($) | 18,570 | 83.61¢ per $1 |
| Gini / Inequality Index | 18,570 | 0.45 |
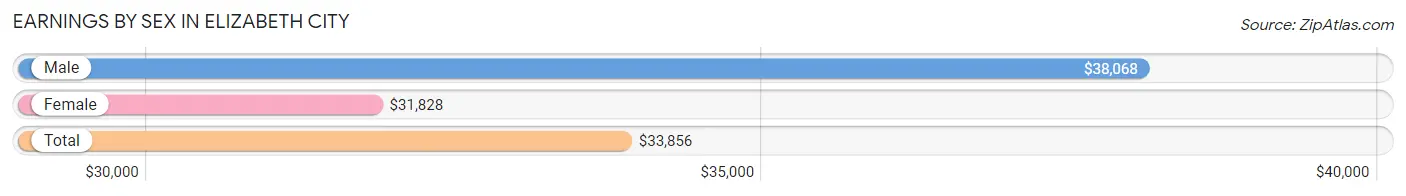
Earnings by Sex in Elizabeth City
Average Earnings in Elizabeth City are $33,856, $38,068 for men and $31,828 for women, a difference of 16.4%.
| Sex | Number | Average Earnings |
| Male | 4,126 (45.9%) | $38,068 |
| Female | 4,866 (54.1%) | $31,828 |
| Total | 8,992 (100.0%) | $33,856 |
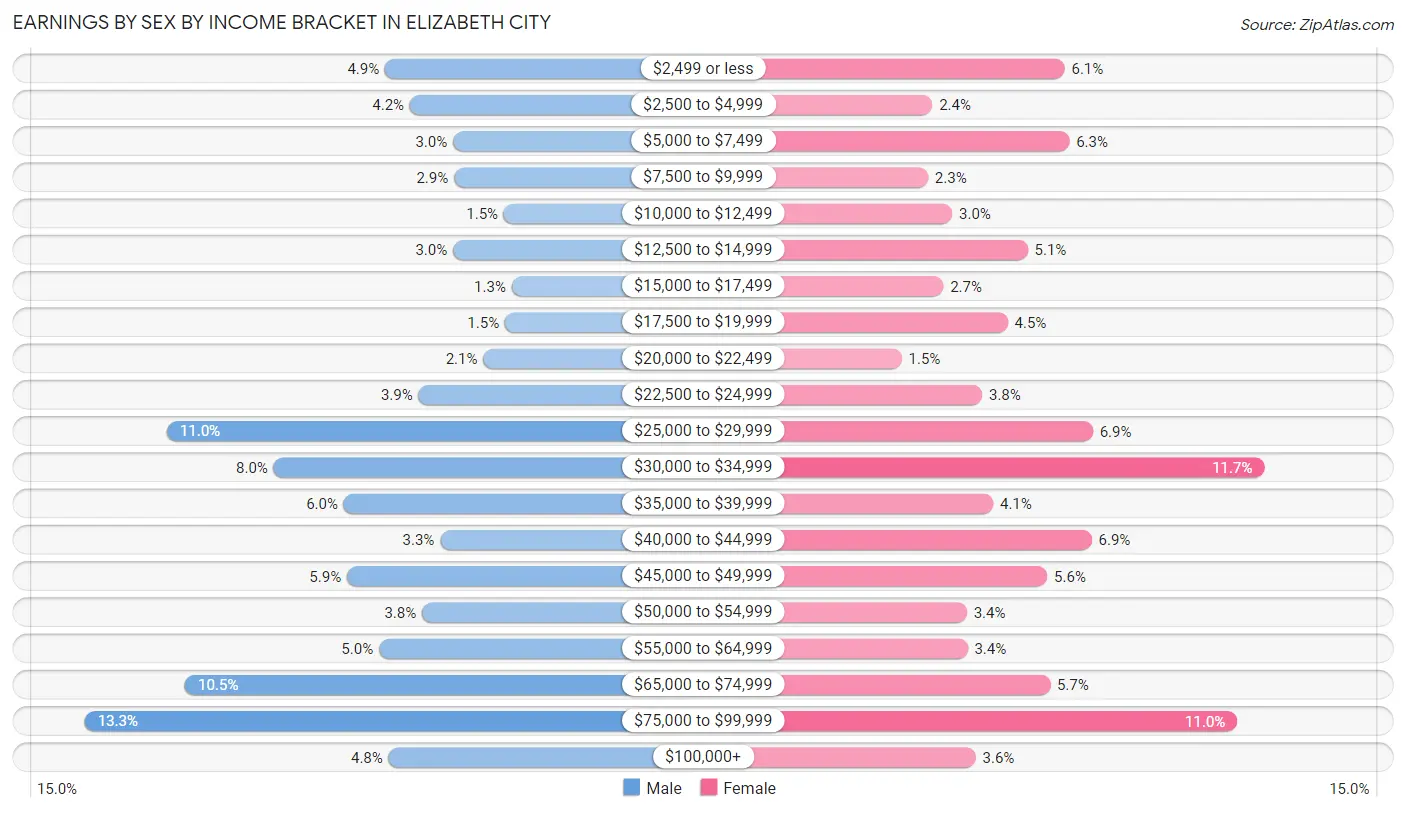
Earnings by Sex by Income Bracket in Elizabeth City
The most common earnings brackets in Elizabeth City are $75,000 to $99,999 for men (549 | 13.3%) and $30,000 to $34,999 for women (571 | 11.7%).
| Income | Male | Female |
| $2,499 or less | 201 (4.9%) | 298 (6.1%) |
| $2,500 to $4,999 | 172 (4.2%) | 117 (2.4%) |
| $5,000 to $7,499 | 122 (3.0%) | 304 (6.2%) |
| $7,500 to $9,999 | 121 (2.9%) | 111 (2.3%) |
| $10,000 to $12,499 | 63 (1.5%) | 144 (3.0%) |
| $12,500 to $14,999 | 122 (3.0%) | 247 (5.1%) |
| $15,000 to $17,499 | 54 (1.3%) | 132 (2.7%) |
| $17,500 to $19,999 | 62 (1.5%) | 220 (4.5%) |
| $20,000 to $22,499 | 87 (2.1%) | 75 (1.5%) |
| $22,500 to $24,999 | 162 (3.9%) | 185 (3.8%) |
| $25,000 to $29,999 | 454 (11.0%) | 336 (6.9%) |
| $30,000 to $34,999 | 330 (8.0%) | 571 (11.7%) |
| $35,000 to $39,999 | 249 (6.0%) | 200 (4.1%) |
| $40,000 to $44,999 | 137 (3.3%) | 335 (6.9%) |
| $45,000 to $49,999 | 245 (5.9%) | 274 (5.6%) |
| $50,000 to $54,999 | 158 (3.8%) | 164 (3.4%) |
| $55,000 to $64,999 | 208 (5.0%) | 165 (3.4%) |
| $65,000 to $74,999 | 433 (10.5%) | 278 (5.7%) |
| $75,000 to $99,999 | 549 (13.3%) | 534 (11.0%) |
| $100,000+ | 197 (4.8%) | 176 (3.6%) |
| Total | 4,126 (100.0%) | 4,866 (100.0%) |
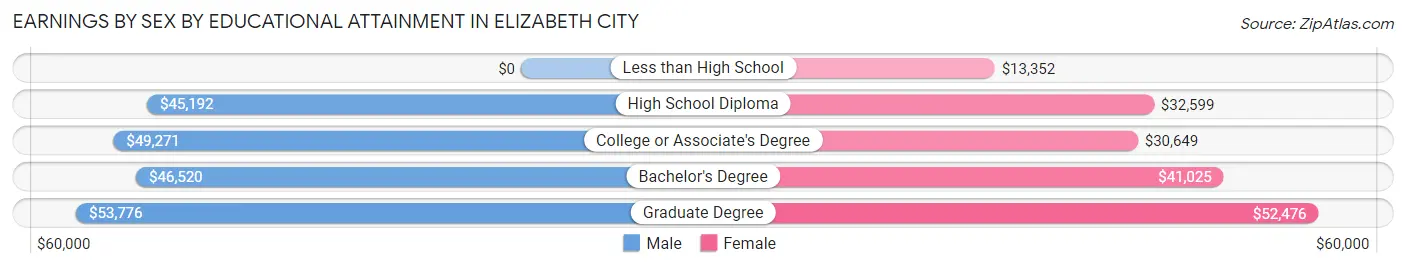
Earnings by Sex by Educational Attainment in Elizabeth City
Average earnings in Elizabeth City are $46,338 for men and $34,333 for women, a difference of 25.9%. Men with an educational attainment of graduate degree enjoy the highest average annual earnings of $53,776, while those with high school diploma education earn the least with $45,192. Women with an educational attainment of graduate degree earn the most with the average annual earnings of $52,476, while those with less than high school education have the smallest earnings of $13,352.
| Educational Attainment | Male Income | Female Income |
| Less than High School | - | - |
| High School Diploma | $45,192 | $32,599 |
| College or Associate's Degree | $49,271 | $30,649 |
| Bachelor's Degree | $46,520 | $41,025 |
| Graduate Degree | $53,776 | $52,476 |
| Total | $46,338 | $34,333 |
Family Income in Elizabeth City
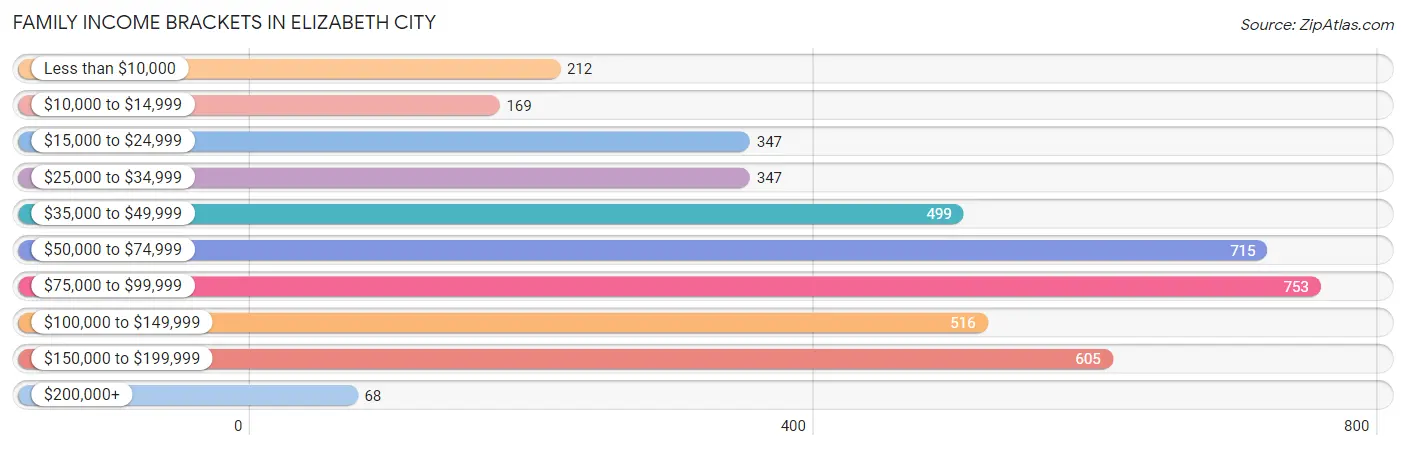
Family Income Brackets in Elizabeth City
According to the Elizabeth City family income data, there are 753 families falling into the $75,000 to $99,999 income range, which is the most common income bracket and makes up 17.8% of all families. Conversely, the $200,000+ income bracket is the least frequent group with only 68 families (1.6%) belonging to this category.
| Income Bracket | # Families | % Families |
| Less than $10,000 | 212 | 5.0% |
| $10,000 to $14,999 | 169 | 4.0% |
| $15,000 to $24,999 | 347 | 8.2% |
| $25,000 to $34,999 | 347 | 8.2% |
| $35,000 to $49,999 | 499 | 11.8% |
| $50,000 to $74,999 | 715 | 16.9% |
| $75,000 to $99,999 | 753 | 17.8% |
| $100,000 to $149,999 | 516 | 12.2% |
| $150,000 to $199,999 | 605 | 14.3% |
| $200,000+ | 68 | 1.6% |
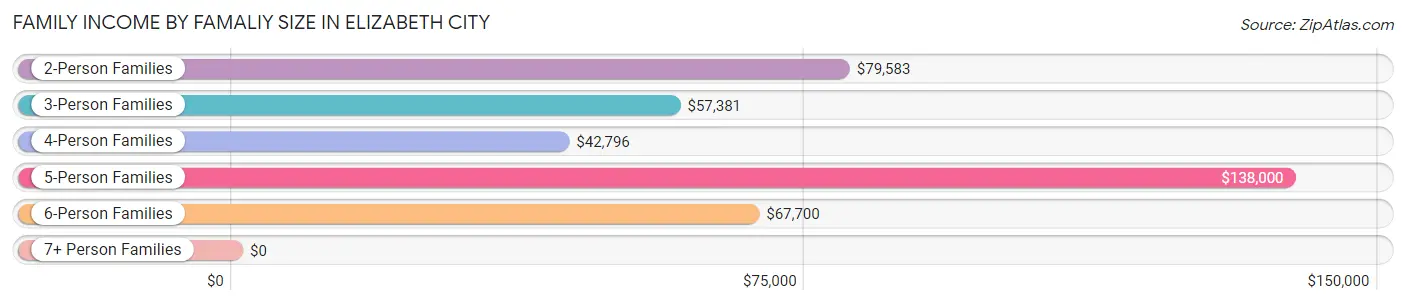
Family Income by Famaliy Size in Elizabeth City
5-person families (432 | 10.2%) account for the highest median family income in Elizabeth City with $138,000 per family, while 2-person families (2,241 | 52.9%) have the highest median income of $39,792 per family member.
| Income Bracket | # Families | Median Income |
| 2-Person Families | 2,241 (52.9%) | $79,583 |
| 3-Person Families | 1,044 (24.7%) | $57,381 |
| 4-Person Families | 437 (10.3%) | $42,796 |
| 5-Person Families | 432 (10.2%) | $138,000 |
| 6-Person Families | 78 (1.8%) | $67,700 |
| 7+ Person Families | 0 (0.0%) | $0 |
| Total | 4,232 (100.0%) | $68,704 |
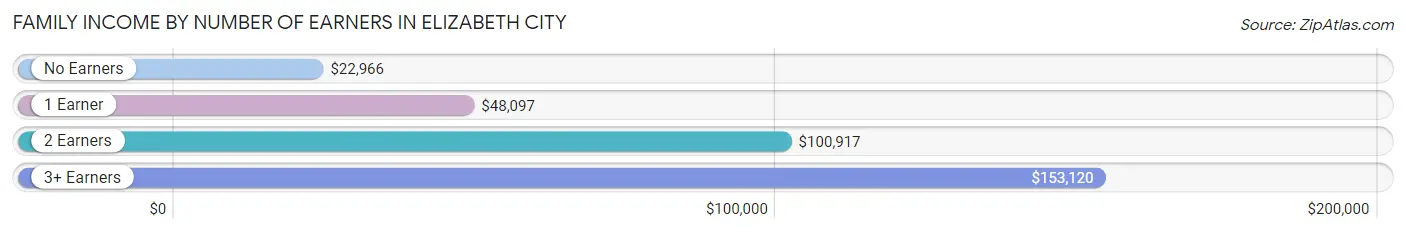
Family Income by Number of Earners in Elizabeth City
The median family income in Elizabeth City is $68,704, with families comprising 3+ earners (262) having the highest median family income of $153,120, while families with no earners (623) have the lowest median family income of $22,966, accounting for 6.2% and 14.7% of families, respectively.
| Number of Earners | # Families | Median Income |
| No Earners | 623 (14.7%) | $22,966 |
| 1 Earner | 1,588 (37.5%) | $48,097 |
| 2 Earners | 1,759 (41.6%) | $100,917 |
| 3+ Earners | 262 (6.2%) | $153,120 |
| Total | 4,232 (100.0%) | $68,704 |
Household Income in Elizabeth City
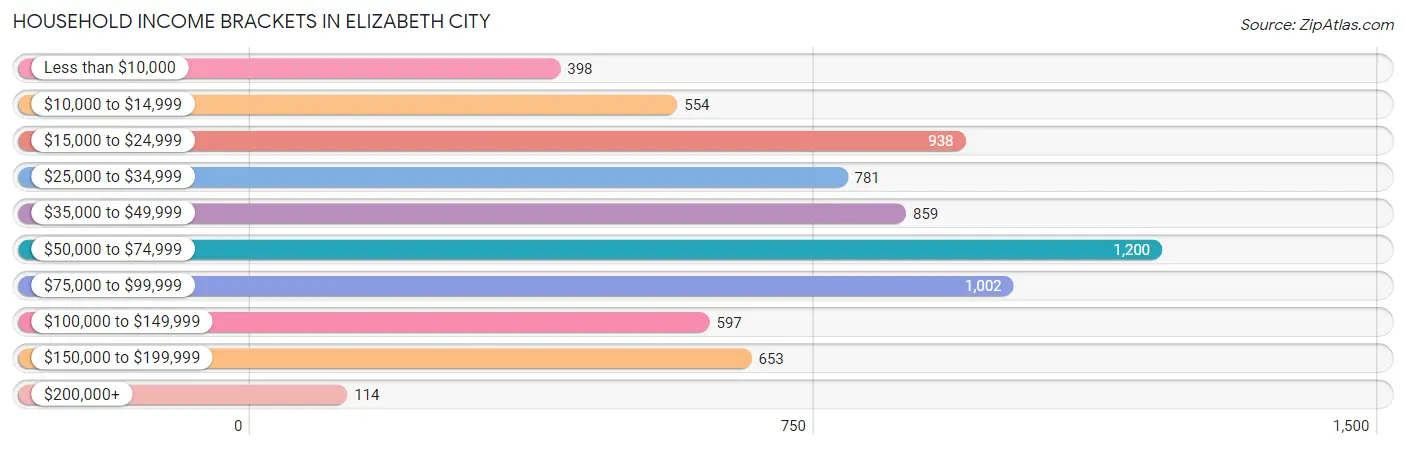
Household Income Brackets in Elizabeth City
With 1,200 households falling in the category, the $50,000 to $74,999 income range is the most frequent in Elizabeth City, accounting for 16.9% of all households. In contrast, only 114 households (1.6%) fall into the $200,000+ income bracket, making it the least populous group.
| Income Bracket | # Households | % Households |
| Less than $10,000 | 398 | 5.6% |
| $10,000 to $14,999 | 554 | 7.8% |
| $15,000 to $24,999 | 938 | 13.2% |
| $25,000 to $34,999 | 781 | 11.0% |
| $35,000 to $49,999 | 859 | 12.1% |
| $50,000 to $74,999 | 1,200 | 16.9% |
| $75,000 to $99,999 | 1,002 | 14.1% |
| $100,000 to $149,999 | 597 | 8.4% |
| $150,000 to $199,999 | 653 | 9.2% |
| $200,000+ | 114 | 1.6% |
Household Income by Householder Age in Elizabeth City
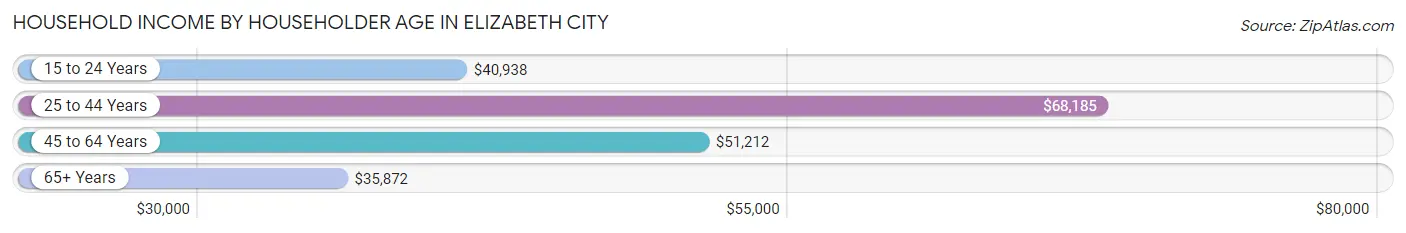
The median household income in Elizabeth City is $50,155, with the highest median household income of $68,185 found in the 25 to 44 years age bracket for the primary householder. A total of 2,448 households (34.5%) fall into this category. Meanwhile, the 65+ years age bracket for the primary householder has the lowest median household income of $35,872, with 2,012 households (28.3%) in this group.
| Income Bracket | # Households | Median Income |
| 15 to 24 Years | 400 (5.6%) | $40,938 |
| 25 to 44 Years | 2,448 (34.5%) | $68,185 |
| 45 to 64 Years | 2,243 (31.6%) | $51,212 |
| 65+ Years | 2,012 (28.3%) | $35,872 |
| Total | 7,103 (100.0%) | $50,155 |
Poverty in Elizabeth City
Income Below Poverty by Sex and Age in Elizabeth City
With 19.1% poverty level for males and 18.8% for females among the residents of Elizabeth City, 16 and 17 year old males and 12 to 14 year old females are the most vulnerable to poverty, with 75 males (47.2%) and 202 females (56.9%) in their respective age groups living below the poverty level.
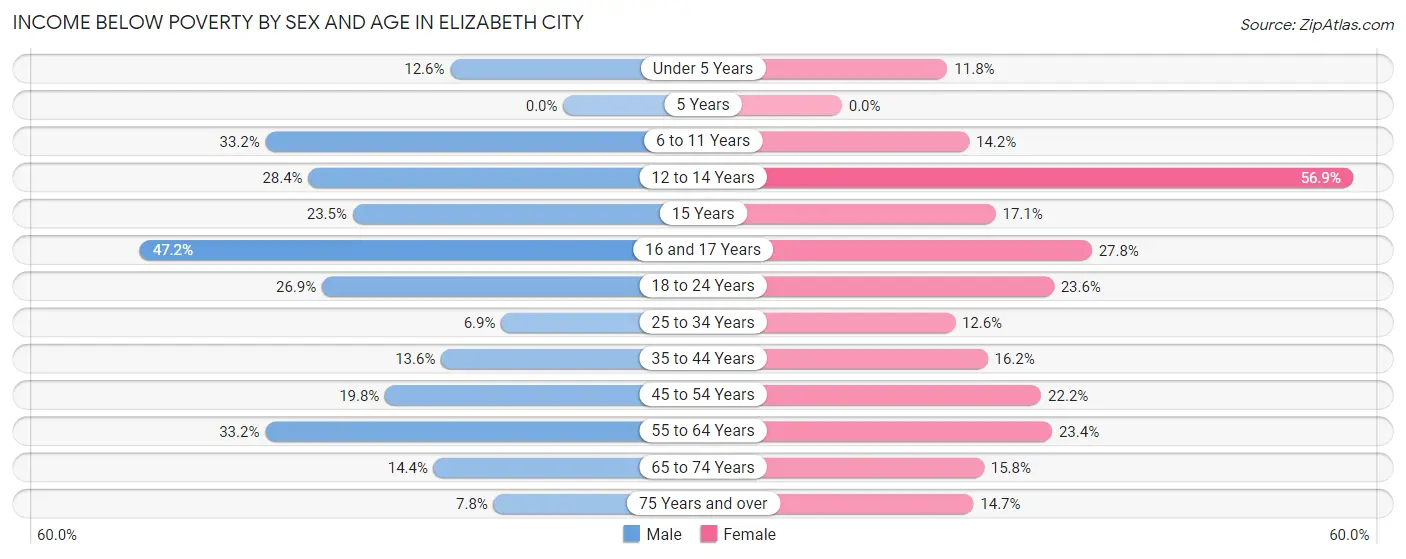
| Age Bracket | Male | Female |
| Under 5 Years | 74 (12.6%) | 77 (11.8%) |
| 5 Years | 0 (0.0%) | 0 (0.0%) |
| 6 to 11 Years | 205 (33.2%) | 72 (14.2%) |
| 12 to 14 Years | 136 (28.4%) | 202 (56.9%) |
| 15 Years | 34 (23.4%) | 19 (17.1%) |
| 16 and 17 Years | 75 (47.2%) | 64 (27.8%) |
| 18 to 24 Years | 190 (26.9%) | 131 (23.6%) |
| 25 to 34 Years | 89 (6.9%) | 172 (12.6%) |
| 35 to 44 Years | 137 (13.6%) | 244 (16.2%) |
| 45 to 54 Years | 149 (19.8%) | 190 (22.2%) |
| 55 to 64 Years | 245 (33.2%) | 295 (23.4%) |
| 65 to 74 Years | 101 (14.4%) | 123 (15.8%) |
| 75 Years and over | 35 (7.8%) | 137 (14.6%) |
| Total | 1,470 (19.1%) | 1,726 (18.8%) |
Income Above Poverty by Sex and Age in Elizabeth City
According to the poverty statistics in Elizabeth City, males aged 5 years and females aged 5 years are the age groups that are most secure financially, with 100.0% of males and 100.0% of females in these age groups living above the poverty line.
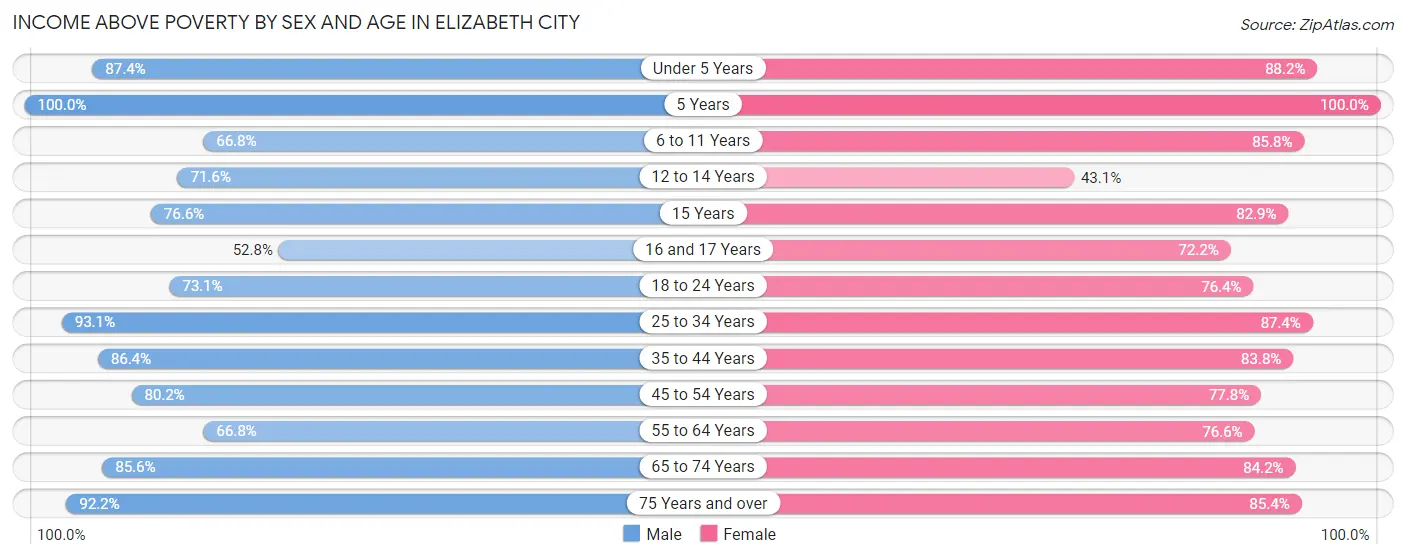
| Age Bracket | Male | Female |
| Under 5 Years | 514 (87.4%) | 578 (88.2%) |
| 5 Years | 54 (100.0%) | 65 (100.0%) |
| 6 to 11 Years | 413 (66.8%) | 436 (85.8%) |
| 12 to 14 Years | 343 (71.6%) | 153 (43.1%) |
| 15 Years | 111 (76.5%) | 92 (82.9%) |
| 16 and 17 Years | 84 (52.8%) | 166 (72.2%) |
| 18 to 24 Years | 517 (73.1%) | 424 (76.4%) |
| 25 to 34 Years | 1,199 (93.1%) | 1,193 (87.4%) |
| 35 to 44 Years | 870 (86.4%) | 1,259 (83.8%) |
| 45 to 54 Years | 602 (80.2%) | 666 (77.8%) |
| 55 to 64 Years | 493 (66.8%) | 965 (76.6%) |
| 65 to 74 Years | 599 (85.6%) | 655 (84.2%) |
| 75 Years and over | 416 (92.2%) | 798 (85.4%) |
| Total | 6,215 (80.9%) | 7,450 (81.2%) |
Income Below Poverty Among Married-Couple Families in Elizabeth City
The poverty statistics for married-couple families in Elizabeth City show that 8.2% or 220 of the total 2,684 families live below the poverty line. Families with no children have the highest poverty rate of 9.1%, comprising of 158 families. On the other hand, families with 3 or 4 children have the lowest poverty rate of 0.0%, which includes 0 families.
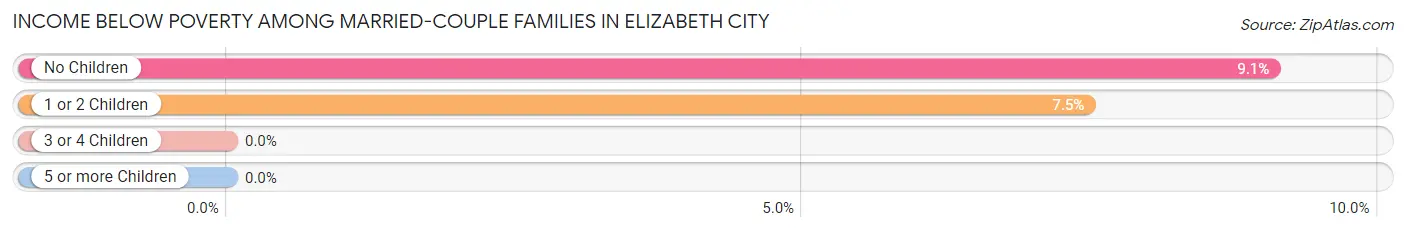
| Children | Above Poverty | Below Poverty |
| No Children | 1,583 (90.9%) | 158 (9.1%) |
| 1 or 2 Children | 768 (92.5%) | 62 (7.5%) |
| 3 or 4 Children | 113 (100.0%) | 0 (0.0%) |
| 5 or more Children | 0 (0.0%) | 0 (0.0%) |
| Total | 2,464 (91.8%) | 220 (8.2%) |
Income Below Poverty Among Single-Parent Households in Elizabeth City
According to the poverty data in Elizabeth City, 26.3% or 62 single-father households and 30.3% or 398 single-mother households are living below the poverty line. Among single-father households, those with 1 or 2 children have the highest poverty rate, with 41 households (78.8%) experiencing poverty. Likewise, among single-mother households, those with 3 or 4 children have the highest poverty rate, with 73 households (46.8%) falling below the poverty line.
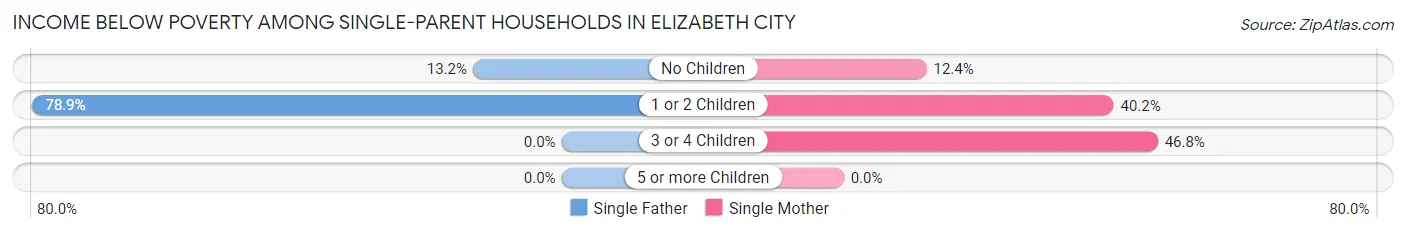
| Children | Single Father | Single Mother |
| No Children | 21 (13.2%) | 62 (12.3%) |
| 1 or 2 Children | 41 (78.8%) | 263 (40.2%) |
| 3 or 4 Children | 0 (0.0%) | 73 (46.8%) |
| 5 or more Children | 0 (0.0%) | 0 (0.0%) |
| Total | 62 (26.3%) | 398 (30.3%) |
Income Below Poverty Among Married-Couple vs Single-Parent Households in Elizabeth City
The poverty data for Elizabeth City shows that 220 of the married-couple family households (8.2%) and 460 of the single-parent households (29.7%) are living below the poverty level. Within the married-couple family households, those with no children have the highest poverty rate, with 158 households (9.1%) falling below the poverty line. Among the single-parent households, those with 1 or 2 children have the highest poverty rate, with 304 household (43.1%) living below poverty.
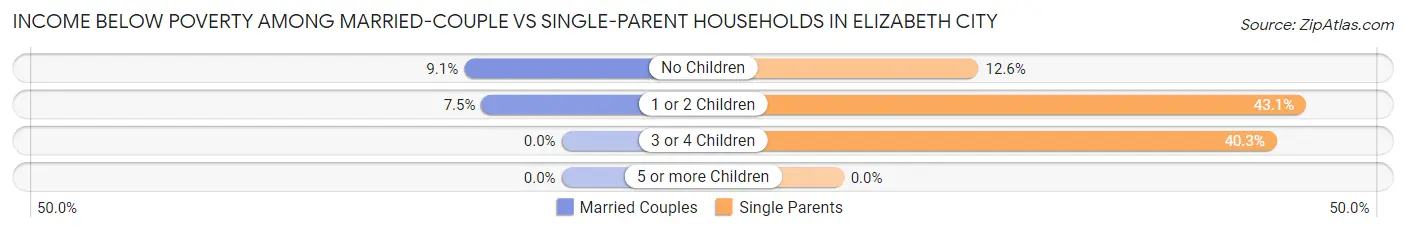
| Children | Married-Couple Families | Single-Parent Households |
| No Children | 158 (9.1%) | 83 (12.6%) |
| 1 or 2 Children | 62 (7.5%) | 304 (43.1%) |
| 3 or 4 Children | 0 (0.0%) | 73 (40.3%) |
| 5 or more Children | 0 (0.0%) | 0 (0.0%) |
| Total | 220 (8.2%) | 460 (29.7%) |
Race in Elizabeth City
The most populous races in Elizabeth City are Black / African American (9,171 | 49.4%), White / Caucasian (7,412 | 39.9%), and Hispanic or Latino (1,587 | 8.6%).
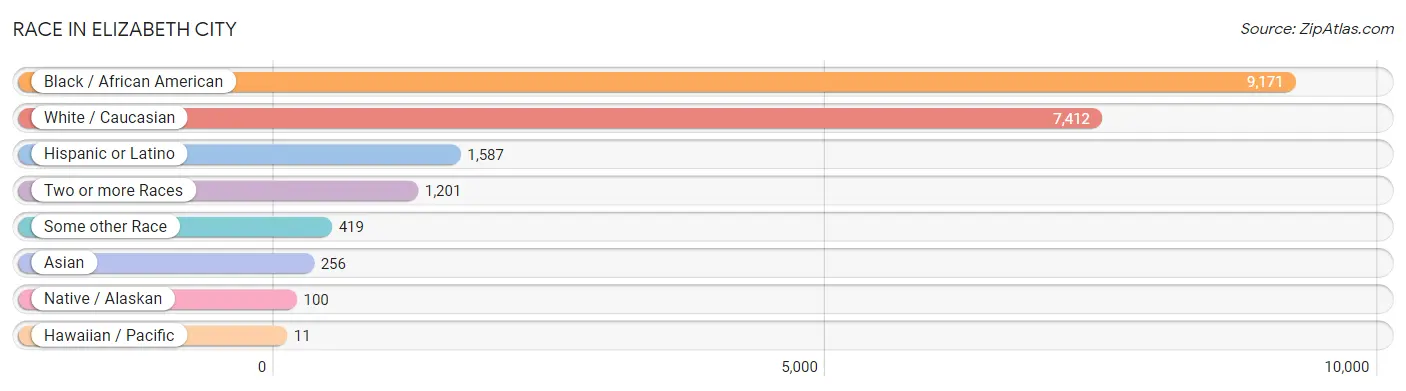
| Race | # Population | % Population |
| Asian | 256 | 1.4% |
| Black / African American | 9,171 | 49.4% |
| Hawaiian / Pacific | 11 | 0.1% |
| Hispanic or Latino | 1,587 | 8.6% |
| Native / Alaskan | 100 | 0.5% |
| White / Caucasian | 7,412 | 39.9% |
| Two or more Races | 1,201 | 6.5% |
| Some other Race | 419 | 2.3% |
| Total | 18,570 | 100.0% |
Ancestry in Elizabeth City
The most populous ancestries reported in Elizabeth City are Irish (1,338 | 7.2%), English (1,248 | 6.7%), German (1,166 | 6.3%), American (1,108 | 6.0%), and Puerto Rican (736 | 4.0%), together accounting for 30.1% of all Elizabeth City residents.
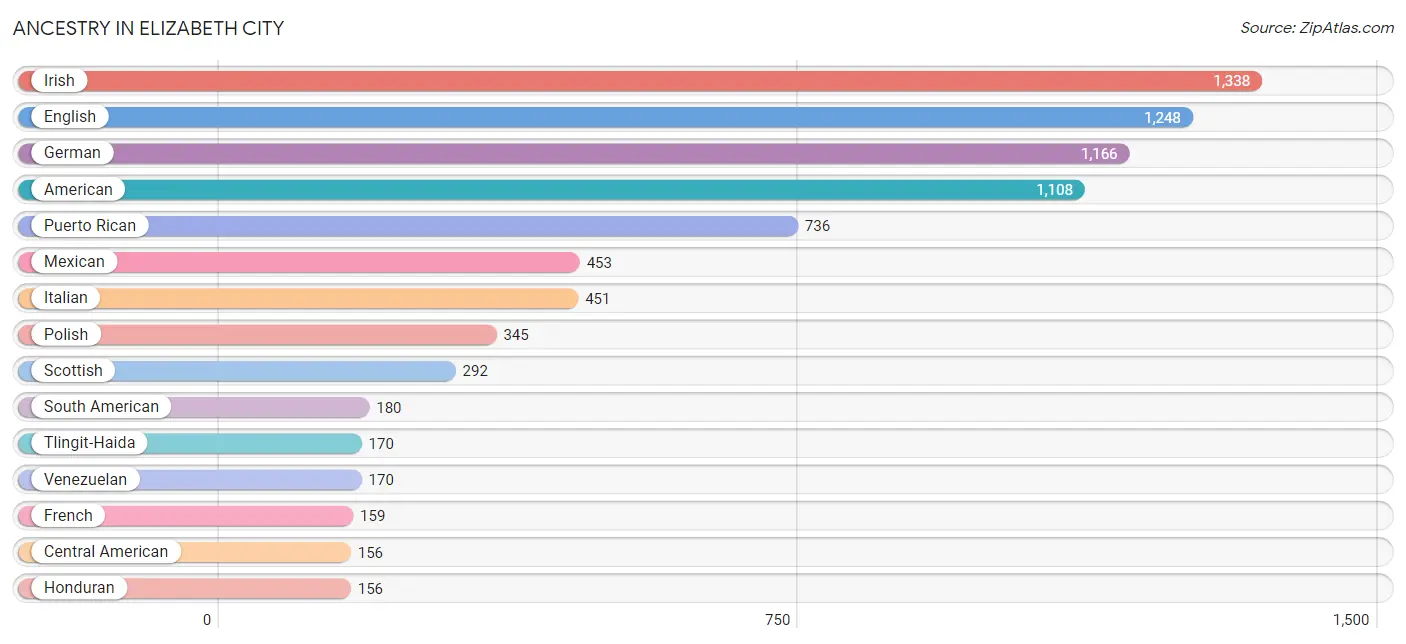
| Ancestry | # Population | % Population |
| African | 87 | 0.5% |
| American | 1,108 | 6.0% |
| Austrian | 3 | 0.0% |
| British | 44 | 0.2% |
| Central American | 156 | 0.8% |
| Cherokee | 48 | 0.3% |
| Croatian | 11 | 0.1% |
| Cuban | 9 | 0.1% |
| Czechoslovakian | 18 | 0.1% |
| Danish | 51 | 0.3% |
| Dutch | 73 | 0.4% |
| Eastern European | 7 | 0.0% |
| English | 1,248 | 6.7% |
| European | 46 | 0.3% |
| French | 159 | 0.9% |
| French Canadian | 15 | 0.1% |
| German | 1,166 | 6.3% |
| Haitian | 30 | 0.2% |
| Honduran | 156 | 0.8% |
| Hungarian | 143 | 0.8% |
| Indian (Asian) | 33 | 0.2% |
| Irish | 1,338 | 7.2% |
| Israeli | 7 | 0.0% |
| Italian | 451 | 2.4% |
| Jamaican | 43 | 0.2% |
| Korean | 135 | 0.7% |
| Lithuanian | 50 | 0.3% |
| Lumbee | 38 | 0.2% |
| Mexican | 453 | 2.4% |
| Mexican American Indian | 24 | 0.1% |
| Mongolian | 10 | 0.1% |
| Native Hawaiian | 11 | 0.1% |
| Nigerian | 17 | 0.1% |
| Northern European | 12 | 0.1% |
| Pennsylvania German | 11 | 0.1% |
| Peruvian | 10 | 0.1% |
| Polish | 345 | 1.9% |
| Portuguese | 40 | 0.2% |
| Puerto Rican | 736 | 4.0% |
| Russian | 13 | 0.1% |
| Scandinavian | 31 | 0.2% |
| Scotch-Irish | 149 | 0.8% |
| Scottish | 292 | 1.6% |
| South American | 180 | 1.0% |
| Sri Lankan | 86 | 0.5% |
| Subsaharan African | 104 | 0.6% |
| Swedish | 140 | 0.7% |
| Swiss | 6 | 0.0% |
| Thai | 33 | 0.2% |
| Tlingit-Haida | 170 | 0.9% |
| Trinidadian and Tobagonian | 13 | 0.1% |
| U.S. Virgin Islander | 13 | 0.1% |
| Ukrainian | 13 | 0.1% |
| Venezuelan | 170 | 0.9% |
| Welsh | 85 | 0.5% | View All 55 Rows |
Immigrants in Elizabeth City
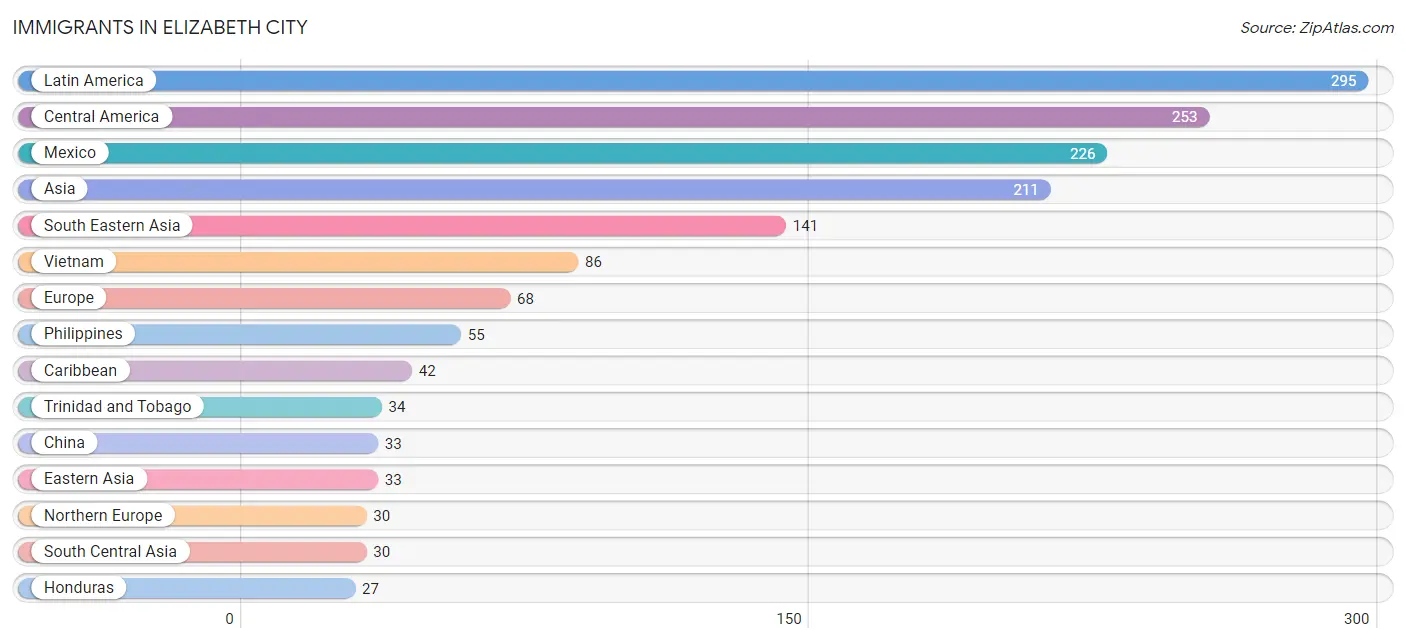
The most numerous immigrant groups reported in Elizabeth City came from Latin America (295 | 1.6%), Central America (253 | 1.4%), Mexico (226 | 1.2%), Asia (211 | 1.1%), and South Eastern Asia (141 | 0.8%), together accounting for 6.1% of all Elizabeth City residents.
| Immigration Origin | # Population | % Population |
| Africa | 17 | 0.1% |
| Asia | 211 | 1.1% |
| Canada | 2 | 0.0% |
| Caribbean | 42 | 0.2% |
| Central America | 253 | 1.4% |
| China | 33 | 0.2% |
| Eastern Asia | 33 | 0.2% |
| Eastern Europe | 13 | 0.1% |
| England | 8 | 0.0% |
| Europe | 68 | 0.4% |
| Germany | 11 | 0.1% |
| Honduras | 27 | 0.2% |
| India | 20 | 0.1% |
| Iran | 10 | 0.1% |
| Israel | 7 | 0.0% |
| Jamaica | 8 | 0.0% |
| Latin America | 295 | 1.6% |
| Mexico | 226 | 1.2% |
| Netherlands | 14 | 0.1% |
| Nigeria | 17 | 0.1% |
| Northern Europe | 30 | 0.2% |
| Philippines | 55 | 0.3% |
| South Central Asia | 30 | 0.2% |
| South Eastern Asia | 141 | 0.8% |
| Taiwan | 22 | 0.1% |
| Trinidad and Tobago | 34 | 0.2% |
| Ukraine | 13 | 0.1% |
| Vietnam | 86 | 0.5% |
| Western Africa | 17 | 0.1% |
| Western Asia | 7 | 0.0% |
| Western Europe | 25 | 0.1% | View All 31 Rows |
Sex and Age in Elizabeth City
Sex and Age in Elizabeth City
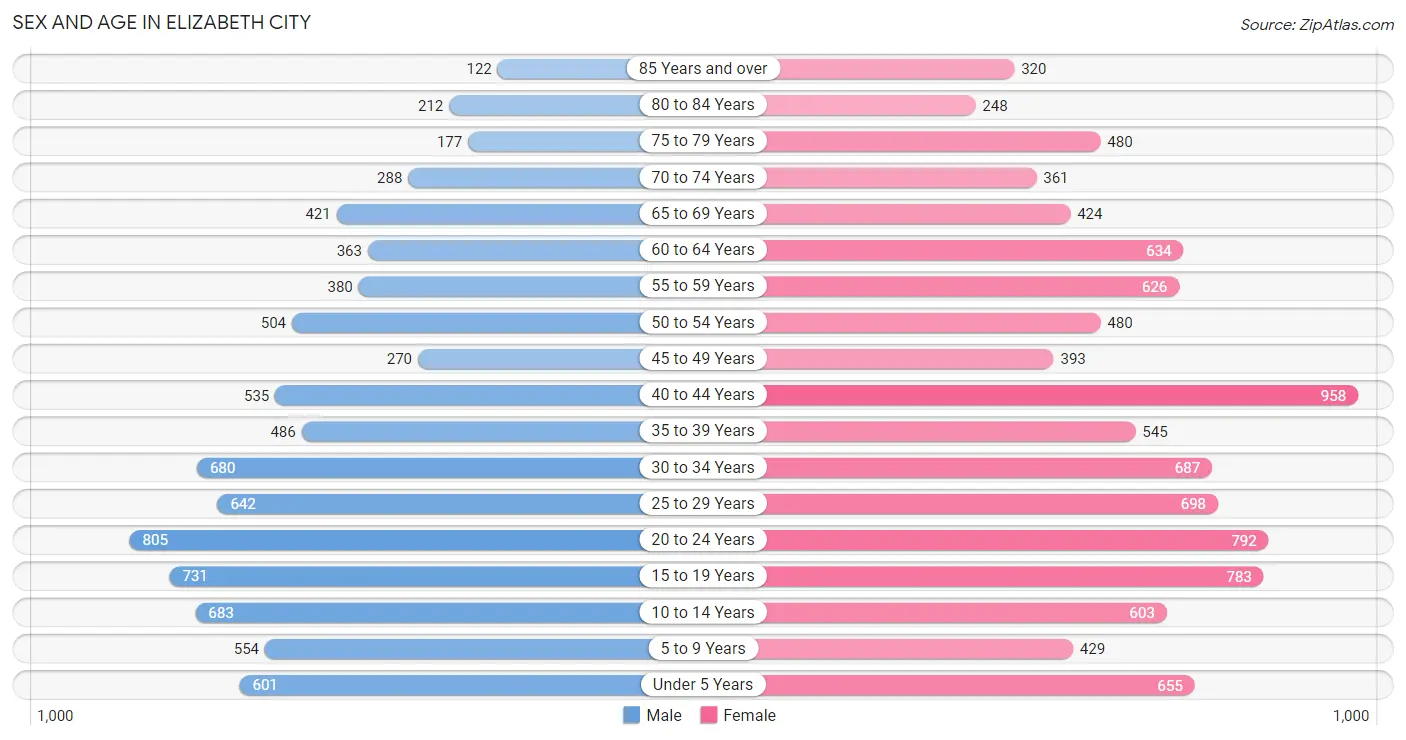
The most populous age groups in Elizabeth City are 20 to 24 Years (805 | 9.5%) for men and 40 to 44 Years (958 | 9.5%) for women.
| Age Bracket | Male | Female |
| Under 5 Years | 601 (7.1%) | 655 (6.5%) |
| 5 to 9 Years | 554 (6.6%) | 429 (4.2%) |
| 10 to 14 Years | 683 (8.1%) | 603 (6.0%) |
| 15 to 19 Years | 731 (8.6%) | 783 (7.7%) |
| 20 to 24 Years | 805 (9.5%) | 792 (7.8%) |
| 25 to 29 Years | 642 (7.6%) | 698 (6.9%) |
| 30 to 34 Years | 680 (8.0%) | 687 (6.8%) |
| 35 to 39 Years | 486 (5.8%) | 545 (5.4%) |
| 40 to 44 Years | 535 (6.3%) | 958 (9.5%) |
| 45 to 49 Years | 270 (3.2%) | 393 (3.9%) |
| 50 to 54 Years | 504 (6.0%) | 480 (4.7%) |
| 55 to 59 Years | 380 (4.5%) | 626 (6.2%) |
| 60 to 64 Years | 363 (4.3%) | 634 (6.3%) |
| 65 to 69 Years | 421 (5.0%) | 424 (4.2%) |
| 70 to 74 Years | 288 (3.4%) | 361 (3.6%) |
| 75 to 79 Years | 177 (2.1%) | 480 (4.7%) |
| 80 to 84 Years | 212 (2.5%) | 248 (2.5%) |
| 85 Years and over | 122 (1.4%) | 320 (3.2%) |
| Total | 8,454 (100.0%) | 10,116 (100.0%) |
Families and Households in Elizabeth City
Median Family Size in Elizabeth City
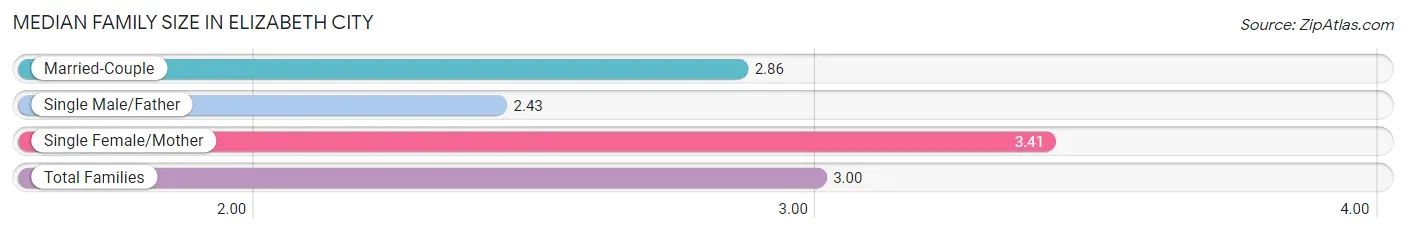
The median family size in Elizabeth City is 3.00 persons per family, with single female/mother families (1,312 | 31.0%) accounting for the largest median family size of 3.41 persons per family. On the other hand, single male/father families (236 | 5.6%) represent the smallest median family size with 2.43 persons per family.
| Family Type | # Families | Family Size |
| Married-Couple | 2,684 (63.4%) | 2.86 |
| Single Male/Father | 236 (5.6%) | 2.43 |
| Single Female/Mother | 1,312 (31.0%) | 3.41 |
| Total Families | 4,232 (100.0%) | 3.00 |
Median Household Size in Elizabeth City
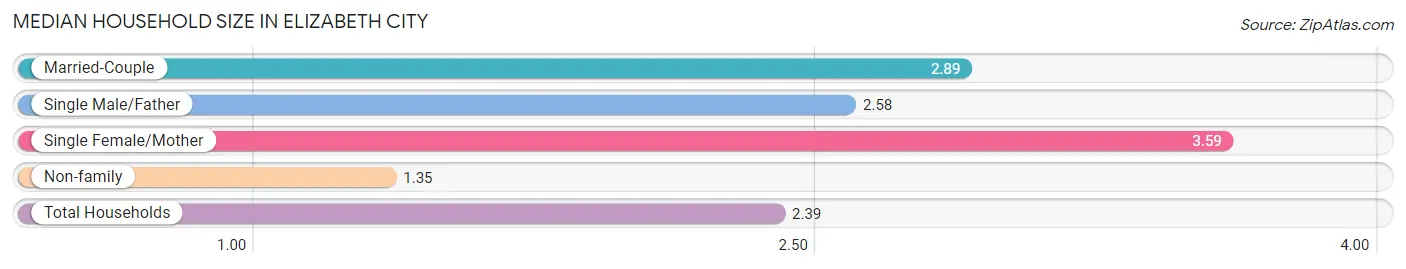
The median household size in Elizabeth City is 2.39 persons per household, with single female/mother households (1,312 | 18.5%) accounting for the largest median household size of 3.59 persons per household. non-family households (2,871 | 40.4%) represent the smallest median household size with 1.35 persons per household.
| Household Type | # Households | Household Size |
| Married-Couple | 2,684 (37.8%) | 2.89 |
| Single Male/Father | 236 (3.3%) | 2.58 |
| Single Female/Mother | 1,312 (18.5%) | 3.59 |
| Non-family | 2,871 (40.4%) | 1.35 |
| Total Households | 7,103 (100.0%) | 2.39 |
Household Size by Marriage Status in Elizabeth City
Out of a total of 7,103 households in Elizabeth City, 4,232 (59.6%) are family households, while 2,871 (40.4%) are nonfamily households. The most numerous type of family households are 2-person households, comprising 2,097, and the most common type of nonfamily households are 1-person households, comprising 2,474.
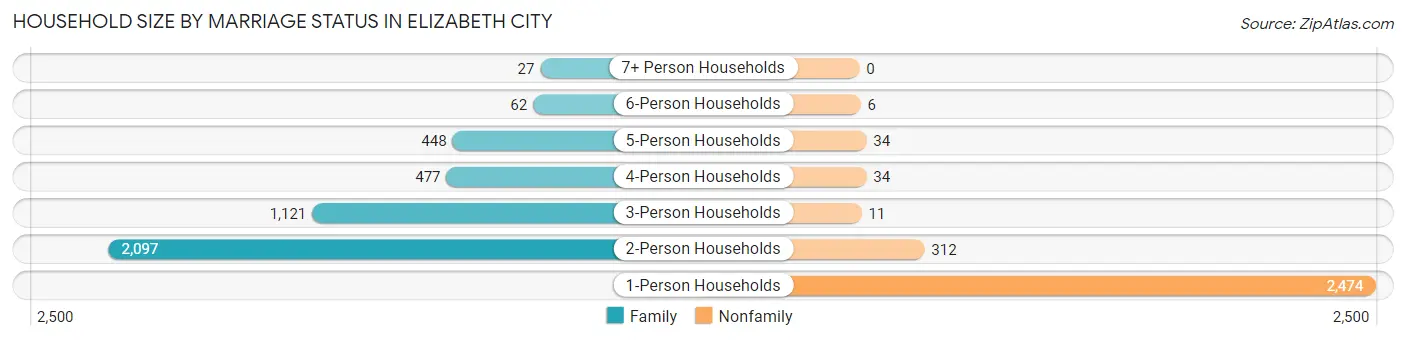
| Household Size | Family Households | Nonfamily Households |
| 1-Person Households | - | 2,474 (34.8%) |
| 2-Person Households | 2,097 (29.5%) | 312 (4.4%) |
| 3-Person Households | 1,121 (15.8%) | 11 (0.2%) |
| 4-Person Households | 477 (6.7%) | 34 (0.5%) |
| 5-Person Households | 448 (6.3%) | 34 (0.5%) |
| 6-Person Households | 62 (0.9%) | 6 (0.1%) |
| 7+ Person Households | 27 (0.4%) | 0 (0.0%) |
| Total | 4,232 (59.6%) | 2,871 (40.4%) |
Female Fertility in Elizabeth City
Fertility by Age in Elizabeth City
Average fertility rate in Elizabeth City is 88.0 births per 1,000 women. Women in the age bracket of 20 to 34 years have the highest fertility rate with 122.0 births per 1,000 women. Women in the age bracket of 20 to 34 years acount for 60.6% of all women with births.
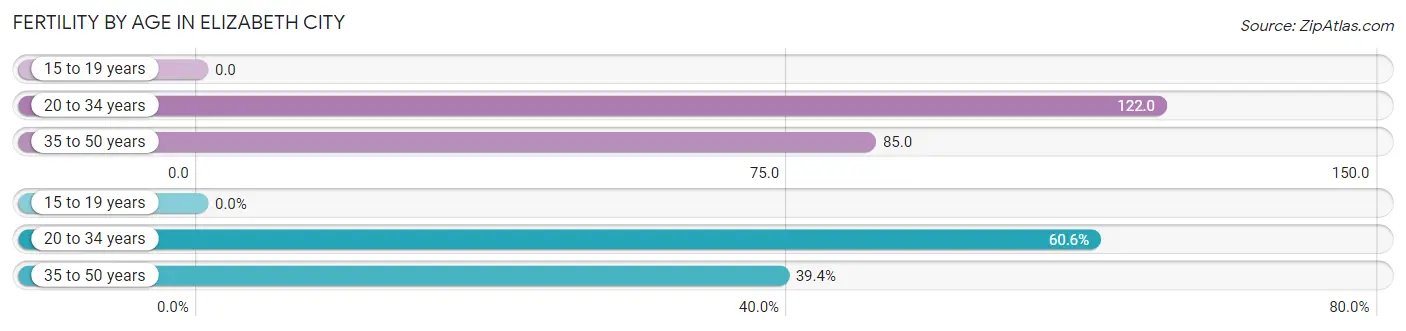
| Age Bracket | Women with Births | Births / 1,000 Women |
| 15 to 19 years | 0 (0.0%) | 0.0 |
| 20 to 34 years | 266 (60.6%) | 122.0 |
| 35 to 50 years | 173 (39.4%) | 85.0 |
| Total | 439 (100.0%) | 88.0 |
Fertility by Age by Marriage Status in Elizabeth City
52.6% of women with births (439) in Elizabeth City are married. The highest percentage of unmarried women with births falls into 20 to 34 years age bracket with 50.0% of them unmarried at the time of birth, while the lowest percentage of unmarried women with births belong to 35 to 50 years age bracket with 43.3% of them unmarried.
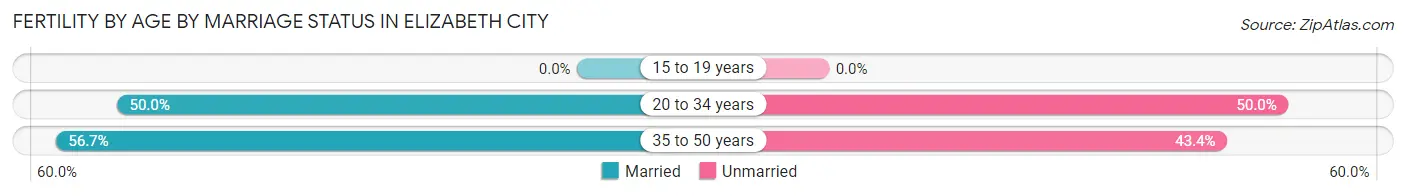
| Age Bracket | Married | Unmarried |
| 15 to 19 years | 0 (0.0%) | 0 (0.0%) |
| 20 to 34 years | 133 (50.0%) | 133 (50.0%) |
| 35 to 50 years | 98 (56.7%) | 75 (43.3%) |
| Total | 231 (52.6%) | 208 (47.4%) |
Fertility by Education in Elizabeth City
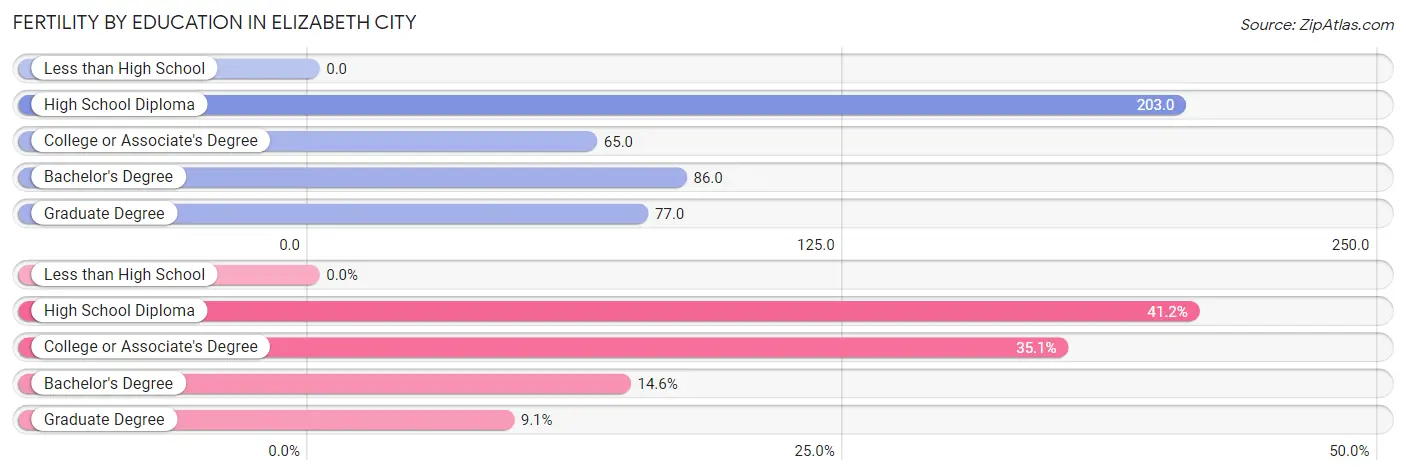
| Educational Attainment | Women with Births | Births / 1,000 Women |
| Less than High School | 0 (0.0%) | 0.0 |
| High School Diploma | 181 (41.2%) | 203.0 |
| College or Associate's Degree | 154 (35.1%) | 65.0 |
| Bachelor's Degree | 64 (14.6%) | 86.0 |
| Graduate Degree | 40 (9.1%) | 77.0 |
| Total | 439 (100.0%) | 88.0 |
Fertility by Education by Marriage Status in Elizabeth City
47.4% of women with births in Elizabeth City are unmarried. Women with the educational attainment of graduate degree are most likely to be married with 100.0% of them married at childbirth, while women with the educational attainment of college or associate's degree are least likely to be married with 64.3% of them unmarried at childbirth.
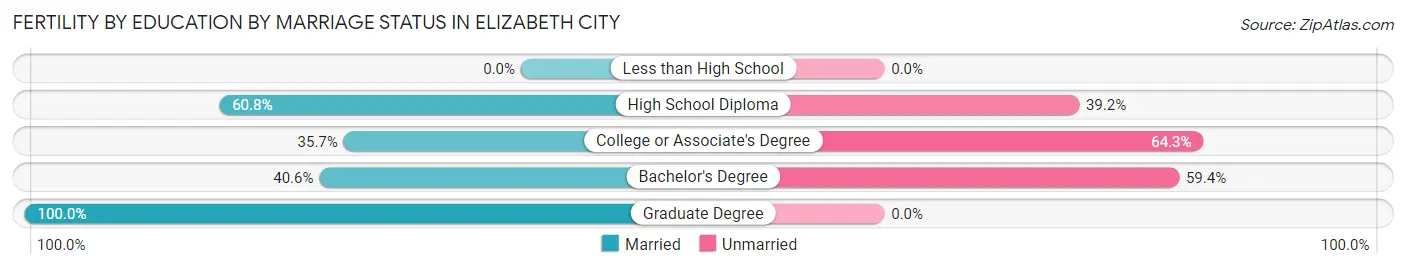
| Educational Attainment | Married | Unmarried |
| Less than High School | 0 (0.0%) | 0 (0.0%) |
| High School Diploma | 110 (60.8%) | 71 (39.2%) |
| College or Associate's Degree | 55 (35.7%) | 99 (64.3%) |
| Bachelor's Degree | 26 (40.6%) | 38 (59.4%) |
| Graduate Degree | 40 (100.0%) | 0 (0.0%) |
| Total | 231 (52.6%) | 208 (47.4%) |
Employment Characteristics in Elizabeth City
Employment by Class of Employer in Elizabeth City
Among the 8,015 employed individuals in Elizabeth City, private company employees (4,372 | 54.5%), state government employees (816 | 10.2%), and not-for-profit organizations (724 | 9.0%) make up the most common classes of employment.
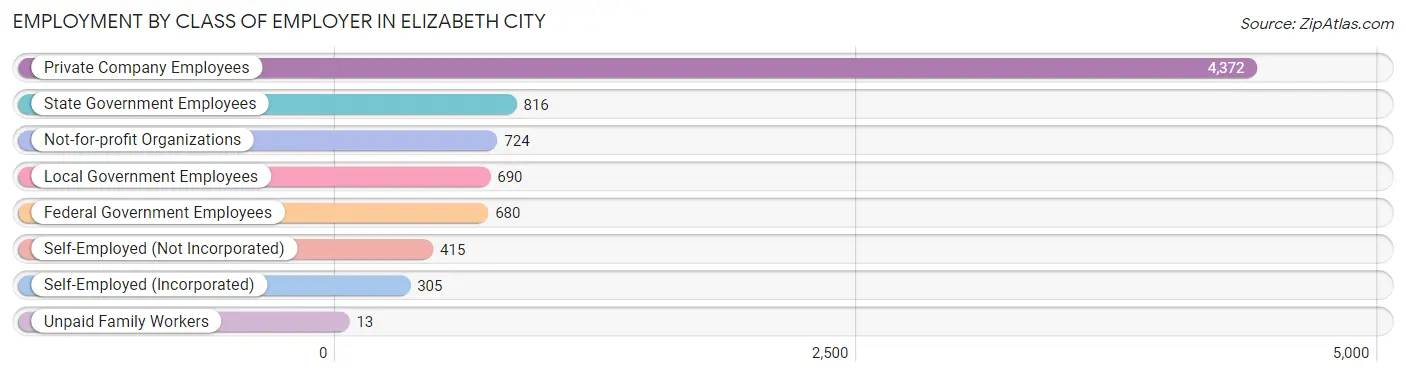
| Employer Class | # Employees | % Employees |
| Private Company Employees | 4,372 | 54.5% |
| Self-Employed (Incorporated) | 305 | 3.8% |
| Self-Employed (Not Incorporated) | 415 | 5.2% |
| Not-for-profit Organizations | 724 | 9.0% |
| Local Government Employees | 690 | 8.6% |
| State Government Employees | 816 | 10.2% |
| Federal Government Employees | 680 | 8.5% |
| Unpaid Family Workers | 13 | 0.2% |
| Total | 8,015 | 100.0% |
Employment Status by Age in Elizabeth City
According to the labor force statistics for Elizabeth City, out of the total population over 16 years of age (14,789), 59.3% or 8,770 individuals are in the labor force, with 8.3% or 728 of them unemployed. The age group with the highest labor force participation rate is 35 to 44 years, with 91.0% or 2,297 individuals in the labor force. Within the labor force, the 16 to 19 years age range has the highest percentage of unemployed individuals, with 40.1% or 141 of them being unemployed.
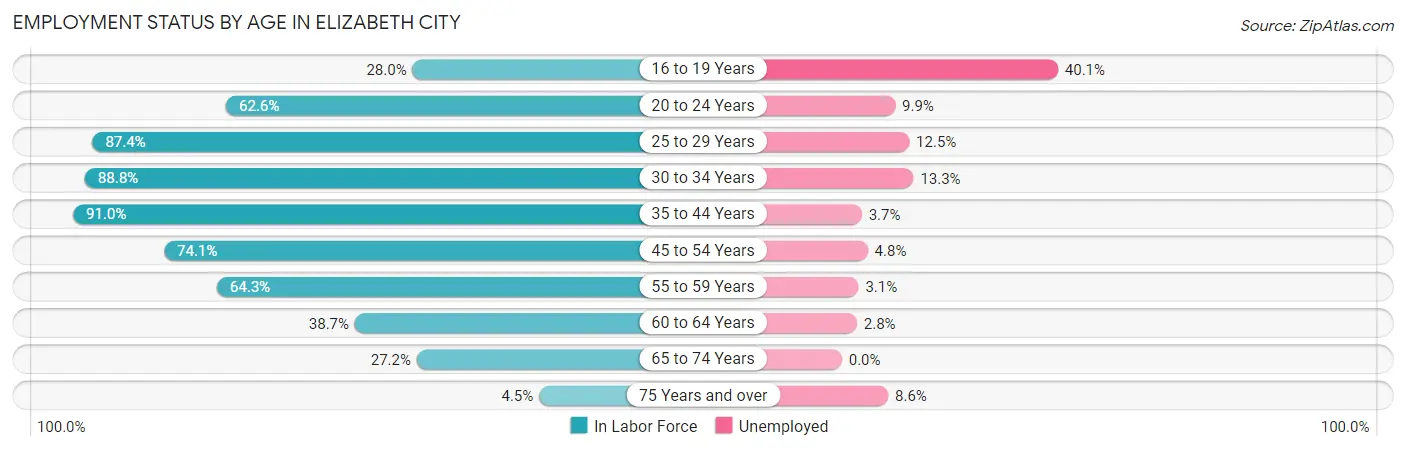
| Age Bracket | In Labor Force | Unemployed |
| 16 to 19 Years | 352 (28.0%) | 141 (40.1%) |
| 20 to 24 Years | 1,000 (62.6%) | 99 (9.9%) |
| 25 to 29 Years | 1,171 (87.4%) | 146 (12.5%) |
| 30 to 34 Years | 1,214 (88.8%) | 161 (13.3%) |
| 35 to 44 Years | 2,297 (91.0%) | 85 (3.7%) |
| 45 to 54 Years | 1,220 (74.1%) | 59 (4.8%) |
| 55 to 59 Years | 647 (64.3%) | 20 (3.1%) |
| 60 to 64 Years | 386 (38.7%) | 11 (2.8%) |
| 65 to 74 Years | 406 (27.2%) | 0 (0.0%) |
| 75 Years and over | 70 (4.5%) | 6 (8.6%) |
| Total | 8,770 (59.3%) | 728 (8.3%) |
Employment Status by Educational Attainment in Elizabeth City
According to labor force statistics for Elizabeth City, 78.1% of individuals (6,936) out of the total population between 25 and 64 years of age (8,881) are in the labor force, with 6.9% or 479 of them being unemployed. The group with the highest labor force participation rate are those with the educational attainment of bachelor's degree or higher, with 91.7% or 2,309 individuals in the labor force. Within the labor force, individuals with less than high school education have the highest percentage of unemployment, with 18.6% or 45 of them being unemployed.
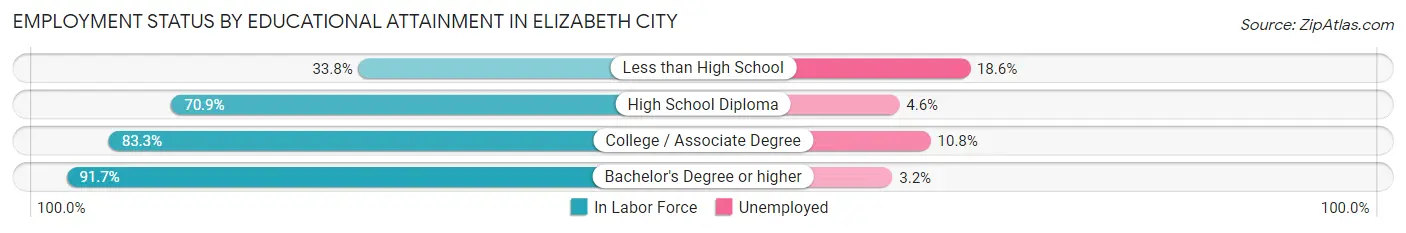
| Educational Attainment | In Labor Force | Unemployed |
| Less than High School | 241 (33.8%) | 133 (18.6%) |
| High School Diploma | 1,835 (70.9%) | 119 (4.6%) |
| College / Associate Degree | 2,551 (83.3%) | 331 (10.8%) |
| Bachelor's Degree or higher | 2,309 (91.7%) | 81 (3.2%) |
| Total | 6,936 (78.1%) | 613 (6.9%) |
Employment Occupations by Sex in Elizabeth City
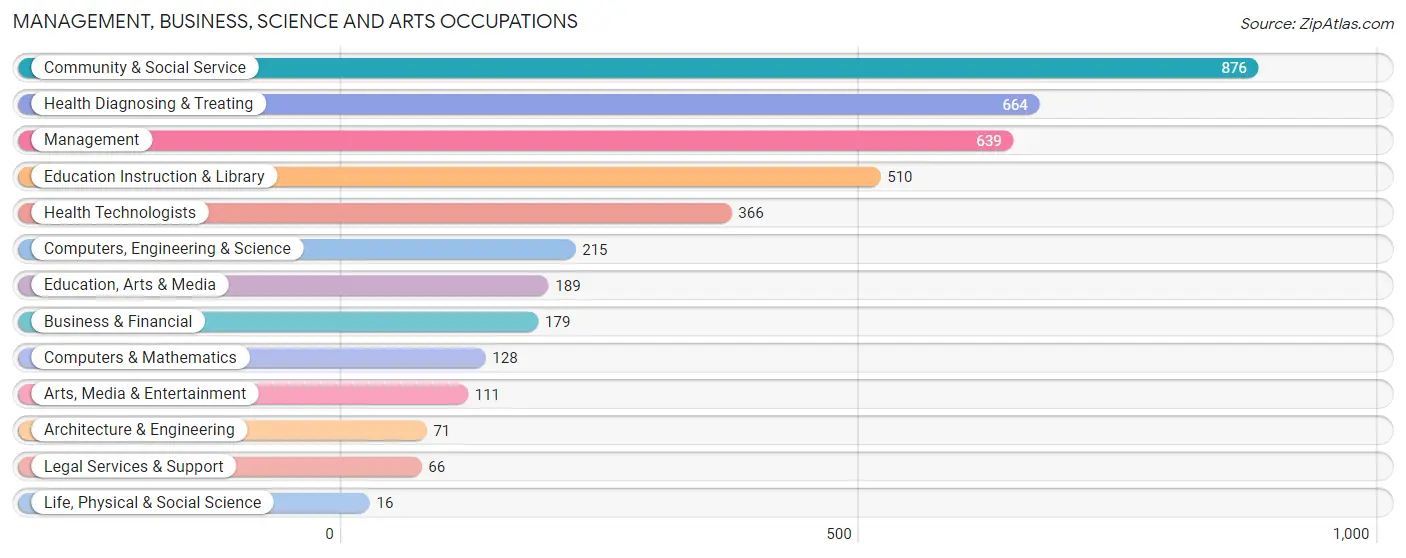
Management, Business, Science and Arts Occupations
The most common Management, Business, Science and Arts occupations in Elizabeth City are Community & Social Service (876 | 11.3%), Health Diagnosing & Treating (664 | 8.6%), Management (639 | 8.3%), Education Instruction & Library (510 | 6.6%), and Health Technologists (366 | 4.7%).
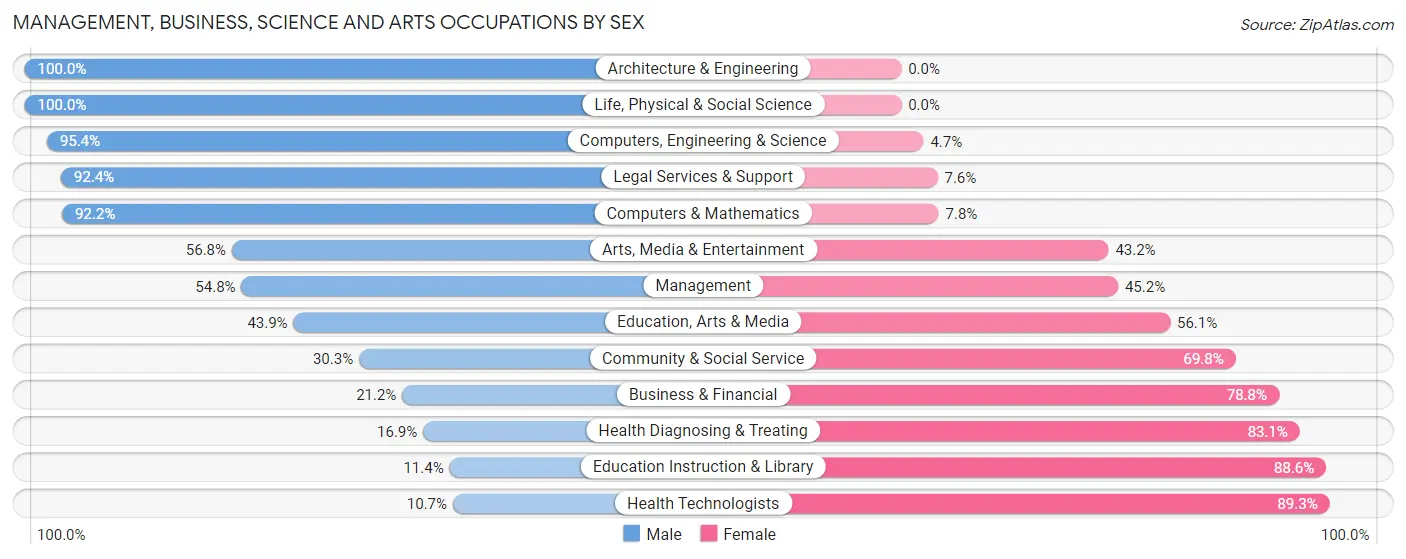
Management, Business, Science and Arts Occupations by Sex
Within the Management, Business, Science and Arts occupations in Elizabeth City, the most male-oriented occupations are Architecture & Engineering (100.0%), Life, Physical & Social Science (100.0%), and Computers, Engineering & Science (95.4%), while the most female-oriented occupations are Health Technologists (89.3%), Education Instruction & Library (88.6%), and Health Diagnosing & Treating (83.1%).
| Occupation | Male | Female |
| Management | 350 (54.8%) | 289 (45.2%) |
| Business & Financial | 38 (21.2%) | 141 (78.8%) |
| Computers, Engineering & Science | 205 (95.4%) | 10 (4.6%) |
| Computers & Mathematics | 118 (92.2%) | 10 (7.8%) |
| Architecture & Engineering | 71 (100.0%) | 0 (0.0%) |
| Life, Physical & Social Science | 16 (100.0%) | 0 (0.0%) |
| Community & Social Service | 265 (30.2%) | 611 (69.8%) |
| Education, Arts & Media | 83 (43.9%) | 106 (56.1%) |
| Legal Services & Support | 61 (92.4%) | 5 (7.6%) |
| Education Instruction & Library | 58 (11.4%) | 452 (88.6%) |
| Arts, Media & Entertainment | 63 (56.8%) | 48 (43.2%) |
| Health Diagnosing & Treating | 112 (16.9%) | 552 (83.1%) |
| Health Technologists | 39 (10.7%) | 327 (89.3%) |
| Total (Category) | 970 (37.7%) | 1,603 (62.3%) |
| Total (Overall) | 3,502 (45.3%) | 4,237 (54.7%) |
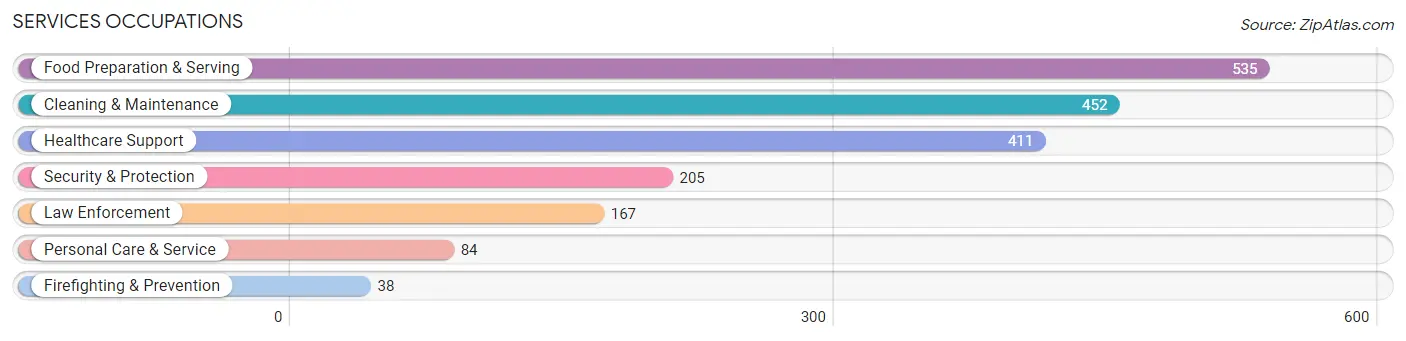
Services Occupations
The most common Services occupations in Elizabeth City are Food Preparation & Serving (535 | 6.9%), Cleaning & Maintenance (452 | 5.8%), Healthcare Support (411 | 5.3%), Security & Protection (205 | 2.6%), and Law Enforcement (167 | 2.2%).
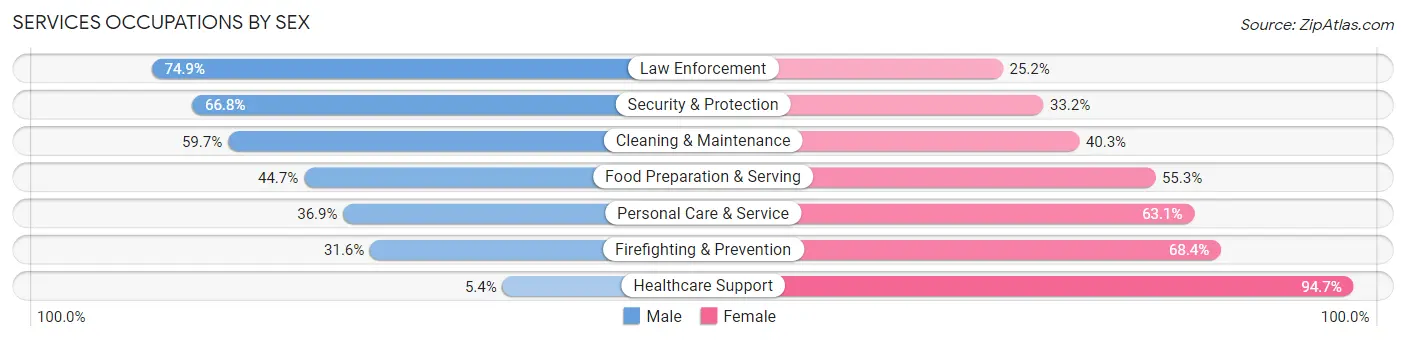
Services Occupations by Sex
Within the Services occupations in Elizabeth City, the most male-oriented occupations are Law Enforcement (74.9%), Security & Protection (66.8%), and Cleaning & Maintenance (59.7%), while the most female-oriented occupations are Healthcare Support (94.7%), Firefighting & Prevention (68.4%), and Personal Care & Service (63.1%).
| Occupation | Male | Female |
| Healthcare Support | 22 (5.3%) | 389 (94.7%) |
| Security & Protection | 137 (66.8%) | 68 (33.2%) |
| Firefighting & Prevention | 12 (31.6%) | 26 (68.4%) |
| Law Enforcement | 125 (74.9%) | 42 (25.2%) |
| Food Preparation & Serving | 239 (44.7%) | 296 (55.3%) |
| Cleaning & Maintenance | 270 (59.7%) | 182 (40.3%) |
| Personal Care & Service | 31 (36.9%) | 53 (63.1%) |
| Total (Category) | 699 (41.4%) | 988 (58.6%) |
| Total (Overall) | 3,502 (45.3%) | 4,237 (54.7%) |
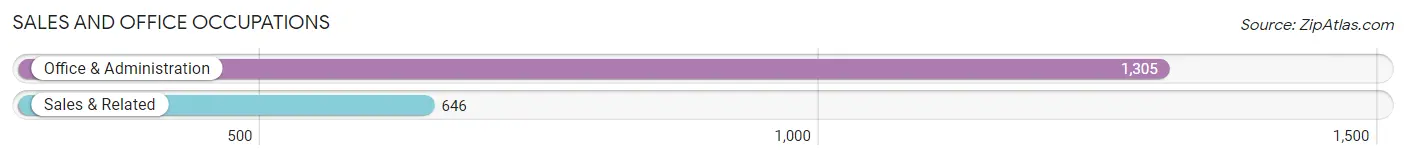
Sales and Office Occupations
The most common Sales and Office occupations in Elizabeth City are Office & Administration (1,305 | 16.9%), and Sales & Related (646 | 8.4%).
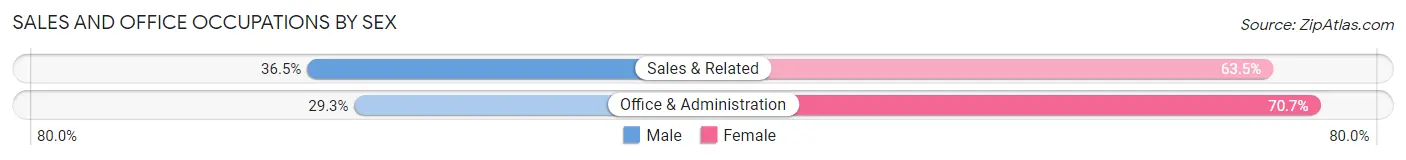
Sales and Office Occupations by Sex
| Occupation | Male | Female |
| Sales & Related | 236 (36.5%) | 410 (63.5%) |
| Office & Administration | 382 (29.3%) | 923 (70.7%) |
| Total (Category) | 618 (31.7%) | 1,333 (68.3%) |
| Total (Overall) | 3,502 (45.3%) | 4,237 (54.7%) |
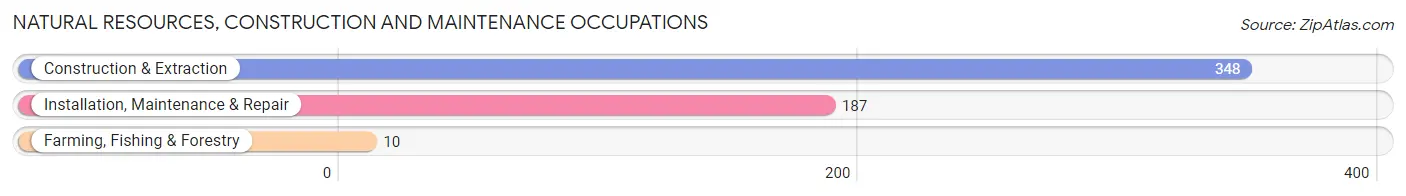
Natural Resources, Construction and Maintenance Occupations
The most common Natural Resources, Construction and Maintenance occupations in Elizabeth City are Construction & Extraction (348 | 4.5%), Installation, Maintenance & Repair (187 | 2.4%), and Farming, Fishing & Forestry (10 | 0.1%).
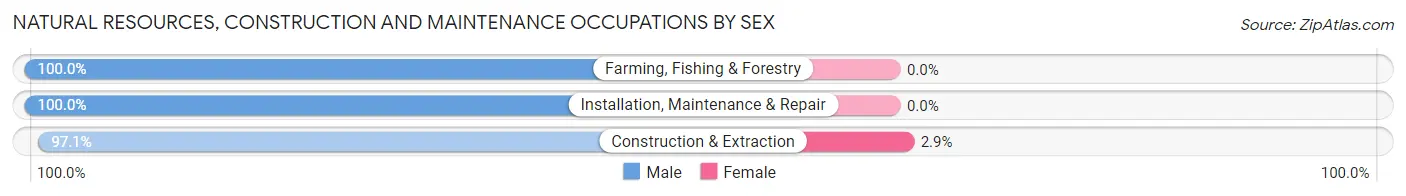
Natural Resources, Construction and Maintenance Occupations by Sex
| Occupation | Male | Female |
| Farming, Fishing & Forestry | 10 (100.0%) | 0 (0.0%) |
| Construction & Extraction | 338 (97.1%) | 10 (2.9%) |
| Installation, Maintenance & Repair | 187 (100.0%) | 0 (0.0%) |
| Total (Category) | 535 (98.2%) | 10 (1.8%) |
| Total (Overall) | 3,502 (45.3%) | 4,237 (54.7%) |
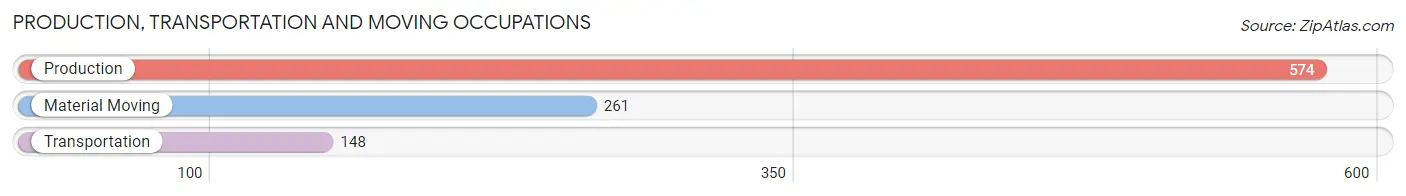
Production, Transportation and Moving Occupations
The most common Production, Transportation and Moving occupations in Elizabeth City are Production (574 | 7.4%), Material Moving (261 | 3.4%), and Transportation (148 | 1.9%).
Production, Transportation and Moving Occupations by Sex
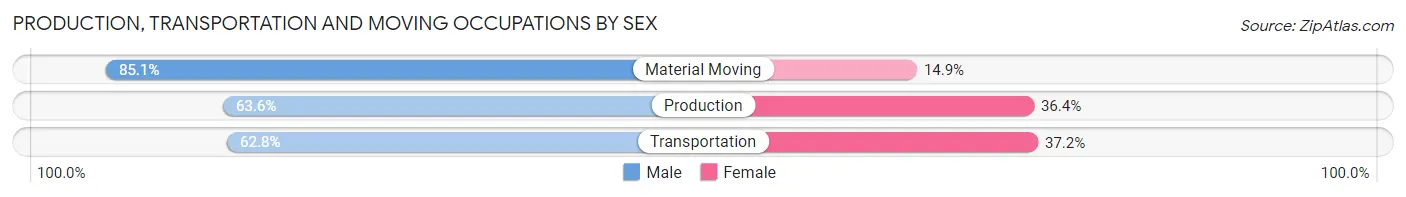
| Occupation | Male | Female |
| Production | 365 (63.6%) | 209 (36.4%) |
| Transportation | 93 (62.8%) | 55 (37.2%) |
| Material Moving | 222 (85.1%) | 39 (14.9%) |
| Total (Category) | 680 (69.2%) | 303 (30.8%) |
| Total (Overall) | 3,502 (45.3%) | 4,237 (54.7%) |
Employment Industries by Sex in Elizabeth City
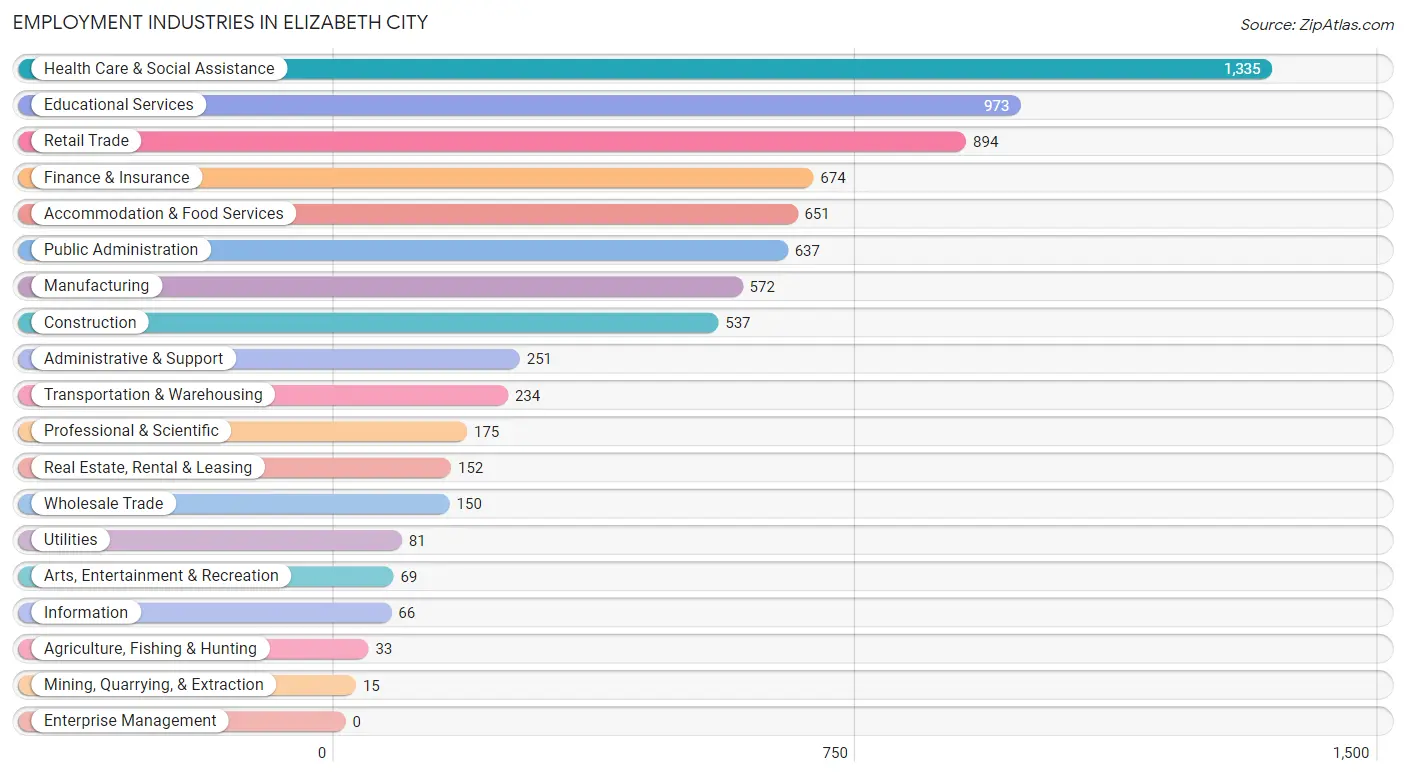
Employment Industries in Elizabeth City
The major employment industries in Elizabeth City include Health Care & Social Assistance (1,335 | 17.2%), Educational Services (973 | 12.6%), Retail Trade (894 | 11.6%), Finance & Insurance (674 | 8.7%), and Accommodation & Food Services (651 | 8.4%).
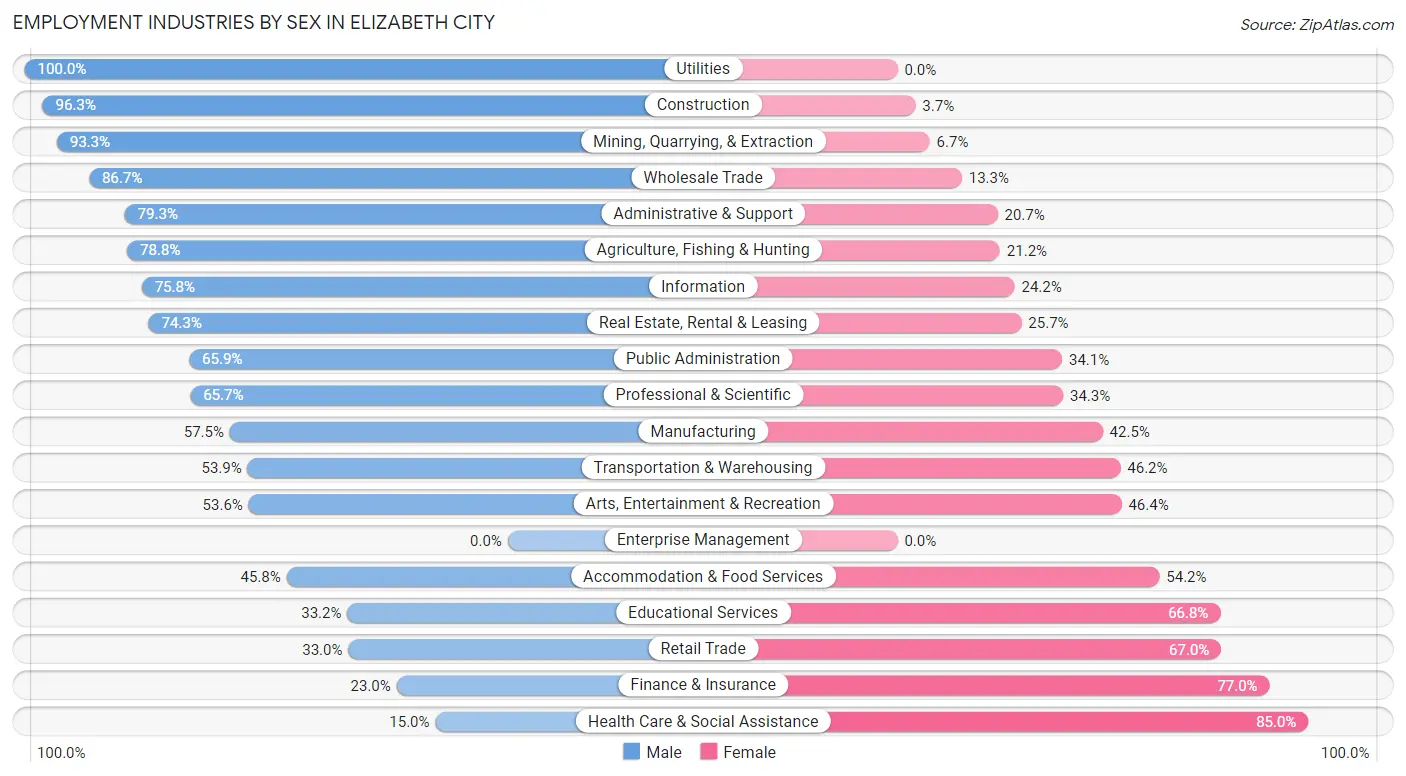
Employment Industries by Sex in Elizabeth City
The Elizabeth City industries that see more men than women are Utilities (100.0%), Construction (96.3%), and Mining, Quarrying, & Extraction (93.3%), whereas the industries that tend to have a higher number of women are Health Care & Social Assistance (85.0%), Finance & Insurance (77.0%), and Retail Trade (67.0%).
| Industry | Male | Female |
| Agriculture, Fishing & Hunting | 26 (78.8%) | 7 (21.2%) |
| Mining, Quarrying, & Extraction | 14 (93.3%) | 1 (6.7%) |
| Construction | 517 (96.3%) | 20 (3.7%) |
| Manufacturing | 329 (57.5%) | 243 (42.5%) |
| Wholesale Trade | 130 (86.7%) | 20 (13.3%) |
| Retail Trade | 295 (33.0%) | 599 (67.0%) |
| Transportation & Warehousing | 126 (53.8%) | 108 (46.2%) |
| Utilities | 81 (100.0%) | 0 (0.0%) |
| Information | 50 (75.8%) | 16 (24.2%) |
| Finance & Insurance | 155 (23.0%) | 519 (77.0%) |
| Real Estate, Rental & Leasing | 113 (74.3%) | 39 (25.7%) |
| Professional & Scientific | 115 (65.7%) | 60 (34.3%) |
| Enterprise Management | 0 (0.0%) | 0 (0.0%) |
| Administrative & Support | 199 (79.3%) | 52 (20.7%) |
| Educational Services | 323 (33.2%) | 650 (66.8%) |
| Health Care & Social Assistance | 200 (15.0%) | 1,135 (85.0%) |
| Arts, Entertainment & Recreation | 37 (53.6%) | 32 (46.4%) |
| Accommodation & Food Services | 298 (45.8%) | 353 (54.2%) |
| Public Administration | 420 (65.9%) | 217 (34.1%) |
| Total | 3,502 (45.3%) | 4,237 (54.7%) |
Education in Elizabeth City
School Enrollment in Elizabeth City
The most common levels of schooling among the 5,133 students in Elizabeth City are college / undergraduate (1,919 | 37.4%), middle school (1,082 | 21.1%), and elementary school (872 | 17.0%).
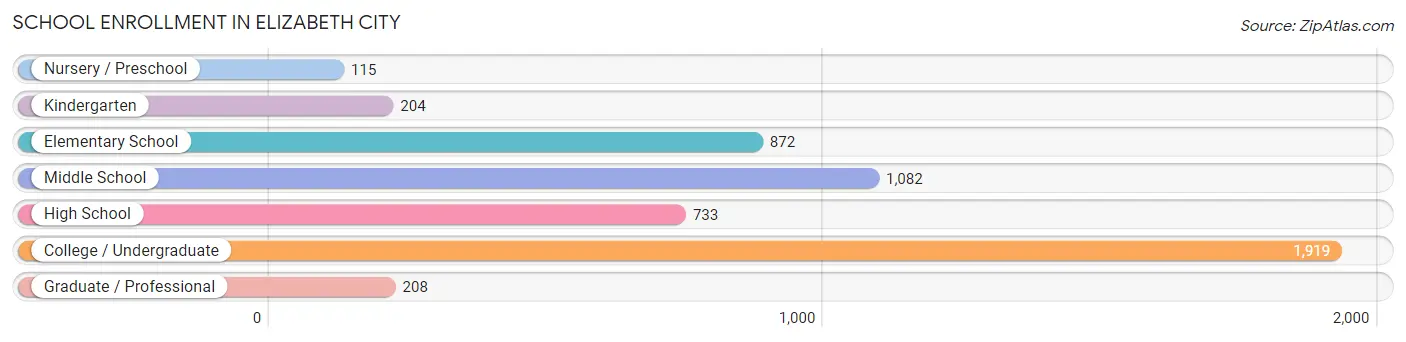
| School Level | # Students | % Students |
| Nursery / Preschool | 115 | 2.2% |
| Kindergarten | 204 | 4.0% |
| Elementary School | 872 | 17.0% |
| Middle School | 1,082 | 21.1% |
| High School | 733 | 14.3% |
| College / Undergraduate | 1,919 | 37.4% |
| Graduate / Professional | 208 | 4.1% |
| Total | 5,133 | 100.0% |
School Enrollment by Age by Funding Source in Elizabeth City
Out of a total of 5,133 students who are enrolled in schools in Elizabeth City, 498 (9.7%) attend a private institution, while the remaining 4,635 (90.3%) are enrolled in public schools. The age group of 35 years and over has the highest likelihood of being enrolled in private schools, with 62 (36.0% in the age bracket) enrolled. Conversely, the age group of 5 to 9 year old has the lowest likelihood of being enrolled in a private school, with 915 (100.0% in the age bracket) attending a public institution.
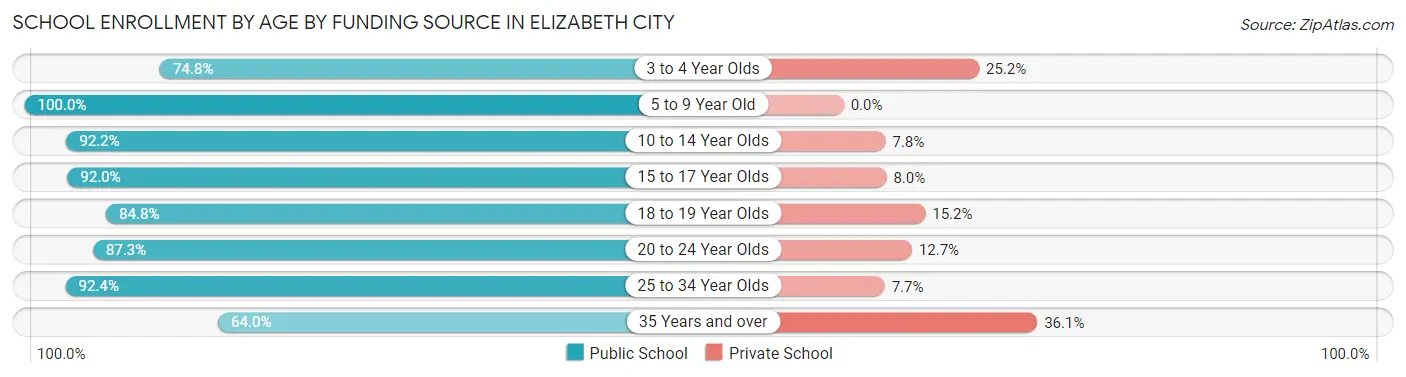
| Age Bracket | Public School | Private School |
| 3 to 4 Year Olds | 86 (74.8%) | 29 (25.2%) |
| 5 to 9 Year Old | 915 (100.0%) | 0 (0.0%) |
| 10 to 14 Year Olds | 1,174 (92.2%) | 99 (7.8%) |
| 15 to 17 Year Olds | 577 (92.0%) | 50 (8.0%) |
| 18 to 19 Year Olds | 625 (84.8%) | 112 (15.2%) |
| 20 to 24 Year Olds | 810 (87.3%) | 118 (12.7%) |
| 25 to 34 Year Olds | 338 (92.3%) | 28 (7.6%) |
| 35 Years and over | 110 (63.9%) | 62 (36.0%) |
| Total | 4,635 (90.3%) | 498 (9.7%) |
Educational Attainment by Field of Study in Elizabeth City
Education (703 | 20.8%), business (579 | 17.2%), arts & humanities (344 | 10.2%), computers & mathematics (338 | 10.0%), and liberal arts & history (228 | 6.8%) are the most common fields of study among 3,371 individuals in Elizabeth City who have obtained a bachelor's degree or higher.
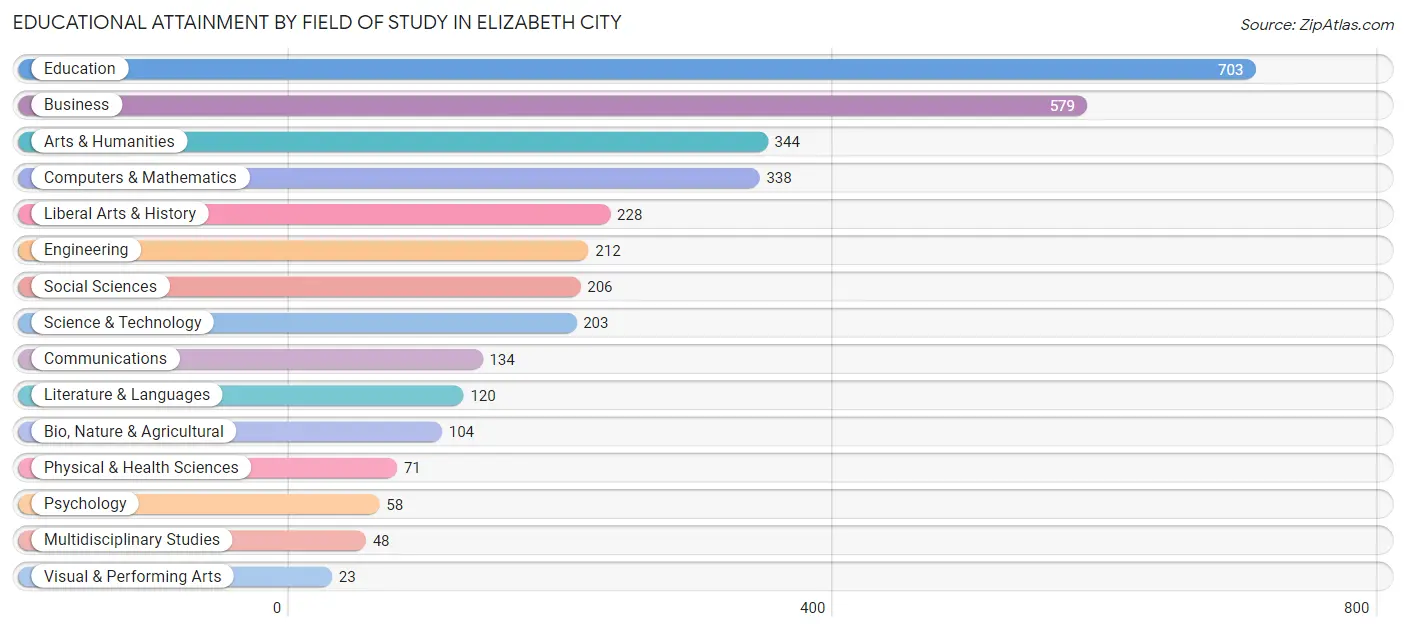
| Field of Study | # Graduates | % Graduates |
| Computers & Mathematics | 338 | 10.0% |
| Bio, Nature & Agricultural | 104 | 3.1% |
| Physical & Health Sciences | 71 | 2.1% |
| Psychology | 58 | 1.7% |
| Social Sciences | 206 | 6.1% |
| Engineering | 212 | 6.3% |
| Multidisciplinary Studies | 48 | 1.4% |
| Science & Technology | 203 | 6.0% |
| Business | 579 | 17.2% |
| Education | 703 | 20.8% |
| Literature & Languages | 120 | 3.6% |
| Liberal Arts & History | 228 | 6.8% |
| Visual & Performing Arts | 23 | 0.7% |
| Communications | 134 | 4.0% |
| Arts & Humanities | 344 | 10.2% |
| Total | 3,371 | 100.0% |
Transportation & Commute in Elizabeth City
Vehicle Availability by Sex in Elizabeth City
The most prevalent vehicle ownership categories in Elizabeth City are males with 2 vehicles (1,489, accounting for 40.6%) and females with 2 vehicles (1,595, making up 36.1%).
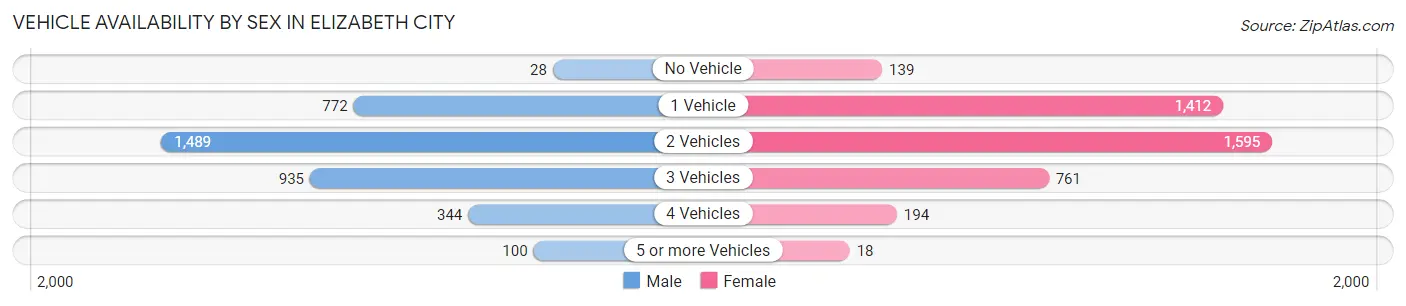
| Vehicles Available | Male | Female |
| No Vehicle | 28 (0.8%) | 139 (3.4%) |
| 1 Vehicle | 772 (21.0%) | 1,412 (34.3%) |
| 2 Vehicles | 1,489 (40.6%) | 1,595 (38.7%) |
| 3 Vehicles | 935 (25.5%) | 761 (18.5%) |
| 4 Vehicles | 344 (9.4%) | 194 (4.7%) |
| 5 or more Vehicles | 100 (2.7%) | 18 (0.4%) |
| Total | 3,668 (100.0%) | 4,119 (100.0%) |
Commute Time in Elizabeth City
The most frequently occuring commute durations in Elizabeth City are 10 to 14 minutes (1,845 commuters, 25.2%), 5 to 9 minutes (1,585 commuters, 21.7%), and 15 to 19 minutes (1,143 commuters, 15.6%).
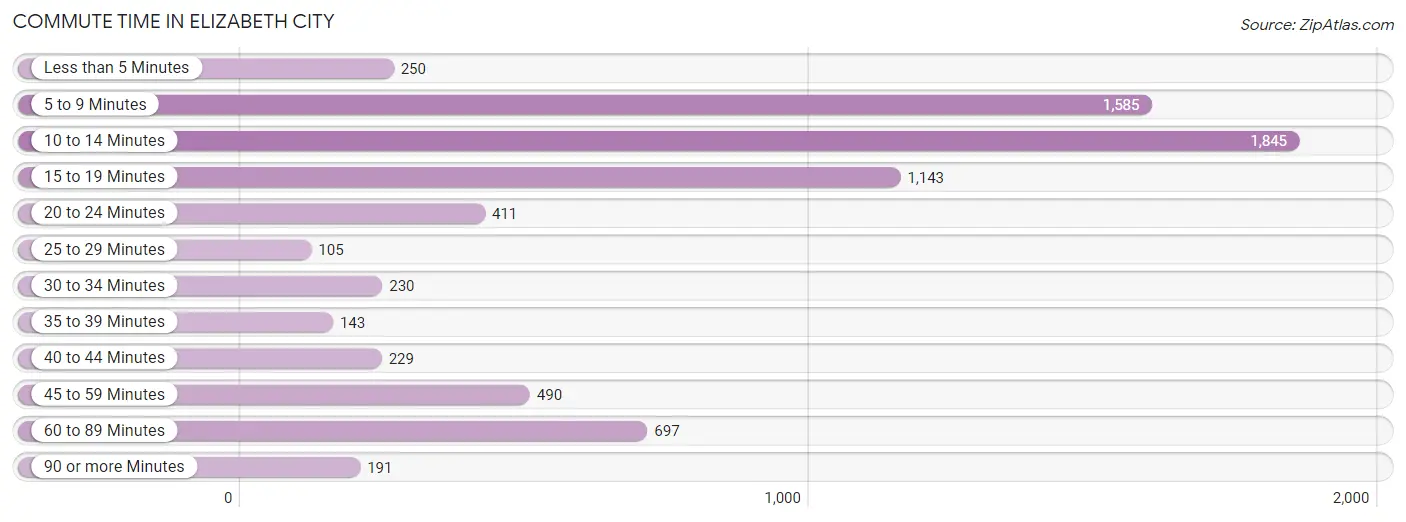
| Commute Time | # Commuters | % Commuters |
| Less than 5 Minutes | 250 | 3.4% |
| 5 to 9 Minutes | 1,585 | 21.7% |
| 10 to 14 Minutes | 1,845 | 25.2% |
| 15 to 19 Minutes | 1,143 | 15.6% |
| 20 to 24 Minutes | 411 | 5.6% |
| 25 to 29 Minutes | 105 | 1.4% |
| 30 to 34 Minutes | 230 | 3.1% |
| 35 to 39 Minutes | 143 | 1.9% |
| 40 to 44 Minutes | 229 | 3.1% |
| 45 to 59 Minutes | 490 | 6.7% |
| 60 to 89 Minutes | 697 | 9.5% |
| 90 or more Minutes | 191 | 2.6% |
Commute Time by Sex in Elizabeth City
The most common commute times in Elizabeth City are 10 to 14 minutes (682 commuters, 19.7%) for males and 10 to 14 minutes (1,163 commuters, 30.2%) for females.
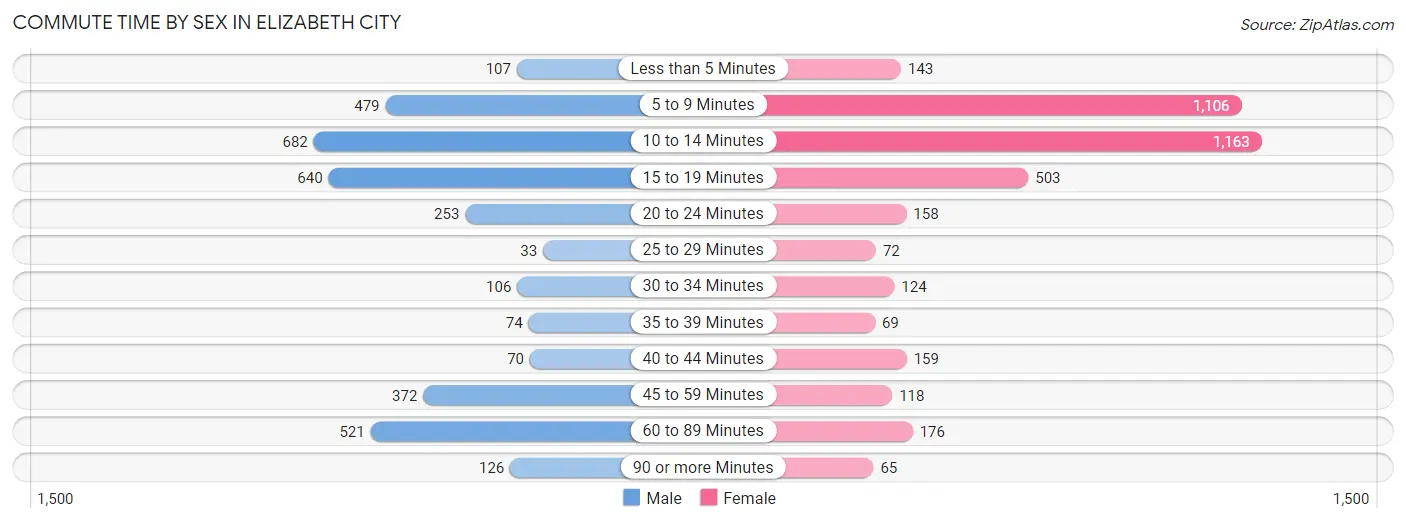
| Commute Time | Male | Female |
| Less than 5 Minutes | 107 (3.1%) | 143 (3.7%) |
| 5 to 9 Minutes | 479 (13.8%) | 1,106 (28.7%) |
| 10 to 14 Minutes | 682 (19.7%) | 1,163 (30.2%) |
| 15 to 19 Minutes | 640 (18.5%) | 503 (13.0%) |
| 20 to 24 Minutes | 253 (7.3%) | 158 (4.1%) |
| 25 to 29 Minutes | 33 (0.9%) | 72 (1.9%) |
| 30 to 34 Minutes | 106 (3.1%) | 124 (3.2%) |
| 35 to 39 Minutes | 74 (2.1%) | 69 (1.8%) |
| 40 to 44 Minutes | 70 (2.0%) | 159 (4.1%) |
| 45 to 59 Minutes | 372 (10.7%) | 118 (3.1%) |
| 60 to 89 Minutes | 521 (15.0%) | 176 (4.6%) |
| 90 or more Minutes | 126 (3.6%) | 65 (1.7%) |
Time of Departure to Work by Sex in Elizabeth City
The most frequent times of departure to work in Elizabeth City are 7:00 AM to 7:29 AM (533, 15.4%) for males and 7:30 AM to 7:59 AM (718, 18.6%) for females.
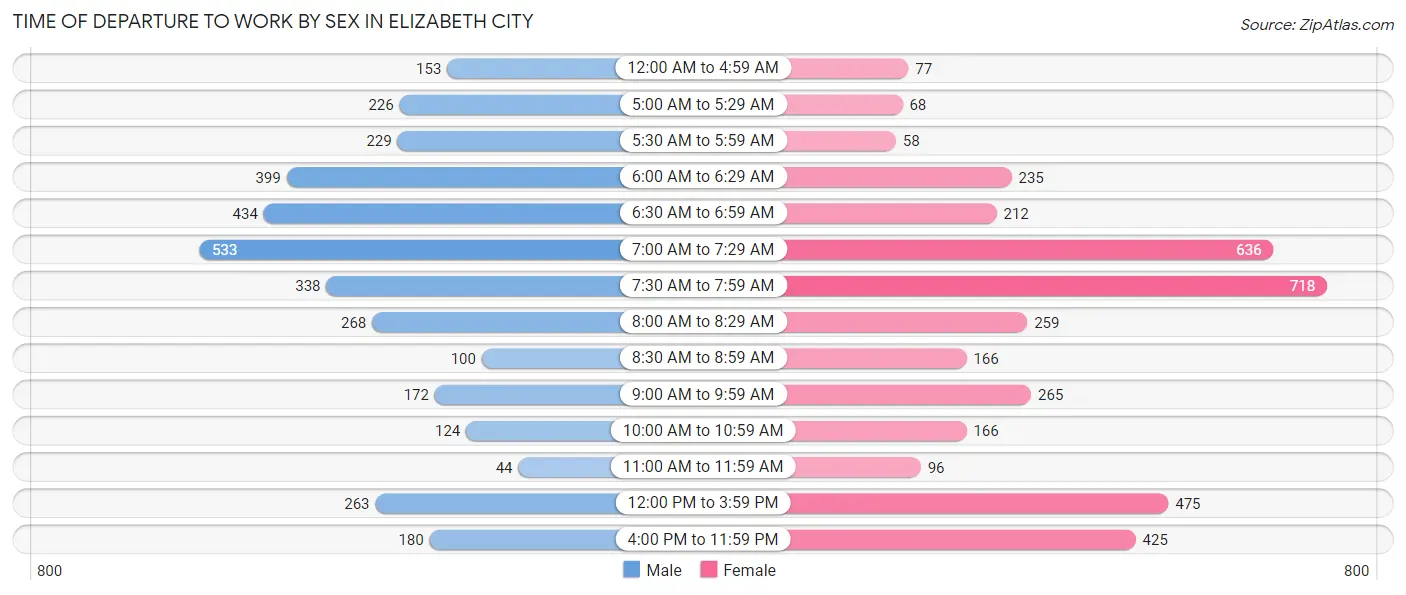
| Time of Departure | Male | Female |
| 12:00 AM to 4:59 AM | 153 (4.4%) | 77 (2.0%) |
| 5:00 AM to 5:29 AM | 226 (6.5%) | 68 (1.8%) |
| 5:30 AM to 5:59 AM | 229 (6.6%) | 58 (1.5%) |
| 6:00 AM to 6:29 AM | 399 (11.5%) | 235 (6.1%) |
| 6:30 AM to 6:59 AM | 434 (12.5%) | 212 (5.5%) |
| 7:00 AM to 7:29 AM | 533 (15.4%) | 636 (16.5%) |
| 7:30 AM to 7:59 AM | 338 (9.8%) | 718 (18.6%) |
| 8:00 AM to 8:29 AM | 268 (7.7%) | 259 (6.7%) |
| 8:30 AM to 8:59 AM | 100 (2.9%) | 166 (4.3%) |
| 9:00 AM to 9:59 AM | 172 (5.0%) | 265 (6.9%) |
| 10:00 AM to 10:59 AM | 124 (3.6%) | 166 (4.3%) |
| 11:00 AM to 11:59 AM | 44 (1.3%) | 96 (2.5%) |
| 12:00 PM to 3:59 PM | 263 (7.6%) | 475 (12.3%) |
| 4:00 PM to 11:59 PM | 180 (5.2%) | 425 (11.0%) |
| Total | 3,463 (100.0%) | 3,856 (100.0%) |
Housing Occupancy in Elizabeth City
Occupancy by Ownership in Elizabeth City
Of the total 7,103 dwellings in Elizabeth City, owner-occupied units account for 3,042 (42.8%), while renter-occupied units make up 4,061 (57.2%).
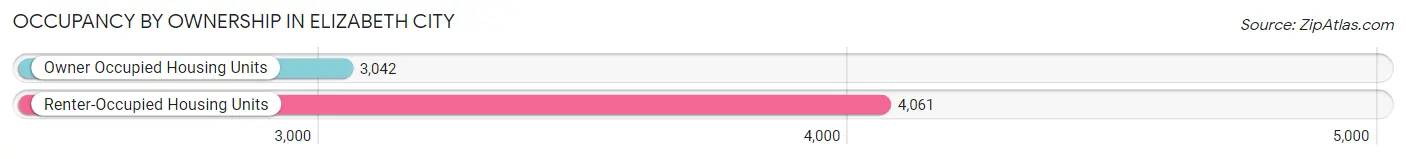
| Occupancy | # Housing Units | % Housing Units |
| Owner Occupied Housing Units | 3,042 | 42.8% |
| Renter-Occupied Housing Units | 4,061 | 57.2% |
| Total Occupied Housing Units | 7,103 | 100.0% |
Occupancy by Household Size in Elizabeth City
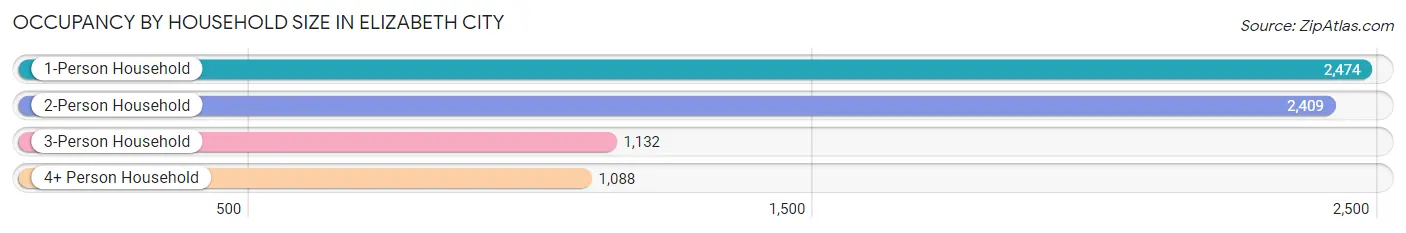
| Household Size | # Housing Units | % Housing Units |
| 1-Person Household | 2,474 | 34.8% |
| 2-Person Household | 2,409 | 33.9% |
| 3-Person Household | 1,132 | 15.9% |
| 4+ Person Household | 1,088 | 15.3% |
| Total Housing Units | 7,103 | 100.0% |
Occupancy by Ownership by Household Size in Elizabeth City
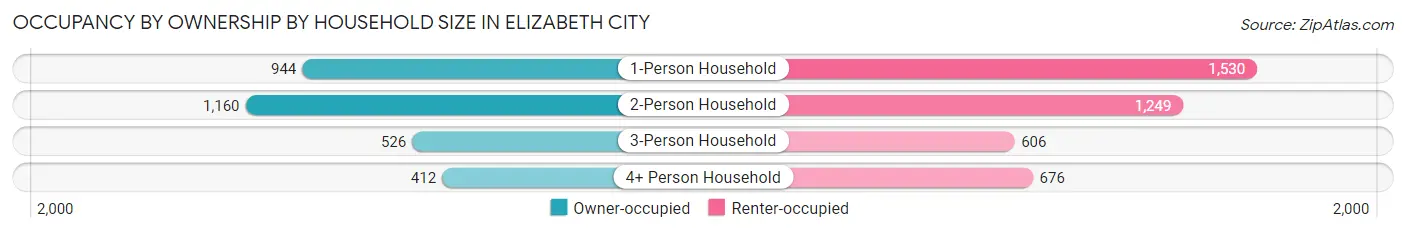
| Household Size | Owner-occupied | Renter-occupied |
| 1-Person Household | 944 (38.2%) | 1,530 (61.8%) |
| 2-Person Household | 1,160 (48.1%) | 1,249 (51.8%) |
| 3-Person Household | 526 (46.5%) | 606 (53.5%) |
| 4+ Person Household | 412 (37.9%) | 676 (62.1%) |
| Total Housing Units | 3,042 (42.8%) | 4,061 (57.2%) |
Occupancy by Educational Attainment in Elizabeth City
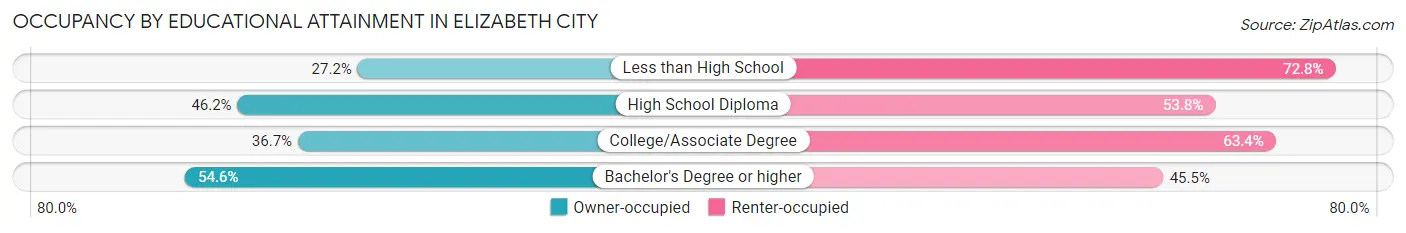
| Household Size | Owner-occupied | Renter-occupied |
| Less than High School | 175 (27.2%) | 469 (72.8%) |
| High School Diploma | 836 (46.2%) | 972 (53.8%) |
| College/Associate Degree | 1,036 (36.6%) | 1,791 (63.3%) |
| Bachelor's Degree or higher | 995 (54.5%) | 829 (45.5%) |
Occupancy by Age of Householder in Elizabeth City
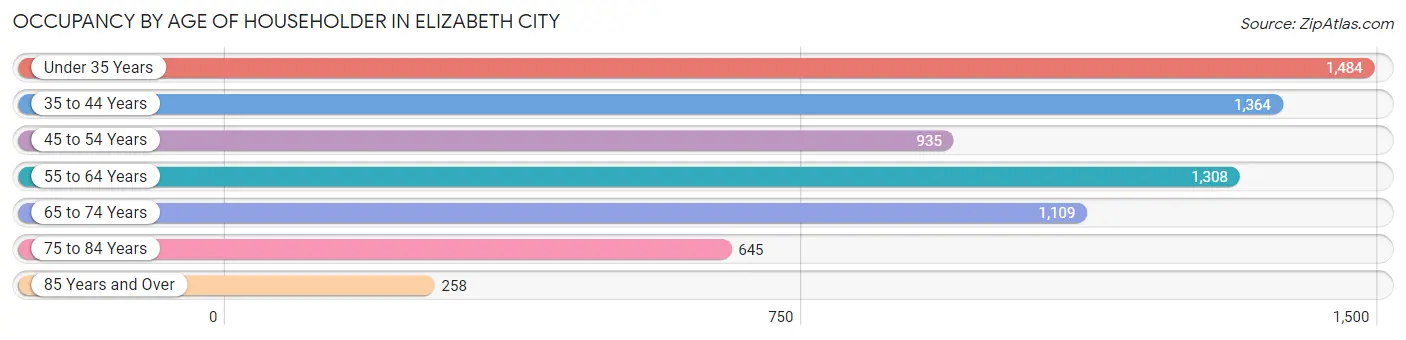
| Age Bracket | # Households | % Households |
| Under 35 Years | 1,484 | 20.9% |
| 35 to 44 Years | 1,364 | 19.2% |
| 45 to 54 Years | 935 | 13.2% |
| 55 to 64 Years | 1,308 | 18.4% |
| 65 to 74 Years | 1,109 | 15.6% |
| 75 to 84 Years | 645 | 9.1% |
| 85 Years and Over | 258 | 3.6% |
| Total | 7,103 | 100.0% |
Housing Finances in Elizabeth City
Median Income by Occupancy in Elizabeth City
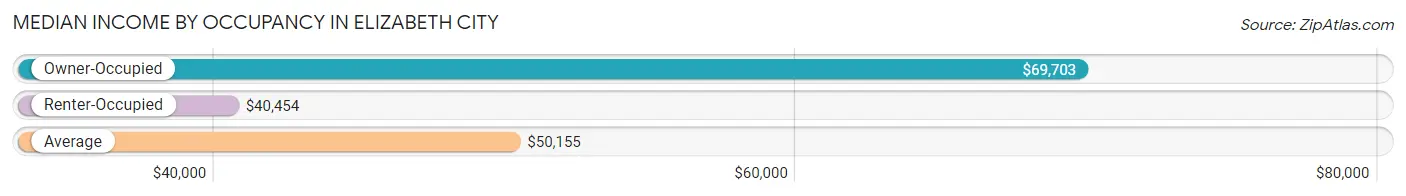
| Occupancy Type | # Households | Median Income |
| Owner-Occupied | 3,042 (42.8%) | $69,703 |
| Renter-Occupied | 4,061 (57.2%) | $40,454 |
| Average | 7,103 (100.0%) | $50,155 |
Occupancy by Householder Income Bracket in Elizabeth City
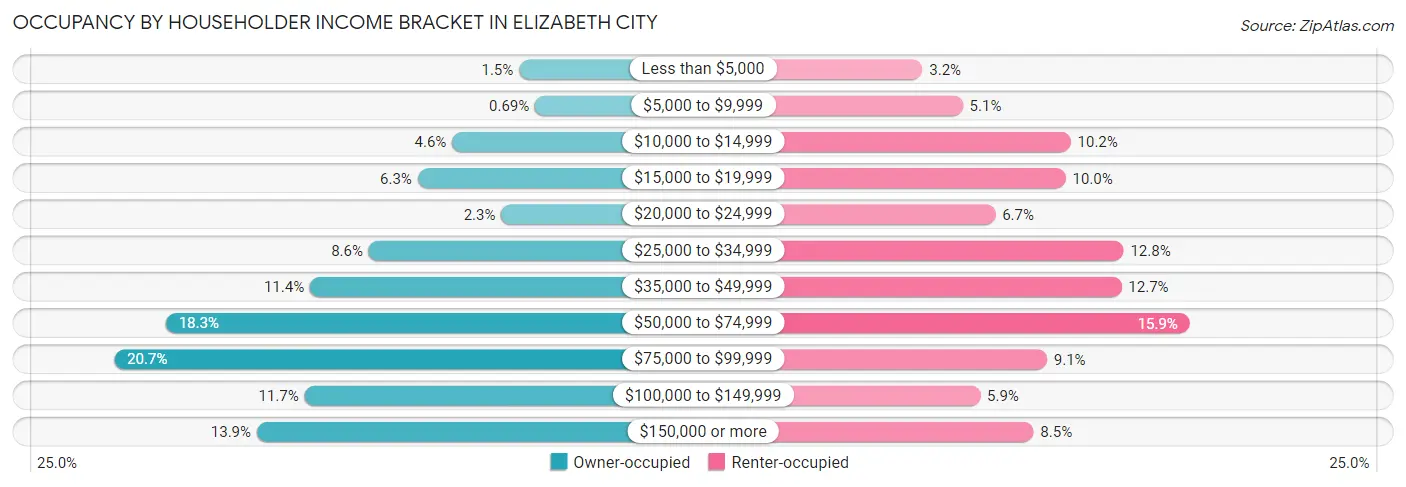
| Income Bracket | Owner-occupied | Renter-occupied |
| Less than $5,000 | 44 (1.5%) | 129 (3.2%) |
| $5,000 to $9,999 | 21 (0.7%) | 207 (5.1%) |
| $10,000 to $14,999 | 141 (4.6%) | 416 (10.2%) |
| $15,000 to $19,999 | 191 (6.3%) | 406 (10.0%) |
| $20,000 to $24,999 | 70 (2.3%) | 270 (6.7%) |
| $25,000 to $34,999 | 262 (8.6%) | 518 (12.8%) |
| $35,000 to $49,999 | 347 (11.4%) | 514 (12.7%) |
| $50,000 to $74,999 | 556 (18.3%) | 646 (15.9%) |
| $75,000 to $99,999 | 631 (20.7%) | 370 (9.1%) |
| $100,000 to $149,999 | 355 (11.7%) | 241 (5.9%) |
| $150,000 or more | 424 (13.9%) | 344 (8.5%) |
| Total | 3,042 (100.0%) | 4,061 (100.0%) |
Monthly Housing Cost Tiers in Elizabeth City
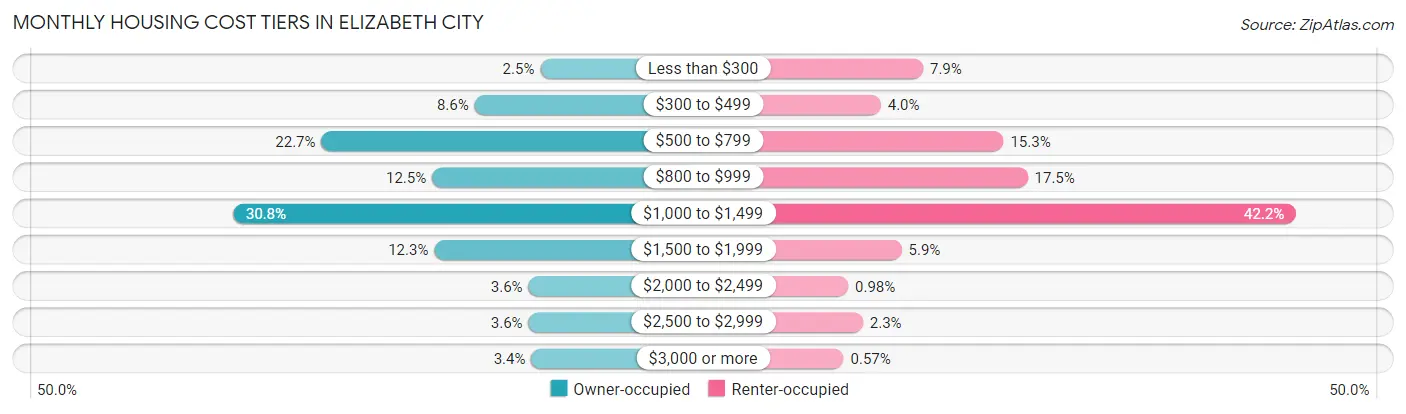
| Monthly Cost | Owner-occupied | Renter-occupied |
| Less than $300 | 77 (2.5%) | 320 (7.9%) |
| $300 to $499 | 261 (8.6%) | 162 (4.0%) |
| $500 to $799 | 690 (22.7%) | 621 (15.3%) |
| $800 to $999 | 380 (12.5%) | 711 (17.5%) |
| $1,000 to $1,499 | 938 (30.8%) | 1,715 (42.2%) |
| $1,500 to $1,999 | 374 (12.3%) | 240 (5.9%) |
| $2,000 to $2,499 | 110 (3.6%) | 40 (1.0%) |
| $2,500 to $2,999 | 110 (3.6%) | 95 (2.3%) |
| $3,000 or more | 102 (3.4%) | 23 (0.6%) |
| Total | 3,042 (100.0%) | 4,061 (100.0%) |
Physical Housing Characteristics in Elizabeth City
Housing Structures in Elizabeth City
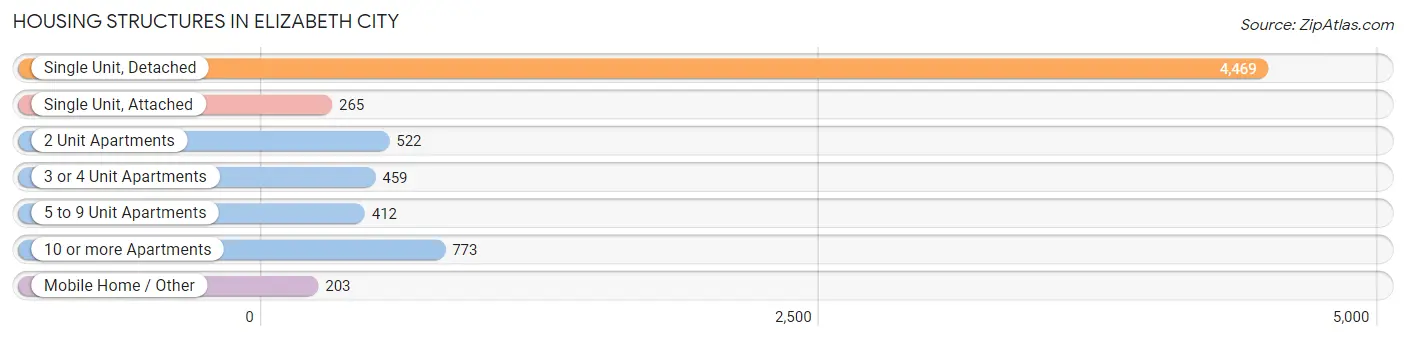
| Structure Type | # Housing Units | % Housing Units |
| Single Unit, Detached | 4,469 | 62.9% |
| Single Unit, Attached | 265 | 3.7% |
| 2 Unit Apartments | 522 | 7.3% |
| 3 or 4 Unit Apartments | 459 | 6.5% |
| 5 to 9 Unit Apartments | 412 | 5.8% |
| 10 or more Apartments | 773 | 10.9% |
| Mobile Home / Other | 203 | 2.9% |
| Total | 7,103 | 100.0% |
Housing Structures by Occupancy in Elizabeth City
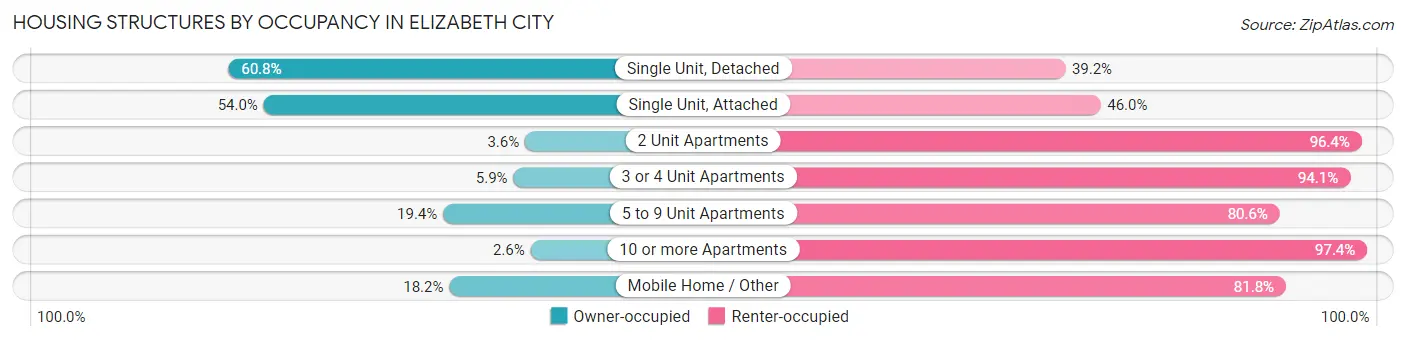
| Structure Type | Owner-occupied | Renter-occupied |
| Single Unit, Detached | 2,716 (60.8%) | 1,753 (39.2%) |
| Single Unit, Attached | 143 (54.0%) | 122 (46.0%) |
| 2 Unit Apartments | 19 (3.6%) | 503 (96.4%) |
| 3 or 4 Unit Apartments | 27 (5.9%) | 432 (94.1%) |
| 5 to 9 Unit Apartments | 80 (19.4%) | 332 (80.6%) |
| 10 or more Apartments | 20 (2.6%) | 753 (97.4%) |
| Mobile Home / Other | 37 (18.2%) | 166 (81.8%) |
| Total | 3,042 (42.8%) | 4,061 (57.2%) |
Housing Structures by Number of Rooms in Elizabeth City
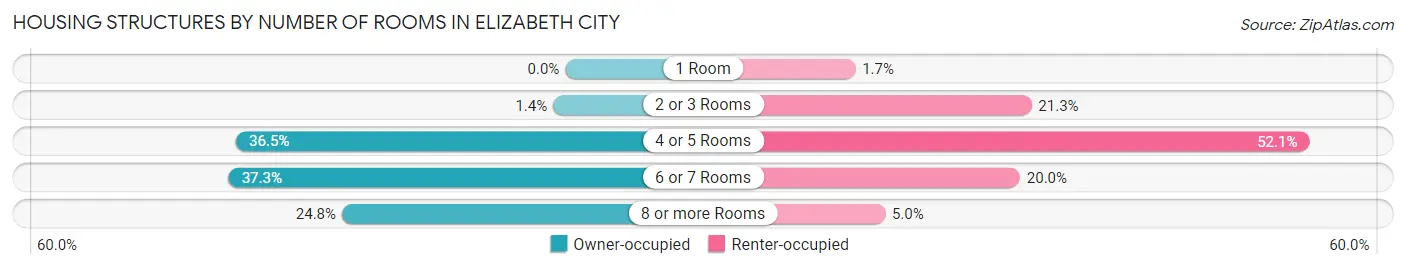
| Number of Rooms | Owner-occupied | Renter-occupied |
| 1 Room | 0 (0.0%) | 69 (1.7%) |
| 2 or 3 Rooms | 41 (1.3%) | 863 (21.2%) |
| 4 or 5 Rooms | 1,111 (36.5%) | 2,115 (52.1%) |
| 6 or 7 Rooms | 1,136 (37.3%) | 811 (20.0%) |
| 8 or more Rooms | 754 (24.8%) | 203 (5.0%) |
| Total | 3,042 (100.0%) | 4,061 (100.0%) |
Housing Structure by Heating Type in Elizabeth City
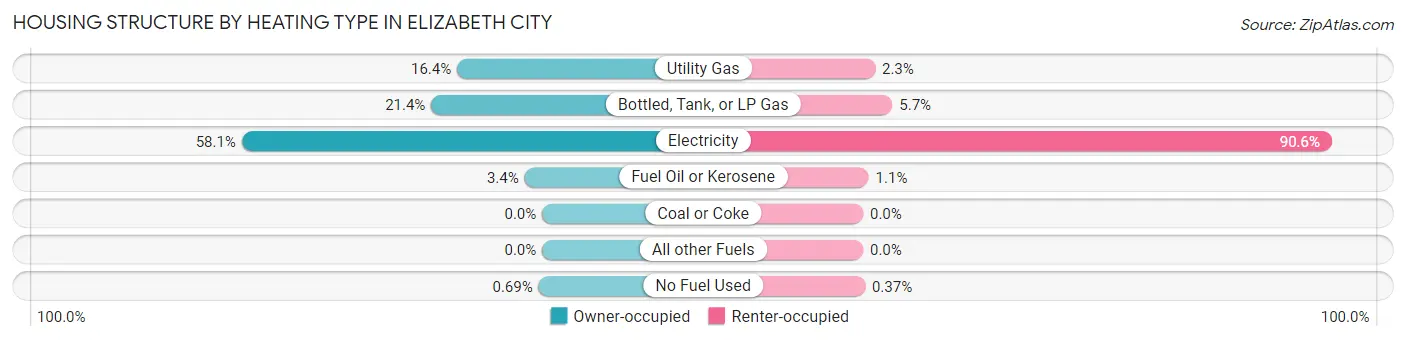
| Heating Type | Owner-occupied | Renter-occupied |
| Utility Gas | 500 (16.4%) | 94 (2.3%) |
| Bottled, Tank, or LP Gas | 652 (21.4%) | 230 (5.7%) |
| Electricity | 1,766 (58.1%) | 3,678 (90.6%) |
| Fuel Oil or Kerosene | 103 (3.4%) | 44 (1.1%) |
| Coal or Coke | 0 (0.0%) | 0 (0.0%) |
| All other Fuels | 0 (0.0%) | 0 (0.0%) |
| No Fuel Used | 21 (0.7%) | 15 (0.4%) |
| Total | 3,042 (100.0%) | 4,061 (100.0%) |
Household Vehicle Usage in Elizabeth City
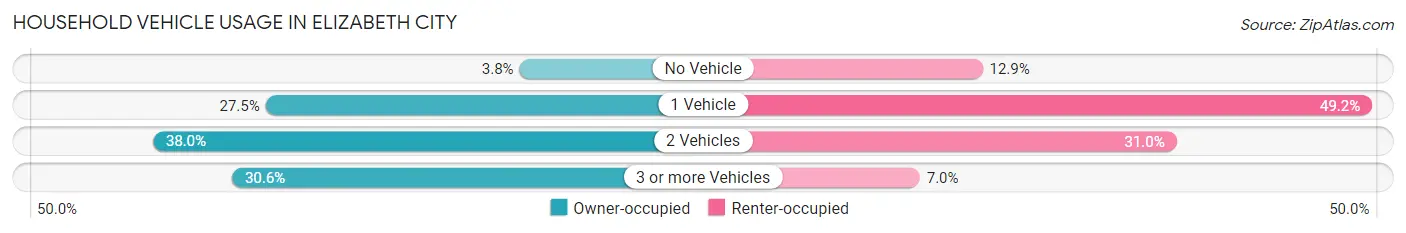
| Vehicles per Household | Owner-occupied | Renter-occupied |
| No Vehicle | 116 (3.8%) | 522 (12.9%) |
| 1 Vehicle | 837 (27.5%) | 1,998 (49.2%) |
| 2 Vehicles | 1,157 (38.0%) | 1,257 (30.9%) |
| 3 or more Vehicles | 932 (30.6%) | 284 (7.0%) |
| Total | 3,042 (100.0%) | 4,061 (100.0%) |
Real Estate & Mortgages in Elizabeth City
Real Estate and Mortgage Overview in Elizabeth City
| Characteristic | Without Mortgage | With Mortgage |
| Housing Units | 1,189 | 1,853 |
| Median Property Value | $196,800 | $158,100 |
| Median Household Income | $49,078 | $349 |
| Monthly Housing Costs | $575 | $102 |
| Real Estate Taxes | $1,537 | $156 |
Property Value by Mortgage Status in Elizabeth City
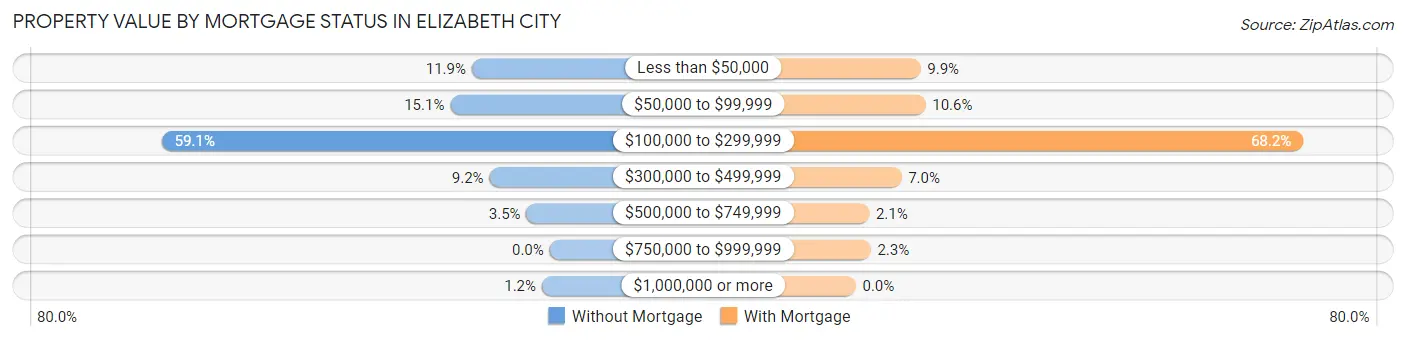
| Property Value | Without Mortgage | With Mortgage |
| Less than $50,000 | 141 (11.9%) | 183 (9.9%) |
| $50,000 to $99,999 | 180 (15.1%) | 197 (10.6%) |
| $100,000 to $299,999 | 703 (59.1%) | 1,264 (68.2%) |
| $300,000 to $499,999 | 109 (9.2%) | 129 (7.0%) |
| $500,000 to $749,999 | 42 (3.5%) | 38 (2.1%) |
| $750,000 to $999,999 | 0 (0.0%) | 42 (2.3%) |
| $1,000,000 or more | 14 (1.2%) | 0 (0.0%) |
| Total | 1,189 (100.0%) | 1,853 (100.0%) |
Household Income by Mortgage Status in Elizabeth City
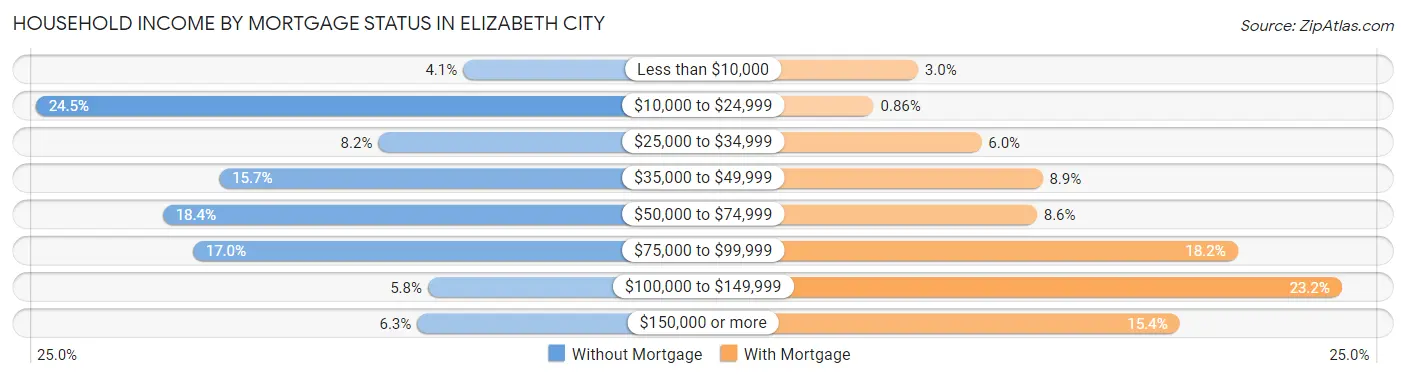
| Household Income | Without Mortgage | With Mortgage |
| Less than $10,000 | 49 (4.1%) | 55 (3.0%) |
| $10,000 to $24,999 | 291 (24.5%) | 16 (0.9%) |
| $25,000 to $34,999 | 97 (8.2%) | 111 (6.0%) |
| $35,000 to $49,999 | 187 (15.7%) | 165 (8.9%) |
| $50,000 to $74,999 | 219 (18.4%) | 160 (8.6%) |
| $75,000 to $99,999 | 202 (17.0%) | 337 (18.2%) |
| $100,000 to $149,999 | 69 (5.8%) | 429 (23.2%) |
| $150,000 or more | 75 (6.3%) | 286 (15.4%) |
| Total | 1,189 (100.0%) | 1,853 (100.0%) |
Property Value to Household Income Ratio in Elizabeth City
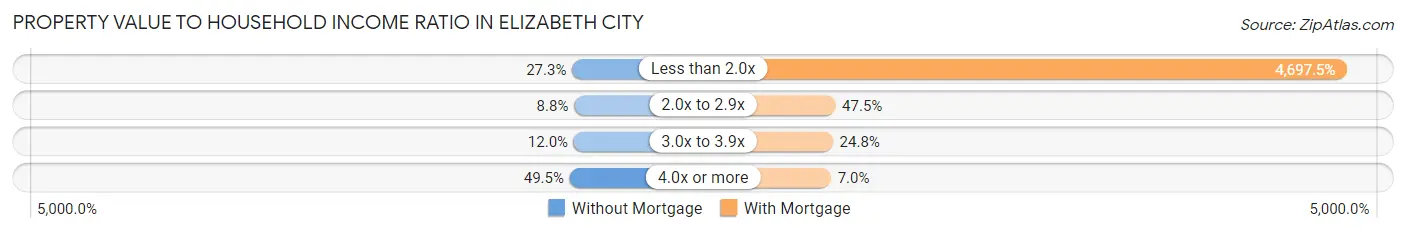
| Value-to-Income Ratio | Without Mortgage | With Mortgage |
| Less than 2.0x | 324 (27.3%) | 87,044 (4,697.5%) |
| 2.0x to 2.9x | 105 (8.8%) | 881 (47.5%) |
| 3.0x to 3.9x | 143 (12.0%) | 460 (24.8%) |
| 4.0x or more | 589 (49.5%) | 130 (7.0%) |
| Total | 1,189 (100.0%) | 1,853 (100.0%) |
Real Estate Taxes by Mortgage Status in Elizabeth City
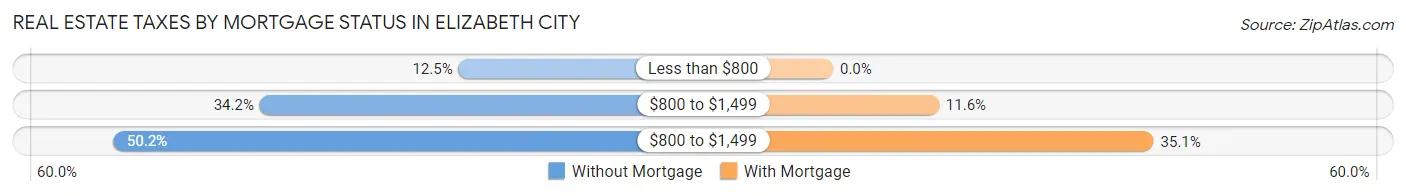
| Property Taxes | Without Mortgage | With Mortgage |
| Less than $800 | 148 (12.4%) | 0 (0.0%) |
| $800 to $1,499 | 407 (34.2%) | 215 (11.6%) |
| $800 to $1,499 | 597 (50.2%) | 651 (35.1%) |
| Total | 1,189 (100.0%) | 1,853 (100.0%) |
Health & Disability in Elizabeth City
Health Insurance Coverage by Age in Elizabeth City
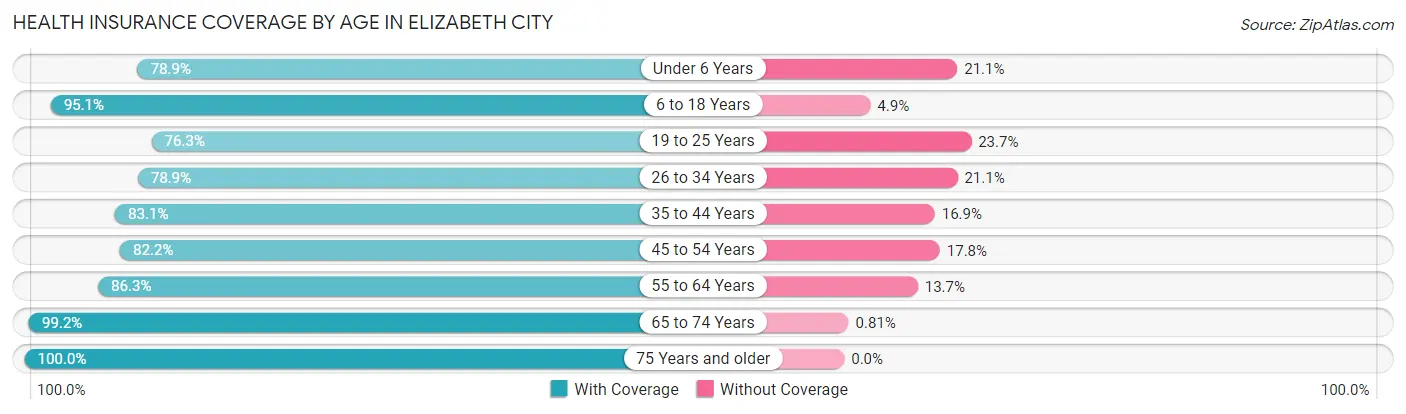
| Age Bracket | With Coverage | Without Coverage |
| Under 6 Years | 1,135 (78.9%) | 303 (21.1%) |
| 6 to 18 Years | 3,145 (95.1%) | 161 (4.9%) |
| 19 to 25 Years | 1,535 (76.3%) | 476 (23.7%) |
| 26 to 34 Years | 1,854 (78.9%) | 496 (21.1%) |
| 35 to 44 Years | 1,999 (83.1%) | 406 (16.9%) |
| 45 to 54 Years | 1,291 (82.2%) | 280 (17.8%) |
| 55 to 64 Years | 1,724 (86.3%) | 274 (13.7%) |
| 65 to 74 Years | 1,466 (99.2%) | 12 (0.8%) |
| 75 Years and older | 1,386 (100.0%) | 0 (0.0%) |
| Total | 15,535 (86.6%) | 2,408 (13.4%) |
Health Insurance Coverage by Citizenship Status in Elizabeth City
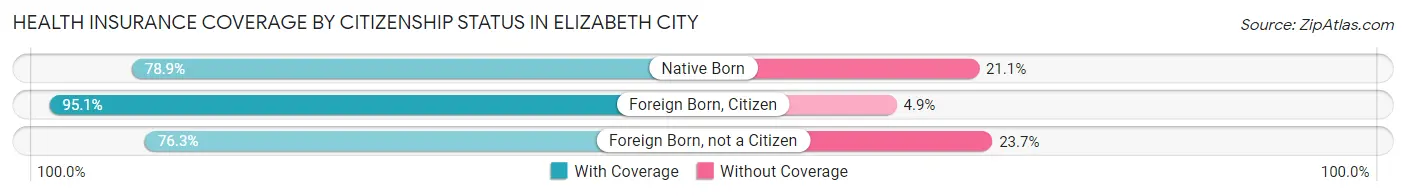
| Citizenship Status | With Coverage | Without Coverage |
| Native Born | 1,135 (78.9%) | 303 (21.1%) |
| Foreign Born, Citizen | 3,145 (95.1%) | 161 (4.9%) |
| Foreign Born, not a Citizen | 1,535 (76.3%) | 476 (23.7%) |
Health Insurance Coverage by Household Income in Elizabeth City
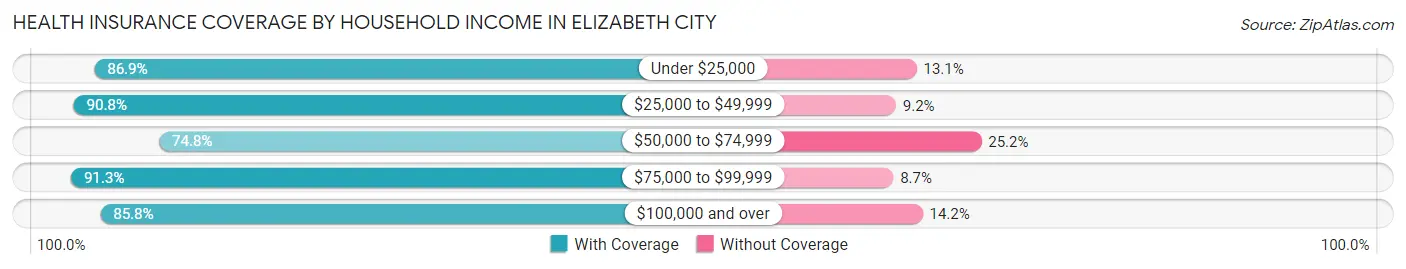
| Household Income | With Coverage | Without Coverage |
| Under $25,000 | 2,808 (86.9%) | 422 (13.1%) |
| $25,000 to $49,999 | 3,568 (90.8%) | 361 (9.2%) |
| $50,000 to $74,999 | 2,288 (74.8%) | 771 (25.2%) |
| $75,000 to $99,999 | 2,141 (91.3%) | 204 (8.7%) |
| $100,000 and over | 3,507 (85.8%) | 580 (14.2%) |
Public vs Private Health Insurance Coverage by Age in Elizabeth City
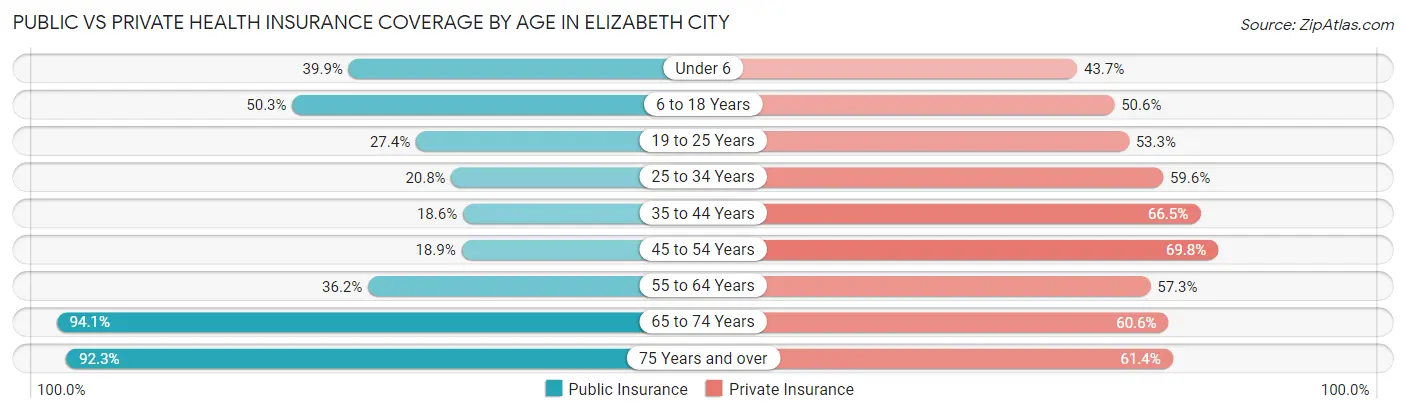
| Age Bracket | Public Insurance | Private Insurance |
| Under 6 | 573 (39.9%) | 628 (43.7%) |
| 6 to 18 Years | 1,663 (50.3%) | 1,672 (50.6%) |
| 19 to 25 Years | 550 (27.4%) | 1,071 (53.3%) |
| 25 to 34 Years | 488 (20.8%) | 1,401 (59.6%) |
| 35 to 44 Years | 448 (18.6%) | 1,599 (66.5%) |
| 45 to 54 Years | 297 (18.9%) | 1,097 (69.8%) |
| 55 to 64 Years | 724 (36.2%) | 1,144 (57.3%) |
| 65 to 74 Years | 1,390 (94.1%) | 896 (60.6%) |
| 75 Years and over | 1,279 (92.3%) | 851 (61.4%) |
| Total | 7,412 (41.3%) | 10,359 (57.7%) |
Disability Status by Sex by Age in Elizabeth City
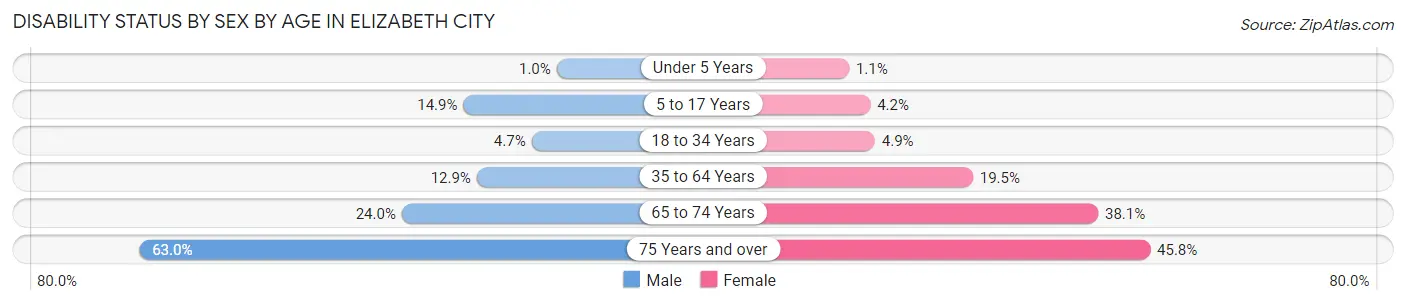
| Age Bracket | Male | Female |
| Under 5 Years | 6 (1.0%) | 7 (1.1%) |
| 5 to 17 Years | 229 (14.9%) | 58 (4.2%) |
| 18 to 34 Years | 115 (4.7%) | 123 (4.9%) |
| 35 to 64 Years | 303 (12.9%) | 704 (19.5%) |
| 65 to 74 Years | 168 (24.0%) | 296 (38.1%) |
| 75 Years and over | 284 (63.0%) | 428 (45.8%) |
Disability Class by Sex by Age in Elizabeth City
Disability Class: Hearing Difficulty
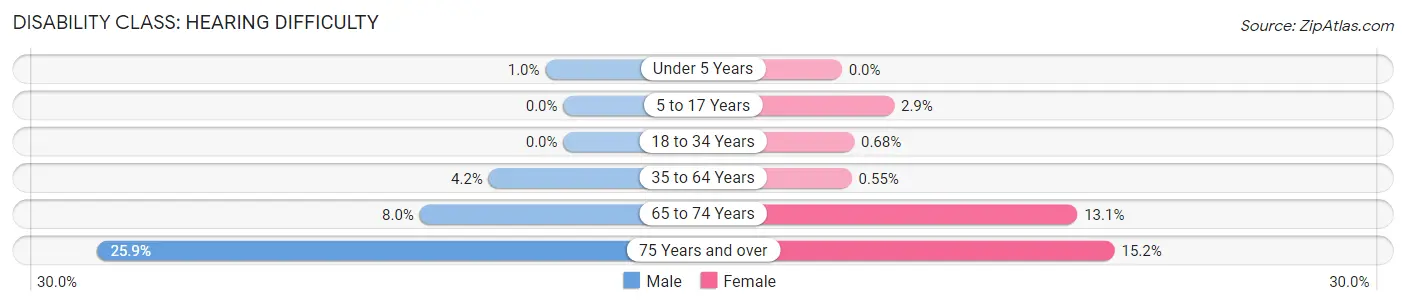
| Age Bracket | Male | Female |
| Under 5 Years | 6 (1.0%) | 0 (0.0%) |
| 5 to 17 Years | 0 (0.0%) | 40 (2.9%) |
| 18 to 34 Years | 0 (0.0%) | 17 (0.7%) |
| 35 to 64 Years | 98 (4.2%) | 20 (0.5%) |
| 65 to 74 Years | 56 (8.0%) | 102 (13.1%) |
| 75 Years and over | 117 (25.9%) | 142 (15.2%) |
Disability Class: Vision Difficulty
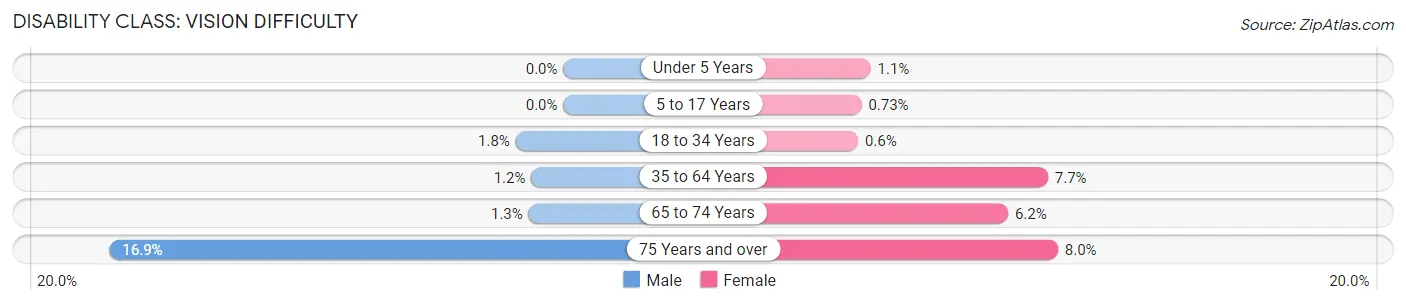
| Age Bracket | Male | Female |
| Under 5 Years | 0 (0.0%) | 7 (1.1%) |
| 5 to 17 Years | 0 (0.0%) | 10 (0.7%) |
| 18 to 34 Years | 43 (1.8%) | 15 (0.6%) |
| 35 to 64 Years | 28 (1.2%) | 277 (7.6%) |
| 65 to 74 Years | 9 (1.3%) | 48 (6.2%) |
| 75 Years and over | 76 (16.9%) | 75 (8.0%) |
Disability Class: Cognitive Difficulty
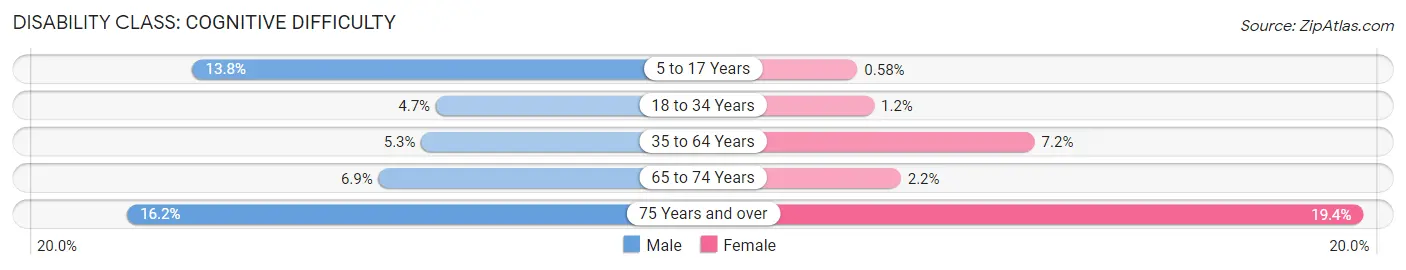
| Age Bracket | Male | Female |
| 5 to 17 Years | 212 (13.8%) | 8 (0.6%) |
| 18 to 34 Years | 115 (4.7%) | 30 (1.2%) |
| 35 to 64 Years | 124 (5.3%) | 259 (7.2%) |
| 65 to 74 Years | 48 (6.9%) | 17 (2.2%) |
| 75 Years and over | 73 (16.2%) | 181 (19.4%) |
Disability Class: Ambulatory Difficulty
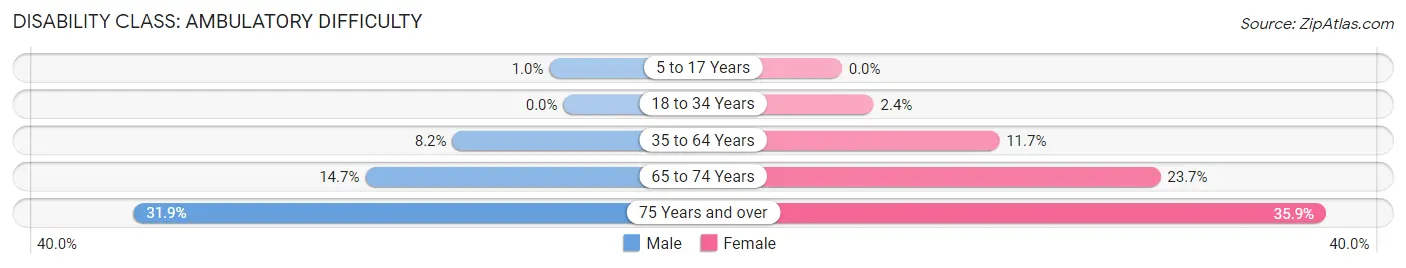
| Age Bracket | Male | Female |
| 5 to 17 Years | 16 (1.0%) | 0 (0.0%) |
| 18 to 34 Years | 0 (0.0%) | 59 (2.4%) |
| 35 to 64 Years | 194 (8.2%) | 423 (11.7%) |
| 65 to 74 Years | 103 (14.7%) | 184 (23.6%) |
| 75 Years and over | 144 (31.9%) | 336 (35.9%) |
Disability Class: Self-Care Difficulty
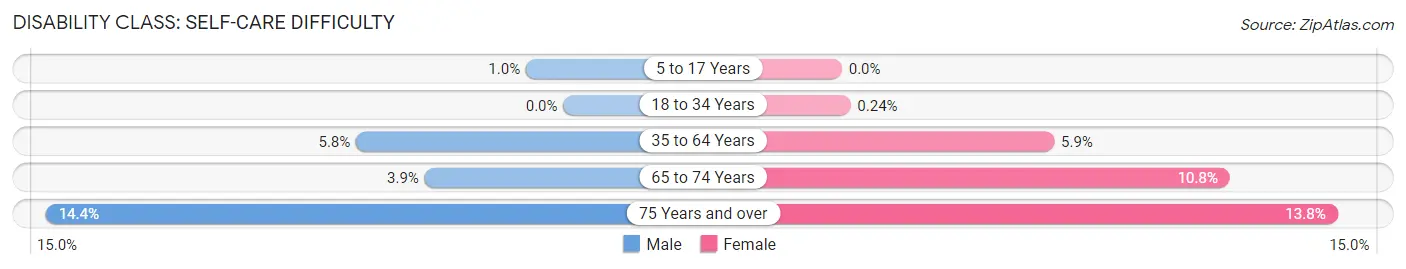
| Age Bracket | Male | Female |
| 5 to 17 Years | 16 (1.0%) | 0 (0.0%) |
| 18 to 34 Years | 0 (0.0%) | 6 (0.2%) |
| 35 to 64 Years | 136 (5.8%) | 214 (5.9%) |
| 65 to 74 Years | 27 (3.9%) | 84 (10.8%) |
| 75 Years and over | 65 (14.4%) | 129 (13.8%) |
Technology Access in Elizabeth City
Computing Device Access in Elizabeth City
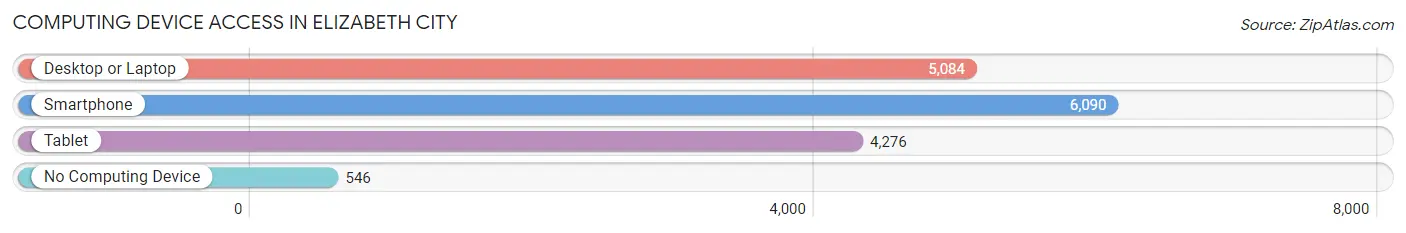
| Device Type | # Households | % Households |
| Desktop or Laptop | 5,084 | 71.6% |
| Smartphone | 6,090 | 85.7% |
| Tablet | 4,276 | 60.2% |
| No Computing Device | 546 | 7.7% |
| Total | 7,103 | 100.0% |
Internet Access in Elizabeth City
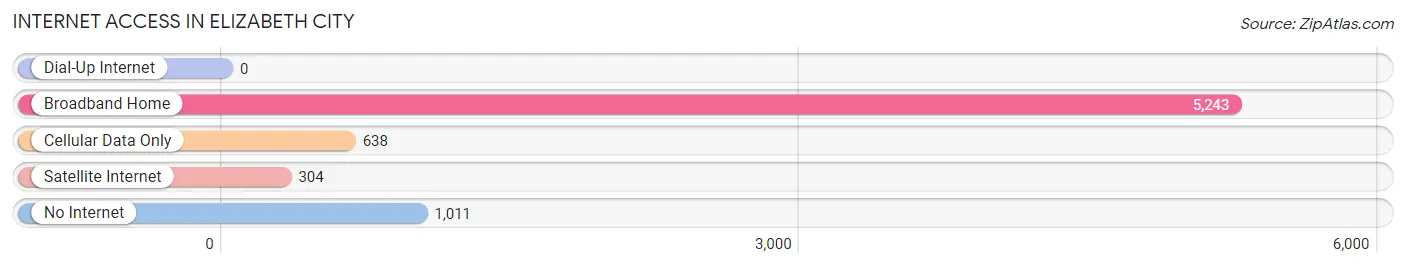
| Internet Type | # Households | % Households |
| Dial-Up Internet | 0 | 0.0% |
| Broadband Home | 5,243 | 73.8% |
| Cellular Data Only | 638 | 9.0% |
| Satellite Internet | 304 | 4.3% |
| No Internet | 1,011 | 14.2% |
| Total | 7,103 | 100.0% |
Elizabeth City Summary
Elizabeth City is a small city located in the northeastern corner of North Carolina, in the United States. It is the county seat of Pasquotank County and is part of the Elizabeth City Micropolitan Statistical Area. The city is situated on the Pasquotank River, which flows into the Albemarle Sound. Elizabeth City is the largest city in the Albemarle region and is the cultural, economic, and educational hub of the region.
History
Elizabeth City was founded in 1793 by English settlers from the Albemarle region of North Carolina. The city was named after Queen Elizabeth I of England. The city was incorporated in 1801 and was the first incorporated town in the Albemarle region.
In the early 19th century, Elizabeth City was a major port of entry for immigrants from Europe. The city was also a major center for the slave trade. During the Civil War, the city was occupied by Union forces and served as a major supply depot for the Union Army.
In the late 19th century, Elizabeth City became a major center for the seafood industry. The city was also a major center for the lumber industry. In the early 20th century, the city was a major center for the naval aviation industry.
Geography
Elizabeth City is located in the northeastern corner of North Carolina, in the United States. It is situated on the Pasquotank River, which flows into the Albemarle Sound. The city is located approximately 40 miles south of Norfolk, Virginia and approximately 60 miles north of Raleigh, North Carolina.
The city has a total area of 11.3 square miles, of which 10.9 square miles is land and 0.4 square miles is water. The city is located in a humid subtropical climate zone and has mild winters and hot, humid summers.
Economy
Elizabeth City is the economic and cultural hub of the Albemarle region. The city is home to several major employers, including the Elizabeth City State University, the Elizabeth City Regional Airport, and the Elizabeth City Shipyard.
The city is also home to several major industries, including seafood processing, lumber, and naval aviation. The city is also home to several major retail stores, including Walmart, Lowe’s, and Target.
Demographics
As of the 2010 census, the population of Elizabeth City was 18,683. The racial makeup of the city was 57.2% White, 34.2% African American, 0.5% Native American, 1.2% Asian, 0.1% Pacific Islander, 4.3% from other races, and 2.5% from two or more races. Hispanic or Latino of any race were 8.2% of the population.
The median household income in Elizabeth City was $37,845, and the median family income was $45,945. The per capita income for the city was $20,845. About 17.2% of families and 20.7% of the population were below the poverty line, including 28.2% of those under age 18 and 14.2% of those age 65 or over.
Common Questions
What is Per Capita Income in Elizabeth City?
Per Capita income in Elizabeth City is $26,894.
What is the Median Family Income in Elizabeth City?
Median Family Income in Elizabeth City is $68,704.
What is the Median Household income in Elizabeth City?
Median Household Income in Elizabeth City is $50,155.
What is Income or Wage Gap in Elizabeth City?
Income or Wage Gap in Elizabeth City is 16.4%.
Women in Elizabeth City earn 83.6 cents for every dollar earned by a man.
What is Family Income Deficit in Elizabeth City?
Family Income Deficit in Elizabeth City is $8,942.
Families that are below poverty line in Elizabeth City earn $8,942 less on average than the poverty threshold level.
What is Inequality or Gini Index in Elizabeth City?
Inequality or Gini Index in Elizabeth City is 0.45.
What is the Total Population of Elizabeth City?
Total Population of Elizabeth City is 18,570.
What is the Total Male Population of Elizabeth City?
Total Male Population of Elizabeth City is 8,454.
What is the Total Female Population of Elizabeth City?
Total Female Population of Elizabeth City is 10,116.
What is the Ratio of Males per 100 Females in Elizabeth City?
There are 83.57 Males per 100 Females in Elizabeth City.
What is the Ratio of Females per 100 Males in Elizabeth City?
There are 119.66 Females per 100 Males in Elizabeth City.
What is the Median Population Age in Elizabeth City?
Median Population Age in Elizabeth City is 34.8 Years.
What is the Average Family Size in Elizabeth City
Average Family Size in Elizabeth City is 3.0 People.
What is the Average Household Size in Elizabeth City
Average Household Size in Elizabeth City is 2.4 People.
How Large is the Labor Force in Elizabeth City?
There are 8,770 People in the Labor Forcein in Elizabeth City.
What is the Percentage of People in the Labor Force in Elizabeth City?
59.3% of People are in the Labor Force in Elizabeth City.
What is the Unemployment Rate in Elizabeth City?
Unemployment Rate in Elizabeth City is 8.3%.