Waxhaw, NC Map & Demographics
Waxhaw Map
Waxhaw Overview
$45,502
PER CAPITA INCOME
$141,709
AVG FAMILY INCOME
$124,711
AVG HOUSEHOLD INCOME
50.5%
WAGE / INCOME GAP [ % ]
49.5¢/ $1
WAGE / INCOME GAP [ $ ]
0.37
INEQUALITY / GINI INDEX
20,665
TOTAL POPULATION
10,009
MALE POPULATION
10,656
FEMALE POPULATION
93.93
MALES / 100 FEMALES
106.46
FEMALES / 100 MALES
35.7
MEDIAN AGE
3.5
AVG FAMILY SIZE
3.3
AVG HOUSEHOLD SIZE
10,483
LABOR FORCE [ PEOPLE ]
70.0%
PERCENT IN LABOR FORCE
3.3%
UNEMPLOYMENT RATE
Waxhaw Zip Codes
Waxhaw Area Codes
Income in Waxhaw
Income Overview in Waxhaw
Per Capita Income in Waxhaw is $45,502, while median incomes of families and households are $141,709 and $124,711 respectively.
| Characteristic | Number | Measure |
| Per Capita Income | 20,665 | $45,502 |
| Median Family Income | 5,479 | $141,709 |
| Mean Family Income | 5,479 | $155,338 |
| Median Household Income | 6,312 | $124,711 |
| Mean Household Income | 6,312 | $146,381 |
| Income Deficit | 5,479 | $0 |
| Wage / Income Gap (%) | 20,665 | 50.52% |
| Wage / Income Gap ($) | 20,665 | 49.48¢ per $1 |
| Gini / Inequality Index | 20,665 | 0.37 |
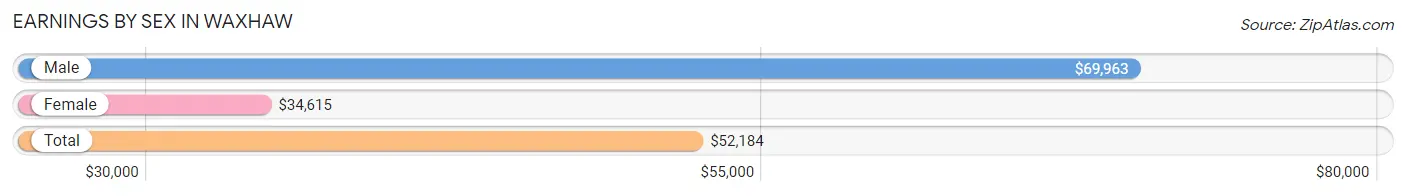
Earnings by Sex in Waxhaw
Average Earnings in Waxhaw are $52,184, $69,963 for men and $34,615 for women, a difference of 50.5%.
| Sex | Number | Average Earnings |
| Male | 5,509 (49.3%) | $69,963 |
| Female | 5,663 (50.7%) | $34,615 |
| Total | 11,172 (100.0%) | $52,184 |
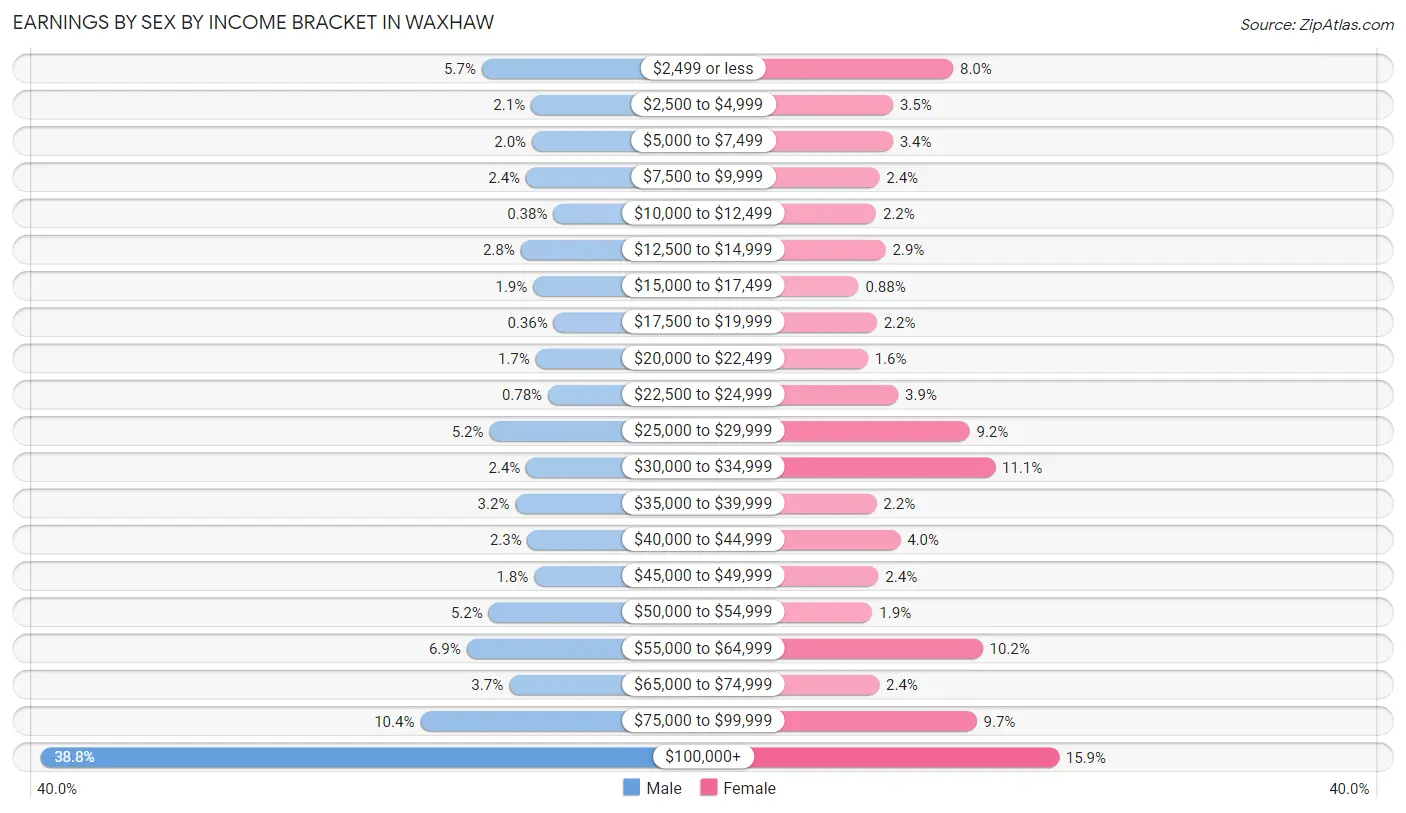
Earnings by Sex by Income Bracket in Waxhaw
The most common earnings brackets in Waxhaw are $100,000+ for men (2,135 | 38.8%) and $100,000+ for women (900 | 15.9%).
| Income | Male | Female |
| $2,499 or less | 316 (5.7%) | 451 (8.0%) |
| $2,500 to $4,999 | 113 (2.1%) | 196 (3.5%) |
| $5,000 to $7,499 | 109 (2.0%) | 195 (3.4%) |
| $7,500 to $9,999 | 134 (2.4%) | 138 (2.4%) |
| $10,000 to $12,499 | 21 (0.4%) | 124 (2.2%) |
| $12,500 to $14,999 | 156 (2.8%) | 165 (2.9%) |
| $15,000 to $17,499 | 104 (1.9%) | 50 (0.9%) |
| $17,500 to $19,999 | 20 (0.4%) | 127 (2.2%) |
| $20,000 to $22,499 | 94 (1.7%) | 89 (1.6%) |
| $22,500 to $24,999 | 43 (0.8%) | 218 (3.8%) |
| $25,000 to $29,999 | 285 (5.2%) | 521 (9.2%) |
| $30,000 to $34,999 | 133 (2.4%) | 629 (11.1%) |
| $35,000 to $39,999 | 178 (3.2%) | 126 (2.2%) |
| $40,000 to $44,999 | 127 (2.3%) | 227 (4.0%) |
| $45,000 to $49,999 | 100 (1.8%) | 134 (2.4%) |
| $50,000 to $54,999 | 288 (5.2%) | 109 (1.9%) |
| $55,000 to $64,999 | 379 (6.9%) | 576 (10.2%) |
| $65,000 to $74,999 | 204 (3.7%) | 137 (2.4%) |
| $75,000 to $99,999 | 570 (10.3%) | 551 (9.7%) |
| $100,000+ | 2,135 (38.8%) | 900 (15.9%) |
| Total | 5,509 (100.0%) | 5,663 (100.0%) |
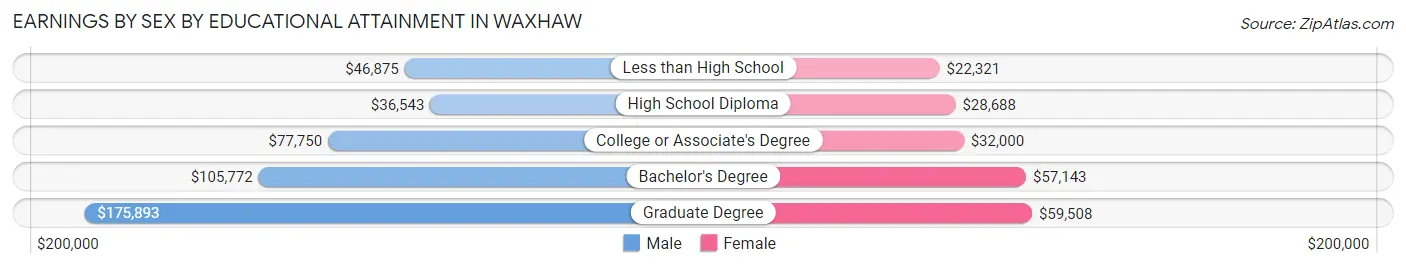
Earnings by Sex by Educational Attainment in Waxhaw
Average earnings in Waxhaw are $87,551 for men and $44,464 for women, a difference of 49.2%. Men with an educational attainment of graduate degree enjoy the highest average annual earnings of $175,893, while those with high school diploma education earn the least with $36,543. Women with an educational attainment of graduate degree earn the most with the average annual earnings of $59,508, while those with less than high school education have the smallest earnings of $22,321.
| Educational Attainment | Male Income | Female Income |
| Less than High School | $46,875 | $22,321 |
| High School Diploma | $36,543 | $28,688 |
| College or Associate's Degree | $77,750 | $32,000 |
| Bachelor's Degree | $105,772 | $57,143 |
| Graduate Degree | $175,893 | $59,508 |
| Total | $87,551 | $44,464 |
Family Income in Waxhaw
Family Income Brackets in Waxhaw
According to the Waxhaw family income data, there are 1,501 families falling into the $200,000+ income range, which is the most common income bracket and makes up 27.4% of all families. Conversely, the $10,000 to $14,999 income bracket is the least frequent group with only 38 families (0.7%) belonging to this category.
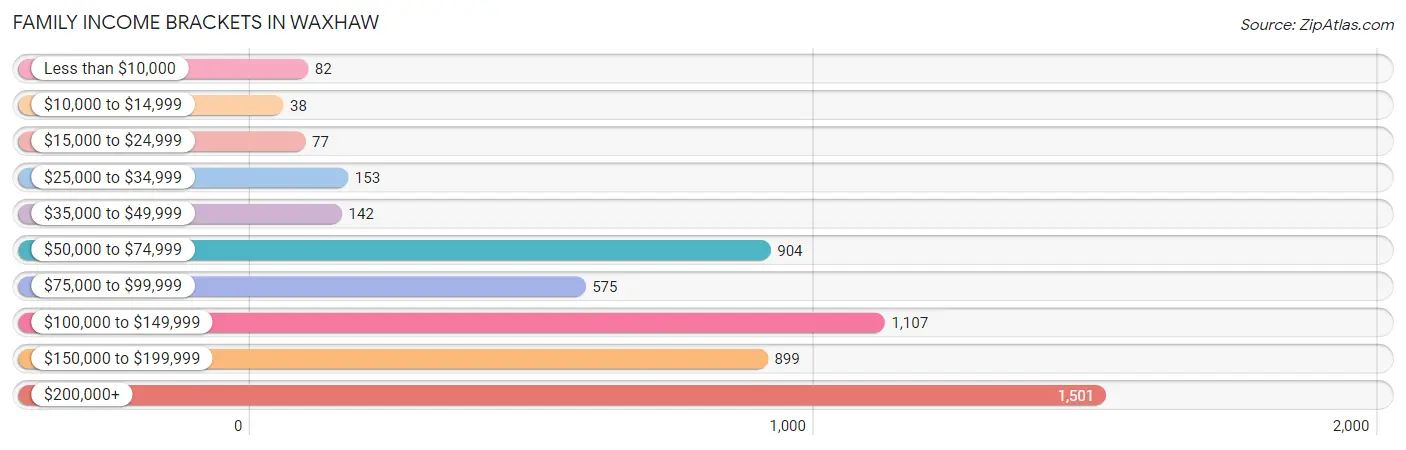
| Income Bracket | # Families | % Families |
| Less than $10,000 | 82 | 1.5% |
| $10,000 to $14,999 | 38 | 0.7% |
| $15,000 to $24,999 | 77 | 1.4% |
| $25,000 to $34,999 | 153 | 2.8% |
| $35,000 to $49,999 | 142 | 2.6% |
| $50,000 to $74,999 | 904 | 16.5% |
| $75,000 to $99,999 | 575 | 10.5% |
| $100,000 to $149,999 | 1,107 | 20.2% |
| $150,000 to $199,999 | 899 | 16.4% |
| $200,000+ | 1,501 | 27.4% |
Family Income by Famaliy Size in Waxhaw
7+ person families (48 | 0.9%) account for the highest median family income in Waxhaw with $250,001 per family, while 4-person families (1,671 | 30.5%) have the highest median income of $45,948 per family member.
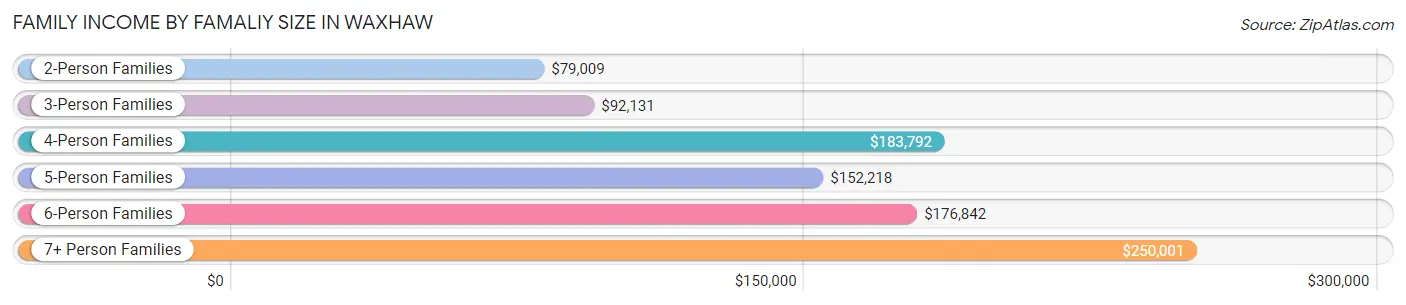
| Income Bracket | # Families | Median Income |
| 2-Person Families | 1,565 (28.6%) | $79,009 |
| 3-Person Families | 1,261 (23.0%) | $92,131 |
| 4-Person Families | 1,671 (30.5%) | $183,792 |
| 5-Person Families | 696 (12.7%) | $152,218 |
| 6-Person Families | 238 (4.3%) | $176,842 |
| 7+ Person Families | 48 (0.9%) | $250,001 |
| Total | 5,479 (100.0%) | $141,709 |
Family Income by Number of Earners in Waxhaw
The median family income in Waxhaw is $141,709, with families comprising 3+ earners (846) having the highest median family income of $213,125, while families with no earners (318) have the lowest median family income of $68,182, accounting for 15.4% and 5.8% of families, respectively.
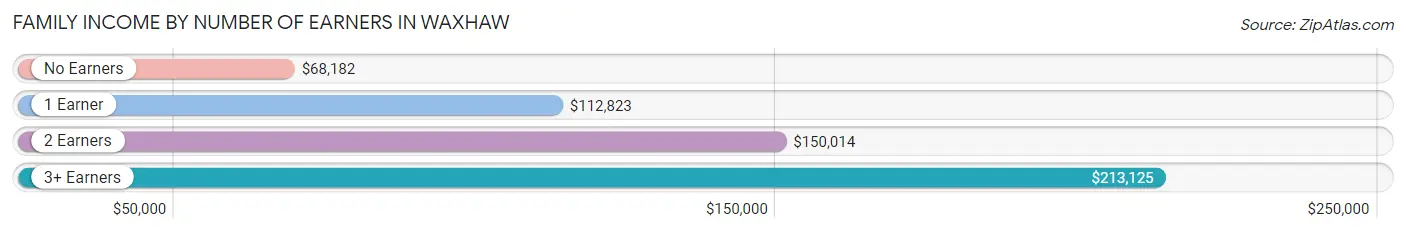
| Number of Earners | # Families | Median Income |
| No Earners | 318 (5.8%) | $68,182 |
| 1 Earner | 1,672 (30.5%) | $112,823 |
| 2 Earners | 2,643 (48.2%) | $150,014 |
| 3+ Earners | 846 (15.4%) | $213,125 |
| Total | 5,479 (100.0%) | $141,709 |
Household Income in Waxhaw
Household Income Brackets in Waxhaw
With 1,565 households falling in the category, the $200,000+ income range is the most frequent in Waxhaw, accounting for 24.8% of all households. In contrast, only 57 households (0.9%) fall into the $10,000 to $14,999 income bracket, making it the least populous group.
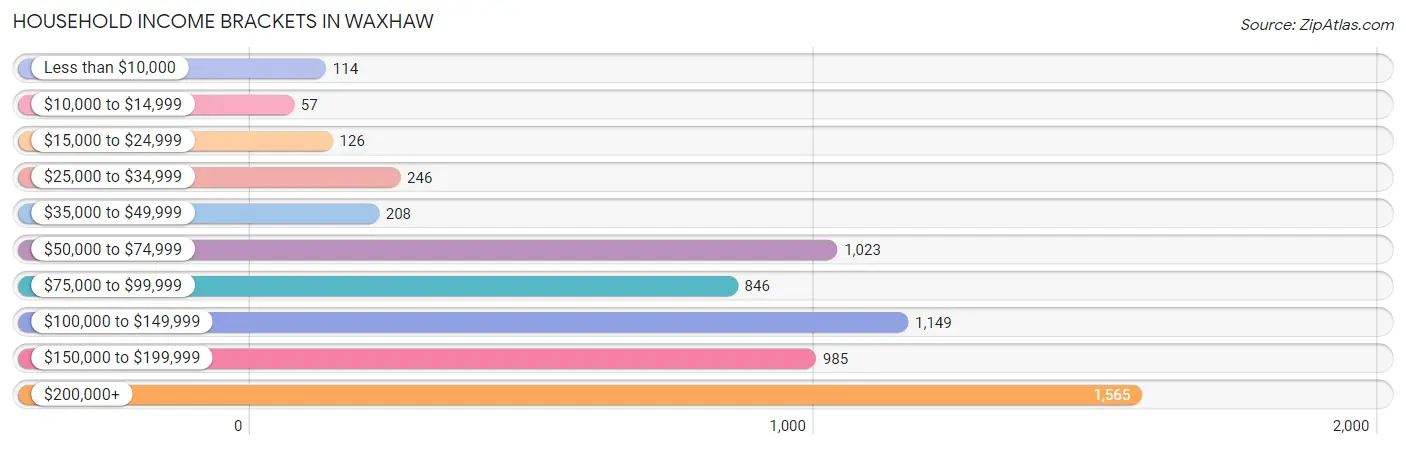
| Income Bracket | # Households | % Households |
| Less than $10,000 | 114 | 1.8% |
| $10,000 to $14,999 | 57 | 0.9% |
| $15,000 to $24,999 | 126 | 2.0% |
| $25,000 to $34,999 | 246 | 3.9% |
| $35,000 to $49,999 | 208 | 3.3% |
| $50,000 to $74,999 | 1,023 | 16.2% |
| $75,000 to $99,999 | 846 | 13.4% |
| $100,000 to $149,999 | 1,149 | 18.2% |
| $150,000 to $199,999 | 985 | 15.6% |
| $200,000+ | 1,565 | 24.8% |
Household Income by Householder Age in Waxhaw
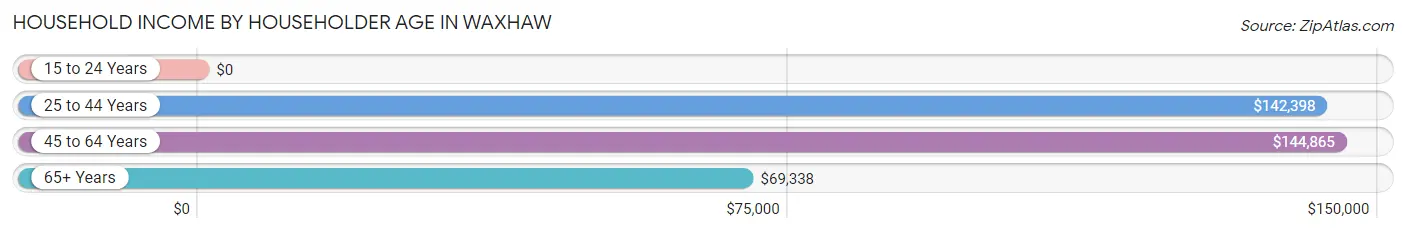
The median household income in Waxhaw is $124,711, with the highest median household income of $144,865 found in the 45 to 64 years age bracket for the primary householder. A total of 2,938 households (46.6%) fall into this category. Meanwhile, the 15 to 24 years age bracket for the primary householder has the lowest median household income of $0, with 13 households (0.2%) in this group.
| Income Bracket | # Households | Median Income |
| 15 to 24 Years | 13 (0.2%) | $0 |
| 25 to 44 Years | 2,494 (39.5%) | $142,398 |
| 45 to 64 Years | 2,938 (46.6%) | $144,865 |
| 65+ Years | 867 (13.7%) | $69,338 |
| Total | 6,312 (100.0%) | $124,711 |
Poverty in Waxhaw
Income Below Poverty by Sex and Age in Waxhaw
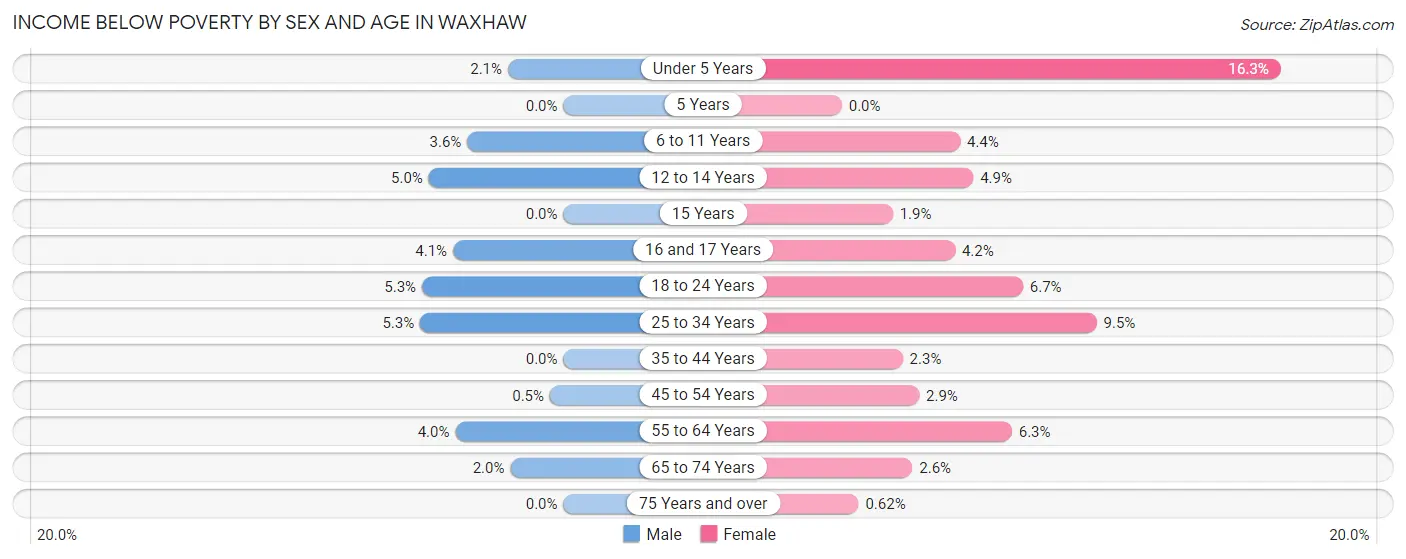
With 2.6% poverty level for males and 4.9% for females among the residents of Waxhaw, 25 to 34 year old males and under 5 year old females are the most vulnerable to poverty, with 50 males (5.3%) and 109 females (16.3%) in their respective age groups living below the poverty level.
| Age Bracket | Male | Female |
| Under 5 Years | 10 (2.1%) | 109 (16.3%) |
| 5 Years | 0 (0.0%) | 0 (0.0%) |
| 6 to 11 Years | 50 (3.6%) | 60 (4.4%) |
| 12 to 14 Years | 27 (5.0%) | 28 (4.9%) |
| 15 Years | 0 (0.0%) | 3 (1.9%) |
| 16 and 17 Years | 30 (4.1%) | 24 (4.2%) |
| 18 to 24 Years | 38 (5.2%) | 45 (6.7%) |
| 25 to 34 Years | 50 (5.3%) | 83 (9.5%) |
| 35 to 44 Years | 0 (0.0%) | 46 (2.3%) |
| 45 to 54 Years | 10 (0.5%) | 58 (2.9%) |
| 55 to 64 Years | 36 (4.0%) | 46 (6.3%) |
| 65 to 74 Years | 11 (2.0%) | 11 (2.6%) |
| 75 Years and over | 0 (0.0%) | 2 (0.6%) |
| Total | 262 (2.6%) | 515 (4.9%) |
Income Above Poverty by Sex and Age in Waxhaw
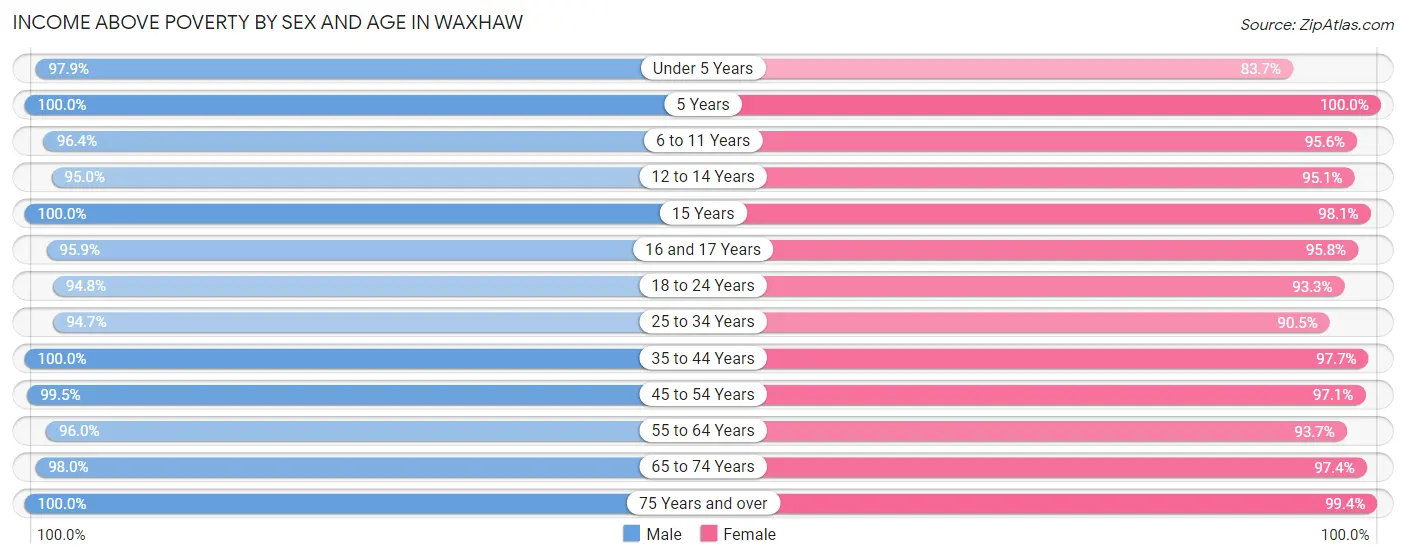
According to the poverty statistics in Waxhaw, males aged 5 years and females aged 5 years are the age groups that are most secure financially, with 100.0% of males and 100.0% of females in these age groups living above the poverty line.
| Age Bracket | Male | Female |
| Under 5 Years | 475 (97.9%) | 560 (83.7%) |
| 5 Years | 75 (100.0%) | 184 (100.0%) |
| 6 to 11 Years | 1,352 (96.4%) | 1,307 (95.6%) |
| 12 to 14 Years | 513 (95.0%) | 546 (95.1%) |
| 15 Years | 234 (100.0%) | 156 (98.1%) |
| 16 and 17 Years | 702 (95.9%) | 547 (95.8%) |
| 18 to 24 Years | 686 (94.8%) | 625 (93.3%) |
| 25 to 34 Years | 889 (94.7%) | 794 (90.5%) |
| 35 to 44 Years | 1,183 (100.0%) | 1,993 (97.7%) |
| 45 to 54 Years | 1,971 (99.5%) | 1,963 (97.1%) |
| 55 to 64 Years | 861 (96.0%) | 683 (93.7%) |
| 65 to 74 Years | 548 (98.0%) | 409 (97.4%) |
| 75 Years and over | 257 (100.0%) | 321 (99.4%) |
| Total | 9,746 (97.4%) | 10,088 (95.1%) |
Income Below Poverty Among Married-Couple Families in Waxhaw
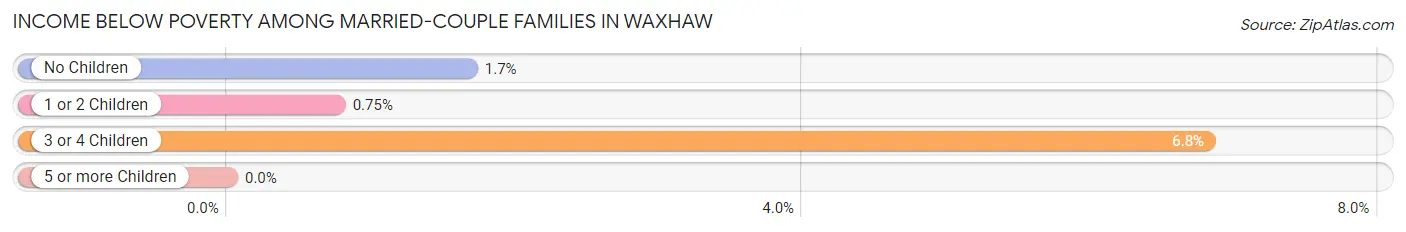
The poverty statistics for married-couple families in Waxhaw show that 1.8% or 77 of the total 4,369 families live below the poverty line. Families with 3 or 4 children have the highest poverty rate of 6.8%, comprising of 39 families. On the other hand, families with 5 or more children have the lowest poverty rate of 0.0%, which includes 0 families.
| Children | Above Poverty | Below Poverty |
| No Children | 1,062 (98.3%) | 18 (1.7%) |
| 1 or 2 Children | 2,657 (99.3%) | 20 (0.7%) |
| 3 or 4 Children | 534 (93.2%) | 39 (6.8%) |
| 5 or more Children | 39 (100.0%) | 0 (0.0%) |
| Total | 4,292 (98.2%) | 77 (1.8%) |
Income Below Poverty Among Single-Parent Households in Waxhaw
According to the poverty data in Waxhaw, 2.7% or 11 single-father households and 11.1% or 78 single-mother households are living below the poverty line. Among single-father households, those with 1 or 2 children have the highest poverty rate, with 11 households (6.7%) experiencing poverty. Likewise, among single-mother households, those with 3 or 4 children have the highest poverty rate, with 28 households (42.4%) falling below the poverty line.
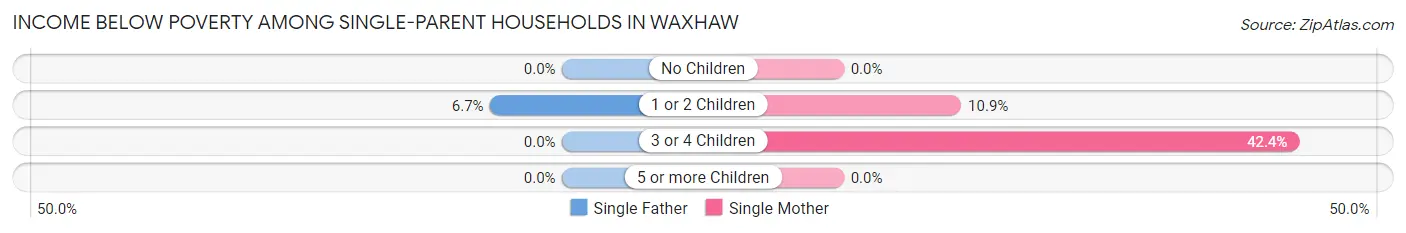
| Children | Single Father | Single Mother |
| No Children | 0 (0.0%) | 0 (0.0%) |
| 1 or 2 Children | 11 (6.7%) | 50 (10.9%) |
| 3 or 4 Children | 0 (0.0%) | 28 (42.4%) |
| 5 or more Children | 0 (0.0%) | 0 (0.0%) |
| Total | 11 (2.7%) | 78 (11.1%) |
Income Below Poverty Among Married-Couple vs Single-Parent Households in Waxhaw
The poverty data for Waxhaw shows that 77 of the married-couple family households (1.8%) and 89 of the single-parent households (8.0%) are living below the poverty level. Within the married-couple family households, those with 3 or 4 children have the highest poverty rate, with 39 households (6.8%) falling below the poverty line. Among the single-parent households, those with 3 or 4 children have the highest poverty rate, with 28 household (36.8%) living below poverty.
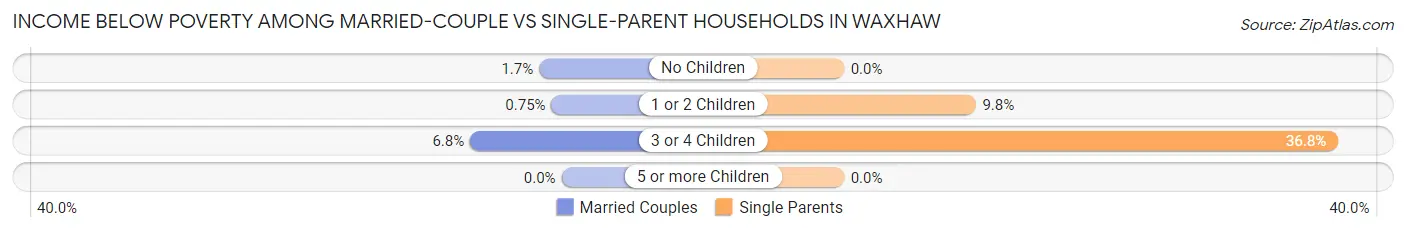
| Children | Married-Couple Families | Single-Parent Households |
| No Children | 18 (1.7%) | 0 (0.0%) |
| 1 or 2 Children | 20 (0.7%) | 61 (9.8%) |
| 3 or 4 Children | 39 (6.8%) | 28 (36.8%) |
| 5 or more Children | 0 (0.0%) | 0 (0.0%) |
| Total | 77 (1.8%) | 89 (8.0%) |
Race in Waxhaw
The most populous races in Waxhaw are White / Caucasian (15,231 | 73.7%), Hispanic or Latino (2,098 | 10.2%), and Black / African American (1,886 | 9.1%).
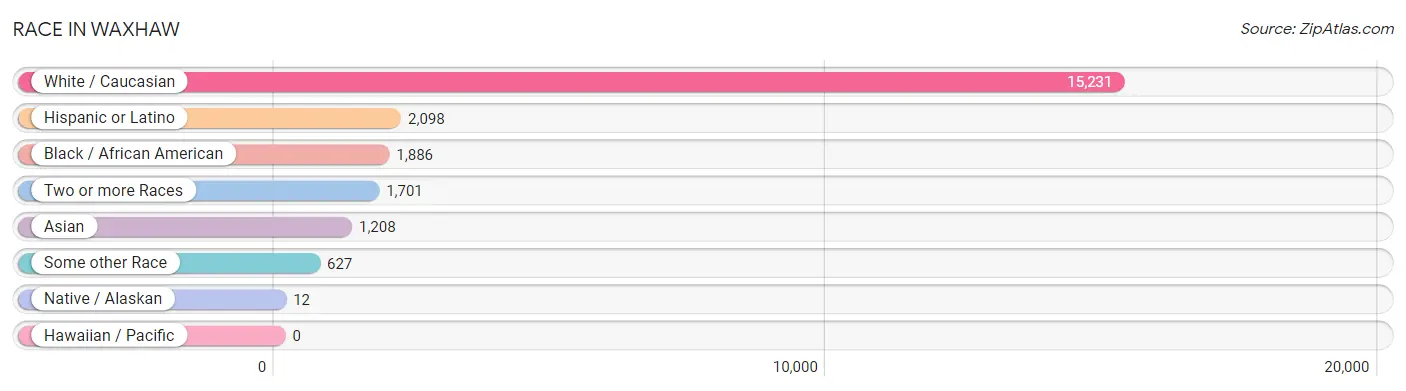
| Race | # Population | % Population |
| Asian | 1,208 | 5.9% |
| Black / African American | 1,886 | 9.1% |
| Hawaiian / Pacific | 0 | 0.0% |
| Hispanic or Latino | 2,098 | 10.2% |
| Native / Alaskan | 12 | 0.1% |
| White / Caucasian | 15,231 | 73.7% |
| Two or more Races | 1,701 | 8.2% |
| Some other Race | 627 | 3.0% |
| Total | 20,665 | 100.0% |
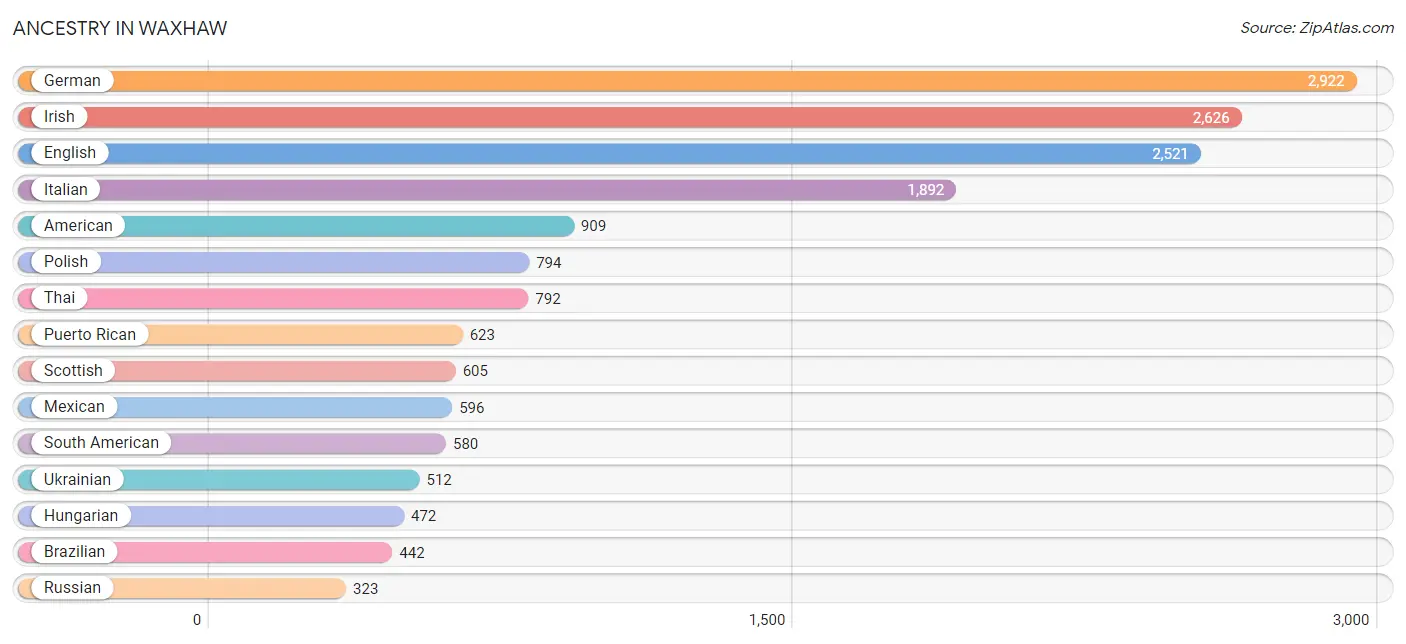
Ancestry in Waxhaw
The most populous ancestries reported in Waxhaw are German (2,922 | 14.1%), Irish (2,626 | 12.7%), English (2,521 | 12.2%), Italian (1,892 | 9.2%), and American (909 | 4.4%), together accounting for 52.6% of all Waxhaw residents.
| Ancestry | # Population | % Population |
| African | 45 | 0.2% |
| American | 909 | 4.4% |
| Arab | 198 | 1.0% |
| Barbadian | 44 | 0.2% |
| Belgian | 19 | 0.1% |
| Bhutanese | 119 | 0.6% |
| Brazilian | 442 | 2.1% |
| British | 81 | 0.4% |
| Burmese | 58 | 0.3% |
| Canadian | 17 | 0.1% |
| Central American | 153 | 0.7% |
| Chippewa | 5 | 0.0% |
| Choctaw | 15 | 0.1% |
| Colombian | 193 | 0.9% |
| Costa Rican | 36 | 0.2% |
| Cuban | 64 | 0.3% |
| Czech | 38 | 0.2% |
| Dominican | 75 | 0.4% |
| Dutch | 268 | 1.3% |
| Eastern European | 58 | 0.3% |
| Ecuadorian | 320 | 1.5% |
| English | 2,521 | 12.2% |
| Estonian | 8 | 0.0% |
| European | 311 | 1.5% |
| Filipino | 16 | 0.1% |
| Finnish | 17 | 0.1% |
| French | 263 | 1.3% |
| French Canadian | 24 | 0.1% |
| German | 2,922 | 14.1% |
| Greek | 244 | 1.2% |
| Guatemalan | 4 | 0.0% |
| Guyanese | 25 | 0.1% |
| Haitian | 133 | 0.6% |
| Honduran | 113 | 0.5% |
| Hungarian | 472 | 2.3% |
| Indian (Asian) | 245 | 1.2% |
| Iranian | 8 | 0.0% |
| Irish | 2,626 | 12.7% |
| Italian | 1,892 | 9.2% |
| Jamaican | 64 | 0.3% |
| Korean | 241 | 1.2% |
| Lebanese | 65 | 0.3% |
| Liberian | 98 | 0.5% |
| Lithuanian | 92 | 0.4% |
| Malaysian | 36 | 0.2% |
| Mexican | 596 | 2.9% |
| Native Hawaiian | 30 | 0.2% |
| Norwegian | 152 | 0.7% |
| Palestinian | 6 | 0.0% |
| Peruvian | 52 | 0.3% |
| Polish | 794 | 3.8% |
| Portuguese | 116 | 0.6% |
| Puerto Rican | 623 | 3.0% |
| Russian | 323 | 1.6% |
| Scandinavian | 41 | 0.2% |
| Scotch-Irish | 286 | 1.4% |
| Scottish | 605 | 2.9% |
| Slovak | 81 | 0.4% |
| South African | 65 | 0.3% |
| South American | 580 | 2.8% |
| Spaniard | 7 | 0.0% |
| Subsaharan African | 321 | 1.5% |
| Swedish | 283 | 1.4% |
| Swiss | 298 | 1.4% |
| Thai | 792 | 3.8% |
| Trinidadian and Tobagonian | 44 | 0.2% |
| Turkish | 38 | 0.2% |
| Ugandan | 113 | 0.5% |
| Ukrainian | 512 | 2.5% |
| Venezuelan | 15 | 0.1% |
| Welsh | 56 | 0.3% | View All 71 Rows |
Immigrants in Waxhaw
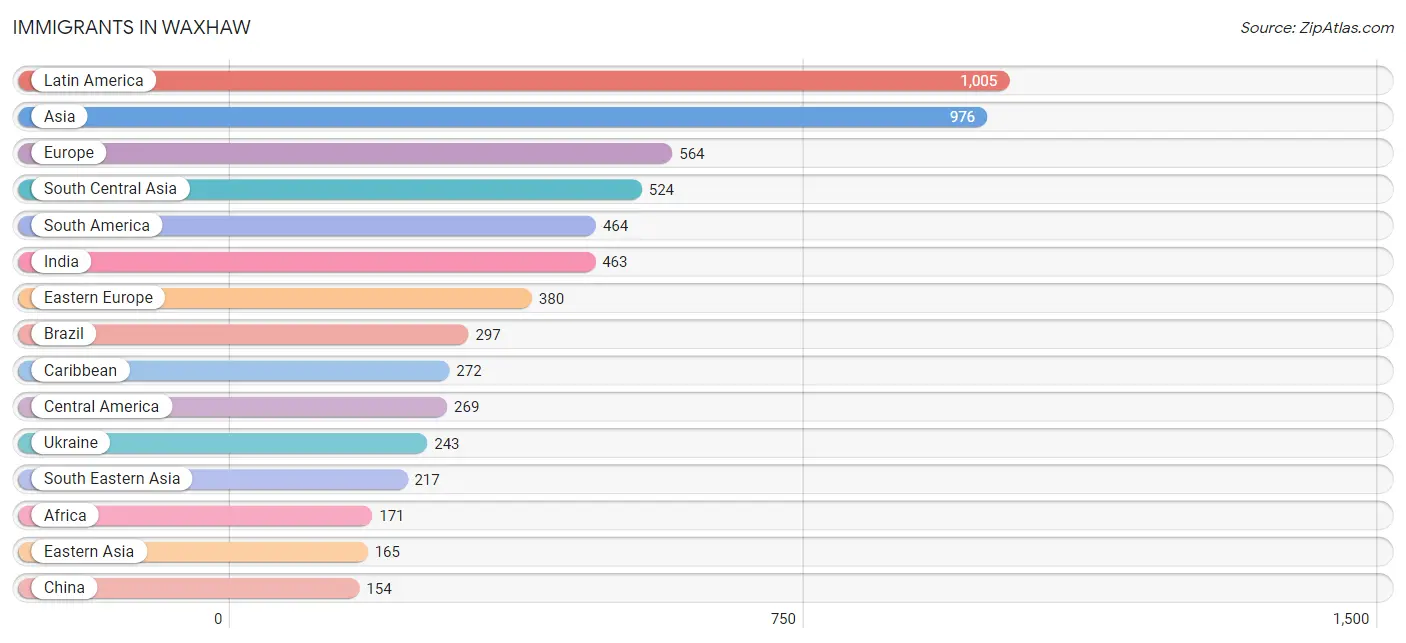
The most numerous immigrant groups reported in Waxhaw came from Latin America (1,005 | 4.9%), Asia (976 | 4.7%), Europe (564 | 2.7%), South Central Asia (524 | 2.5%), and South America (464 | 2.2%), together accounting for 17.1% of all Waxhaw residents.
| Immigration Origin | # Population | % Population |
| Africa | 171 | 0.8% |
| Asia | 976 | 4.7% |
| Australia | 17 | 0.1% |
| Belarus | 8 | 0.0% |
| Brazil | 297 | 1.4% |
| Canada | 42 | 0.2% |
| Caribbean | 272 | 1.3% |
| Central America | 269 | 1.3% |
| China | 154 | 0.7% |
| Colombia | 106 | 0.5% |
| Costa Rica | 36 | 0.2% |
| Dominican Republic | 47 | 0.2% |
| Eastern Africa | 15 | 0.1% |
| Eastern Asia | 165 | 0.8% |
| Eastern Europe | 380 | 1.8% |
| Europe | 564 | 2.7% |
| Germany | 11 | 0.1% |
| Greece | 11 | 0.1% |
| Guatemala | 4 | 0.0% |
| Haiti | 133 | 0.6% |
| Honduras | 107 | 0.5% |
| Hong Kong | 22 | 0.1% |
| India | 463 | 2.2% |
| Ireland | 23 | 0.1% |
| Italy | 4 | 0.0% |
| Jamaica | 92 | 0.4% |
| Jordan | 52 | 0.3% |
| Korea | 11 | 0.1% |
| Laos | 21 | 0.1% |
| Latin America | 1,005 | 4.9% |
| Lebanon | 18 | 0.1% |
| Liberia | 98 | 0.5% |
| Malaysia | 32 | 0.2% |
| Mexico | 122 | 0.6% |
| Northern Europe | 148 | 0.7% |
| Oceania | 17 | 0.1% |
| Pakistan | 11 | 0.1% |
| Peru | 16 | 0.1% |
| Philippines | 140 | 0.7% |
| Poland | 45 | 0.2% |
| Portugal | 10 | 0.1% |
| Russia | 74 | 0.4% |
| Scotland | 17 | 0.1% |
| South Africa | 58 | 0.3% |
| South America | 464 | 2.2% |
| South Central Asia | 524 | 2.5% |
| South Eastern Asia | 217 | 1.1% |
| Southern Europe | 25 | 0.1% |
| Uganda | 15 | 0.1% |
| Ukraine | 243 | 1.2% |
| Venezuela | 45 | 0.2% |
| Vietnam | 24 | 0.1% |
| Western Africa | 98 | 0.5% |
| Western Asia | 70 | 0.3% |
| Western Europe | 11 | 0.1% | View All 55 Rows |
Sex and Age in Waxhaw
Sex and Age in Waxhaw
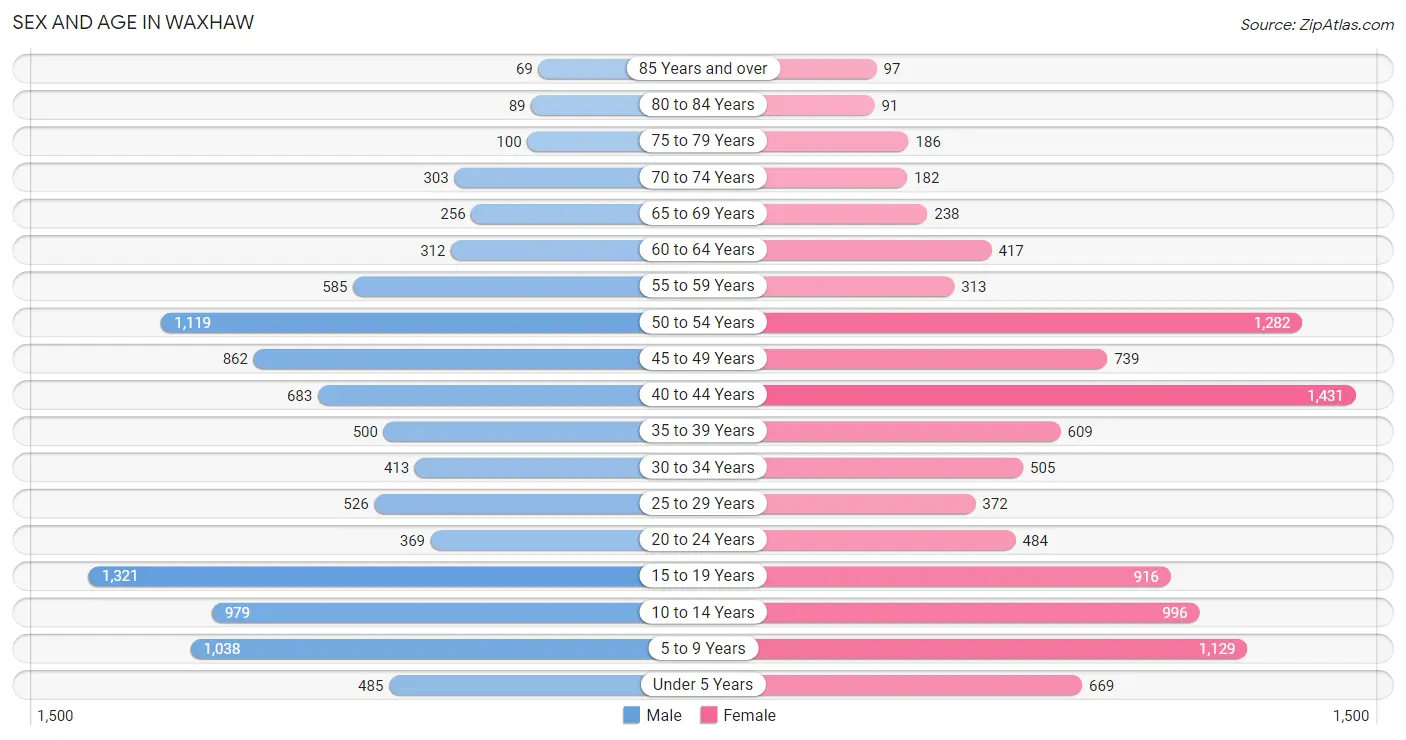
The most populous age groups in Waxhaw are 15 to 19 Years (1,321 | 13.2%) for men and 40 to 44 Years (1,431 | 13.4%) for women.
| Age Bracket | Male | Female |
| Under 5 Years | 485 (4.9%) | 669 (6.3%) |
| 5 to 9 Years | 1,038 (10.4%) | 1,129 (10.6%) |
| 10 to 14 Years | 979 (9.8%) | 996 (9.3%) |
| 15 to 19 Years | 1,321 (13.2%) | 916 (8.6%) |
| 20 to 24 Years | 369 (3.7%) | 484 (4.5%) |
| 25 to 29 Years | 526 (5.3%) | 372 (3.5%) |
| 30 to 34 Years | 413 (4.1%) | 505 (4.7%) |
| 35 to 39 Years | 500 (5.0%) | 609 (5.7%) |
| 40 to 44 Years | 683 (6.8%) | 1,431 (13.4%) |
| 45 to 49 Years | 862 (8.6%) | 739 (6.9%) |
| 50 to 54 Years | 1,119 (11.2%) | 1,282 (12.0%) |
| 55 to 59 Years | 585 (5.8%) | 313 (2.9%) |
| 60 to 64 Years | 312 (3.1%) | 417 (3.9%) |
| 65 to 69 Years | 256 (2.6%) | 238 (2.2%) |
| 70 to 74 Years | 303 (3.0%) | 182 (1.7%) |
| 75 to 79 Years | 100 (1.0%) | 186 (1.8%) |
| 80 to 84 Years | 89 (0.9%) | 91 (0.9%) |
| 85 Years and over | 69 (0.7%) | 97 (0.9%) |
| Total | 10,009 (100.0%) | 10,656 (100.0%) |
Families and Households in Waxhaw
Median Family Size in Waxhaw
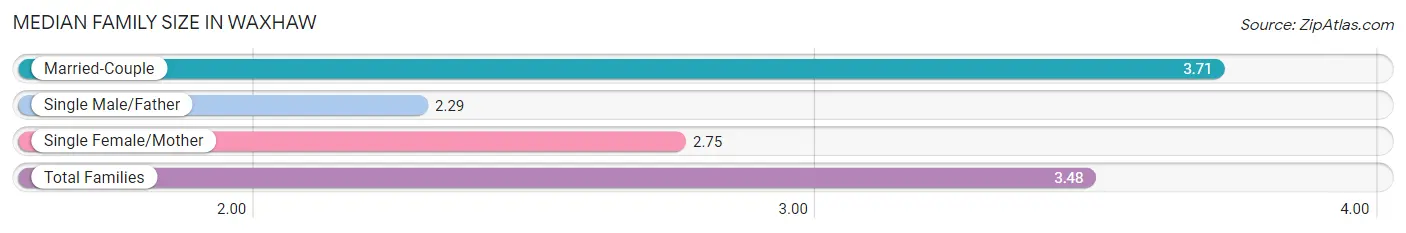
The median family size in Waxhaw is 3.48 persons per family, with married-couple families (4,369 | 79.7%) accounting for the largest median family size of 3.71 persons per family. On the other hand, single male/father families (405 | 7.4%) represent the smallest median family size with 2.29 persons per family.
| Family Type | # Families | Family Size |
| Married-Couple | 4,369 (79.7%) | 3.71 |
| Single Male/Father | 405 (7.4%) | 2.29 |
| Single Female/Mother | 705 (12.9%) | 2.75 |
| Total Families | 5,479 (100.0%) | 3.48 |
Median Household Size in Waxhaw
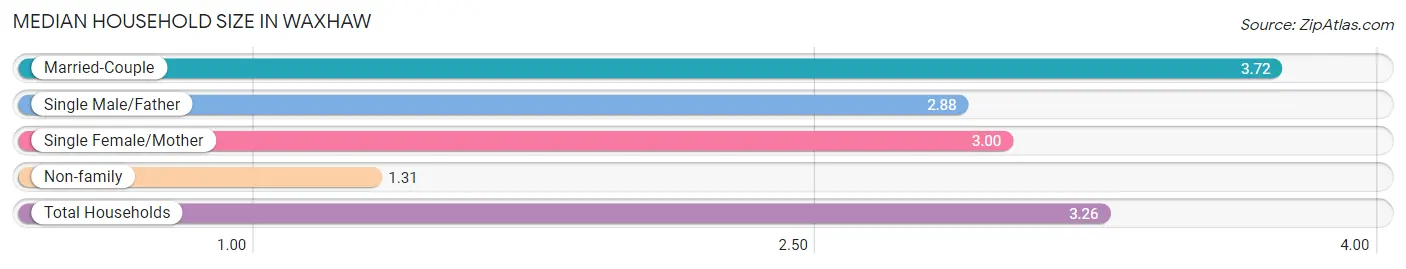
The median household size in Waxhaw is 3.26 persons per household, with married-couple households (4,369 | 69.2%) accounting for the largest median household size of 3.72 persons per household. non-family households (833 | 13.2%) represent the smallest median household size with 1.31 persons per household.
| Household Type | # Households | Household Size |
| Married-Couple | 4,369 (69.2%) | 3.72 |
| Single Male/Father | 405 (6.4%) | 2.88 |
| Single Female/Mother | 705 (11.2%) | 3.00 |
| Non-family | 833 (13.2%) | 1.31 |
| Total Households | 6,312 (100.0%) | 3.26 |
Household Size by Marriage Status in Waxhaw
Out of a total of 6,312 households in Waxhaw, 5,479 (86.8%) are family households, while 833 (13.2%) are nonfamily households. The most numerous type of family households are 4-person households, comprising 1,691, and the most common type of nonfamily households are 1-person households, comprising 605.
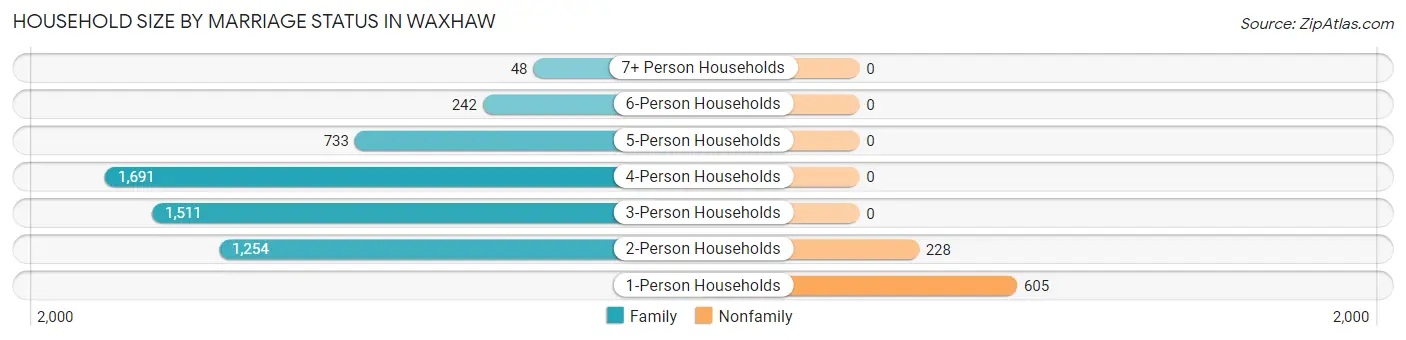
| Household Size | Family Households | Nonfamily Households |
| 1-Person Households | - | 605 (9.6%) |
| 2-Person Households | 1,254 (19.9%) | 228 (3.6%) |
| 3-Person Households | 1,511 (23.9%) | 0 (0.0%) |
| 4-Person Households | 1,691 (26.8%) | 0 (0.0%) |
| 5-Person Households | 733 (11.6%) | 0 (0.0%) |
| 6-Person Households | 242 (3.8%) | 0 (0.0%) |
| 7+ Person Households | 48 (0.8%) | 0 (0.0%) |
| Total | 5,479 (86.8%) | 833 (13.2%) |
Female Fertility in Waxhaw
Fertility by Age in Waxhaw
Average fertility rate in Waxhaw is 50.0 births per 1,000 women. Women in the age bracket of 20 to 34 years have the highest fertility rate with 146.0 births per 1,000 women. Women in the age bracket of 20 to 34 years acount for 74.5% of all women with births.
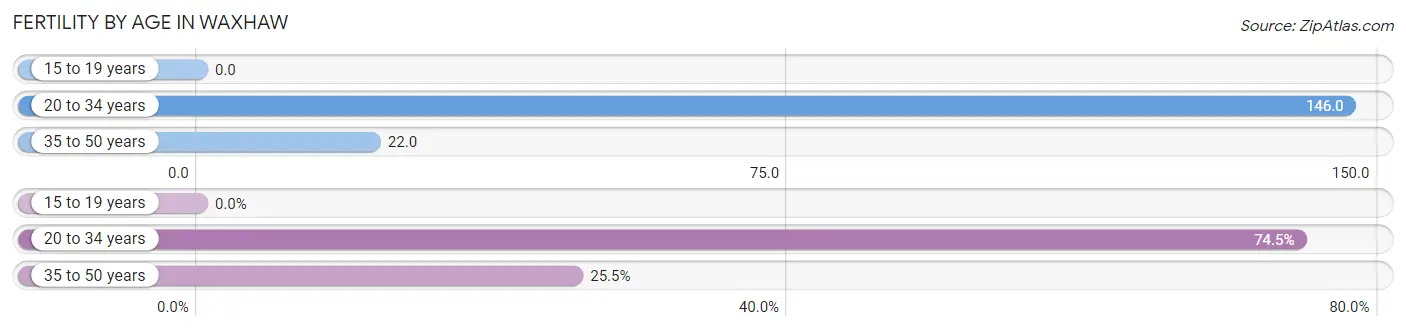
| Age Bracket | Women with Births | Births / 1,000 Women |
| 15 to 19 years | 0 (0.0%) | 0.0 |
| 20 to 34 years | 199 (74.5%) | 146.0 |
| 35 to 50 years | 68 (25.5%) | 22.0 |
| Total | 267 (100.0%) | 50.0 |
Fertility by Age by Marriage Status in Waxhaw
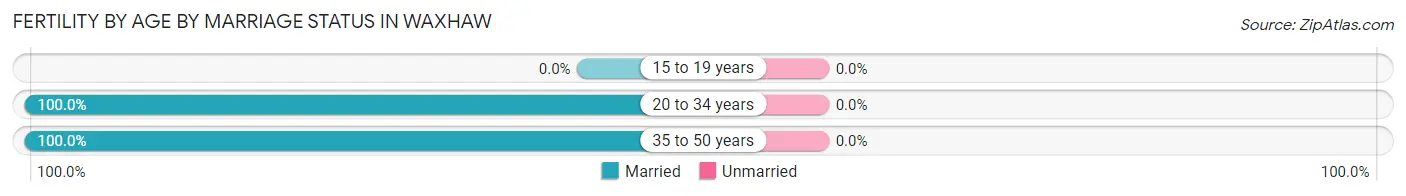
| Age Bracket | Married | Unmarried |
| 15 to 19 years | 0 (0.0%) | 0 (0.0%) |
| 20 to 34 years | 199 (100.0%) | 0 (0.0%) |
| 35 to 50 years | 68 (100.0%) | 0 (0.0%) |
| Total | 267 (100.0%) | 0 (0.0%) |
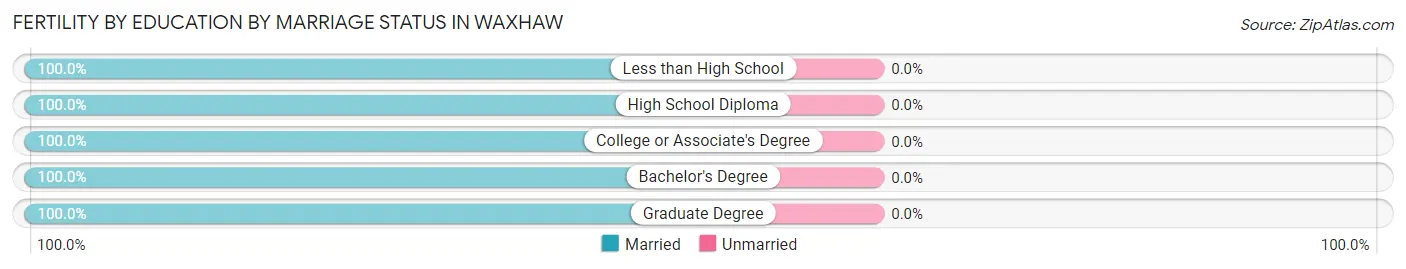
Fertility by Education in Waxhaw
Average fertility rate in Waxhaw is 50.0 births per 1,000 women. Women with the education attainment of college or associate's degree have the highest fertility rate of 82.0 births per 1,000 women, while women with the education attainment of less than high school have the lowest fertility at 9.0 births per 1,000 women. Women with the education attainment of bachelor's degree represent 58.1% of all women with births.
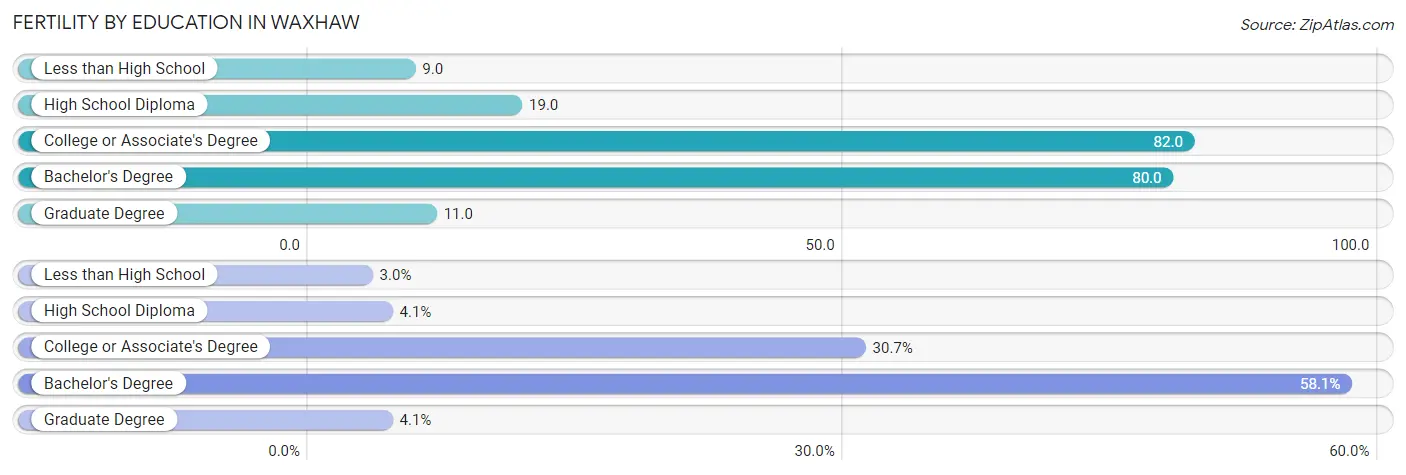
| Educational Attainment | Women with Births | Births / 1,000 Women |
| Less than High School | 8 (3.0%) | 9.0 |
| High School Diploma | 11 (4.1%) | 19.0 |
| College or Associate's Degree | 82 (30.7%) | 82.0 |
| Bachelor's Degree | 155 (58.1%) | 80.0 |
| Graduate Degree | 11 (4.1%) | 11.0 |
| Total | 267 (100.0%) | 50.0 |
Fertility by Education by Marriage Status in Waxhaw
| Educational Attainment | Married | Unmarried |
| Less than High School | 8 (100.0%) | 0 (0.0%) |
| High School Diploma | 11 (100.0%) | 0 (0.0%) |
| College or Associate's Degree | 82 (100.0%) | 0 (0.0%) |
| Bachelor's Degree | 155 (100.0%) | 0 (0.0%) |
| Graduate Degree | 11 (100.0%) | 0 (0.0%) |
| Total | 267 (100.0%) | 0 (0.0%) |
Employment Characteristics in Waxhaw
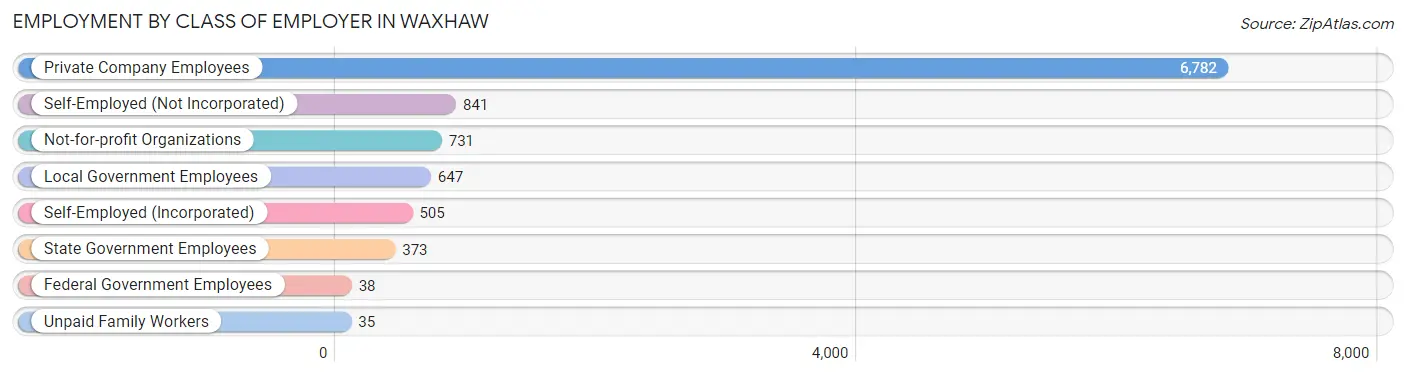
Employment by Class of Employer in Waxhaw
Among the 9,952 employed individuals in Waxhaw, private company employees (6,782 | 68.1%), self-employed (not incorporated) (841 | 8.5%), and not-for-profit organizations (731 | 7.3%) make up the most common classes of employment.
| Employer Class | # Employees | % Employees |
| Private Company Employees | 6,782 | 68.1% |
| Self-Employed (Incorporated) | 505 | 5.1% |
| Self-Employed (Not Incorporated) | 841 | 8.5% |
| Not-for-profit Organizations | 731 | 7.3% |
| Local Government Employees | 647 | 6.5% |
| State Government Employees | 373 | 3.7% |
| Federal Government Employees | 38 | 0.4% |
| Unpaid Family Workers | 35 | 0.4% |
| Total | 9,952 | 100.0% |
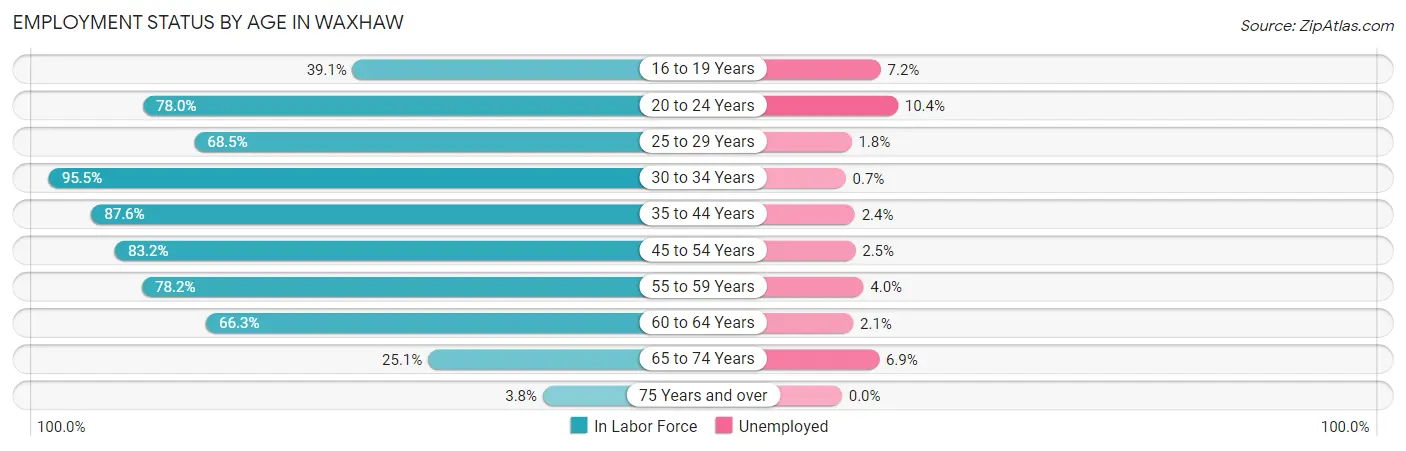
Employment Status by Age in Waxhaw
According to the labor force statistics for Waxhaw, out of the total population over 16 years of age (14,976), 70.0% or 10,483 individuals are in the labor force, with 3.3% or 346 of them unemployed. The age group with the highest labor force participation rate is 30 to 34 years, with 95.5% or 877 individuals in the labor force. Within the labor force, the 20 to 24 years age range has the highest percentage of unemployed individuals, with 10.4% or 69 of them being unemployed.
| Age Bracket | In Labor Force | Unemployed |
| 16 to 19 Years | 721 (39.1%) | 52 (7.2%) |
| 20 to 24 Years | 665 (78.0%) | 69 (10.4%) |
| 25 to 29 Years | 615 (68.5%) | 11 (1.8%) |
| 30 to 34 Years | 877 (95.5%) | 6 (0.7%) |
| 35 to 44 Years | 2,823 (87.6%) | 68 (2.4%) |
| 45 to 54 Years | 3,330 (83.2%) | 83 (2.5%) |
| 55 to 59 Years | 702 (78.2%) | 28 (4.0%) |
| 60 to 64 Years | 483 (66.3%) | 10 (2.1%) |
| 65 to 74 Years | 246 (25.1%) | 17 (6.9%) |
| 75 Years and over | 24 (3.8%) | 0 (0.0%) |
| Total | 10,483 (70.0%) | 346 (3.3%) |
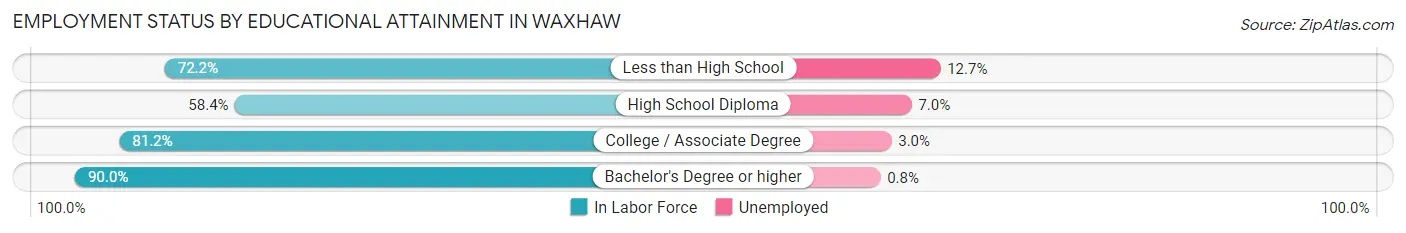
Employment Status by Educational Attainment in Waxhaw
According to labor force statistics for Waxhaw, 82.8% of individuals (8,833) out of the total population between 25 and 64 years of age (10,668) are in the labor force, with 2.3% or 203 of them being unemployed. The group with the highest labor force participation rate are those with the educational attainment of bachelor's degree or higher, with 90.0% or 5,486 individuals in the labor force. Within the labor force, individuals with less than high school education have the highest percentage of unemployment, with 12.7% or 30 of them being unemployed.
| Educational Attainment | In Labor Force | Unemployed |
| Less than High School | 236 (72.2%) | 42 (12.7%) |
| High School Diploma | 871 (58.4%) | 104 (7.0%) |
| College / Associate Degree | 2,236 (81.2%) | 83 (3.0%) |
| Bachelor's Degree or higher | 5,486 (90.0%) | 49 (0.8%) |
| Total | 8,833 (82.8%) | 245 (2.3%) |
Employment Occupations by Sex in Waxhaw
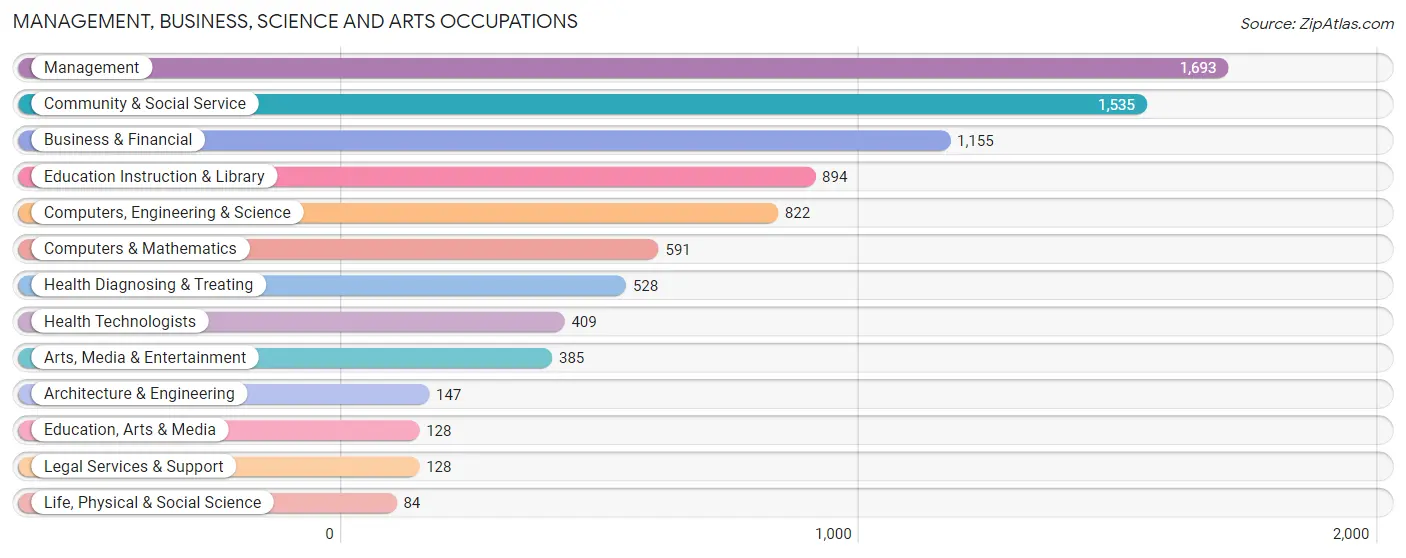
Management, Business, Science and Arts Occupations
The most common Management, Business, Science and Arts occupations in Waxhaw are Management (1,693 | 16.7%), Community & Social Service (1,535 | 15.1%), Business & Financial (1,155 | 11.4%), Education Instruction & Library (894 | 8.8%), and Computers, Engineering & Science (822 | 8.1%).
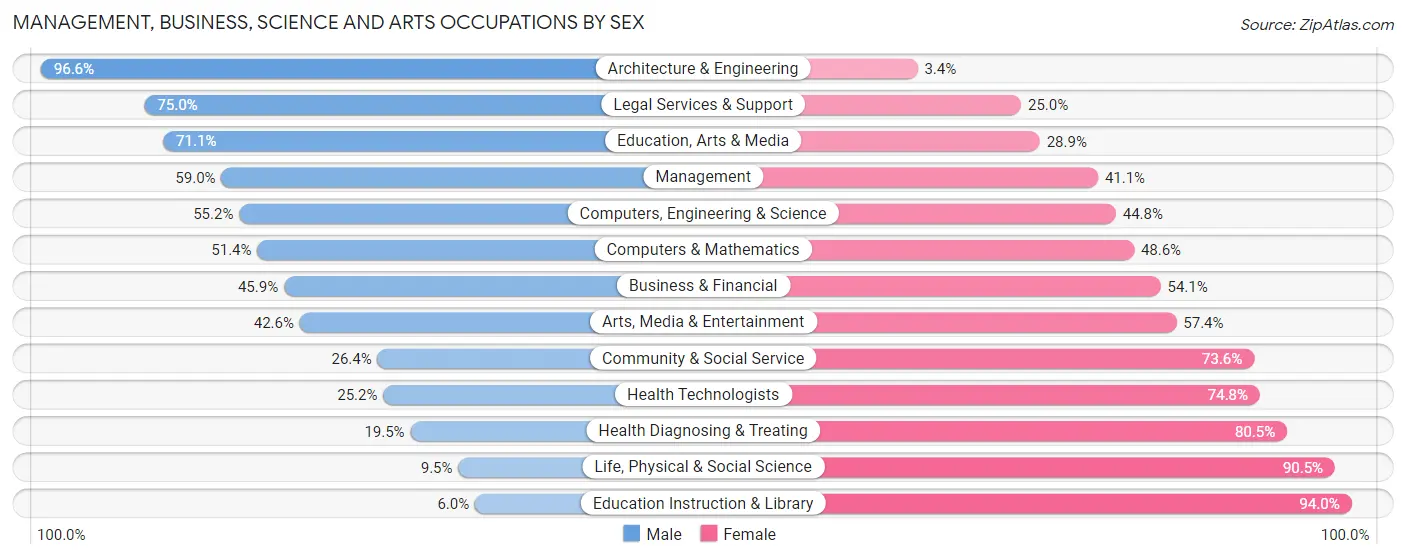
Management, Business, Science and Arts Occupations by Sex
Within the Management, Business, Science and Arts occupations in Waxhaw, the most male-oriented occupations are Architecture & Engineering (96.6%), Legal Services & Support (75.0%), and Education, Arts & Media (71.1%), while the most female-oriented occupations are Education Instruction & Library (94.0%), Life, Physical & Social Science (90.5%), and Health Diagnosing & Treating (80.5%).
| Occupation | Male | Female |
| Management | 998 (59.0%) | 695 (41.0%) |
| Business & Financial | 530 (45.9%) | 625 (54.1%) |
| Computers, Engineering & Science | 454 (55.2%) | 368 (44.8%) |
| Computers & Mathematics | 304 (51.4%) | 287 (48.6%) |
| Architecture & Engineering | 142 (96.6%) | 5 (3.4%) |
| Life, Physical & Social Science | 8 (9.5%) | 76 (90.5%) |
| Community & Social Service | 405 (26.4%) | 1,130 (73.6%) |
| Education, Arts & Media | 91 (71.1%) | 37 (28.9%) |
| Legal Services & Support | 96 (75.0%) | 32 (25.0%) |
| Education Instruction & Library | 54 (6.0%) | 840 (94.0%) |
| Arts, Media & Entertainment | 164 (42.6%) | 221 (57.4%) |
| Health Diagnosing & Treating | 103 (19.5%) | 425 (80.5%) |
| Health Technologists | 103 (25.2%) | 306 (74.8%) |
| Total (Category) | 2,490 (43.4%) | 3,243 (56.6%) |
| Total (Overall) | 5,059 (49.9%) | 5,085 (50.1%) |
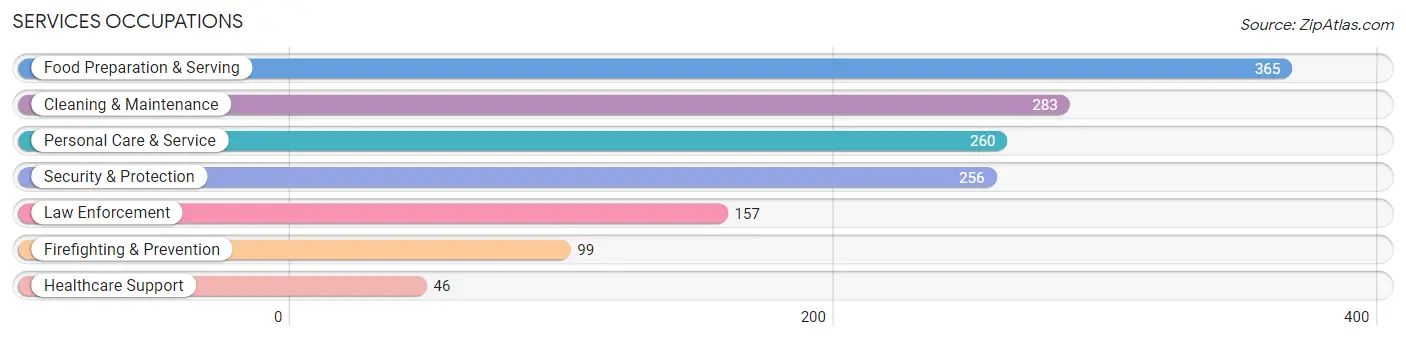
Services Occupations
The most common Services occupations in Waxhaw are Food Preparation & Serving (365 | 3.6%), Cleaning & Maintenance (283 | 2.8%), Personal Care & Service (260 | 2.6%), Security & Protection (256 | 2.5%), and Law Enforcement (157 | 1.5%).
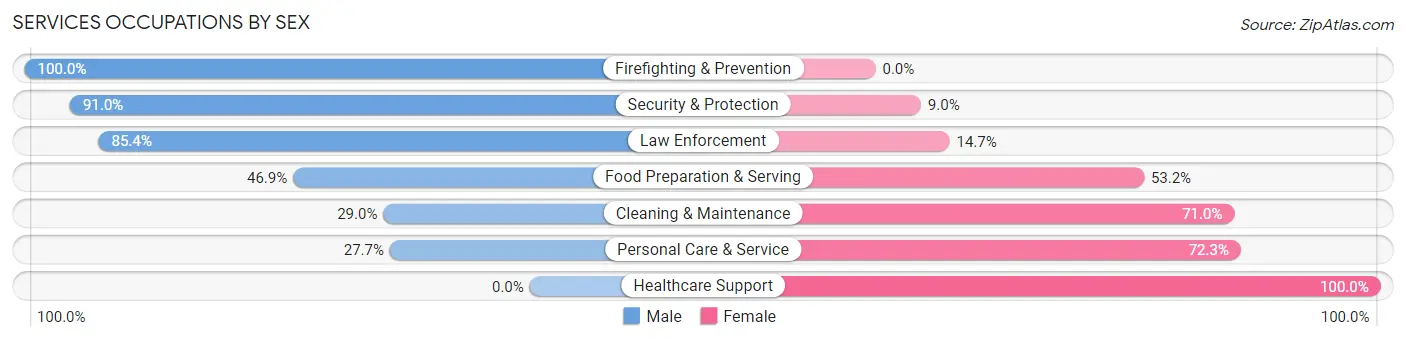
Services Occupations by Sex
Within the Services occupations in Waxhaw, the most male-oriented occupations are Firefighting & Prevention (100.0%), Security & Protection (91.0%), and Law Enforcement (85.4%), while the most female-oriented occupations are Healthcare Support (100.0%), Personal Care & Service (72.3%), and Cleaning & Maintenance (71.0%).
| Occupation | Male | Female |
| Healthcare Support | 0 (0.0%) | 46 (100.0%) |
| Security & Protection | 233 (91.0%) | 23 (9.0%) |
| Firefighting & Prevention | 99 (100.0%) | 0 (0.0%) |
| Law Enforcement | 134 (85.4%) | 23 (14.6%) |
| Food Preparation & Serving | 171 (46.9%) | 194 (53.1%) |
| Cleaning & Maintenance | 82 (29.0%) | 201 (71.0%) |
| Personal Care & Service | 72 (27.7%) | 188 (72.3%) |
| Total (Category) | 558 (46.1%) | 652 (53.9%) |
| Total (Overall) | 5,059 (49.9%) | 5,085 (50.1%) |
Sales and Office Occupations
The most common Sales and Office occupations in Waxhaw are Sales & Related (1,434 | 14.1%), and Office & Administration (546 | 5.4%).
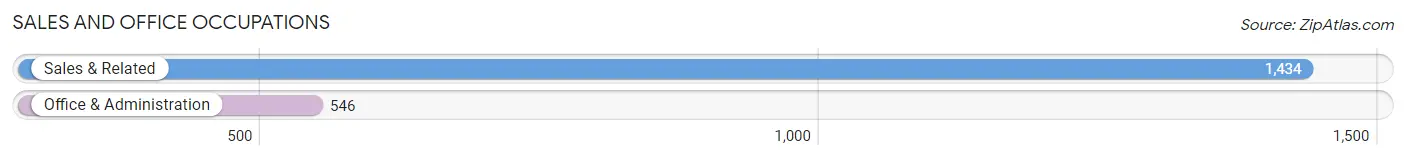
Sales and Office Occupations by Sex
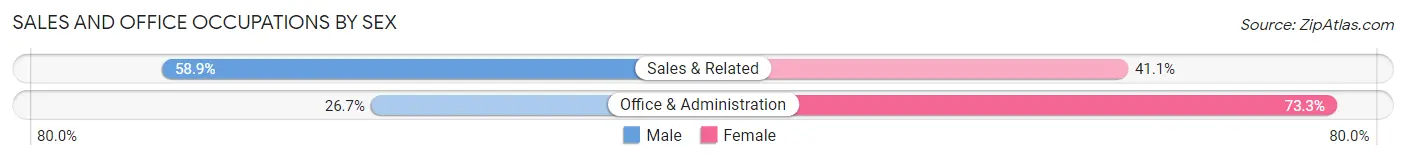
| Occupation | Male | Female |
| Sales & Related | 844 (58.9%) | 590 (41.1%) |
| Office & Administration | 146 (26.7%) | 400 (73.3%) |
| Total (Category) | 990 (50.0%) | 990 (50.0%) |
| Total (Overall) | 5,059 (49.9%) | 5,085 (50.1%) |
Natural Resources, Construction and Maintenance Occupations
The most common Natural Resources, Construction and Maintenance occupations in Waxhaw are Construction & Extraction (339 | 3.3%), and Installation, Maintenance & Repair (232 | 2.3%).
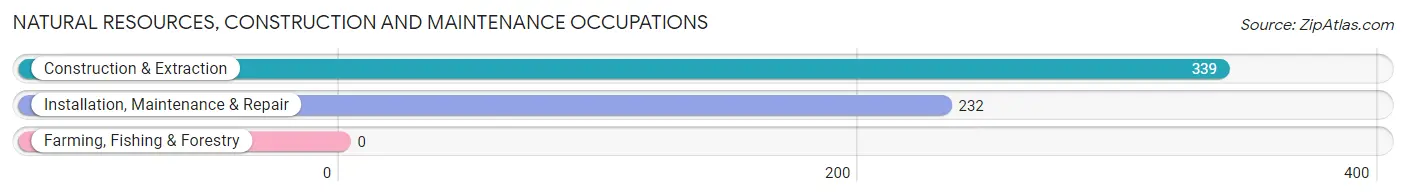
Natural Resources, Construction and Maintenance Occupations by Sex
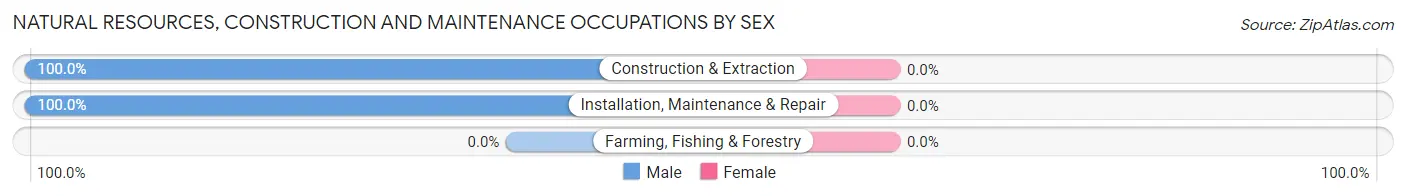
| Occupation | Male | Female |
| Farming, Fishing & Forestry | 0 (0.0%) | 0 (0.0%) |
| Construction & Extraction | 339 (100.0%) | 0 (0.0%) |
| Installation, Maintenance & Repair | 232 (100.0%) | 0 (0.0%) |
| Total (Category) | 571 (100.0%) | 0 (0.0%) |
| Total (Overall) | 5,059 (49.9%) | 5,085 (50.1%) |
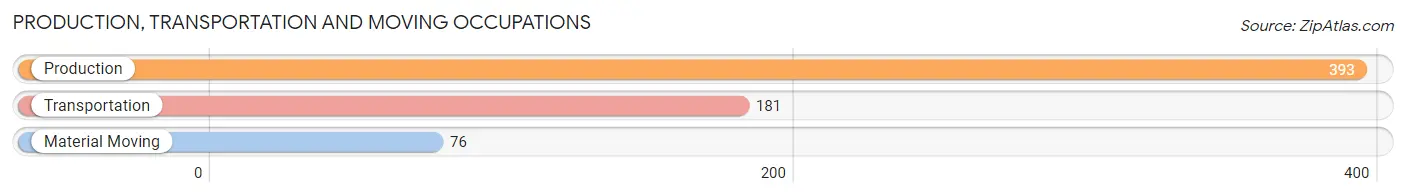
Production, Transportation and Moving Occupations
The most common Production, Transportation and Moving occupations in Waxhaw are Production (393 | 3.9%), Transportation (181 | 1.8%), and Material Moving (76 | 0.7%).
Production, Transportation and Moving Occupations by Sex
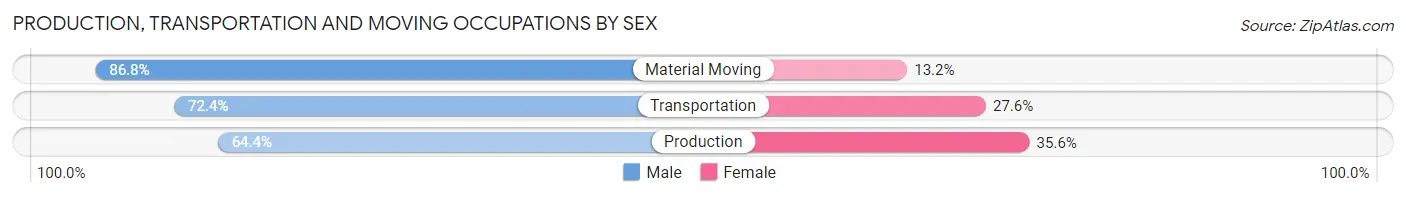
| Occupation | Male | Female |
| Production | 253 (64.4%) | 140 (35.6%) |
| Transportation | 131 (72.4%) | 50 (27.6%) |
| Material Moving | 66 (86.8%) | 10 (13.2%) |
| Total (Category) | 450 (69.2%) | 200 (30.8%) |
| Total (Overall) | 5,059 (49.9%) | 5,085 (50.1%) |
Employment Industries by Sex in Waxhaw
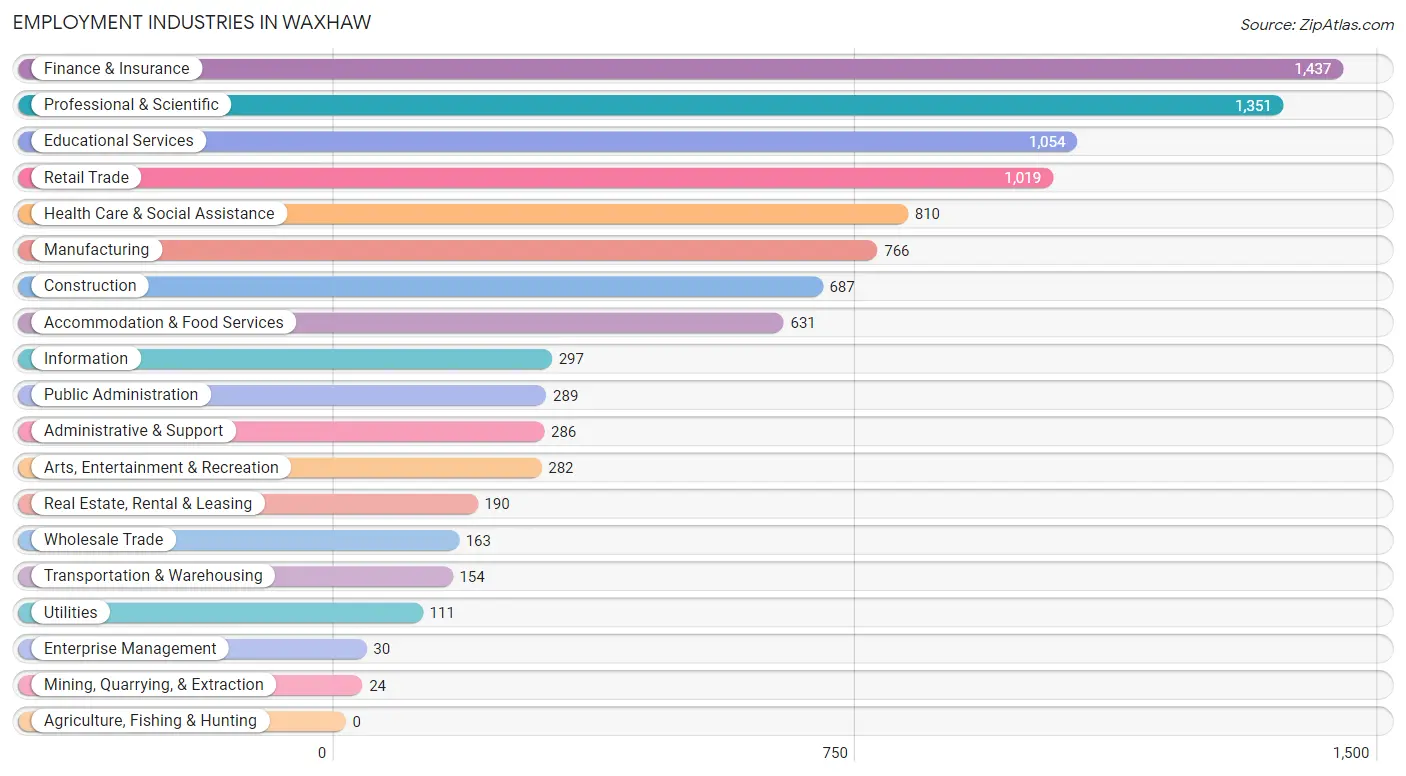
Employment Industries in Waxhaw
The major employment industries in Waxhaw include Finance & Insurance (1,437 | 14.2%), Professional & Scientific (1,351 | 13.3%), Educational Services (1,054 | 10.4%), Retail Trade (1,019 | 10.1%), and Health Care & Social Assistance (810 | 8.0%).
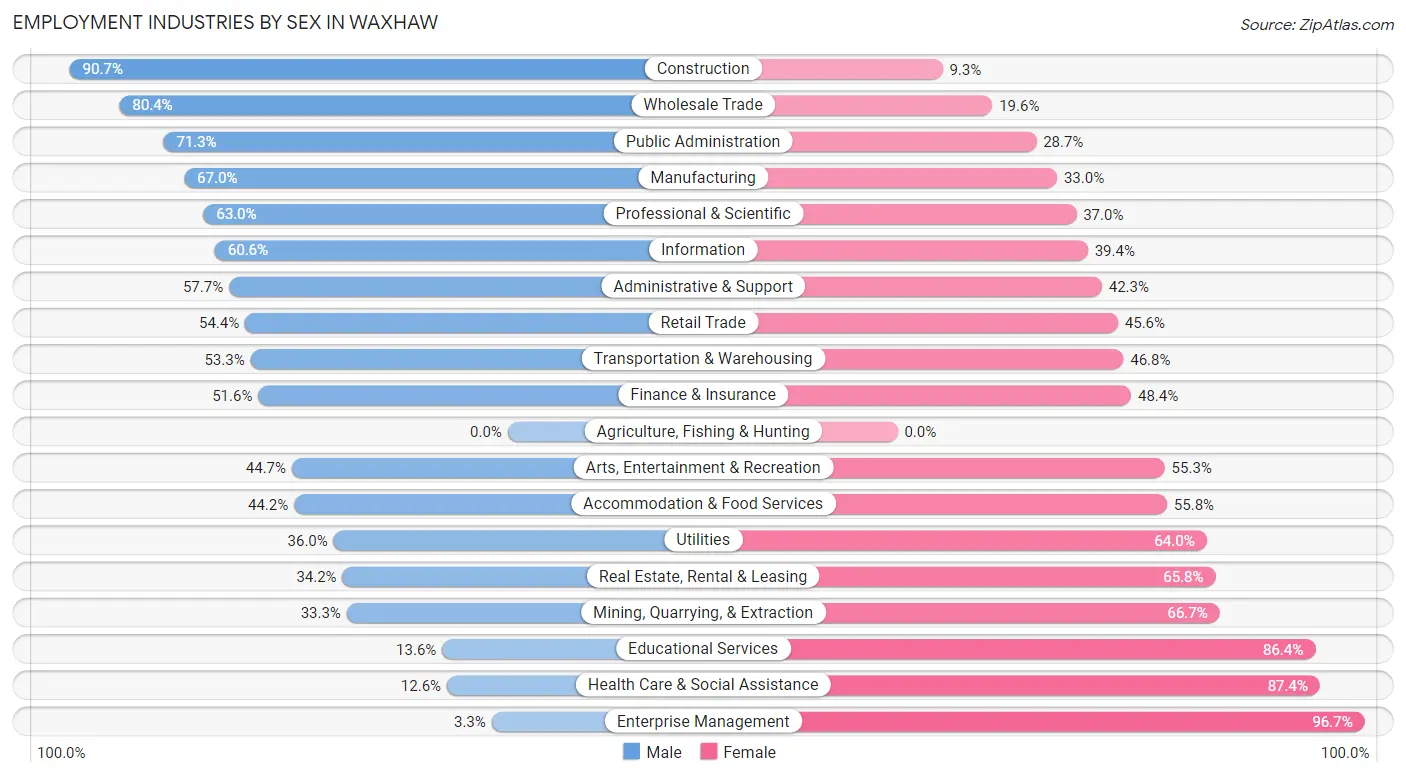
Employment Industries by Sex in Waxhaw
The Waxhaw industries that see more men than women are Construction (90.7%), Wholesale Trade (80.4%), and Public Administration (71.3%), whereas the industries that tend to have a higher number of women are Enterprise Management (96.7%), Health Care & Social Assistance (87.4%), and Educational Services (86.4%).
| Industry | Male | Female |
| Agriculture, Fishing & Hunting | 0 (0.0%) | 0 (0.0%) |
| Mining, Quarrying, & Extraction | 8 (33.3%) | 16 (66.7%) |
| Construction | 623 (90.7%) | 64 (9.3%) |
| Manufacturing | 513 (67.0%) | 253 (33.0%) |
| Wholesale Trade | 131 (80.4%) | 32 (19.6%) |
| Retail Trade | 554 (54.4%) | 465 (45.6%) |
| Transportation & Warehousing | 82 (53.2%) | 72 (46.8%) |
| Utilities | 40 (36.0%) | 71 (64.0%) |
| Information | 180 (60.6%) | 117 (39.4%) |
| Finance & Insurance | 742 (51.6%) | 695 (48.4%) |
| Real Estate, Rental & Leasing | 65 (34.2%) | 125 (65.8%) |
| Professional & Scientific | 851 (63.0%) | 500 (37.0%) |
| Enterprise Management | 1 (3.3%) | 29 (96.7%) |
| Administrative & Support | 165 (57.7%) | 121 (42.3%) |
| Educational Services | 143 (13.6%) | 911 (86.4%) |
| Health Care & Social Assistance | 102 (12.6%) | 708 (87.4%) |
| Arts, Entertainment & Recreation | 126 (44.7%) | 156 (55.3%) |
| Accommodation & Food Services | 279 (44.2%) | 352 (55.8%) |
| Public Administration | 206 (71.3%) | 83 (28.7%) |
| Total | 5,059 (49.9%) | 5,085 (50.1%) |
Education in Waxhaw
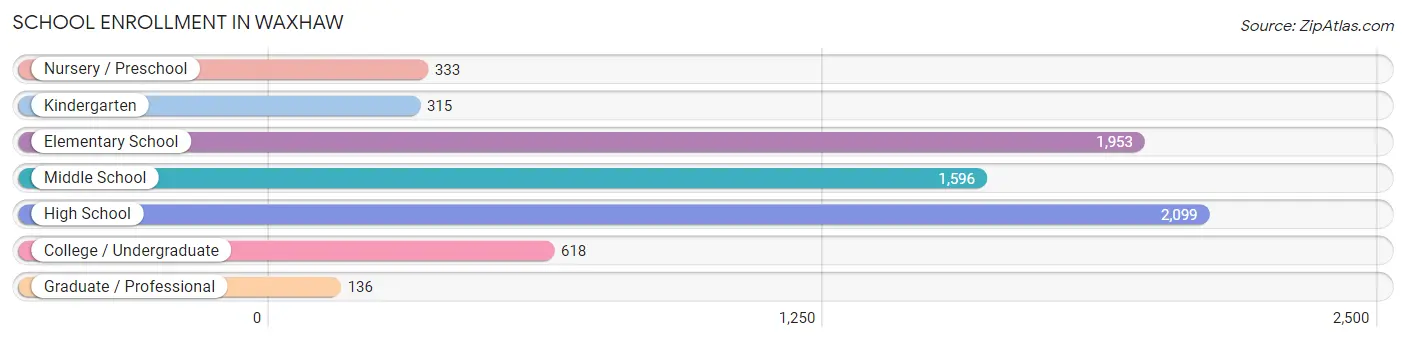
School Enrollment in Waxhaw
The most common levels of schooling among the 7,050 students in Waxhaw are high school (2,099 | 29.8%), elementary school (1,953 | 27.7%), and middle school (1,596 | 22.6%).
| School Level | # Students | % Students |
| Nursery / Preschool | 333 | 4.7% |
| Kindergarten | 315 | 4.5% |
| Elementary School | 1,953 | 27.7% |
| Middle School | 1,596 | 22.6% |
| High School | 2,099 | 29.8% |
| College / Undergraduate | 618 | 8.8% |
| Graduate / Professional | 136 | 1.9% |
| Total | 7,050 | 100.0% |
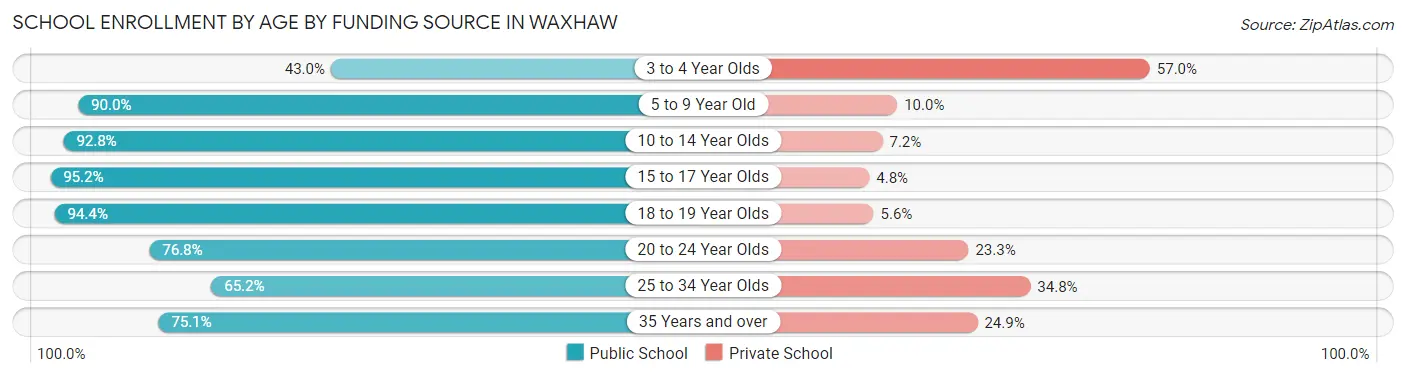
School Enrollment by Age by Funding Source in Waxhaw
Out of a total of 7,050 students who are enrolled in schools in Waxhaw, 754 (10.7%) attend a private institution, while the remaining 6,296 (89.3%) are enrolled in public schools. The age group of 3 to 4 year olds has the highest likelihood of being enrolled in private schools, with 146 (57.0% in the age bracket) enrolled. Conversely, the age group of 15 to 17 year olds has the lowest likelihood of being enrolled in a private school, with 1,615 (95.2% in the age bracket) attending a public institution.
| Age Bracket | Public School | Private School |
| 3 to 4 Year Olds | 110 (43.0%) | 146 (57.0%) |
| 5 to 9 Year Old | 1,886 (90.0%) | 209 (10.0%) |
| 10 to 14 Year Olds | 1,832 (92.8%) | 143 (7.2%) |
| 15 to 17 Year Olds | 1,615 (95.2%) | 81 (4.8%) |
| 18 to 19 Year Olds | 406 (94.4%) | 24 (5.6%) |
| 20 to 24 Year Olds | 175 (76.7%) | 53 (23.3%) |
| 25 to 34 Year Olds | 45 (65.2%) | 24 (34.8%) |
| 35 Years and over | 226 (75.1%) | 75 (24.9%) |
| Total | 6,296 (89.3%) | 754 (10.7%) |
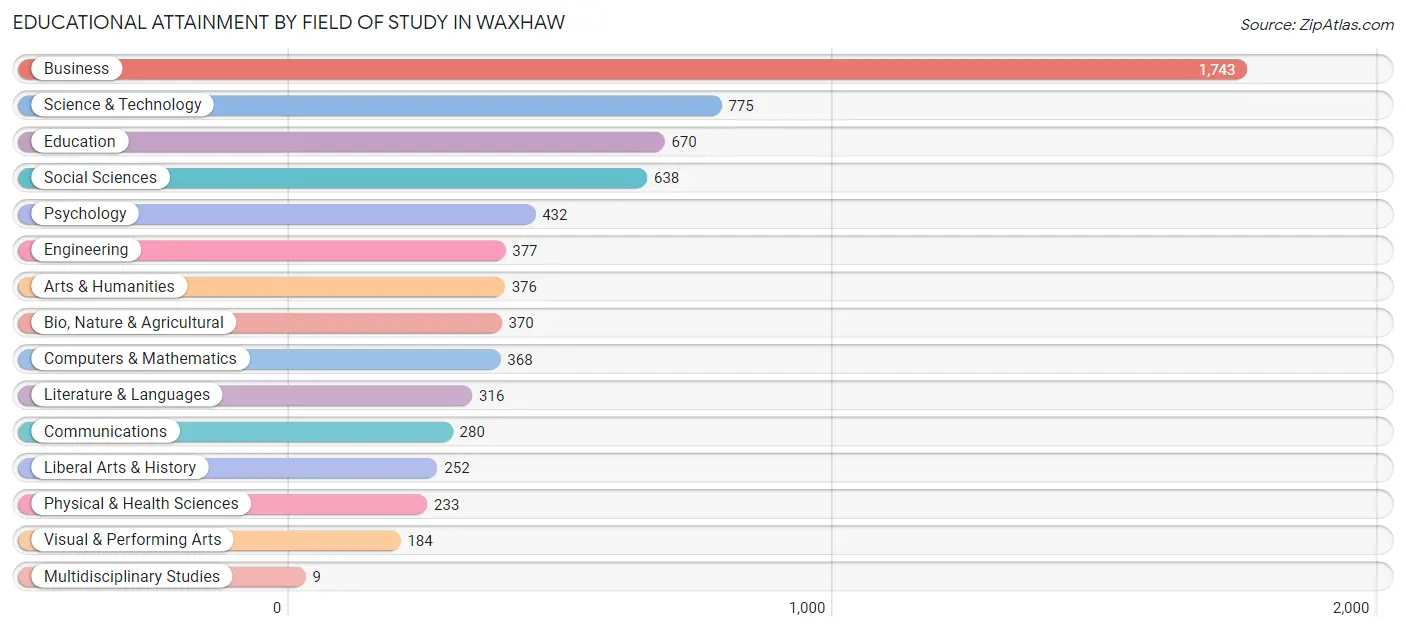
Educational Attainment by Field of Study in Waxhaw
Business (1,743 | 24.8%), science & technology (775 | 11.0%), education (670 | 9.5%), social sciences (638 | 9.1%), and psychology (432 | 6.1%) are the most common fields of study among 7,023 individuals in Waxhaw who have obtained a bachelor's degree or higher.
| Field of Study | # Graduates | % Graduates |
| Computers & Mathematics | 368 | 5.2% |
| Bio, Nature & Agricultural | 370 | 5.3% |
| Physical & Health Sciences | 233 | 3.3% |
| Psychology | 432 | 6.1% |
| Social Sciences | 638 | 9.1% |
| Engineering | 377 | 5.4% |
| Multidisciplinary Studies | 9 | 0.1% |
| Science & Technology | 775 | 11.0% |
| Business | 1,743 | 24.8% |
| Education | 670 | 9.5% |
| Literature & Languages | 316 | 4.5% |
| Liberal Arts & History | 252 | 3.6% |
| Visual & Performing Arts | 184 | 2.6% |
| Communications | 280 | 4.0% |
| Arts & Humanities | 376 | 5.3% |
| Total | 7,023 | 100.0% |
Transportation & Commute in Waxhaw
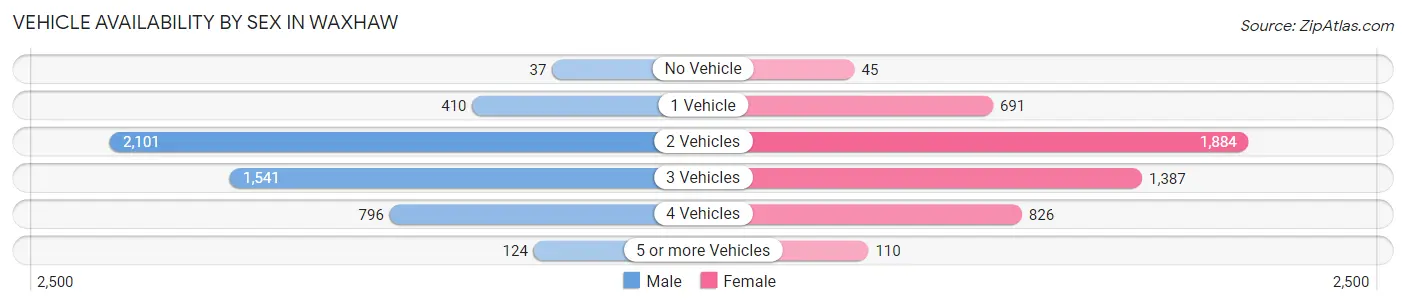
Vehicle Availability by Sex in Waxhaw
The most prevalent vehicle ownership categories in Waxhaw are males with 2 vehicles (2,101, accounting for 41.9%) and females with 2 vehicles (1,884, making up 42.5%).
| Vehicles Available | Male | Female |
| No Vehicle | 37 (0.7%) | 45 (0.9%) |
| 1 Vehicle | 410 (8.2%) | 691 (14.0%) |
| 2 Vehicles | 2,101 (41.9%) | 1,884 (38.1%) |
| 3 Vehicles | 1,541 (30.8%) | 1,387 (28.1%) |
| 4 Vehicles | 796 (15.9%) | 826 (16.7%) |
| 5 or more Vehicles | 124 (2.5%) | 110 (2.2%) |
| Total | 5,009 (100.0%) | 4,943 (100.0%) |
Commute Time in Waxhaw
The most frequently occuring commute durations in Waxhaw are 45 to 59 minutes (1,087 commuters, 14.7%), 30 to 34 minutes (1,086 commuters, 14.7%), and 10 to 14 minutes (792 commuters, 10.7%).
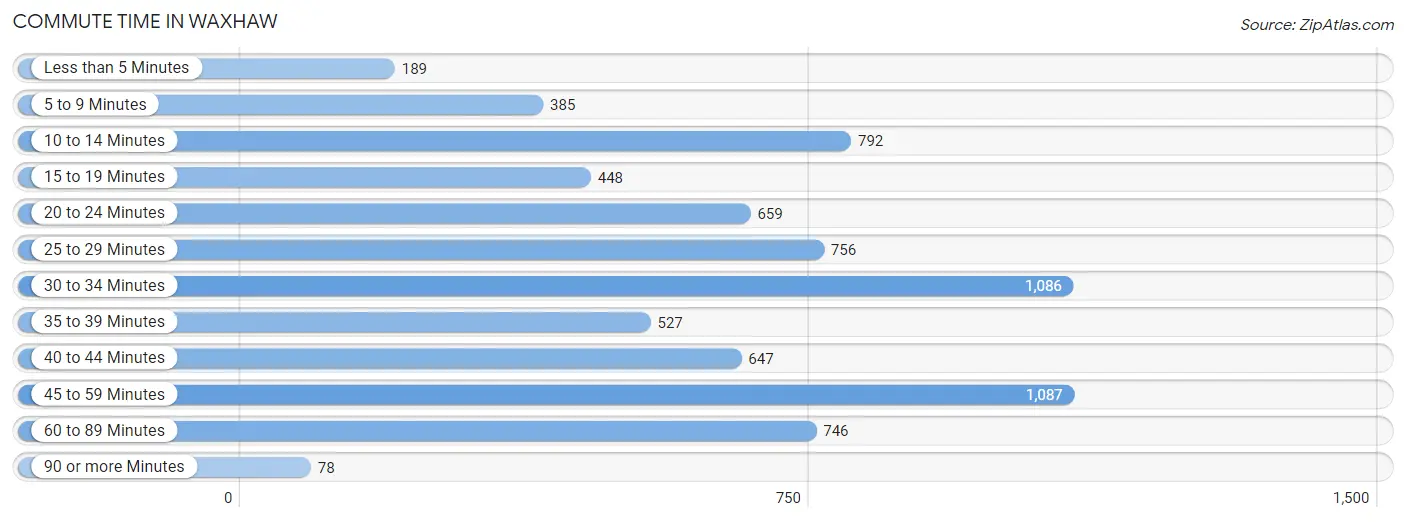
| Commute Time | # Commuters | % Commuters |
| Less than 5 Minutes | 189 | 2.5% |
| 5 to 9 Minutes | 385 | 5.2% |
| 10 to 14 Minutes | 792 | 10.7% |
| 15 to 19 Minutes | 448 | 6.0% |
| 20 to 24 Minutes | 659 | 8.9% |
| 25 to 29 Minutes | 756 | 10.2% |
| 30 to 34 Minutes | 1,086 | 14.7% |
| 35 to 39 Minutes | 527 | 7.1% |
| 40 to 44 Minutes | 647 | 8.7% |
| 45 to 59 Minutes | 1,087 | 14.7% |
| 60 to 89 Minutes | 746 | 10.1% |
| 90 or more Minutes | 78 | 1.1% |
Commute Time by Sex in Waxhaw
The most common commute times in Waxhaw are 45 to 59 minutes (677 commuters, 18.0%) for males and 10 to 14 minutes (626 commuters, 17.2%) for females.
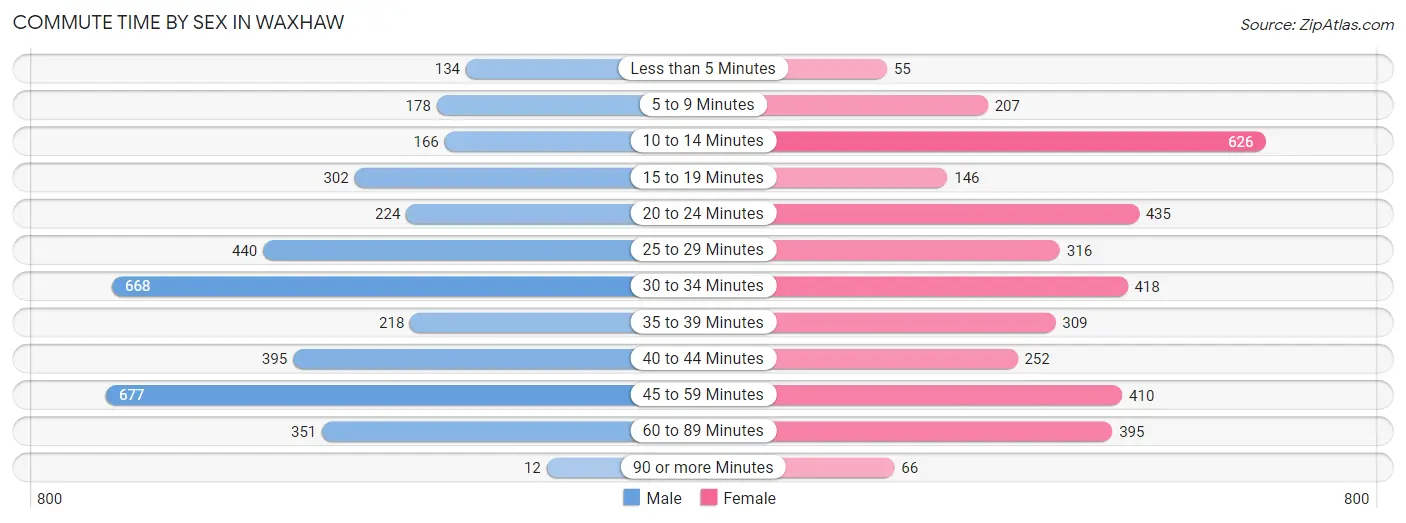
| Commute Time | Male | Female |
| Less than 5 Minutes | 134 (3.6%) | 55 (1.5%) |
| 5 to 9 Minutes | 178 (4.7%) | 207 (5.7%) |
| 10 to 14 Minutes | 166 (4.4%) | 626 (17.2%) |
| 15 to 19 Minutes | 302 (8.0%) | 146 (4.0%) |
| 20 to 24 Minutes | 224 (5.9%) | 435 (12.0%) |
| 25 to 29 Minutes | 440 (11.7%) | 316 (8.7%) |
| 30 to 34 Minutes | 668 (17.7%) | 418 (11.5%) |
| 35 to 39 Minutes | 218 (5.8%) | 309 (8.5%) |
| 40 to 44 Minutes | 395 (10.5%) | 252 (6.9%) |
| 45 to 59 Minutes | 677 (18.0%) | 410 (11.3%) |
| 60 to 89 Minutes | 351 (9.3%) | 395 (10.9%) |
| 90 or more Minutes | 12 (0.3%) | 66 (1.8%) |
Time of Departure to Work by Sex in Waxhaw
The most frequent times of departure to work in Waxhaw are 8:00 AM to 8:29 AM (997, 26.5%) for males and 7:00 AM to 7:29 AM (722, 19.9%) for females.
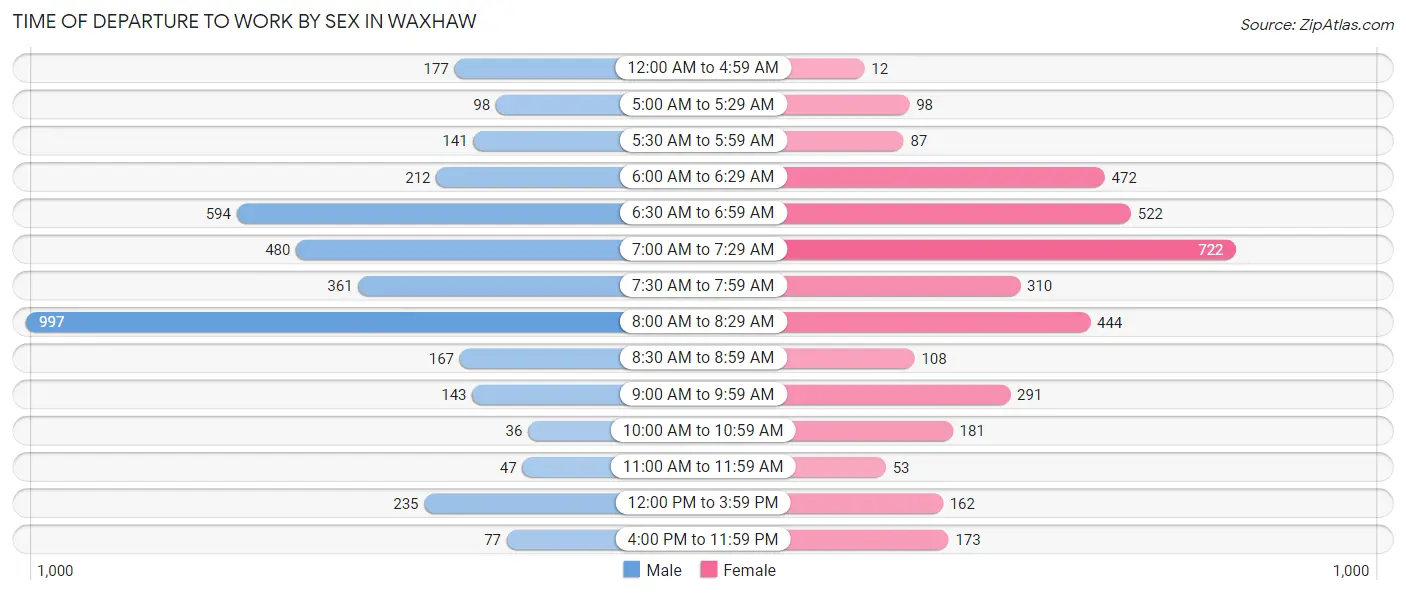
| Time of Departure | Male | Female |
| 12:00 AM to 4:59 AM | 177 (4.7%) | 12 (0.3%) |
| 5:00 AM to 5:29 AM | 98 (2.6%) | 98 (2.7%) |
| 5:30 AM to 5:59 AM | 141 (3.7%) | 87 (2.4%) |
| 6:00 AM to 6:29 AM | 212 (5.6%) | 472 (13.0%) |
| 6:30 AM to 6:59 AM | 594 (15.8%) | 522 (14.4%) |
| 7:00 AM to 7:29 AM | 480 (12.8%) | 722 (19.9%) |
| 7:30 AM to 7:59 AM | 361 (9.6%) | 310 (8.5%) |
| 8:00 AM to 8:29 AM | 997 (26.5%) | 444 (12.2%) |
| 8:30 AM to 8:59 AM | 167 (4.4%) | 108 (3.0%) |
| 9:00 AM to 9:59 AM | 143 (3.8%) | 291 (8.0%) |
| 10:00 AM to 10:59 AM | 36 (1.0%) | 181 (5.0%) |
| 11:00 AM to 11:59 AM | 47 (1.3%) | 53 (1.5%) |
| 12:00 PM to 3:59 PM | 235 (6.2%) | 162 (4.5%) |
| 4:00 PM to 11:59 PM | 77 (2.1%) | 173 (4.8%) |
| Total | 3,765 (100.0%) | 3,635 (100.0%) |
Housing Occupancy in Waxhaw
Occupancy by Ownership in Waxhaw
Of the total 6,312 dwellings in Waxhaw, owner-occupied units account for 5,198 (82.4%), while renter-occupied units make up 1,114 (17.6%).
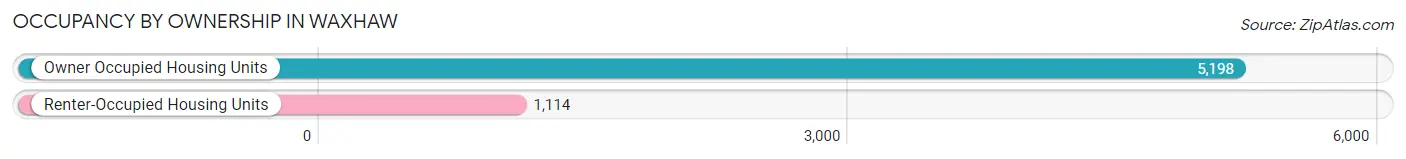
| Occupancy | # Housing Units | % Housing Units |
| Owner Occupied Housing Units | 5,198 | 82.4% |
| Renter-Occupied Housing Units | 1,114 | 17.6% |
| Total Occupied Housing Units | 6,312 | 100.0% |
Occupancy by Household Size in Waxhaw
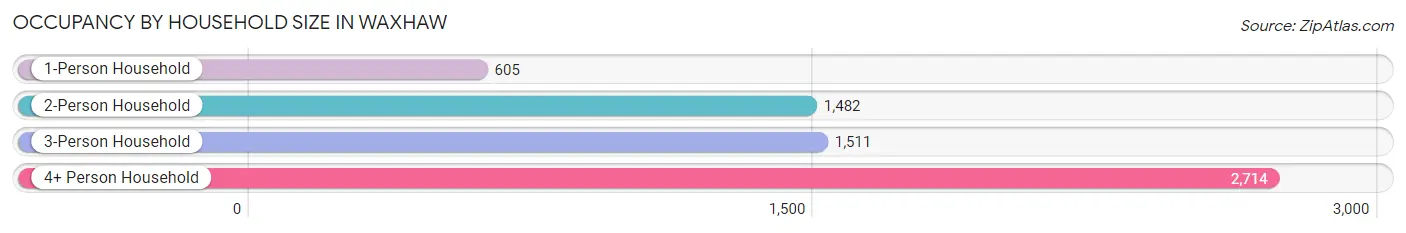
| Household Size | # Housing Units | % Housing Units |
| 1-Person Household | 605 | 9.6% |
| 2-Person Household | 1,482 | 23.5% |
| 3-Person Household | 1,511 | 23.9% |
| 4+ Person Household | 2,714 | 43.0% |
| Total Housing Units | 6,312 | 100.0% |
Occupancy by Ownership by Household Size in Waxhaw
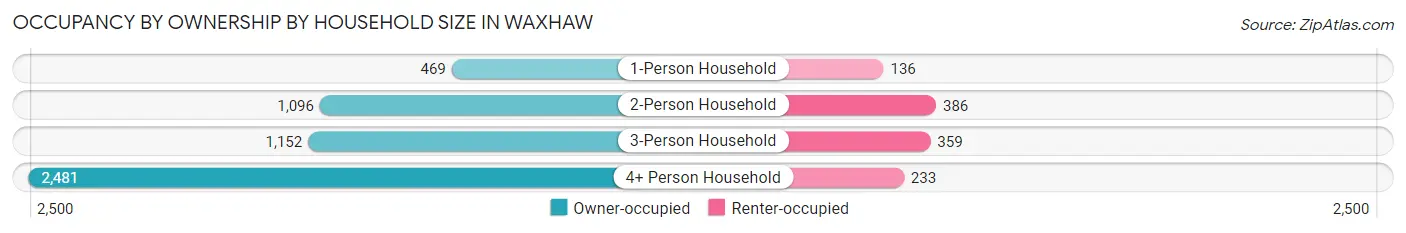
| Household Size | Owner-occupied | Renter-occupied |
| 1-Person Household | 469 (77.5%) | 136 (22.5%) |
| 2-Person Household | 1,096 (74.0%) | 386 (26.1%) |
| 3-Person Household | 1,152 (76.2%) | 359 (23.8%) |
| 4+ Person Household | 2,481 (91.4%) | 233 (8.6%) |
| Total Housing Units | 5,198 (82.4%) | 1,114 (17.6%) |
Occupancy by Educational Attainment in Waxhaw
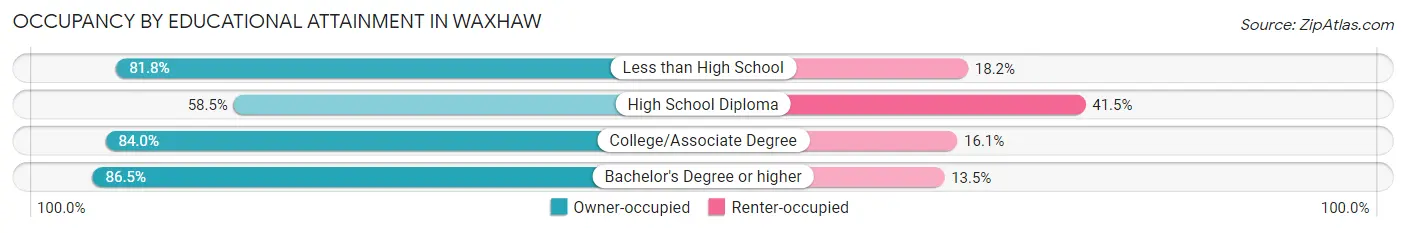
| Household Size | Owner-occupied | Renter-occupied |
| Less than High School | 144 (81.8%) | 32 (18.2%) |
| High School Diploma | 449 (58.5%) | 318 (41.5%) |
| College/Associate Degree | 1,297 (84.0%) | 248 (16.1%) |
| Bachelor's Degree or higher | 3,308 (86.5%) | 516 (13.5%) |
Occupancy by Age of Householder in Waxhaw
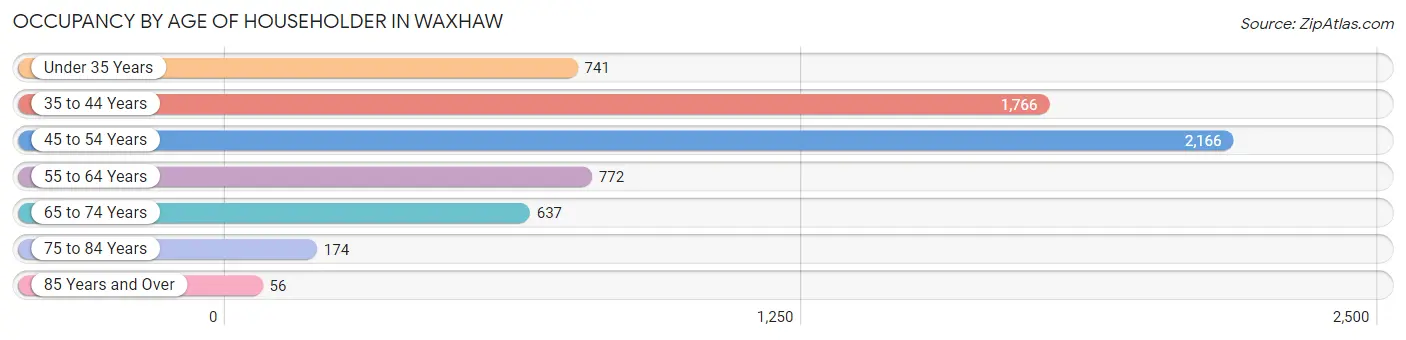
| Age Bracket | # Households | % Households |
| Under 35 Years | 741 | 11.7% |
| 35 to 44 Years | 1,766 | 28.0% |
| 45 to 54 Years | 2,166 | 34.3% |
| 55 to 64 Years | 772 | 12.2% |
| 65 to 74 Years | 637 | 10.1% |
| 75 to 84 Years | 174 | 2.8% |
| 85 Years and Over | 56 | 0.9% |
| Total | 6,312 | 100.0% |
Housing Finances in Waxhaw
Median Income by Occupancy in Waxhaw
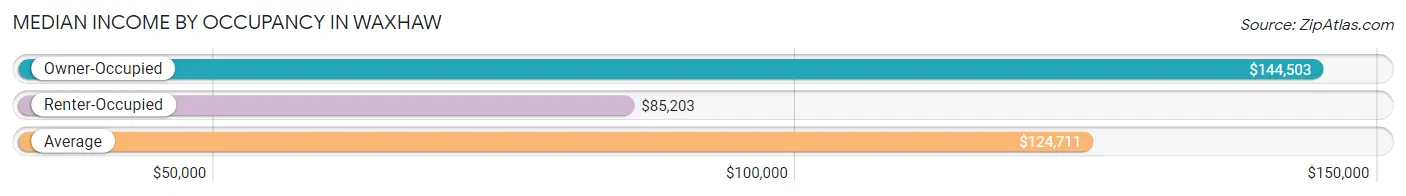
| Occupancy Type | # Households | Median Income |
| Owner-Occupied | 5,198 (82.4%) | $144,503 |
| Renter-Occupied | 1,114 (17.6%) | $85,203 |
| Average | 6,312 (100.0%) | $124,711 |
Occupancy by Householder Income Bracket in Waxhaw
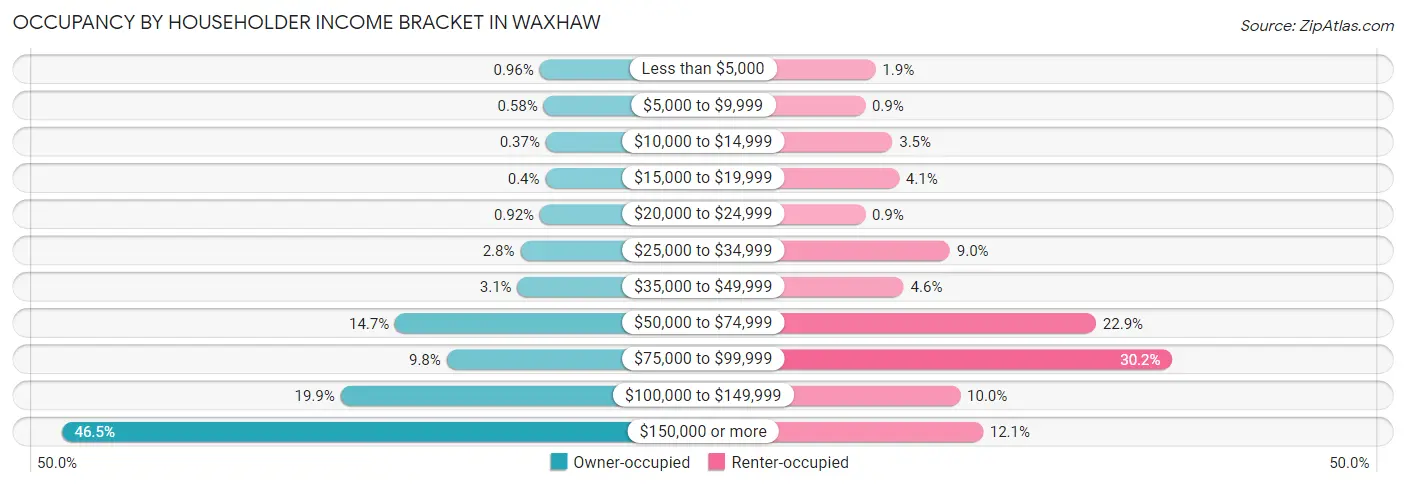
| Income Bracket | Owner-occupied | Renter-occupied |
| Less than $5,000 | 50 (1.0%) | 21 (1.9%) |
| $5,000 to $9,999 | 30 (0.6%) | 10 (0.9%) |
| $10,000 to $14,999 | 19 (0.4%) | 39 (3.5%) |
| $15,000 to $19,999 | 21 (0.4%) | 46 (4.1%) |
| $20,000 to $24,999 | 48 (0.9%) | 10 (0.9%) |
| $25,000 to $34,999 | 145 (2.8%) | 100 (9.0%) |
| $35,000 to $49,999 | 159 (3.1%) | 51 (4.6%) |
| $50,000 to $74,999 | 765 (14.7%) | 255 (22.9%) |
| $75,000 to $99,999 | 510 (9.8%) | 336 (30.2%) |
| $100,000 to $149,999 | 1,035 (19.9%) | 111 (10.0%) |
| $150,000 or more | 2,416 (46.5%) | 135 (12.1%) |
| Total | 5,198 (100.0%) | 1,114 (100.0%) |
Monthly Housing Cost Tiers in Waxhaw
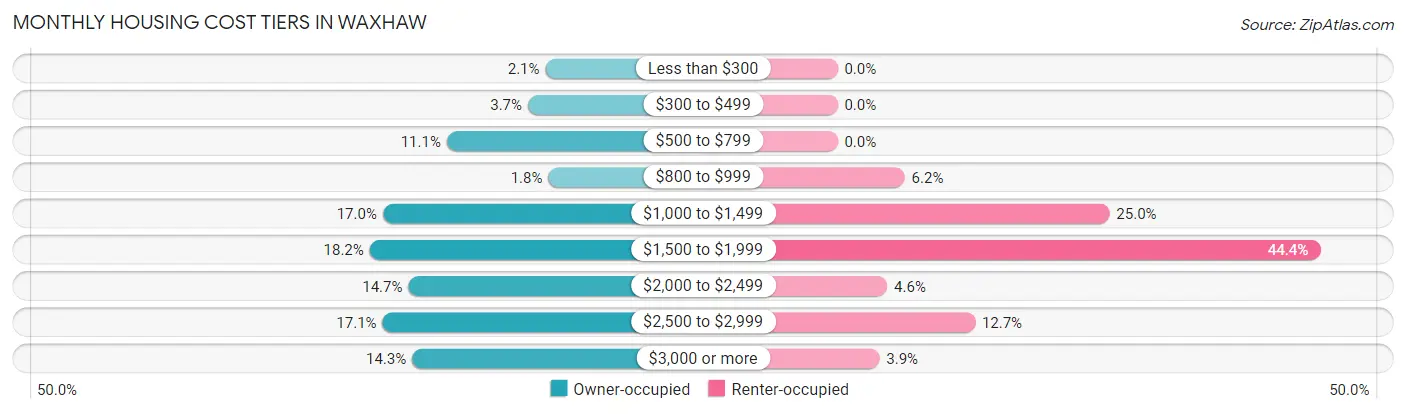
| Monthly Cost | Owner-occupied | Renter-occupied |
| Less than $300 | 107 (2.1%) | 0 (0.0%) |
| $300 to $499 | 191 (3.7%) | 0 (0.0%) |
| $500 to $799 | 579 (11.1%) | 0 (0.0%) |
| $800 to $999 | 93 (1.8%) | 69 (6.2%) |
| $1,000 to $1,499 | 885 (17.0%) | 279 (25.0%) |
| $1,500 to $1,999 | 948 (18.2%) | 495 (44.4%) |
| $2,000 to $2,499 | 763 (14.7%) | 51 (4.6%) |
| $2,500 to $2,999 | 887 (17.1%) | 141 (12.7%) |
| $3,000 or more | 745 (14.3%) | 43 (3.9%) |
| Total | 5,198 (100.0%) | 1,114 (100.0%) |
Physical Housing Characteristics in Waxhaw
Housing Structures in Waxhaw
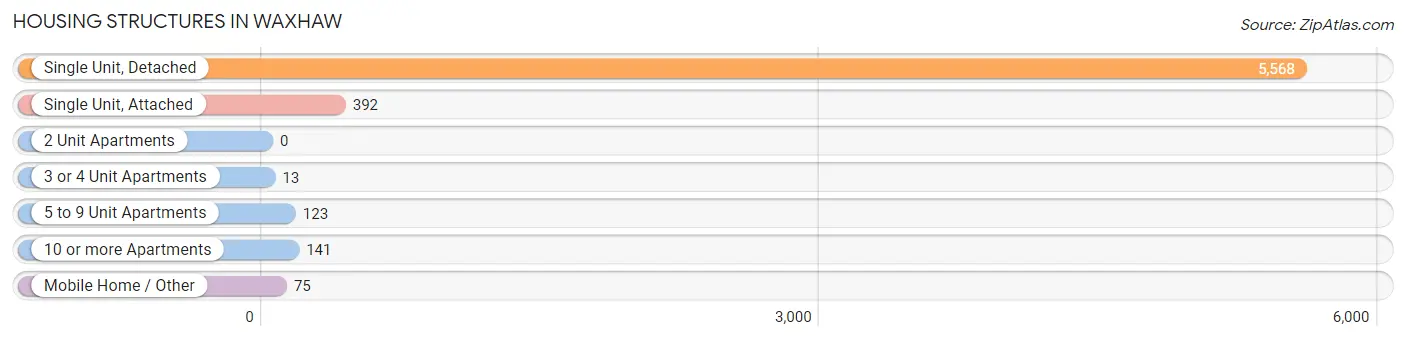
| Structure Type | # Housing Units | % Housing Units |
| Single Unit, Detached | 5,568 | 88.2% |
| Single Unit, Attached | 392 | 6.2% |
| 2 Unit Apartments | 0 | 0.0% |
| 3 or 4 Unit Apartments | 13 | 0.2% |
| 5 to 9 Unit Apartments | 123 | 1.9% |
| 10 or more Apartments | 141 | 2.2% |
| Mobile Home / Other | 75 | 1.2% |
| Total | 6,312 | 100.0% |
Housing Structures by Occupancy in Waxhaw
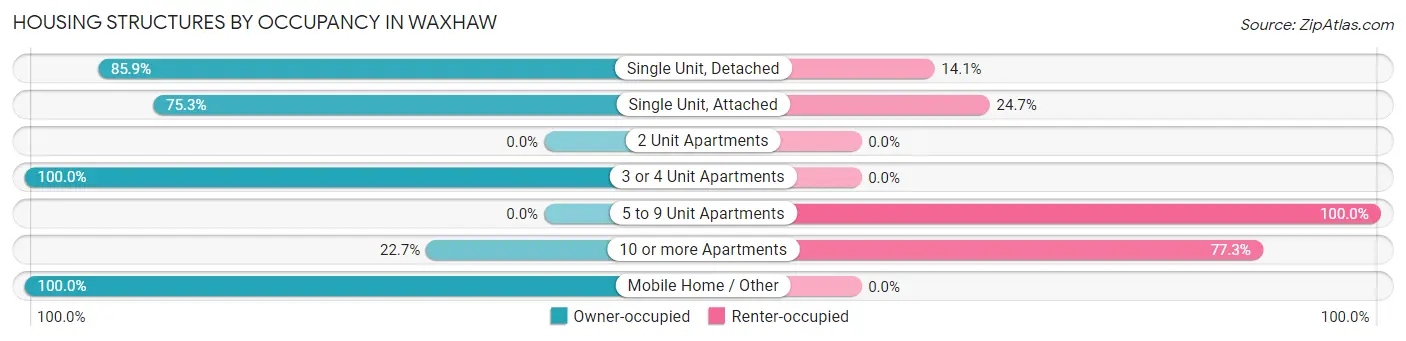
| Structure Type | Owner-occupied | Renter-occupied |
| Single Unit, Detached | 4,783 (85.9%) | 785 (14.1%) |
| Single Unit, Attached | 295 (75.3%) | 97 (24.7%) |
| 2 Unit Apartments | 0 (0.0%) | 0 (0.0%) |
| 3 or 4 Unit Apartments | 13 (100.0%) | 0 (0.0%) |
| 5 to 9 Unit Apartments | 0 (0.0%) | 123 (100.0%) |
| 10 or more Apartments | 32 (22.7%) | 109 (77.3%) |
| Mobile Home / Other | 75 (100.0%) | 0 (0.0%) |
| Total | 5,198 (82.4%) | 1,114 (17.6%) |
Housing Structures by Number of Rooms in Waxhaw
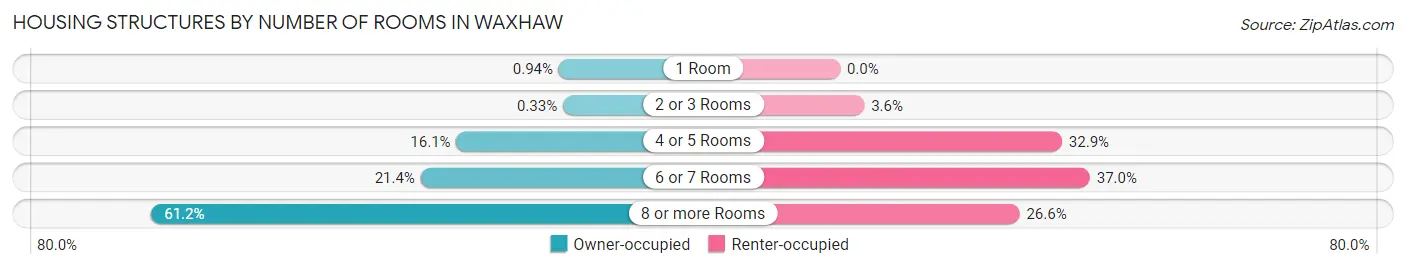
| Number of Rooms | Owner-occupied | Renter-occupied |
| 1 Room | 49 (0.9%) | 0 (0.0%) |
| 2 or 3 Rooms | 17 (0.3%) | 40 (3.6%) |
| 4 or 5 Rooms | 837 (16.1%) | 366 (32.9%) |
| 6 or 7 Rooms | 1,112 (21.4%) | 412 (37.0%) |
| 8 or more Rooms | 3,183 (61.2%) | 296 (26.6%) |
| Total | 5,198 (100.0%) | 1,114 (100.0%) |
Housing Structure by Heating Type in Waxhaw
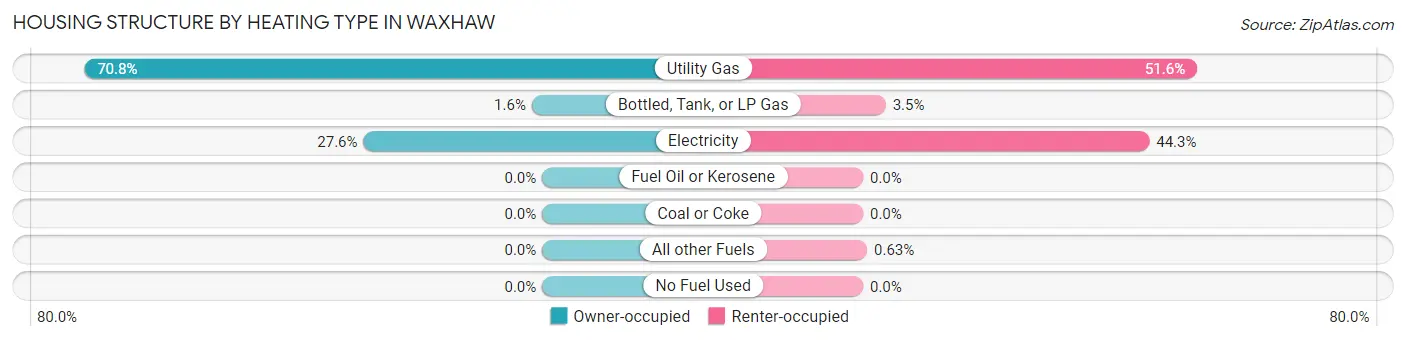
| Heating Type | Owner-occupied | Renter-occupied |
| Utility Gas | 3,679 (70.8%) | 575 (51.6%) |
| Bottled, Tank, or LP Gas | 83 (1.6%) | 39 (3.5%) |
| Electricity | 1,436 (27.6%) | 493 (44.3%) |
| Fuel Oil or Kerosene | 0 (0.0%) | 0 (0.0%) |
| Coal or Coke | 0 (0.0%) | 0 (0.0%) |
| All other Fuels | 0 (0.0%) | 7 (0.6%) |
| No Fuel Used | 0 (0.0%) | 0 (0.0%) |
| Total | 5,198 (100.0%) | 1,114 (100.0%) |
Household Vehicle Usage in Waxhaw
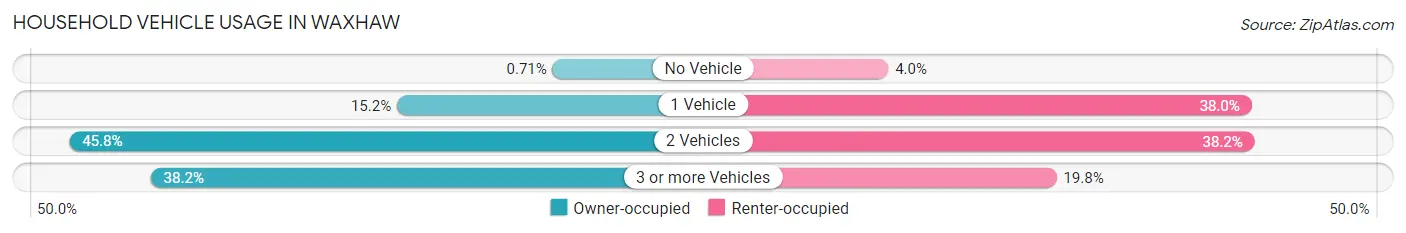
| Vehicles per Household | Owner-occupied | Renter-occupied |
| No Vehicle | 37 (0.7%) | 45 (4.0%) |
| 1 Vehicle | 792 (15.2%) | 423 (38.0%) |
| 2 Vehicles | 2,382 (45.8%) | 426 (38.2%) |
| 3 or more Vehicles | 1,987 (38.2%) | 220 (19.8%) |
| Total | 5,198 (100.0%) | 1,114 (100.0%) |
Real Estate & Mortgages in Waxhaw
Real Estate and Mortgage Overview in Waxhaw
| Characteristic | Without Mortgage | With Mortgage |
| Housing Units | 990 | 4,208 |
| Median Property Value | $490,300 | $442,200 |
| Median Household Income | $92,647 | $2,059 |
| Monthly Housing Costs | $669 | $745 |
| Real Estate Taxes | $3,734 | $4 |
Property Value by Mortgage Status in Waxhaw
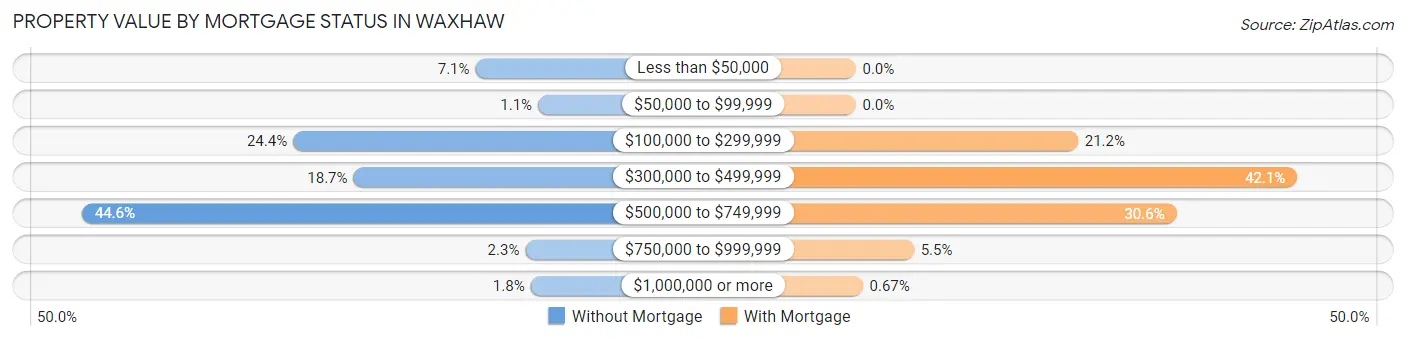
| Property Value | Without Mortgage | With Mortgage |
| Less than $50,000 | 70 (7.1%) | 0 (0.0%) |
| $50,000 to $99,999 | 11 (1.1%) | 0 (0.0%) |
| $100,000 to $299,999 | 242 (24.4%) | 891 (21.2%) |
| $300,000 to $499,999 | 185 (18.7%) | 1,770 (42.1%) |
| $500,000 to $749,999 | 441 (44.6%) | 1,286 (30.6%) |
| $750,000 to $999,999 | 23 (2.3%) | 233 (5.5%) |
| $1,000,000 or more | 18 (1.8%) | 28 (0.7%) |
| Total | 990 (100.0%) | 4,208 (100.0%) |
Household Income by Mortgage Status in Waxhaw
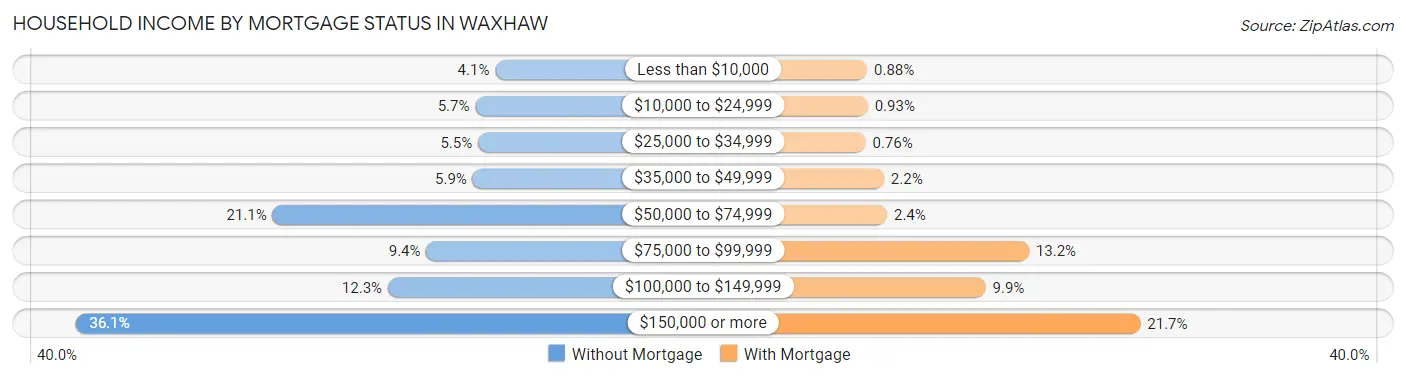
| Household Income | Without Mortgage | With Mortgage |
| Less than $10,000 | 41 (4.1%) | 37 (0.9%) |
| $10,000 to $24,999 | 56 (5.7%) | 39 (0.9%) |
| $25,000 to $34,999 | 54 (5.4%) | 32 (0.8%) |
| $35,000 to $49,999 | 58 (5.9%) | 91 (2.2%) |
| $50,000 to $74,999 | 209 (21.1%) | 101 (2.4%) |
| $75,000 to $99,999 | 93 (9.4%) | 556 (13.2%) |
| $100,000 to $149,999 | 122 (12.3%) | 417 (9.9%) |
| $150,000 or more | 357 (36.1%) | 913 (21.7%) |
| Total | 990 (100.0%) | 4,208 (100.0%) |
Property Value to Household Income Ratio in Waxhaw
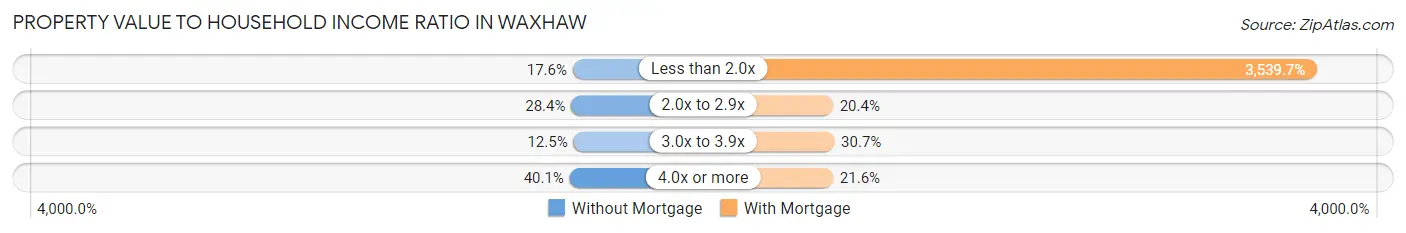
| Value-to-Income Ratio | Without Mortgage | With Mortgage |
| Less than 2.0x | 174 (17.6%) | 148,949 (3,539.7%) |
| 2.0x to 2.9x | 281 (28.4%) | 860 (20.4%) |
| 3.0x to 3.9x | 124 (12.5%) | 1,291 (30.7%) |
| 4.0x or more | 397 (40.1%) | 910 (21.6%) |
| Total | 990 (100.0%) | 4,208 (100.0%) |
Real Estate Taxes by Mortgage Status in Waxhaw
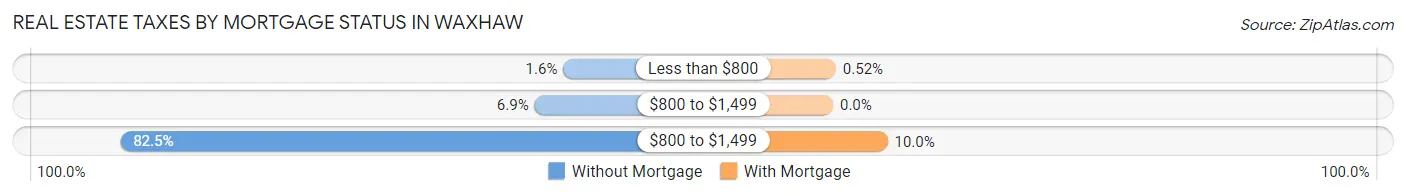
| Property Taxes | Without Mortgage | With Mortgage |
| Less than $800 | 16 (1.6%) | 22 (0.5%) |
| $800 to $1,499 | 68 (6.9%) | 0 (0.0%) |
| $800 to $1,499 | 817 (82.5%) | 419 (10.0%) |
| Total | 990 (100.0%) | 4,208 (100.0%) |
Health & Disability in Waxhaw
Health Insurance Coverage by Age in Waxhaw
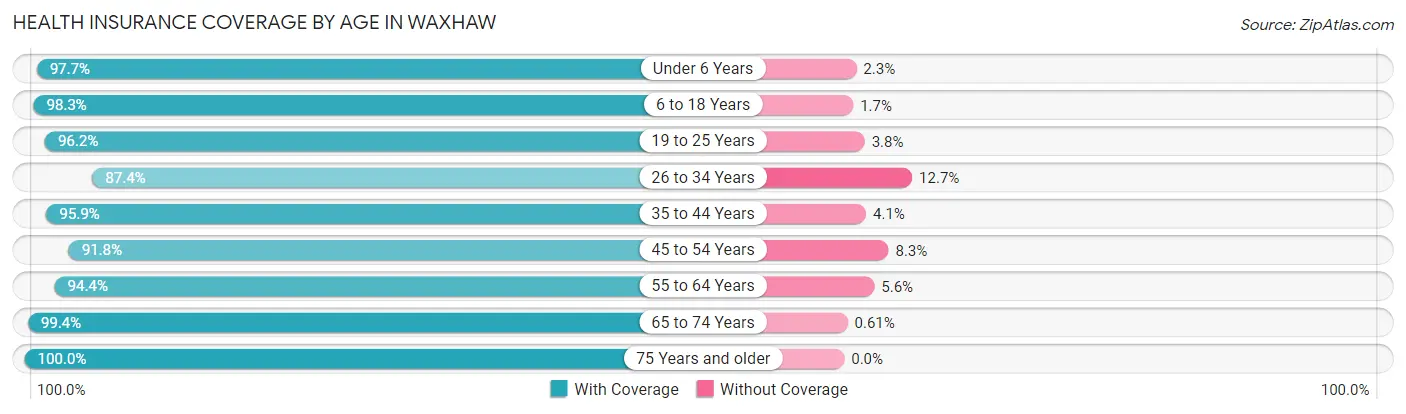
| Age Bracket | With Coverage | Without Coverage |
| Under 6 Years | 1,381 (97.7%) | 32 (2.3%) |
| 6 to 18 Years | 5,868 (98.3%) | 99 (1.7%) |
| 19 to 25 Years | 1,110 (96.2%) | 44 (3.8%) |
| 26 to 34 Years | 1,457 (87.4%) | 211 (12.7%) |
| 35 to 44 Years | 3,091 (95.9%) | 131 (4.1%) |
| 45 to 54 Years | 3,672 (91.7%) | 330 (8.3%) |
| 55 to 64 Years | 1,535 (94.4%) | 91 (5.6%) |
| 65 to 74 Years | 973 (99.4%) | 6 (0.6%) |
| 75 Years and older | 580 (100.0%) | 0 (0.0%) |
| Total | 19,667 (95.4%) | 944 (4.6%) |
Health Insurance Coverage by Citizenship Status in Waxhaw
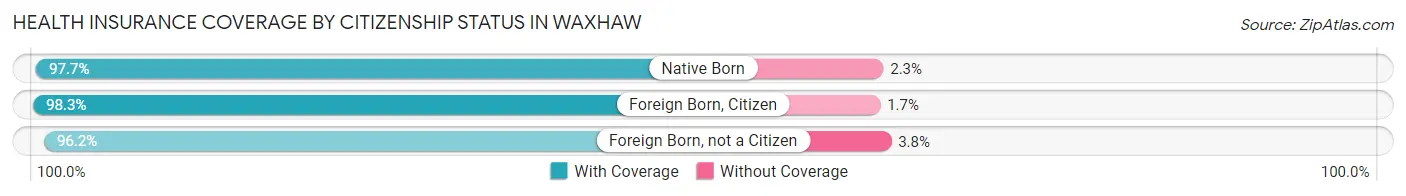
| Citizenship Status | With Coverage | Without Coverage |
| Native Born | 1,381 (97.7%) | 32 (2.3%) |
| Foreign Born, Citizen | 5,868 (98.3%) | 99 (1.7%) |
| Foreign Born, not a Citizen | 1,110 (96.2%) | 44 (3.8%) |
Health Insurance Coverage by Household Income in Waxhaw
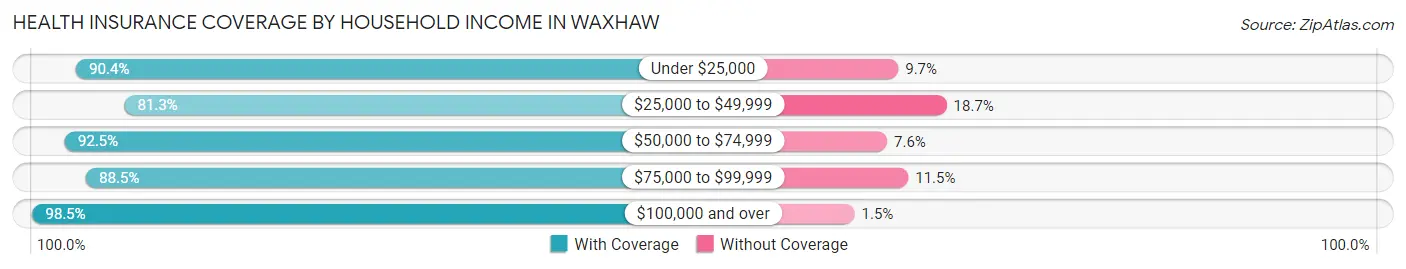
| Household Income | With Coverage | Without Coverage |
| Under $25,000 | 637 (90.3%) | 68 (9.7%) |
| $25,000 to $49,999 | 817 (81.3%) | 188 (18.7%) |
| $50,000 to $74,999 | 2,179 (92.4%) | 178 (7.5%) |
| $75,000 to $99,999 | 2,365 (88.5%) | 308 (11.5%) |
| $100,000 and over | 13,665 (98.5%) | 202 (1.5%) |
Public vs Private Health Insurance Coverage by Age in Waxhaw
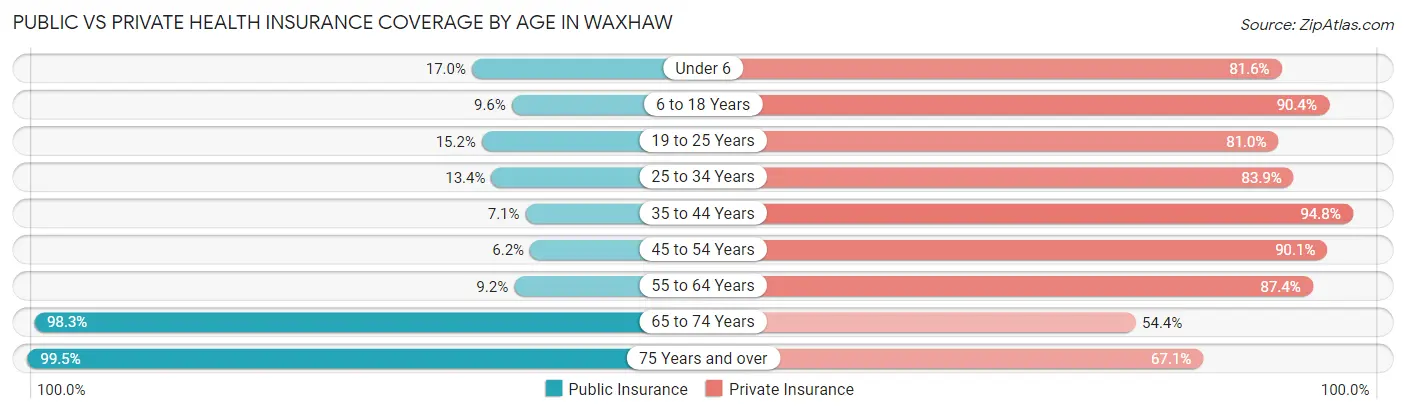
| Age Bracket | Public Insurance | Private Insurance |
| Under 6 | 240 (17.0%) | 1,153 (81.6%) |
| 6 to 18 Years | 573 (9.6%) | 5,393 (90.4%) |
| 19 to 25 Years | 175 (15.2%) | 935 (81.0%) |
| 25 to 34 Years | 223 (13.4%) | 1,399 (83.9%) |
| 35 to 44 Years | 227 (7.0%) | 3,054 (94.8%) |
| 45 to 54 Years | 248 (6.2%) | 3,606 (90.1%) |
| 55 to 64 Years | 149 (9.2%) | 1,421 (87.4%) |
| 65 to 74 Years | 962 (98.3%) | 533 (54.4%) |
| 75 Years and over | 577 (99.5%) | 389 (67.1%) |
| Total | 3,374 (16.4%) | 17,883 (86.8%) |
Disability Status by Sex by Age in Waxhaw
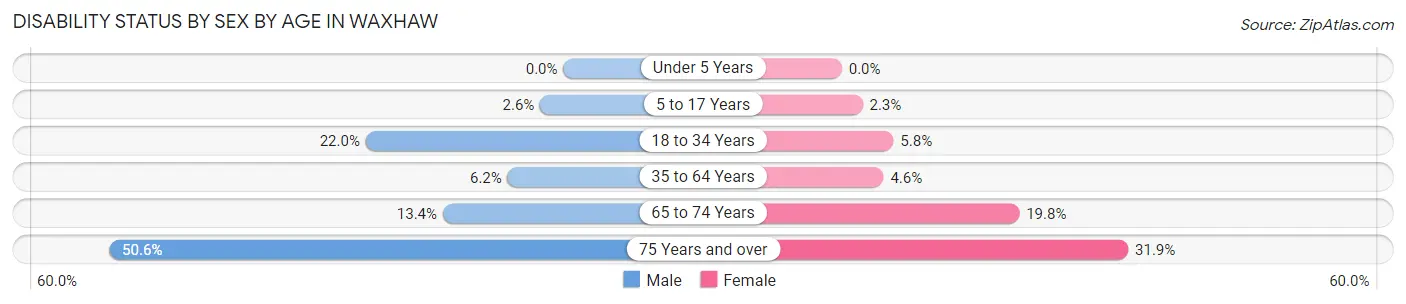
| Age Bracket | Male | Female |
| Under 5 Years | 0 (0.0%) | 0 (0.0%) |
| 5 to 17 Years | 77 (2.6%) | 66 (2.3%) |
| 18 to 34 Years | 366 (22.0%) | 89 (5.8%) |
| 35 to 64 Years | 252 (6.2%) | 222 (4.6%) |
| 65 to 74 Years | 75 (13.4%) | 83 (19.8%) |
| 75 Years and over | 130 (50.6%) | 103 (31.9%) |
Disability Class by Sex by Age in Waxhaw
Disability Class: Hearing Difficulty
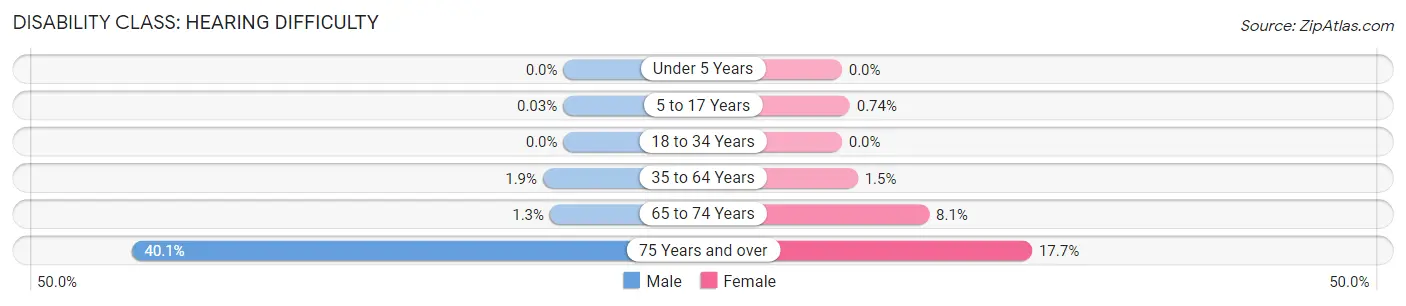
| Age Bracket | Male | Female |
| Under 5 Years | 0 (0.0%) | 0 (0.0%) |
| 5 to 17 Years | 1 (0.0%) | 21 (0.7%) |
| 18 to 34 Years | 0 (0.0%) | 0 (0.0%) |
| 35 to 64 Years | 77 (1.9%) | 71 (1.5%) |
| 65 to 74 Years | 7 (1.3%) | 34 (8.1%) |
| 75 Years and over | 103 (40.1%) | 57 (17.6%) |
Disability Class: Vision Difficulty
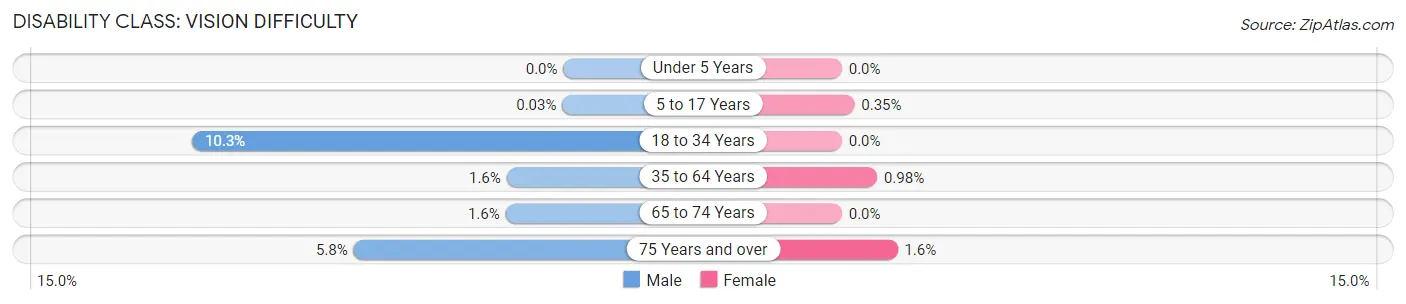
| Age Bracket | Male | Female |
| Under 5 Years | 0 (0.0%) | 0 (0.0%) |
| 5 to 17 Years | 1 (0.0%) | 10 (0.4%) |
| 18 to 34 Years | 172 (10.3%) | 0 (0.0%) |
| 35 to 64 Years | 64 (1.6%) | 47 (1.0%) |
| 65 to 74 Years | 9 (1.6%) | 0 (0.0%) |
| 75 Years and over | 15 (5.8%) | 5 (1.5%) |
Disability Class: Cognitive Difficulty
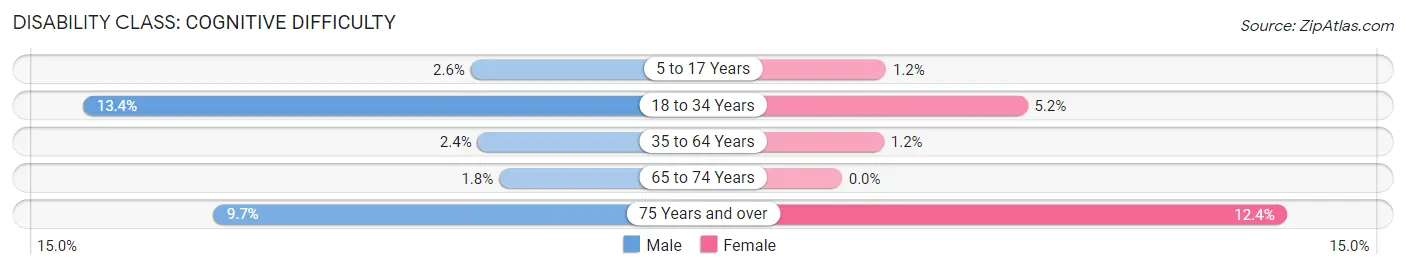
| Age Bracket | Male | Female |
| 5 to 17 Years | 77 (2.6%) | 35 (1.2%) |
| 18 to 34 Years | 222 (13.4%) | 80 (5.2%) |
| 35 to 64 Years | 97 (2.4%) | 56 (1.2%) |
| 65 to 74 Years | 10 (1.8%) | 0 (0.0%) |
| 75 Years and over | 25 (9.7%) | 40 (12.4%) |
Disability Class: Ambulatory Difficulty
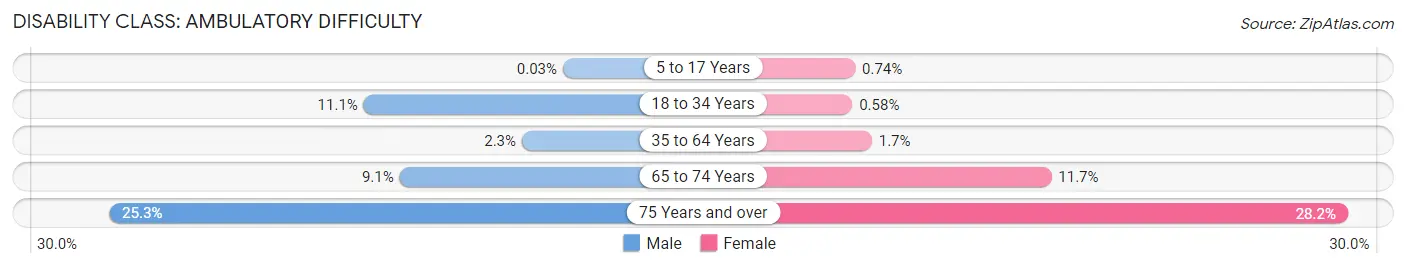
| Age Bracket | Male | Female |
| 5 to 17 Years | 1 (0.0%) | 21 (0.7%) |
| 18 to 34 Years | 185 (11.1%) | 9 (0.6%) |
| 35 to 64 Years | 94 (2.3%) | 80 (1.7%) |
| 65 to 74 Years | 51 (9.1%) | 49 (11.7%) |
| 75 Years and over | 65 (25.3%) | 91 (28.2%) |
Disability Class: Self-Care Difficulty
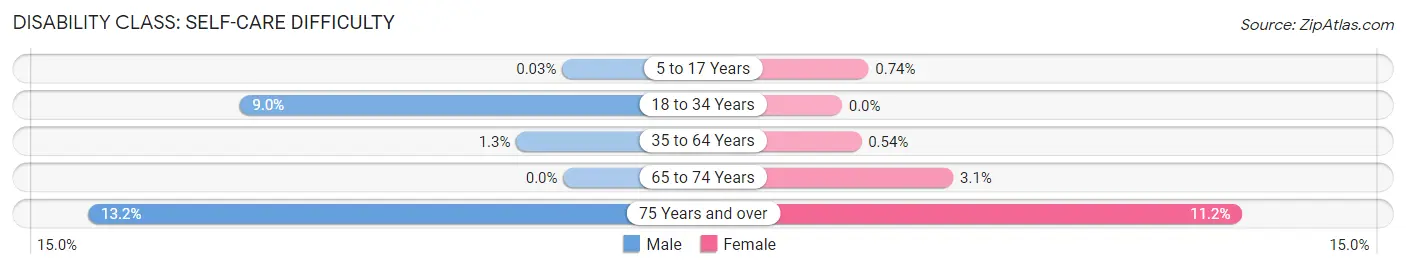
| Age Bracket | Male | Female |
| 5 to 17 Years | 1 (0.0%) | 21 (0.7%) |
| 18 to 34 Years | 150 (9.0%) | 0 (0.0%) |
| 35 to 64 Years | 53 (1.3%) | 26 (0.5%) |
| 65 to 74 Years | 0 (0.0%) | 13 (3.1%) |
| 75 Years and over | 34 (13.2%) | 36 (11.2%) |
Technology Access in Waxhaw
Computing Device Access in Waxhaw
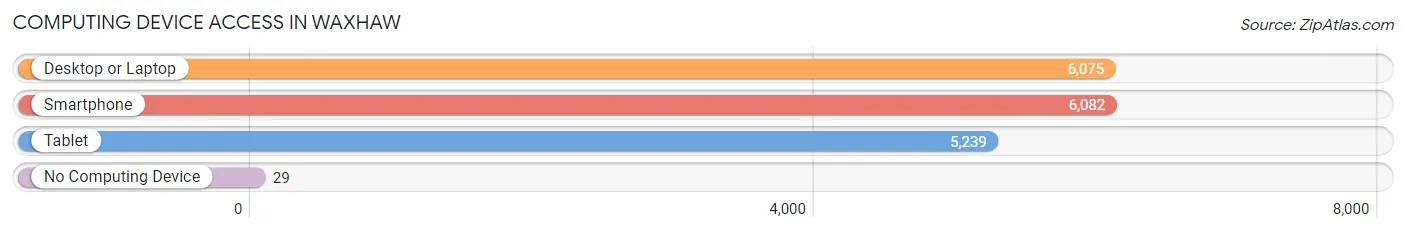
| Device Type | # Households | % Households |
| Desktop or Laptop | 6,075 | 96.3% |
| Smartphone | 6,082 | 96.4% |
| Tablet | 5,239 | 83.0% |
| No Computing Device | 29 | 0.5% |
| Total | 6,312 | 100.0% |
Internet Access in Waxhaw
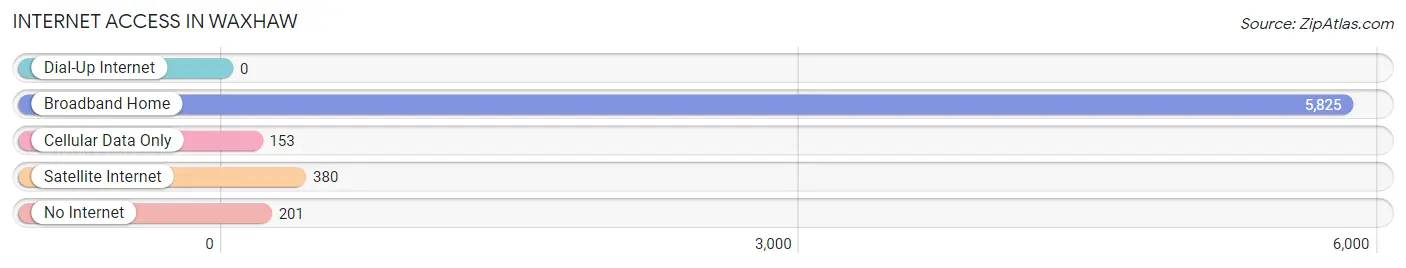
| Internet Type | # Households | % Households |
| Dial-Up Internet | 0 | 0.0% |
| Broadband Home | 5,825 | 92.3% |
| Cellular Data Only | 153 | 2.4% |
| Satellite Internet | 380 | 6.0% |
| No Internet | 201 | 3.2% |
| Total | 6,312 | 100.0% |
Waxhaw Summary
Waxhaw is a small town located in Union County, North Carolina. It is situated on the border of North and South Carolina, and is part of the Charlotte metropolitan area. The town has a population of approximately 10,000 people, and is known for its historic downtown area and its proximity to the Catawba River.
Geography
Waxhaw is located in the Piedmont region of North Carolina, and is situated on the border of North and South Carolina. The town is located in the foothills of the Blue Ridge Mountains, and is part of the Charlotte metropolitan area. The town is situated on the Catawba River, and is surrounded by rolling hills and forests. The town is located approximately 25 miles south of Charlotte, and is accessible via Interstate 85.
History
Waxhaw was first settled in the late 1700s by German and Scots-Irish immigrants. The town was named after the Waxhaw Indians, who were the original inhabitants of the area. The town was officially incorporated in 1845, and was a major stop on the Charlotte-Columbia Railroad. The town was a popular destination for wealthy plantation owners, and was home to several large cotton plantations. During the Civil War, the town was the site of several battles, and was occupied by Union forces.
Economy
Waxhaw’s economy is largely based on agriculture and tourism. The town is home to several large farms, and is known for its production of cotton, corn, soybeans, and tobacco. The town is also home to several wineries, and is a popular destination for wine tours. The town is also home to several small businesses, including restaurants, shops, and art galleries.
Demographics
As of the 2010 census, the population of Waxhaw was 9,859. The racial makeup of the town was 79.3% White, 15.2% African American, 0.4% Native American, 1.2% Asian, and 3.9% from other races. The median household income was $50,945, and the median family income was $60,945. The town has a large Hispanic population, with approximately 10.3% of the population being of Hispanic or Latino origin.
Conclusion
Waxhaw is a small town located in Union County, North Carolina. It is situated on the border of North and South Carolina, and is part of the Charlotte metropolitan area. The town has a population of approximately 10,000 people, and is known for its historic downtown area and its proximity to the Catawba River. The town’s economy is largely based on agriculture and tourism, and the town is home to several large farms and wineries. The town has a diverse population, with a large Hispanic population and a median household income of $50,945.
Common Questions
What is Per Capita Income in Waxhaw?
Per Capita income in Waxhaw is $45,502.
What is the Median Family Income in Waxhaw?
Median Family Income in Waxhaw is $141,709.
What is the Median Household income in Waxhaw?
Median Household Income in Waxhaw is $124,711.
What is Income or Wage Gap in Waxhaw?
Income or Wage Gap in Waxhaw is 50.5%.
Women in Waxhaw earn 49.5 cents for every dollar earned by a man.
What is Inequality or Gini Index in Waxhaw?
Inequality or Gini Index in Waxhaw is 0.37.
What is the Total Population of Waxhaw?
Total Population of Waxhaw is 20,665.
What is the Total Male Population of Waxhaw?
Total Male Population of Waxhaw is 10,009.
What is the Total Female Population of Waxhaw?
Total Female Population of Waxhaw is 10,656.
What is the Ratio of Males per 100 Females in Waxhaw?
There are 93.93 Males per 100 Females in Waxhaw.
What is the Ratio of Females per 100 Males in Waxhaw?
There are 106.46 Females per 100 Males in Waxhaw.
What is the Median Population Age in Waxhaw?
Median Population Age in Waxhaw is 35.7 Years.
What is the Average Family Size in Waxhaw
Average Family Size in Waxhaw is 3.5 People.
What is the Average Household Size in Waxhaw
Average Household Size in Waxhaw is 3.3 People.
How Large is the Labor Force in Waxhaw?
There are 10,483 People in the Labor Forcein in Waxhaw.
What is the Percentage of People in the Labor Force in Waxhaw?
70.0% of People are in the Labor Force in Waxhaw.
What is the Unemployment Rate in Waxhaw?
Unemployment Rate in Waxhaw is 3.3%.