Elkin, NC Map & Demographics
Elkin Map
Elkin Overview
$30,891
PER CAPITA INCOME
$81,369
AVG FAMILY INCOME
$57,711
AVG HOUSEHOLD INCOME
22.5%
WAGE / INCOME GAP [ % ]
77.5¢/ $1
WAGE / INCOME GAP [ $ ]
$5,021
FAMILY INCOME DEFICIT
0.49
INEQUALITY / GINI INDEX
4,026
TOTAL POPULATION
1,951
MALE POPULATION
2,075
FEMALE POPULATION
94.02
MALES / 100 FEMALES
106.36
FEMALES / 100 MALES
41.9
MEDIAN AGE
3.2
AVG FAMILY SIZE
2.3
AVG HOUSEHOLD SIZE
2,101
LABOR FORCE [ PEOPLE ]
64.7%
PERCENT IN LABOR FORCE
3.1%
UNEMPLOYMENT RATE
Elkin Zip Codes
Elkin Area Codes
Income in Elkin
Income Overview in Elkin
Per Capita Income in Elkin is $30,891, while median incomes of families and households are $81,369 and $57,711 respectively.
| Characteristic | Number | Measure |
| Per Capita Income | 4,026 | $30,891 |
| Median Family Income | 850 | $81,369 |
| Mean Family Income | 850 | $103,747 |
| Median Household Income | 1,663 | $57,711 |
| Mean Household Income | 1,663 | $74,111 |
| Income Deficit | 850 | $5,021 |
| Wage / Income Gap (%) | 4,026 | 22.50% |
| Wage / Income Gap ($) | 4,026 | 77.50¢ per $1 |
| Gini / Inequality Index | 4,026 | 0.49 |
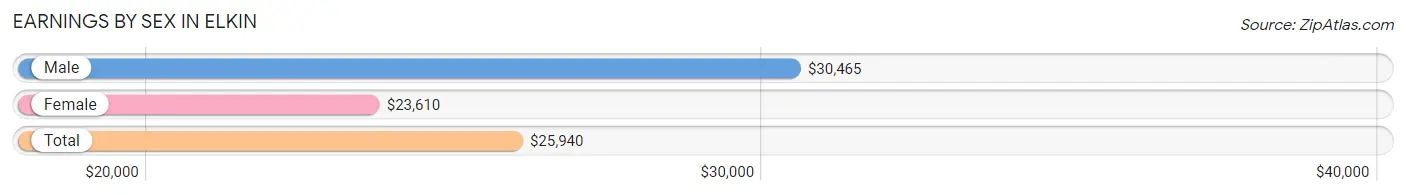
Earnings by Sex in Elkin
Average Earnings in Elkin are $25,940, $30,465 for men and $23,610 for women, a difference of 22.5%.
| Sex | Number | Average Earnings |
| Male | 1,264 (58.2%) | $30,465 |
| Female | 909 (41.8%) | $23,610 |
| Total | 2,173 (100.0%) | $25,940 |
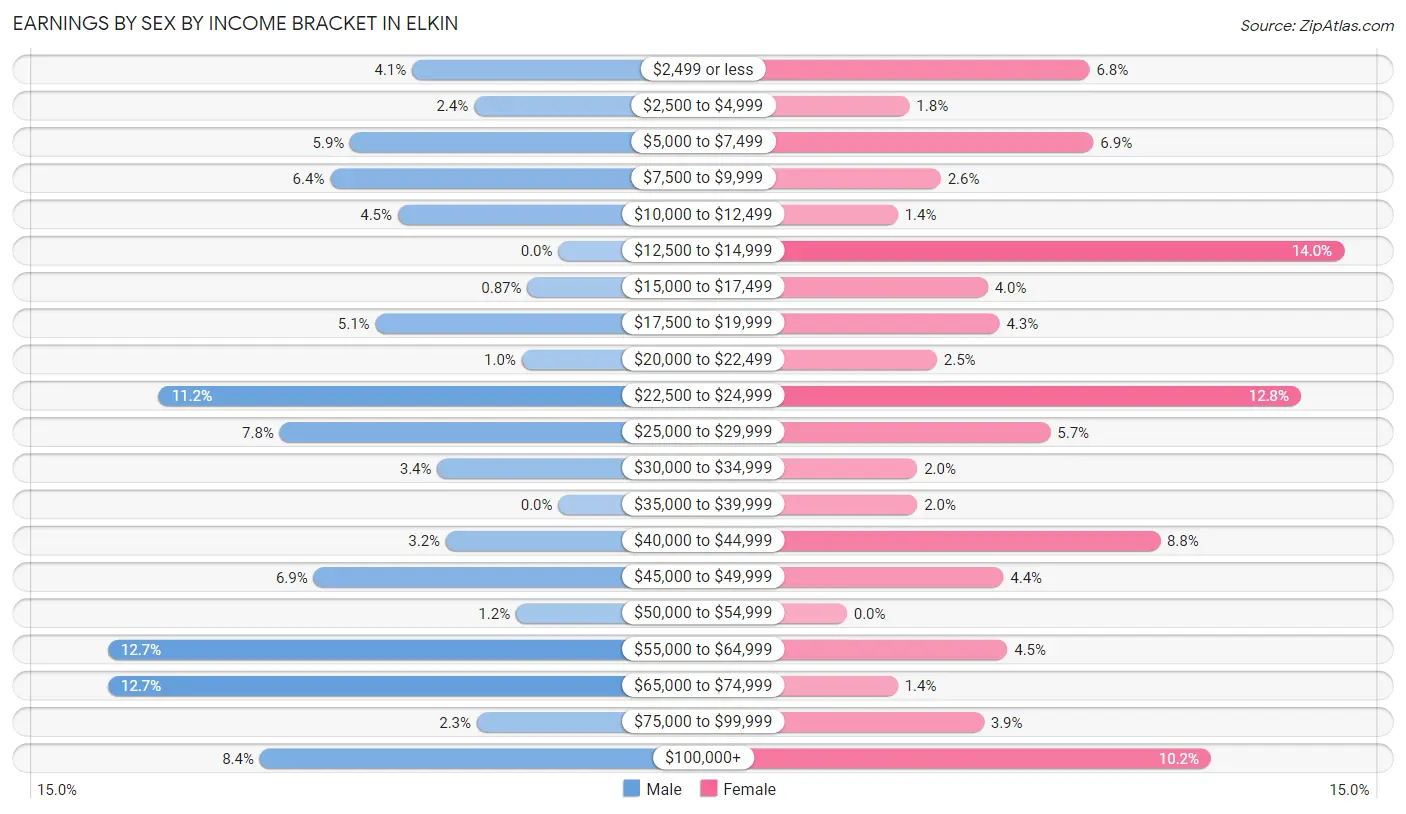
Earnings by Sex by Income Bracket in Elkin
The most common earnings brackets in Elkin are $55,000 to $64,999 for men (160 | 12.7%) and $12,500 to $14,999 for women (127 | 14.0%).
| Income | Male | Female |
| $2,499 or less | 52 (4.1%) | 62 (6.8%) |
| $2,500 to $4,999 | 30 (2.4%) | 16 (1.8%) |
| $5,000 to $7,499 | 74 (5.9%) | 63 (6.9%) |
| $7,500 to $9,999 | 81 (6.4%) | 24 (2.6%) |
| $10,000 to $12,499 | 57 (4.5%) | 13 (1.4%) |
| $12,500 to $14,999 | 0 (0.0%) | 127 (14.0%) |
| $15,000 to $17,499 | 11 (0.9%) | 36 (4.0%) |
| $17,500 to $19,999 | 65 (5.1%) | 39 (4.3%) |
| $20,000 to $22,499 | 13 (1.0%) | 23 (2.5%) |
| $22,500 to $24,999 | 142 (11.2%) | 116 (12.8%) |
| $25,000 to $29,999 | 99 (7.8%) | 52 (5.7%) |
| $30,000 to $34,999 | 43 (3.4%) | 18 (2.0%) |
| $35,000 to $39,999 | 0 (0.0%) | 18 (2.0%) |
| $40,000 to $44,999 | 40 (3.2%) | 80 (8.8%) |
| $45,000 to $49,999 | 87 (6.9%) | 40 (4.4%) |
| $50,000 to $54,999 | 15 (1.2%) | 0 (0.0%) |
| $55,000 to $64,999 | 160 (12.7%) | 41 (4.5%) |
| $65,000 to $74,999 | 160 (12.7%) | 13 (1.4%) |
| $75,000 to $99,999 | 29 (2.3%) | 35 (3.8%) |
| $100,000+ | 106 (8.4%) | 93 (10.2%) |
| Total | 1,264 (100.0%) | 909 (100.0%) |
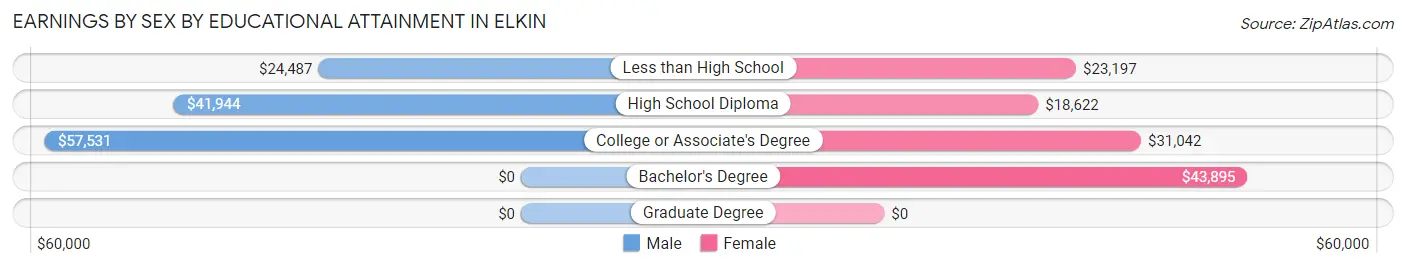
Earnings by Sex by Educational Attainment in Elkin
Average earnings in Elkin are $47,769 for men and $25,000 for women, a difference of 47.7%. Men with an educational attainment of college or associate's degree enjoy the highest average annual earnings of $57,531, while those with less than high school education earn the least with $24,487. Women with an educational attainment of bachelor's degree earn the most with the average annual earnings of $43,895, while those with high school diploma education have the smallest earnings of $18,622.
| Educational Attainment | Male Income | Female Income |
| Less than High School | $24,487 | $23,197 |
| High School Diploma | $41,944 | $18,622 |
| College or Associate's Degree | $57,531 | $31,042 |
| Bachelor's Degree | - | - |
| Graduate Degree | - | - |
| Total | $47,769 | $25,000 |
Family Income in Elkin
Family Income Brackets in Elkin
According to the Elkin family income data, there are 188 families falling into the $50,000 to $74,999 income range, which is the most common income bracket and makes up 22.1% of all families. Conversely, the $10,000 to $14,999 income bracket is the least frequent group with only 4 families (0.5%) belonging to this category.
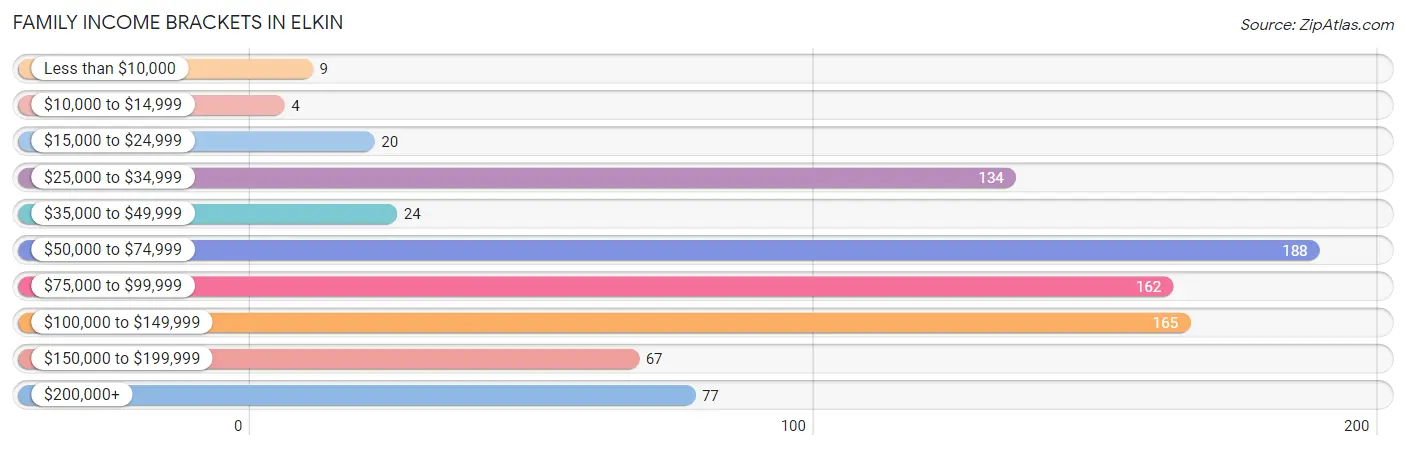
| Income Bracket | # Families | % Families |
| Less than $10,000 | 9 | 1.1% |
| $10,000 to $14,999 | 4 | 0.5% |
| $15,000 to $24,999 | 20 | 2.4% |
| $25,000 to $34,999 | 134 | 15.8% |
| $35,000 to $49,999 | 24 | 2.8% |
| $50,000 to $74,999 | 188 | 22.1% |
| $75,000 to $99,999 | 162 | 19.1% |
| $100,000 to $149,999 | 165 | 19.4% |
| $150,000 to $199,999 | 67 | 7.9% |
| $200,000+ | 77 | 9.1% |
Family Income by Famaliy Size in Elkin
3-person families (200 | 23.5%) account for the highest median family income in Elkin with $85,769 per family, while 2-person families (369 | 43.4%) have the highest median income of $34,799 per family member.
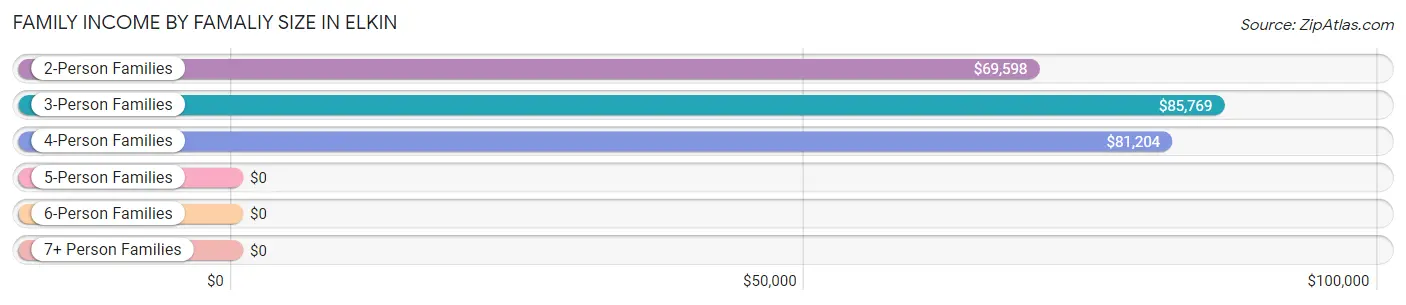
| Income Bracket | # Families | Median Income |
| 2-Person Families | 369 (43.4%) | $69,598 |
| 3-Person Families | 200 (23.5%) | $85,769 |
| 4-Person Families | 154 (18.1%) | $81,204 |
| 5-Person Families | 127 (14.9%) | $0 |
| 6-Person Families | 0 (0.0%) | $0 |
| 7+ Person Families | 0 (0.0%) | $0 |
| Total | 850 (100.0%) | $81,369 |
Family Income by Number of Earners in Elkin
The median family income in Elkin is $81,369, with families comprising 2 earners (465) having the highest median family income of $115,859, while families with no earners (70) have the lowest median family income of $36,875, accounting for 54.7% and 8.2% of families, respectively.
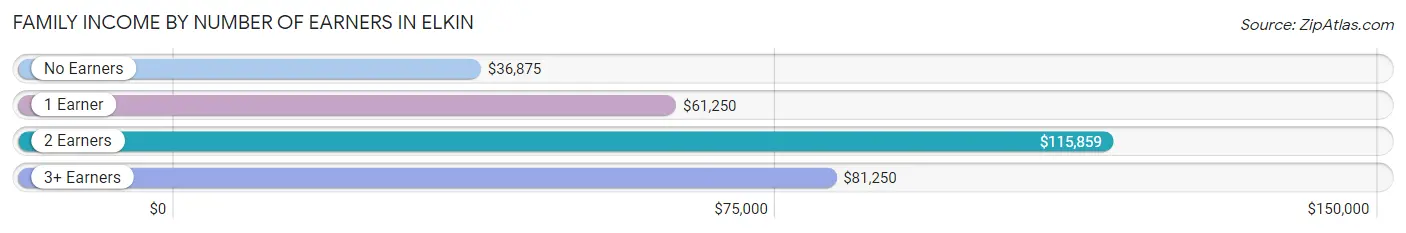
| Number of Earners | # Families | Median Income |
| No Earners | 70 (8.2%) | $36,875 |
| 1 Earner | 228 (26.8%) | $61,250 |
| 2 Earners | 465 (54.7%) | $115,859 |
| 3+ Earners | 87 (10.2%) | $81,250 |
| Total | 850 (100.0%) | $81,369 |
Household Income in Elkin
Household Income Brackets in Elkin
With 284 households falling in the category, the $75,000 to $99,999 income range is the most frequent in Elkin, accounting for 17.1% of all households. In contrast, only 83 households (5.0%) fall into the $200,000+ income bracket, making it the least populous group.
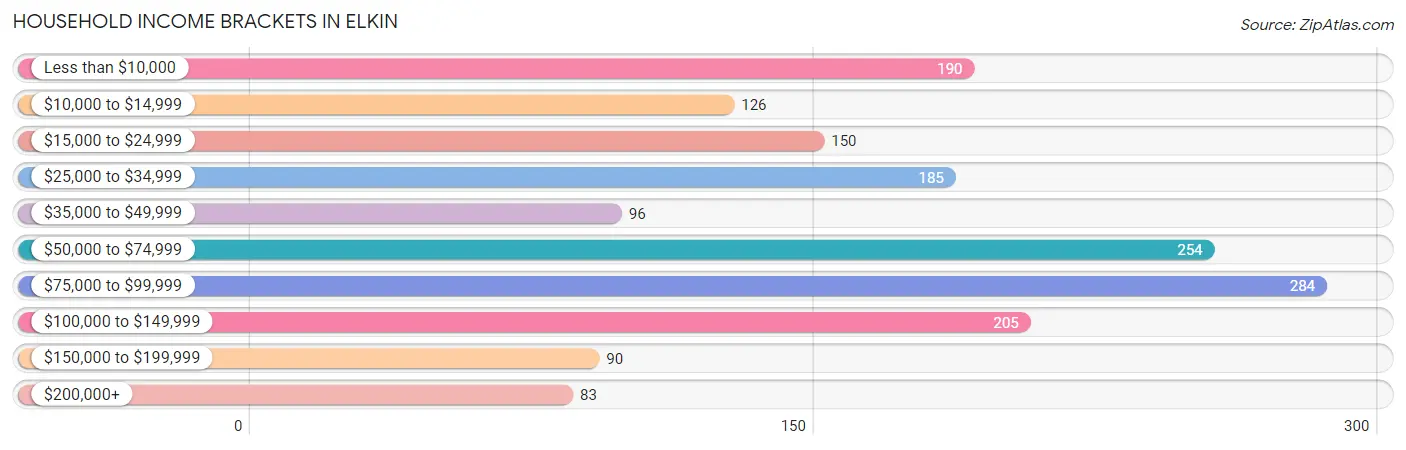
| Income Bracket | # Households | % Households |
| Less than $10,000 | 190 | 11.4% |
| $10,000 to $14,999 | 126 | 7.6% |
| $15,000 to $24,999 | 150 | 9.0% |
| $25,000 to $34,999 | 185 | 11.1% |
| $35,000 to $49,999 | 96 | 5.8% |
| $50,000 to $74,999 | 254 | 15.3% |
| $75,000 to $99,999 | 284 | 17.1% |
| $100,000 to $149,999 | 205 | 12.3% |
| $150,000 to $199,999 | 90 | 5.4% |
| $200,000+ | 83 | 5.0% |
Household Income by Householder Age in Elkin
The median household income in Elkin is $57,711, with the highest median household income of $68,875 found in the 45 to 64 years age bracket for the primary householder. A total of 657 households (39.5%) fall into this category. Meanwhile, the 15 to 24 years age bracket for the primary householder has the lowest median household income of $0, with 111 households (6.7%) in this group.
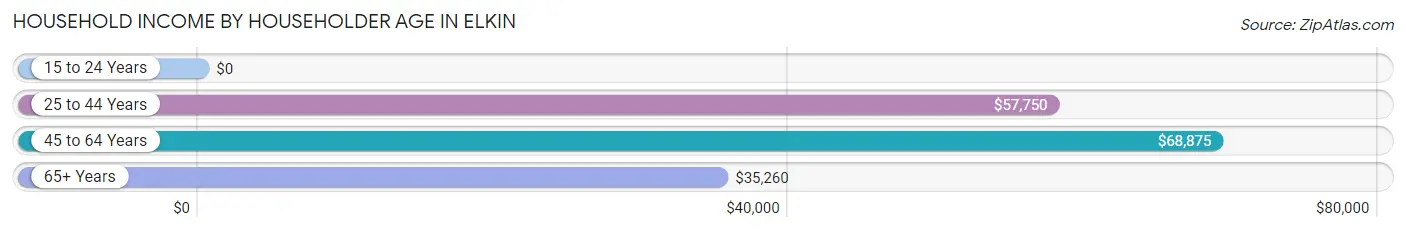
| Income Bracket | # Households | Median Income |
| 15 to 24 Years | 111 (6.7%) | $0 |
| 25 to 44 Years | 388 (23.3%) | $57,750 |
| 45 to 64 Years | 657 (39.5%) | $68,875 |
| 65+ Years | 507 (30.5%) | $35,260 |
| Total | 1,663 (100.0%) | $57,711 |
Poverty in Elkin
Income Below Poverty by Sex and Age in Elkin
With 21.9% poverty level for males and 26.7% for females among the residents of Elkin, under 5 year old males and 16 and 17 year old females are the most vulnerable to poverty, with 9 males (100.0%) and 60 females (72.3%) in their respective age groups living below the poverty level.
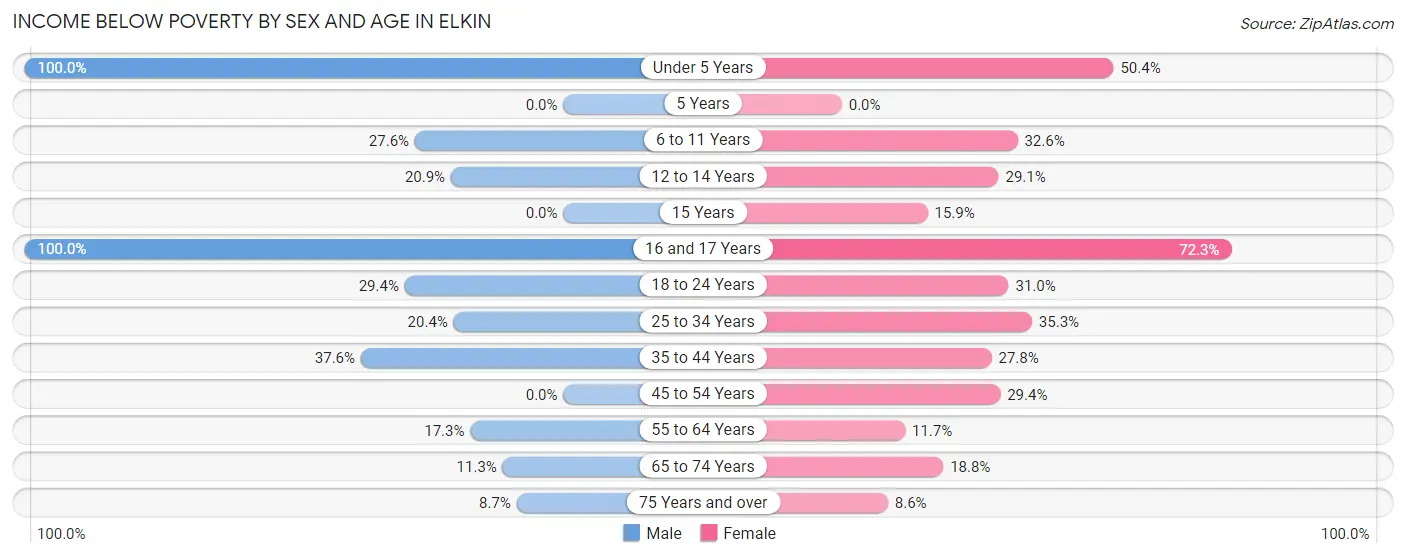
| Age Bracket | Male | Female |
| Under 5 Years | 9 (100.0%) | 59 (50.4%) |
| 5 Years | 0 (0.0%) | 0 (0.0%) |
| 6 to 11 Years | 54 (27.6%) | 45 (32.6%) |
| 12 to 14 Years | 29 (20.9%) | 16 (29.1%) |
| 15 Years | 0 (0.0%) | 14 (15.9%) |
| 16 and 17 Years | 31 (100.0%) | 60 (72.3%) |
| 18 to 24 Years | 58 (29.4%) | 52 (30.9%) |
| 25 to 34 Years | 45 (20.4%) | 54 (35.3%) |
| 35 to 44 Years | 118 (37.6%) | 67 (27.8%) |
| 45 to 54 Years | 0 (0.0%) | 50 (29.4%) |
| 55 to 64 Years | 48 (17.3%) | 31 (11.7%) |
| 65 to 74 Years | 16 (11.3%) | 48 (18.8%) |
| 75 Years and over | 11 (8.7%) | 13 (8.6%) |
| Total | 419 (21.9%) | 509 (26.7%) |
Income Above Poverty by Sex and Age in Elkin
According to the poverty statistics in Elkin, males aged 5 years and females aged 5 years are the age groups that are most secure financially, with 100.0% of males and 100.0% of females in these age groups living above the poverty line.
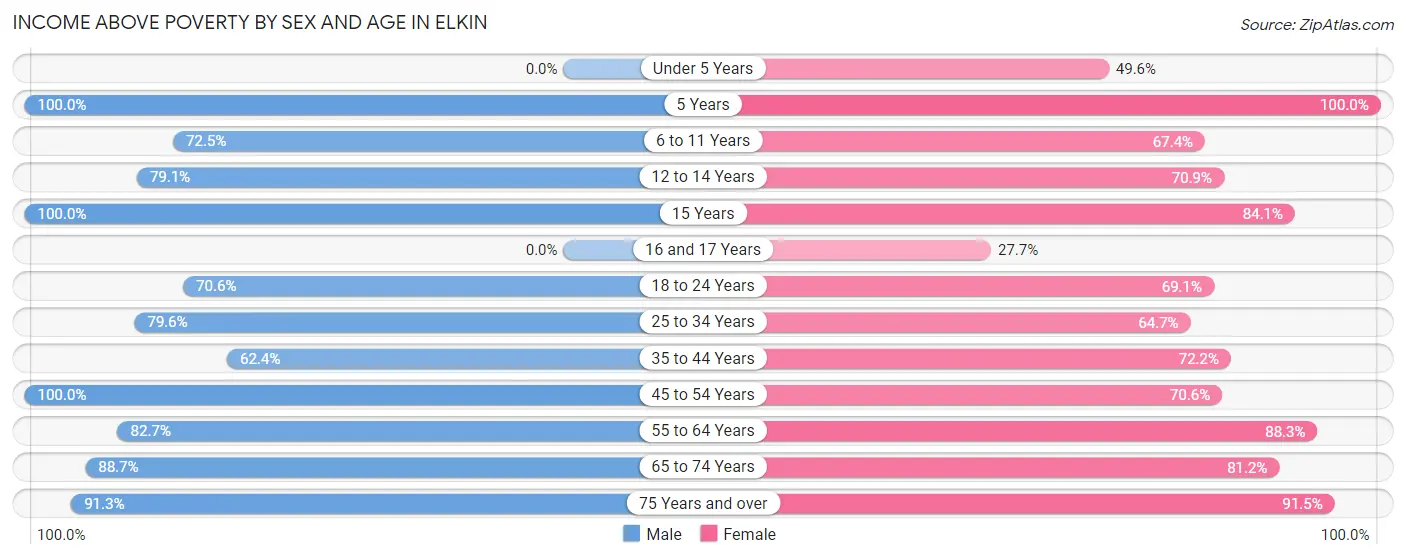
| Age Bracket | Male | Female |
| Under 5 Years | 0 (0.0%) | 58 (49.6%) |
| 5 Years | 10 (100.0%) | 24 (100.0%) |
| 6 to 11 Years | 142 (72.5%) | 93 (67.4%) |
| 12 to 14 Years | 110 (79.1%) | 39 (70.9%) |
| 15 Years | 3 (100.0%) | 74 (84.1%) |
| 16 and 17 Years | 0 (0.0%) | 23 (27.7%) |
| 18 to 24 Years | 139 (70.6%) | 116 (69.1%) |
| 25 to 34 Years | 176 (79.6%) | 99 (64.7%) |
| 35 to 44 Years | 196 (62.4%) | 174 (72.2%) |
| 45 to 54 Years | 248 (100.0%) | 120 (70.6%) |
| 55 to 64 Years | 230 (82.7%) | 233 (88.3%) |
| 65 to 74 Years | 126 (88.7%) | 207 (81.2%) |
| 75 Years and over | 116 (91.3%) | 139 (91.4%) |
| Total | 1,496 (78.1%) | 1,399 (73.3%) |
Income Below Poverty Among Married-Couple Families in Elkin
The poverty statistics for married-couple families in Elkin show that 12.8% or 74 of the total 579 families live below the poverty line. Families with 3 or 4 children have the highest poverty rate of 47.5%, comprising of 57 families. On the other hand, families with no children have the lowest poverty rate of 0.0%, which includes 0 families.
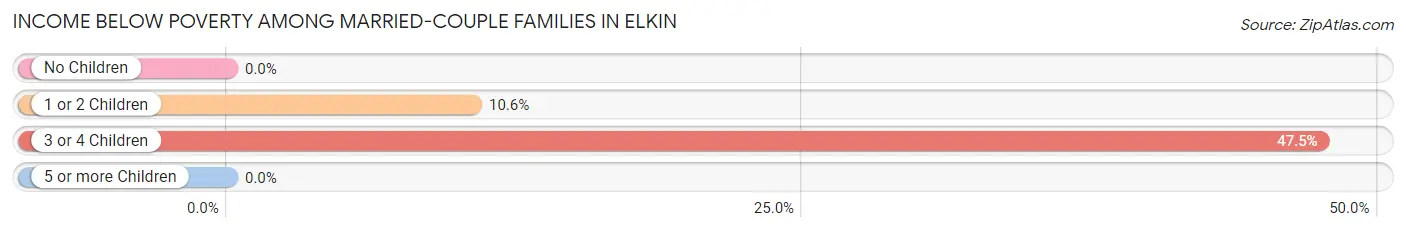
| Children | Above Poverty | Below Poverty |
| No Children | 299 (100.0%) | 0 (0.0%) |
| 1 or 2 Children | 143 (89.4%) | 17 (10.6%) |
| 3 or 4 Children | 63 (52.5%) | 57 (47.5%) |
| 5 or more Children | 0 (0.0%) | 0 (0.0%) |
| Total | 505 (87.2%) | 74 (12.8%) |
Income Below Poverty Among Single-Parent Households in Elkin
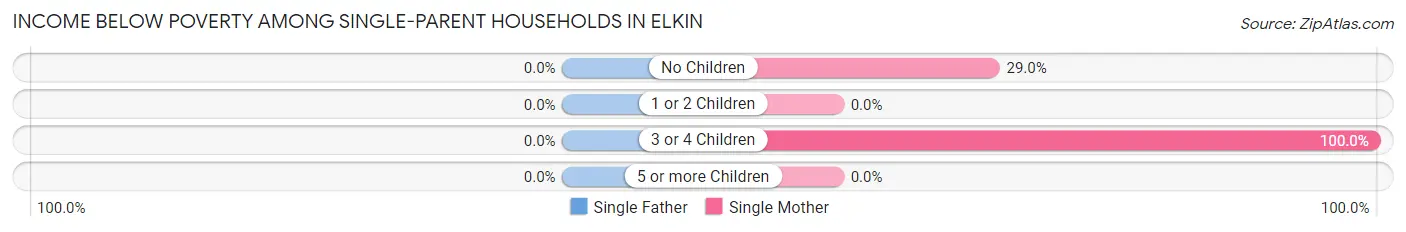
| Children | Single Father | Single Mother |
| No Children | 0 (0.0%) | 9 (29.0%) |
| 1 or 2 Children | 0 (0.0%) | 0 (0.0%) |
| 3 or 4 Children | 0 (0.0%) | 29 (100.0%) |
| 5 or more Children | 0 (0.0%) | 0 (0.0%) |
| Total | 0 (0.0%) | 38 (30.6%) |
Income Below Poverty Among Married-Couple vs Single-Parent Households in Elkin
The poverty data for Elkin shows that 74 of the married-couple family households (12.8%) and 38 of the single-parent households (14.0%) are living below the poverty level. Within the married-couple family households, those with 3 or 4 children have the highest poverty rate, with 57 households (47.5%) falling below the poverty line. Among the single-parent households, those with 3 or 4 children have the highest poverty rate, with 29 household (100.0%) living below poverty.
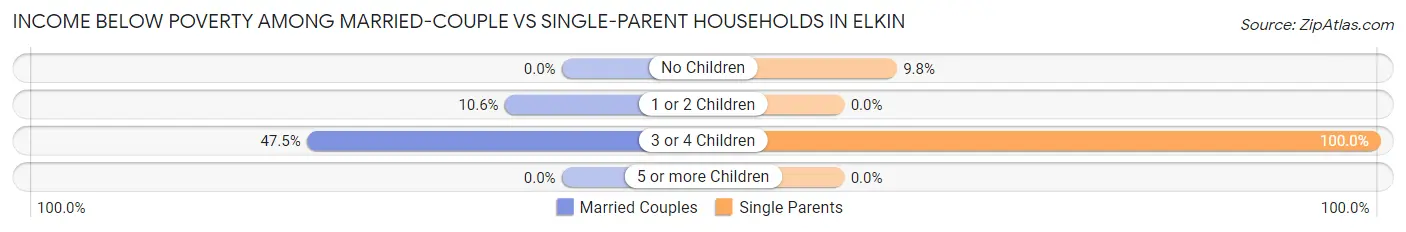
| Children | Married-Couple Families | Single-Parent Households |
| No Children | 0 (0.0%) | 9 (9.8%) |
| 1 or 2 Children | 17 (10.6%) | 0 (0.0%) |
| 3 or 4 Children | 57 (47.5%) | 29 (100.0%) |
| 5 or more Children | 0 (0.0%) | 0 (0.0%) |
| Total | 74 (12.8%) | 38 (14.0%) |
Race in Elkin
The most populous races in Elkin are White / Caucasian (3,304 | 82.1%), Hispanic or Latino (1,078 | 26.8%), and Two or more Races (291 | 7.2%).
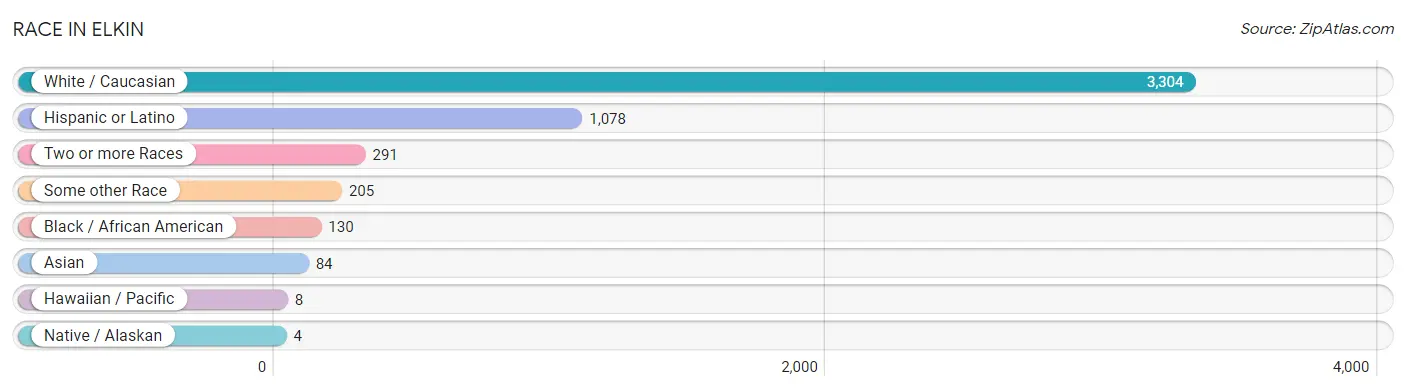
| Race | # Population | % Population |
| Asian | 84 | 2.1% |
| Black / African American | 130 | 3.2% |
| Hawaiian / Pacific | 8 | 0.2% |
| Hispanic or Latino | 1,078 | 26.8% |
| Native / Alaskan | 4 | 0.1% |
| White / Caucasian | 3,304 | 82.1% |
| Two or more Races | 291 | 7.2% |
| Some other Race | 205 | 5.1% |
| Total | 4,026 | 100.0% |
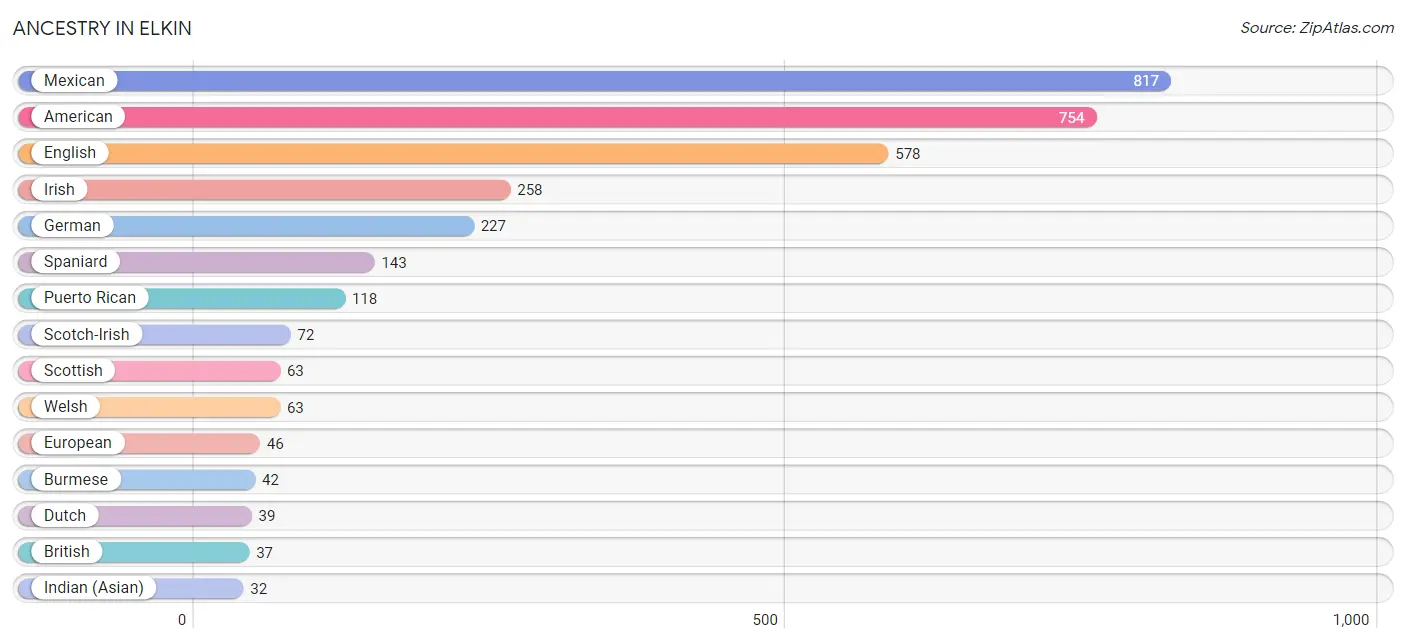
Ancestry in Elkin
The most populous ancestries reported in Elkin are Mexican (817 | 20.3%), American (754 | 18.7%), English (578 | 14.4%), Irish (258 | 6.4%), and German (227 | 5.6%), together accounting for 65.4% of all Elkin residents.
| Ancestry | # Population | % Population |
| African | 13 | 0.3% |
| American | 754 | 18.7% |
| Blackfeet | 4 | 0.1% |
| British | 37 | 0.9% |
| Burmese | 42 | 1.0% |
| Cherokee | 11 | 0.3% |
| Danish | 4 | 0.1% |
| Dutch | 39 | 1.0% |
| Eastern European | 14 | 0.4% |
| English | 578 | 14.4% |
| Ethiopian | 16 | 0.4% |
| European | 46 | 1.1% |
| French | 24 | 0.6% |
| German | 227 | 5.6% |
| Guamanian / Chamorro | 2 | 0.1% |
| Indian (Asian) | 32 | 0.8% |
| Inupiat | 3 | 0.1% |
| Irish | 258 | 6.4% |
| Italian | 29 | 0.7% |
| Mexican | 817 | 20.3% |
| Norwegian | 16 | 0.4% |
| Polish | 19 | 0.5% |
| Puerto Rican | 118 | 2.9% |
| Samoan | 8 | 0.2% |
| Scotch-Irish | 72 | 1.8% |
| Scottish | 63 | 1.6% |
| Spaniard | 143 | 3.5% |
| Sri Lankan | 17 | 0.4% |
| Subsaharan African | 29 | 0.7% |
| Swiss | 30 | 0.7% |
| Welsh | 63 | 1.6% | View All 31 Rows |
Immigrants in Elkin
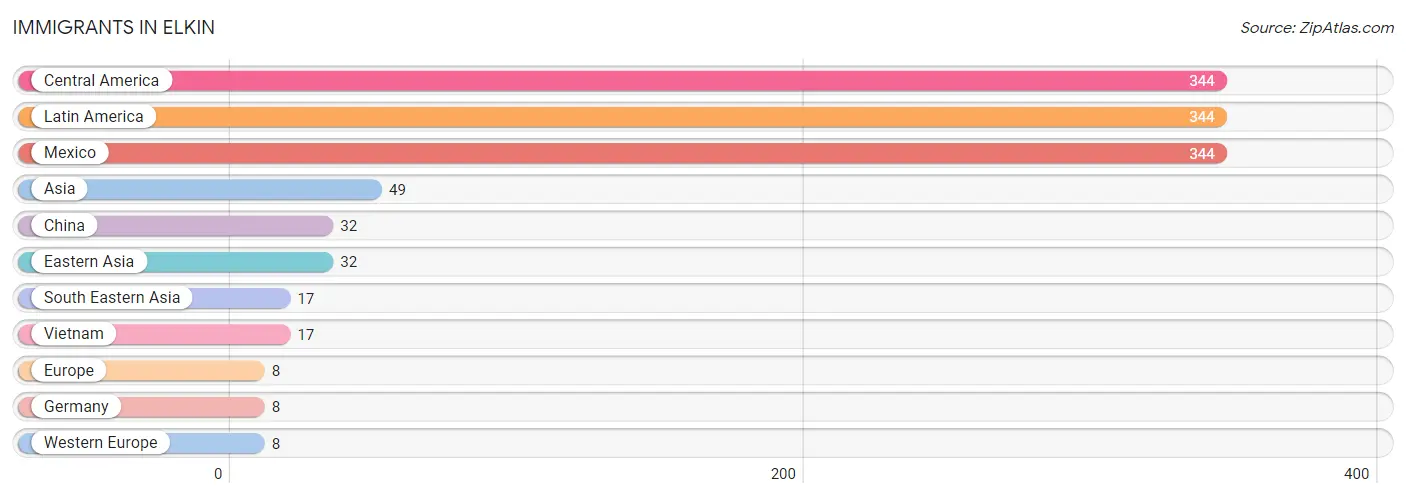
The most numerous immigrant groups reported in Elkin came from Central America (344 | 8.5%), Latin America (344 | 8.5%), Mexico (344 | 8.5%), Asia (49 | 1.2%), and China (32 | 0.8%), together accounting for 27.6% of all Elkin residents.
| Immigration Origin | # Population | % Population |
| Asia | 49 | 1.2% |
| Central America | 344 | 8.5% |
| China | 32 | 0.8% |
| Eastern Asia | 32 | 0.8% |
| Europe | 8 | 0.2% |
| Germany | 8 | 0.2% |
| Latin America | 344 | 8.5% |
| Mexico | 344 | 8.5% |
| South Eastern Asia | 17 | 0.4% |
| Vietnam | 17 | 0.4% |
| Western Europe | 8 | 0.2% | View All 11 Rows |
Sex and Age in Elkin
Sex and Age in Elkin
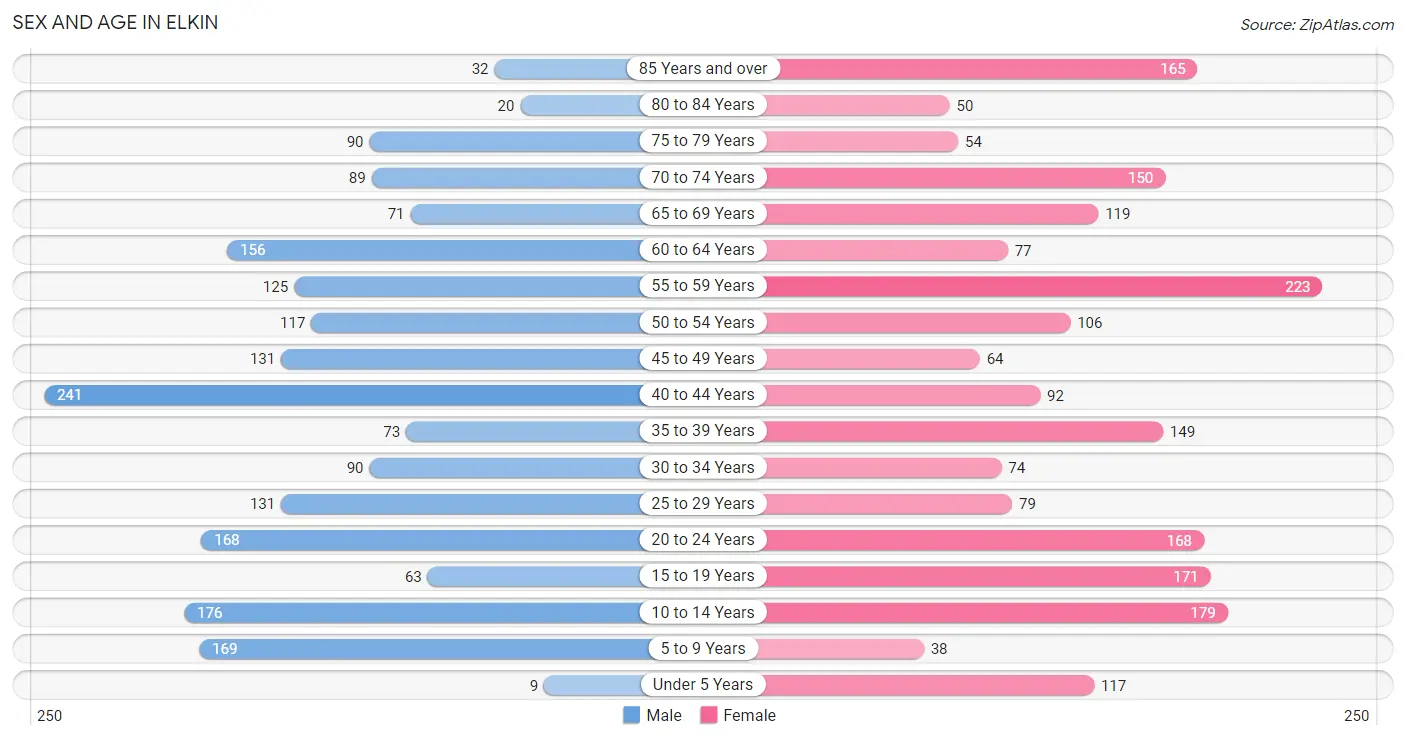
The most populous age groups in Elkin are 40 to 44 Years (241 | 12.3%) for men and 55 to 59 Years (223 | 10.7%) for women.
| Age Bracket | Male | Female |
| Under 5 Years | 9 (0.5%) | 117 (5.6%) |
| 5 to 9 Years | 169 (8.7%) | 38 (1.8%) |
| 10 to 14 Years | 176 (9.0%) | 179 (8.6%) |
| 15 to 19 Years | 63 (3.2%) | 171 (8.2%) |
| 20 to 24 Years | 168 (8.6%) | 168 (8.1%) |
| 25 to 29 Years | 131 (6.7%) | 79 (3.8%) |
| 30 to 34 Years | 90 (4.6%) | 74 (3.6%) |
| 35 to 39 Years | 73 (3.7%) | 149 (7.2%) |
| 40 to 44 Years | 241 (12.3%) | 92 (4.4%) |
| 45 to 49 Years | 131 (6.7%) | 64 (3.1%) |
| 50 to 54 Years | 117 (6.0%) | 106 (5.1%) |
| 55 to 59 Years | 125 (6.4%) | 223 (10.7%) |
| 60 to 64 Years | 156 (8.0%) | 77 (3.7%) |
| 65 to 69 Years | 71 (3.6%) | 119 (5.7%) |
| 70 to 74 Years | 89 (4.6%) | 150 (7.2%) |
| 75 to 79 Years | 90 (4.6%) | 54 (2.6%) |
| 80 to 84 Years | 20 (1.0%) | 50 (2.4%) |
| 85 Years and over | 32 (1.6%) | 165 (8.0%) |
| Total | 1,951 (100.0%) | 2,075 (100.0%) |
Families and Households in Elkin
Median Family Size in Elkin
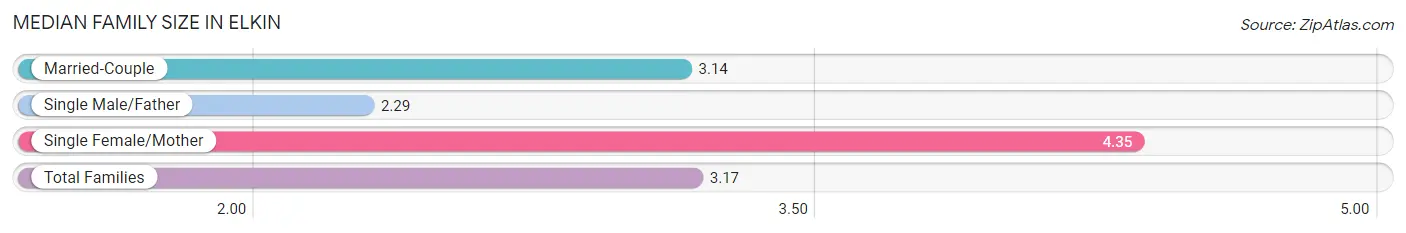
The median family size in Elkin is 3.17 persons per family, with single female/mother families (124 | 14.6%) accounting for the largest median family size of 4.35 persons per family. On the other hand, single male/father families (147 | 17.3%) represent the smallest median family size with 2.29 persons per family.
| Family Type | # Families | Family Size |
| Married-Couple | 579 (68.1%) | 3.14 |
| Single Male/Father | 147 (17.3%) | 2.29 |
| Single Female/Mother | 124 (14.6%) | 4.35 |
| Total Families | 850 (100.0%) | 3.17 |
Median Household Size in Elkin
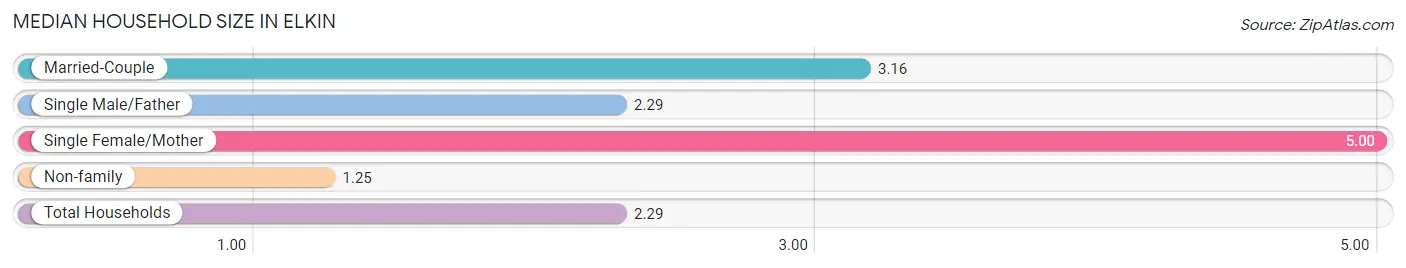
The median household size in Elkin is 2.29 persons per household, with single female/mother households (124 | 7.5%) accounting for the largest median household size of 5 persons per household. non-family households (813 | 48.9%) represent the smallest median household size with 1.25 persons per household.
| Household Type | # Households | Household Size |
| Married-Couple | 579 (34.8%) | 3.16 |
| Single Male/Father | 147 (8.8%) | 2.29 |
| Single Female/Mother | 124 (7.5%) | 5.00 |
| Non-family | 813 (48.9%) | 1.25 |
| Total Households | 1,663 (100.0%) | 2.29 |
Household Size by Marriage Status in Elkin
Out of a total of 1,663 households in Elkin, 850 (51.1%) are family households, while 813 (48.9%) are nonfamily households. The most numerous type of family households are 2-person households, comprising 360, and the most common type of nonfamily households are 1-person households, comprising 650.
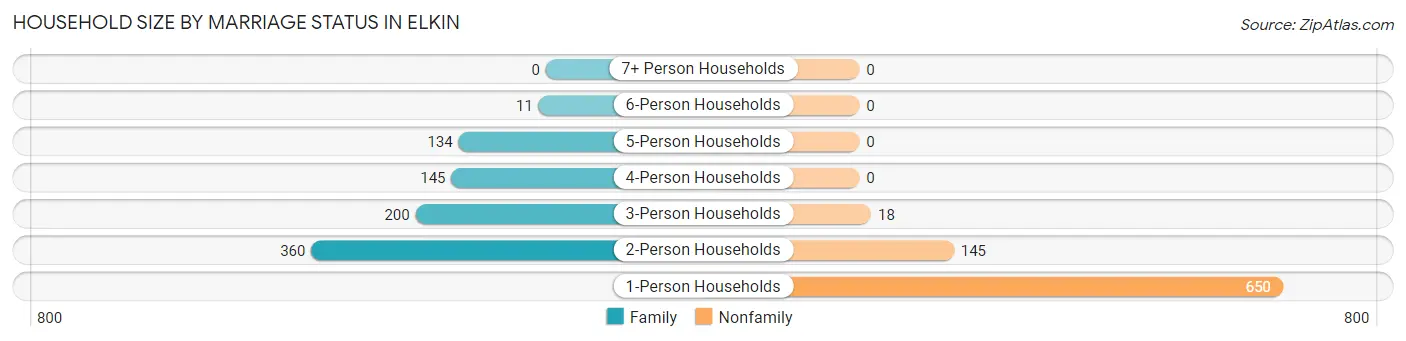
| Household Size | Family Households | Nonfamily Households |
| 1-Person Households | - | 650 (39.1%) |
| 2-Person Households | 360 (21.6%) | 145 (8.7%) |
| 3-Person Households | 200 (12.0%) | 18 (1.1%) |
| 4-Person Households | 145 (8.7%) | 0 (0.0%) |
| 5-Person Households | 134 (8.1%) | 0 (0.0%) |
| 6-Person Households | 11 (0.7%) | 0 (0.0%) |
| 7+ Person Households | 0 (0.0%) | 0 (0.0%) |
| Total | 850 (51.1%) | 813 (48.9%) |
Female Fertility in Elkin
Fertility by Age in Elkin
| Age Bracket | Women with Births | Births / 1,000 Women |
| 15 to 19 years | 0 (0.0%) | 0.0 |
| 20 to 34 years | 0 (0.0%) | 0.0 |
| 35 to 50 years | 0 (0.0%) | 0.0 |
| Total | 0 (0.0%) | 0.0 |
Fertility by Age by Marriage Status in Elkin
| Age Bracket | Married | Unmarried |
| 15 to 19 years | 0 (0.0%) | 0 (0.0%) |
| 20 to 34 years | 0 (0.0%) | 0 (0.0%) |
| 35 to 50 years | 0 (0.0%) | 0 (0.0%) |
| Total | 0 (0.0%) | 0 (0.0%) |
Fertility by Education in Elkin
| Educational Attainment | Women with Births | Births / 1,000 Women |
| Less than High School | 0 (0.0%) | 0.0 |
| High School Diploma | 0 (0.0%) | 0.0 |
| College or Associate's Degree | 0 (0.0%) | 0.0 |
| Bachelor's Degree | 0 (0.0%) | 0.0 |
| Graduate Degree | 0 (0.0%) | 0.0 |
| Total | 0 (0.0%) | 0.0 |
Fertility by Education by Marriage Status in Elkin
| Educational Attainment | Married | Unmarried |
| Less than High School | 0 (0.0%) | 0 (0.0%) |
| High School Diploma | 0 (0.0%) | 0 (0.0%) |
| College or Associate's Degree | 0 (0.0%) | 0 (0.0%) |
| Bachelor's Degree | 0 (0.0%) | 0 (0.0%) |
| Graduate Degree | 0 (0.0%) | 0 (0.0%) |
| Total | 0 (0.0%) | 0 (0.0%) |
Employment Characteristics in Elkin
Employment by Class of Employer in Elkin
Among the 2,004 employed individuals in Elkin, private company employees (1,522 | 75.9%), not-for-profit organizations (159 | 7.9%), and self-employed (not incorporated) (117 | 5.8%) make up the most common classes of employment.
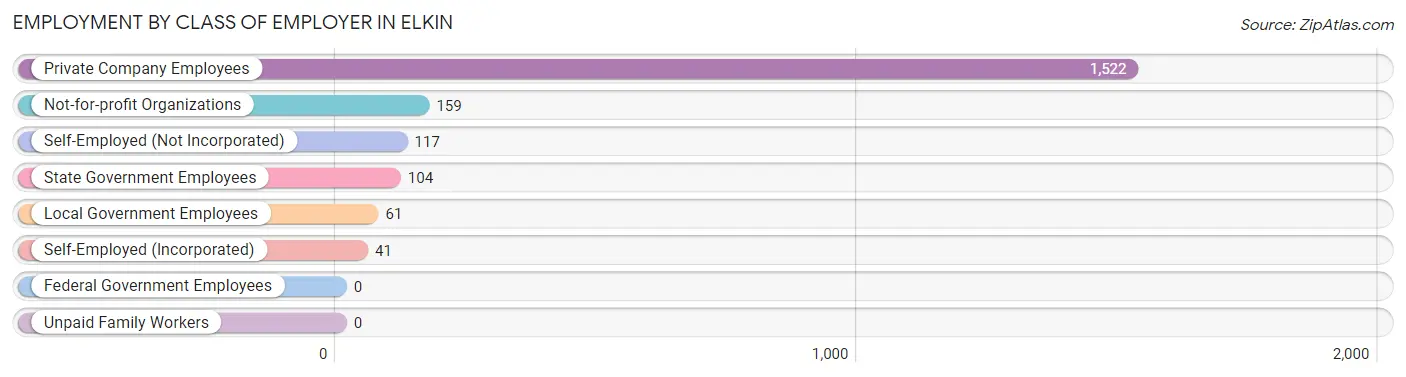
| Employer Class | # Employees | % Employees |
| Private Company Employees | 1,522 | 75.9% |
| Self-Employed (Incorporated) | 41 | 2.1% |
| Self-Employed (Not Incorporated) | 117 | 5.8% |
| Not-for-profit Organizations | 159 | 7.9% |
| Local Government Employees | 61 | 3.0% |
| State Government Employees | 104 | 5.2% |
| Federal Government Employees | 0 | 0.0% |
| Unpaid Family Workers | 0 | 0.0% |
| Total | 2,004 | 100.0% |
Employment Status by Age in Elkin
According to the labor force statistics for Elkin, out of the total population over 16 years of age (3,247), 64.7% or 2,101 individuals are in the labor force, with 3.1% or 65 of them unemployed. The age group with the highest labor force participation rate is 30 to 34 years, with 98.2% or 161 individuals in the labor force. Within the labor force, the 75 years and over age range has the highest percentage of unemployed individuals, with 35.7% or 10 of them being unemployed.
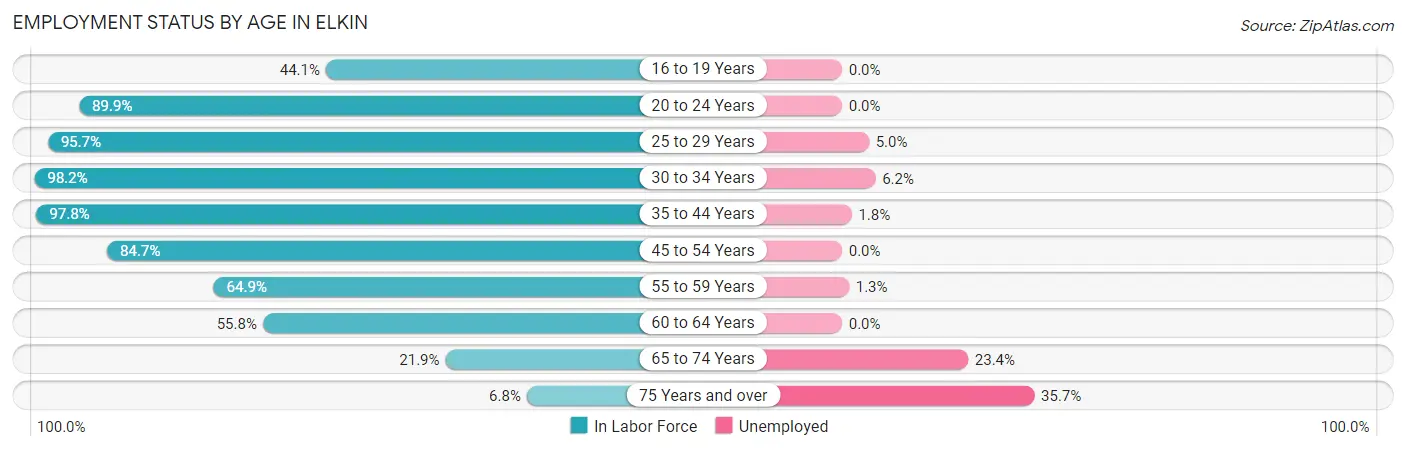
| Age Bracket | In Labor Force | Unemployed |
| 16 to 19 Years | 63 (44.1%) | 0 (0.0%) |
| 20 to 24 Years | 302 (89.9%) | 0 (0.0%) |
| 25 to 29 Years | 201 (95.7%) | 10 (5.0%) |
| 30 to 34 Years | 161 (98.2%) | 10 (6.2%) |
| 35 to 44 Years | 543 (97.8%) | 10 (1.8%) |
| 45 to 54 Years | 354 (84.7%) | 0 (0.0%) |
| 55 to 59 Years | 226 (64.9%) | 3 (1.3%) |
| 60 to 64 Years | 130 (55.8%) | 0 (0.0%) |
| 65 to 74 Years | 94 (21.9%) | 22 (23.4%) |
| 75 Years and over | 28 (6.8%) | 10 (35.7%) |
| Total | 2,101 (64.7%) | 65 (3.1%) |
Employment Status by Educational Attainment in Elkin
According to labor force statistics for Elkin, 83.8% of individuals (1,616) out of the total population between 25 and 64 years of age (1,928) are in the labor force, with 2.0% or 32 of them being unemployed. The group with the highest labor force participation rate are those with the educational attainment of high school diploma, with 90.2% or 453 individuals in the labor force. Within the labor force, individuals with less than high school education have the highest percentage of unemployment, with 4.2% or 13 of them being unemployed.
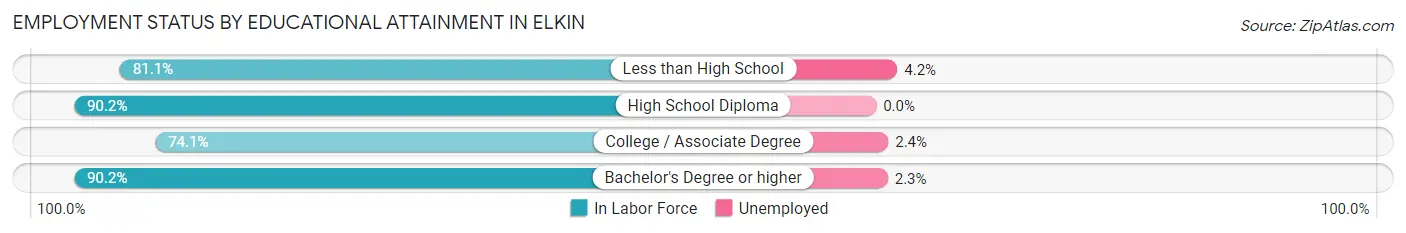
| Educational Attainment | In Labor Force | Unemployed |
| Less than High School | 308 (81.1%) | 16 (4.2%) |
| High School Diploma | 453 (90.2%) | 0 (0.0%) |
| College / Associate Degree | 411 (74.1%) | 13 (2.4%) |
| Bachelor's Degree or higher | 443 (90.2%) | 11 (2.3%) |
| Total | 1,616 (83.8%) | 39 (2.0%) |
Employment Occupations by Sex in Elkin
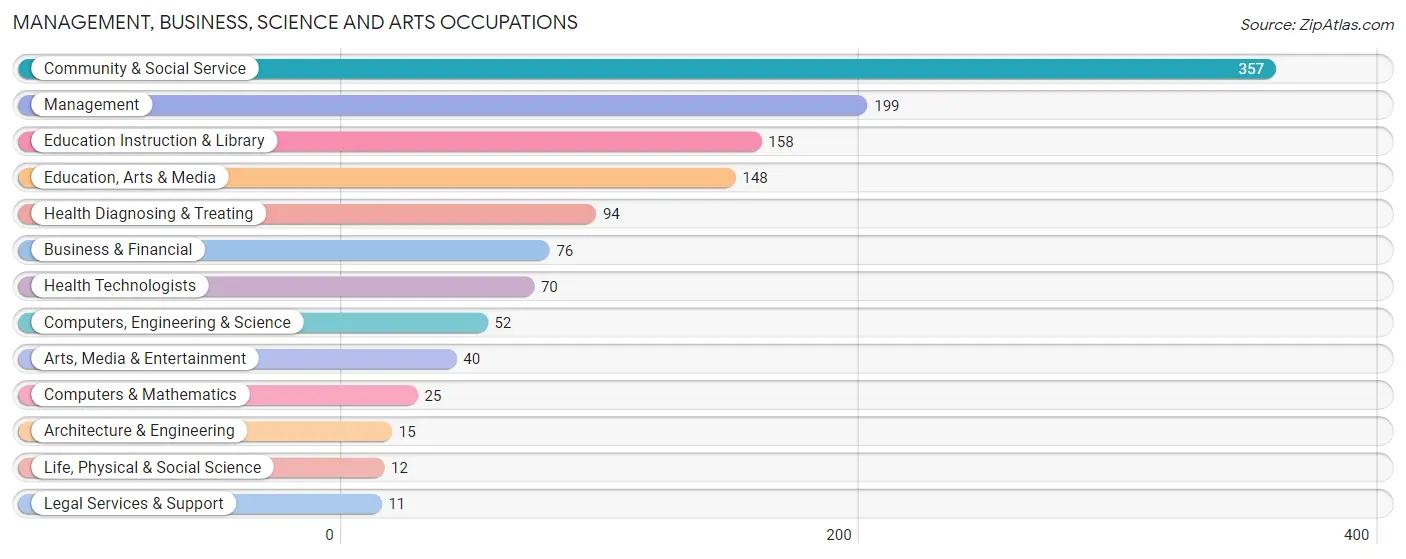
Management, Business, Science and Arts Occupations
The most common Management, Business, Science and Arts occupations in Elkin are Community & Social Service (357 | 17.5%), Management (199 | 9.8%), Education Instruction & Library (158 | 7.8%), Education, Arts & Media (148 | 7.3%), and Health Diagnosing & Treating (94 | 4.6%).
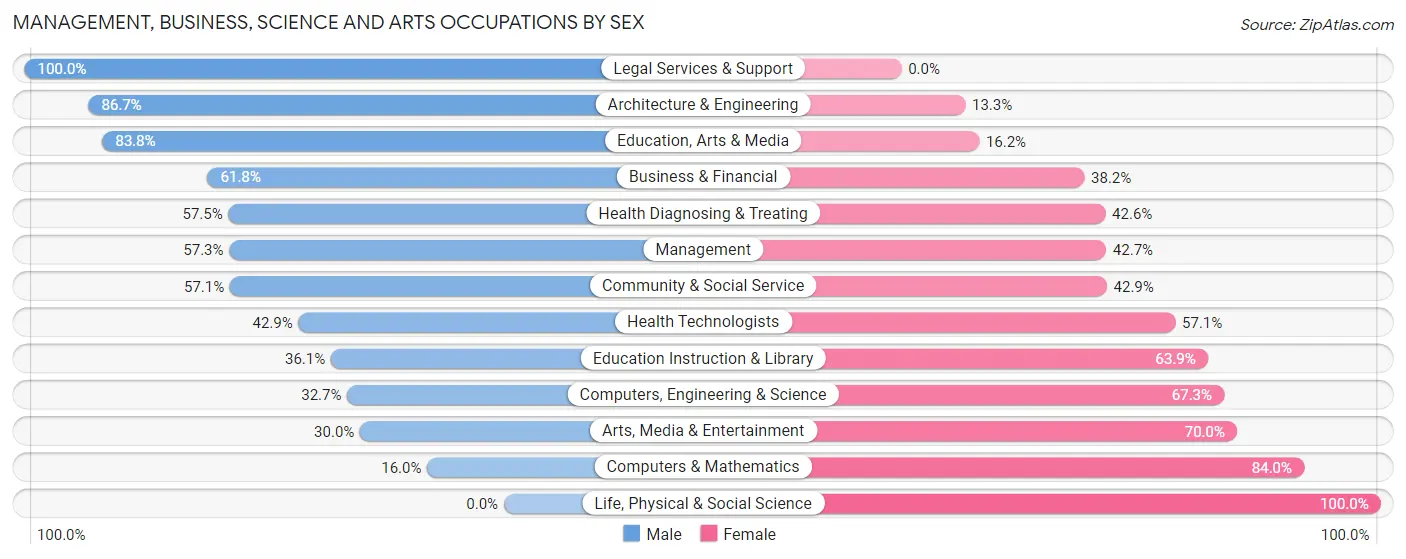
Management, Business, Science and Arts Occupations by Sex
Within the Management, Business, Science and Arts occupations in Elkin, the most male-oriented occupations are Legal Services & Support (100.0%), Architecture & Engineering (86.7%), and Education, Arts & Media (83.8%), while the most female-oriented occupations are Life, Physical & Social Science (100.0%), Computers & Mathematics (84.0%), and Arts, Media & Entertainment (70.0%).
| Occupation | Male | Female |
| Management | 114 (57.3%) | 85 (42.7%) |
| Business & Financial | 47 (61.8%) | 29 (38.2%) |
| Computers, Engineering & Science | 17 (32.7%) | 35 (67.3%) |
| Computers & Mathematics | 4 (16.0%) | 21 (84.0%) |
| Architecture & Engineering | 13 (86.7%) | 2 (13.3%) |
| Life, Physical & Social Science | 0 (0.0%) | 12 (100.0%) |
| Community & Social Service | 204 (57.1%) | 153 (42.9%) |
| Education, Arts & Media | 124 (83.8%) | 24 (16.2%) |
| Legal Services & Support | 11 (100.0%) | 0 (0.0%) |
| Education Instruction & Library | 57 (36.1%) | 101 (63.9%) |
| Arts, Media & Entertainment | 12 (30.0%) | 28 (70.0%) |
| Health Diagnosing & Treating | 54 (57.5%) | 40 (42.5%) |
| Health Technologists | 30 (42.9%) | 40 (57.1%) |
| Total (Category) | 436 (56.0%) | 342 (44.0%) |
| Total (Overall) | 1,209 (59.4%) | 828 (40.6%) |
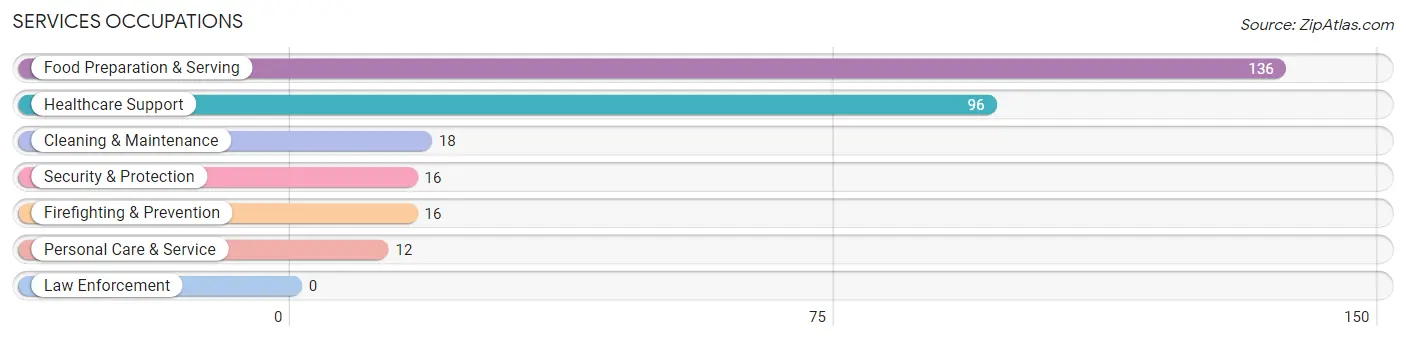
Services Occupations
The most common Services occupations in Elkin are Food Preparation & Serving (136 | 6.7%), Healthcare Support (96 | 4.7%), Cleaning & Maintenance (18 | 0.9%), Security & Protection (16 | 0.8%), and Firefighting & Prevention (16 | 0.8%).
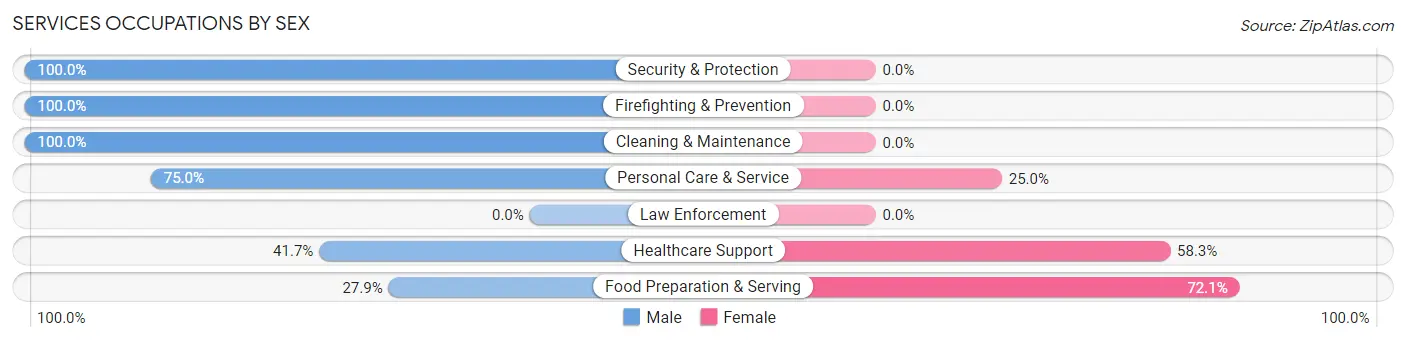
Services Occupations by Sex
Within the Services occupations in Elkin, the most male-oriented occupations are Security & Protection (100.0%), Firefighting & Prevention (100.0%), and Cleaning & Maintenance (100.0%), while the most female-oriented occupations are Food Preparation & Serving (72.1%), Healthcare Support (58.3%), and Personal Care & Service (25.0%).
| Occupation | Male | Female |
| Healthcare Support | 40 (41.7%) | 56 (58.3%) |
| Security & Protection | 16 (100.0%) | 0 (0.0%) |
| Firefighting & Prevention | 16 (100.0%) | 0 (0.0%) |
| Law Enforcement | 0 (0.0%) | 0 (0.0%) |
| Food Preparation & Serving | 38 (27.9%) | 98 (72.1%) |
| Cleaning & Maintenance | 18 (100.0%) | 0 (0.0%) |
| Personal Care & Service | 9 (75.0%) | 3 (25.0%) |
| Total (Category) | 121 (43.5%) | 157 (56.5%) |
| Total (Overall) | 1,209 (59.4%) | 828 (40.6%) |
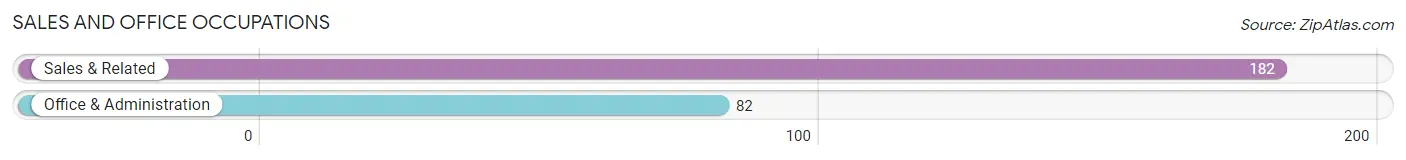
Sales and Office Occupations
The most common Sales and Office occupations in Elkin are Sales & Related (182 | 8.9%), and Office & Administration (82 | 4.0%).
Sales and Office Occupations by Sex
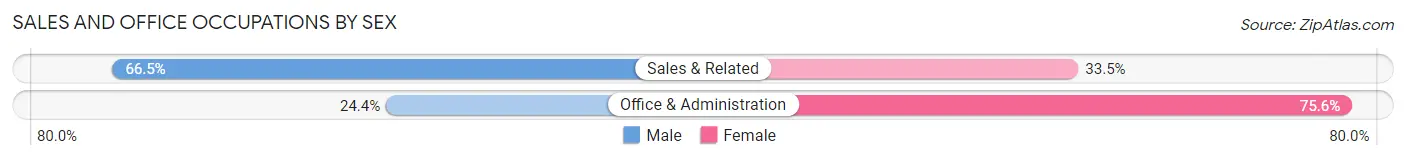
| Occupation | Male | Female |
| Sales & Related | 121 (66.5%) | 61 (33.5%) |
| Office & Administration | 20 (24.4%) | 62 (75.6%) |
| Total (Category) | 141 (53.4%) | 123 (46.6%) |
| Total (Overall) | 1,209 (59.4%) | 828 (40.6%) |
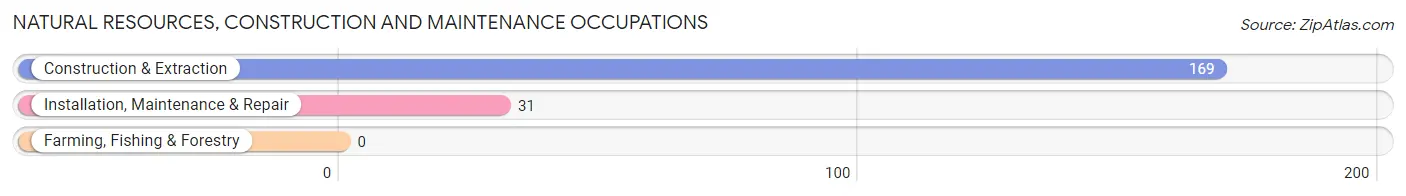
Natural Resources, Construction and Maintenance Occupations
The most common Natural Resources, Construction and Maintenance occupations in Elkin are Construction & Extraction (169 | 8.3%), and Installation, Maintenance & Repair (31 | 1.5%).
Natural Resources, Construction and Maintenance Occupations by Sex
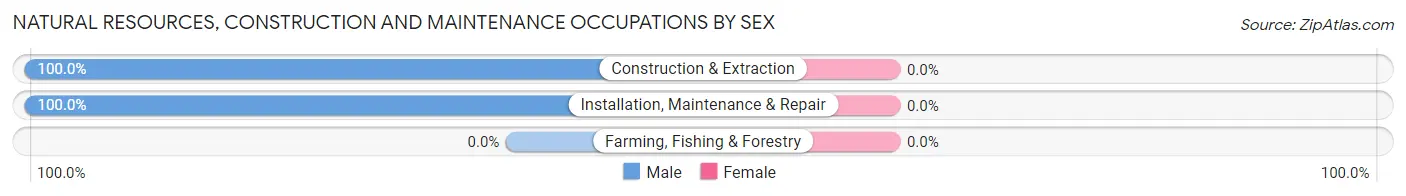
| Occupation | Male | Female |
| Farming, Fishing & Forestry | 0 (0.0%) | 0 (0.0%) |
| Construction & Extraction | 169 (100.0%) | 0 (0.0%) |
| Installation, Maintenance & Repair | 31 (100.0%) | 0 (0.0%) |
| Total (Category) | 200 (100.0%) | 0 (0.0%) |
| Total (Overall) | 1,209 (59.4%) | 828 (40.6%) |
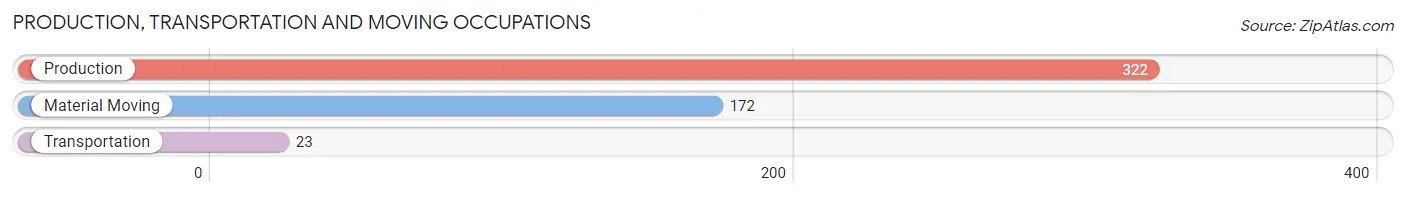
Production, Transportation and Moving Occupations
The most common Production, Transportation and Moving occupations in Elkin are Production (322 | 15.8%), Material Moving (172 | 8.4%), and Transportation (23 | 1.1%).
Production, Transportation and Moving Occupations by Sex
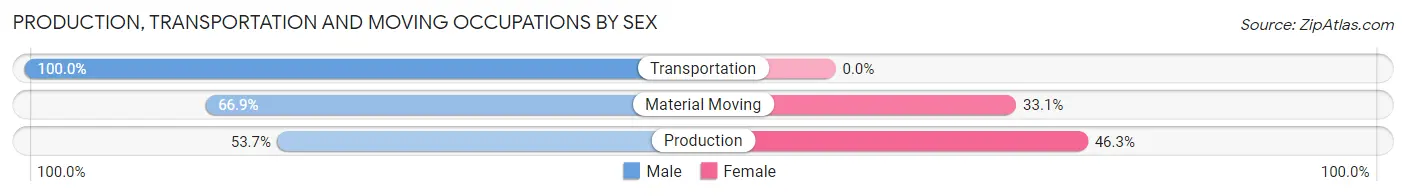
| Occupation | Male | Female |
| Production | 173 (53.7%) | 149 (46.3%) |
| Transportation | 23 (100.0%) | 0 (0.0%) |
| Material Moving | 115 (66.9%) | 57 (33.1%) |
| Total (Category) | 311 (60.2%) | 206 (39.9%) |
| Total (Overall) | 1,209 (59.4%) | 828 (40.6%) |
Employment Industries by Sex in Elkin
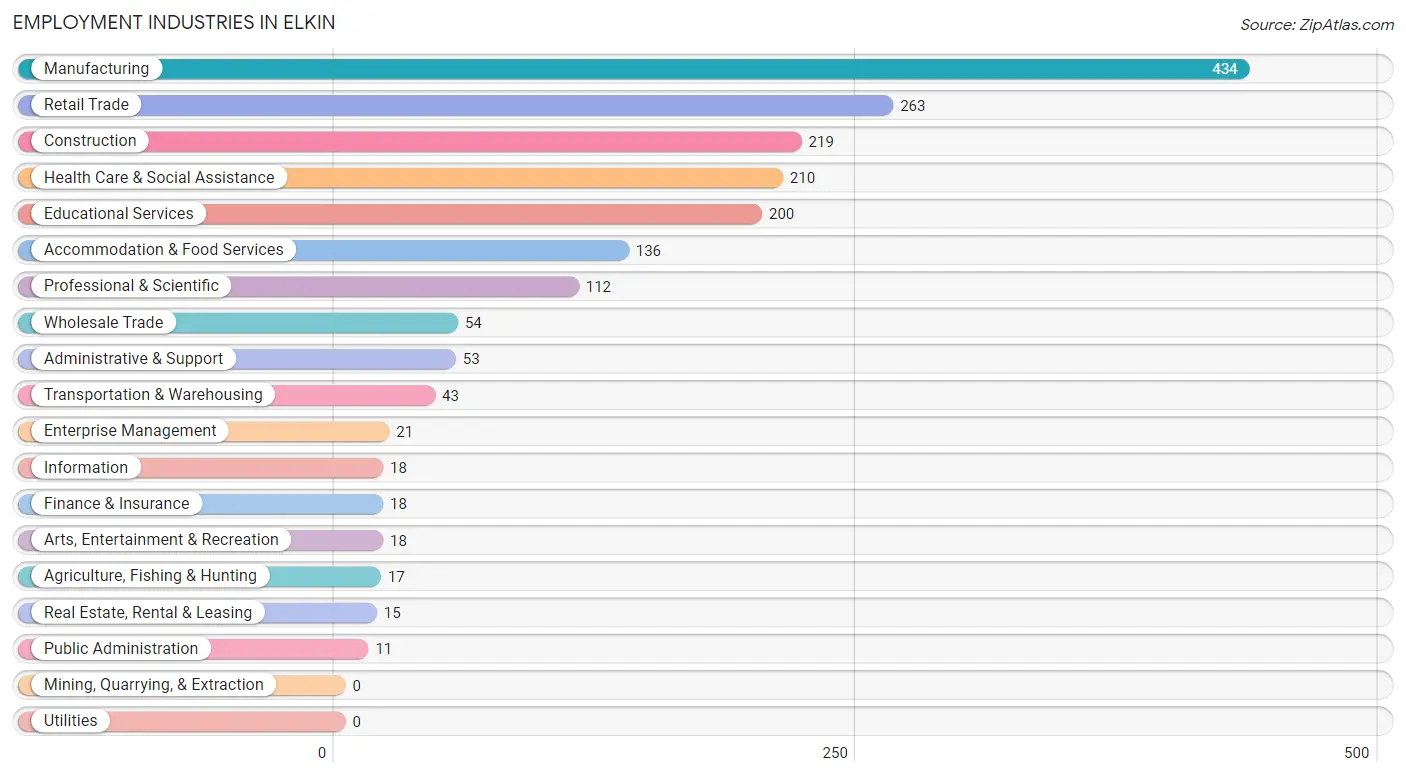
Employment Industries in Elkin
The major employment industries in Elkin include Manufacturing (434 | 21.3%), Retail Trade (263 | 12.9%), Construction (219 | 10.7%), Health Care & Social Assistance (210 | 10.3%), and Educational Services (200 | 9.8%).
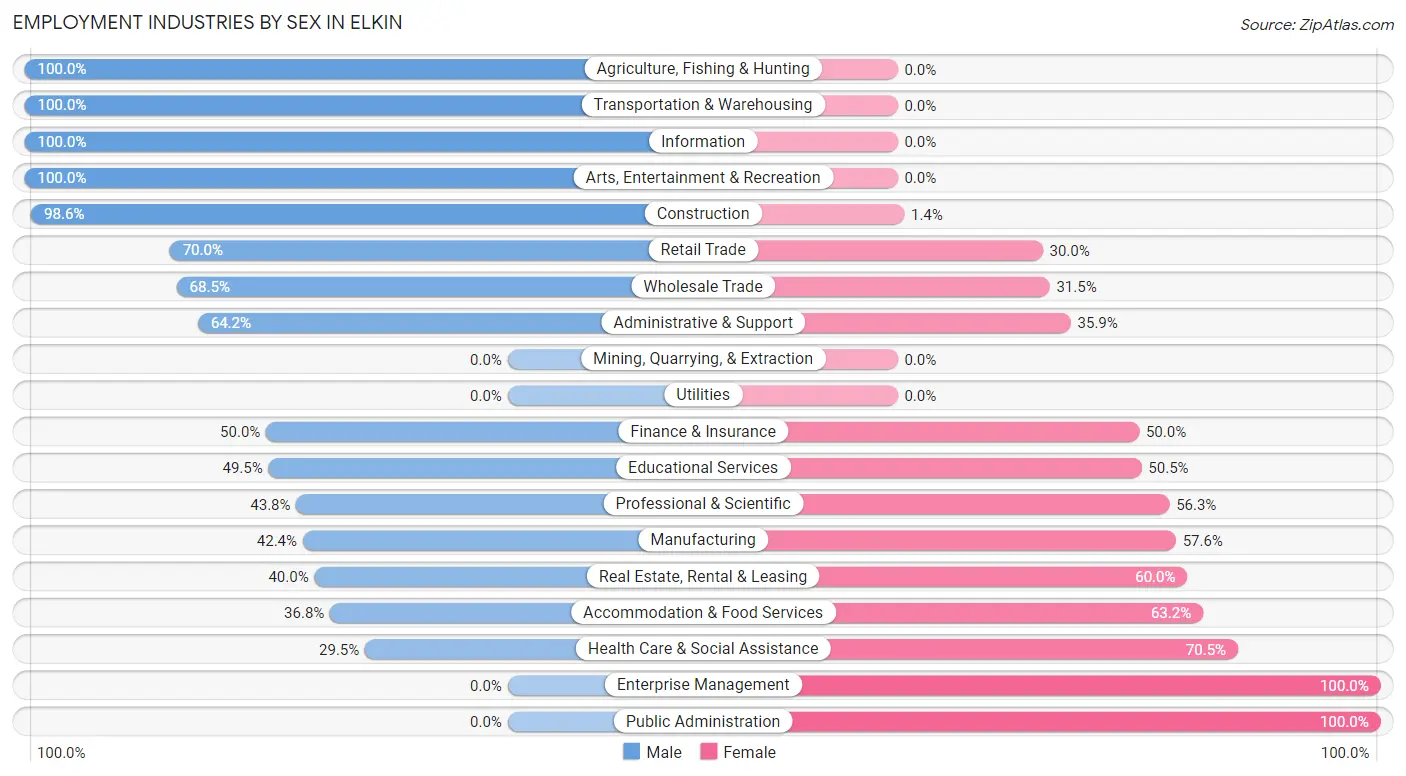
Employment Industries by Sex in Elkin
The Elkin industries that see more men than women are Agriculture, Fishing & Hunting (100.0%), Transportation & Warehousing (100.0%), and Information (100.0%), whereas the industries that tend to have a higher number of women are Enterprise Management (100.0%), Public Administration (100.0%), and Health Care & Social Assistance (70.5%).
| Industry | Male | Female |
| Agriculture, Fishing & Hunting | 17 (100.0%) | 0 (0.0%) |
| Mining, Quarrying, & Extraction | 0 (0.0%) | 0 (0.0%) |
| Construction | 216 (98.6%) | 3 (1.4%) |
| Manufacturing | 184 (42.4%) | 250 (57.6%) |
| Wholesale Trade | 37 (68.5%) | 17 (31.5%) |
| Retail Trade | 184 (70.0%) | 79 (30.0%) |
| Transportation & Warehousing | 43 (100.0%) | 0 (0.0%) |
| Utilities | 0 (0.0%) | 0 (0.0%) |
| Information | 18 (100.0%) | 0 (0.0%) |
| Finance & Insurance | 9 (50.0%) | 9 (50.0%) |
| Real Estate, Rental & Leasing | 6 (40.0%) | 9 (60.0%) |
| Professional & Scientific | 49 (43.8%) | 63 (56.2%) |
| Enterprise Management | 0 (0.0%) | 21 (100.0%) |
| Administrative & Support | 34 (64.1%) | 19 (35.8%) |
| Educational Services | 99 (49.5%) | 101 (50.5%) |
| Health Care & Social Assistance | 62 (29.5%) | 148 (70.5%) |
| Arts, Entertainment & Recreation | 18 (100.0%) | 0 (0.0%) |
| Accommodation & Food Services | 50 (36.8%) | 86 (63.2%) |
| Public Administration | 0 (0.0%) | 11 (100.0%) |
| Total | 1,209 (59.4%) | 828 (40.6%) |
Education in Elkin
School Enrollment in Elkin
The most common levels of schooling among the 787 students in Elkin are high school (245 | 31.1%), middle school (232 | 29.5%), and elementary school (224 | 28.5%).
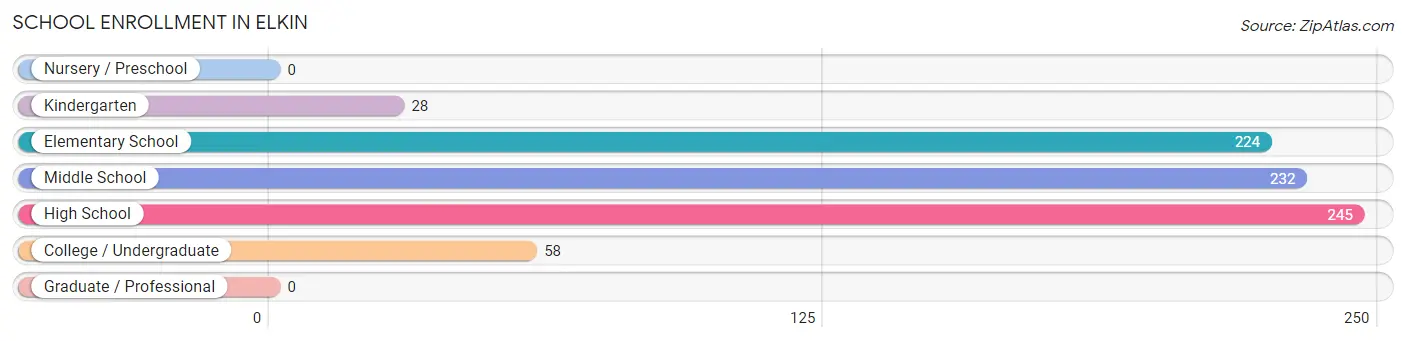
| School Level | # Students | % Students |
| Nursery / Preschool | 0 | 0.0% |
| Kindergarten | 28 | 3.6% |
| Elementary School | 224 | 28.5% |
| Middle School | 232 | 29.5% |
| High School | 245 | 31.1% |
| College / Undergraduate | 58 | 7.4% |
| Graduate / Professional | 0 | 0.0% |
| Total | 787 | 100.0% |
School Enrollment by Age by Funding Source in Elkin
Out of a total of 787 students who are enrolled in schools in Elkin, 76 (9.7%) attend a private institution, while the remaining 711 (90.3%) are enrolled in public schools. The age group of 35 years and over has the highest likelihood of being enrolled in private schools, with 4 (100.0% in the age bracket) enrolled. Conversely, the age group of 5 to 9 year old has the lowest likelihood of being enrolled in a private school, with 183 (100.0% in the age bracket) attending a public institution.
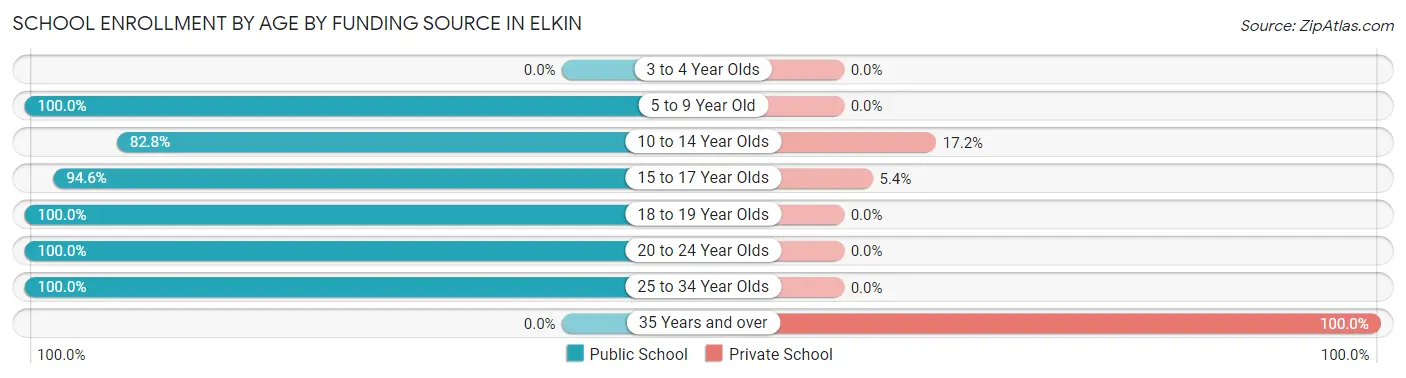
| Age Bracket | Public School | Private School |
| 3 to 4 Year Olds | 0 (0.0%) | 0 (0.0%) |
| 5 to 9 Year Old | 183 (100.0%) | 0 (0.0%) |
| 10 to 14 Year Olds | 294 (82.8%) | 61 (17.2%) |
| 15 to 17 Year Olds | 194 (94.6%) | 11 (5.4%) |
| 18 to 19 Year Olds | 15 (100.0%) | 0 (0.0%) |
| 20 to 24 Year Olds | 15 (100.0%) | 0 (0.0%) |
| 25 to 34 Year Olds | 10 (100.0%) | 0 (0.0%) |
| 35 Years and over | 0 (0.0%) | 4 (100.0%) |
| Total | 711 (90.3%) | 76 (9.7%) |
Educational Attainment by Field of Study in Elkin
Education (103 | 14.2%), business (91 | 12.6%), arts & humanities (71 | 9.8%), science & technology (70 | 9.7%), and computers & mathematics (59 | 8.2%) are the most common fields of study among 723 individuals in Elkin who have obtained a bachelor's degree or higher.
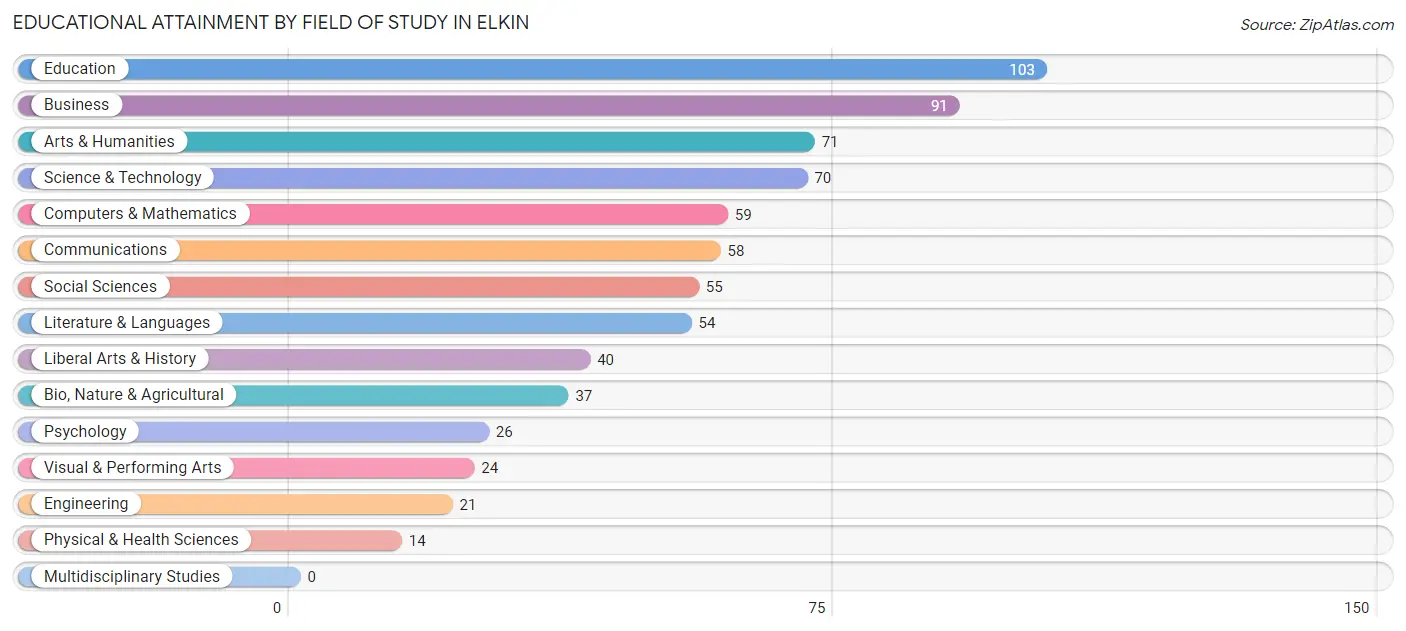
| Field of Study | # Graduates | % Graduates |
| Computers & Mathematics | 59 | 8.2% |
| Bio, Nature & Agricultural | 37 | 5.1% |
| Physical & Health Sciences | 14 | 1.9% |
| Psychology | 26 | 3.6% |
| Social Sciences | 55 | 7.6% |
| Engineering | 21 | 2.9% |
| Multidisciplinary Studies | 0 | 0.0% |
| Science & Technology | 70 | 9.7% |
| Business | 91 | 12.6% |
| Education | 103 | 14.2% |
| Literature & Languages | 54 | 7.5% |
| Liberal Arts & History | 40 | 5.5% |
| Visual & Performing Arts | 24 | 3.3% |
| Communications | 58 | 8.0% |
| Arts & Humanities | 71 | 9.8% |
| Total | 723 | 100.0% |
Transportation & Commute in Elkin
Vehicle Availability by Sex in Elkin
The most prevalent vehicle ownership categories in Elkin are males with 2 vehicles (605, accounting for 50.1%) and females with 2 vehicles (433, making up 76.1%).
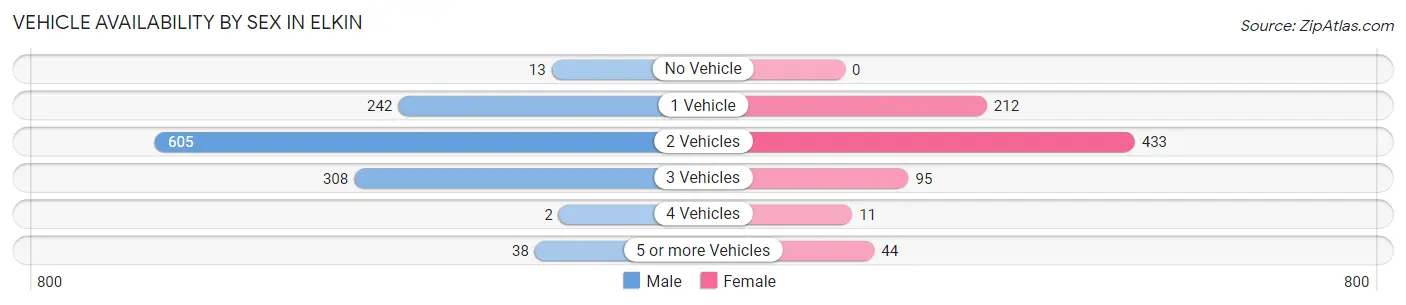
| Vehicles Available | Male | Female |
| No Vehicle | 13 (1.1%) | 0 (0.0%) |
| 1 Vehicle | 242 (20.0%) | 212 (26.7%) |
| 2 Vehicles | 605 (50.1%) | 433 (54.5%) |
| 3 Vehicles | 308 (25.5%) | 95 (11.9%) |
| 4 Vehicles | 2 (0.2%) | 11 (1.4%) |
| 5 or more Vehicles | 38 (3.2%) | 44 (5.5%) |
| Total | 1,208 (100.0%) | 795 (100.0%) |
Commute Time in Elkin
The most frequently occuring commute durations in Elkin are 10 to 14 minutes (467 commuters, 25.3%), 5 to 9 minutes (409 commuters, 22.2%), and 15 to 19 minutes (156 commuters, 8.5%).
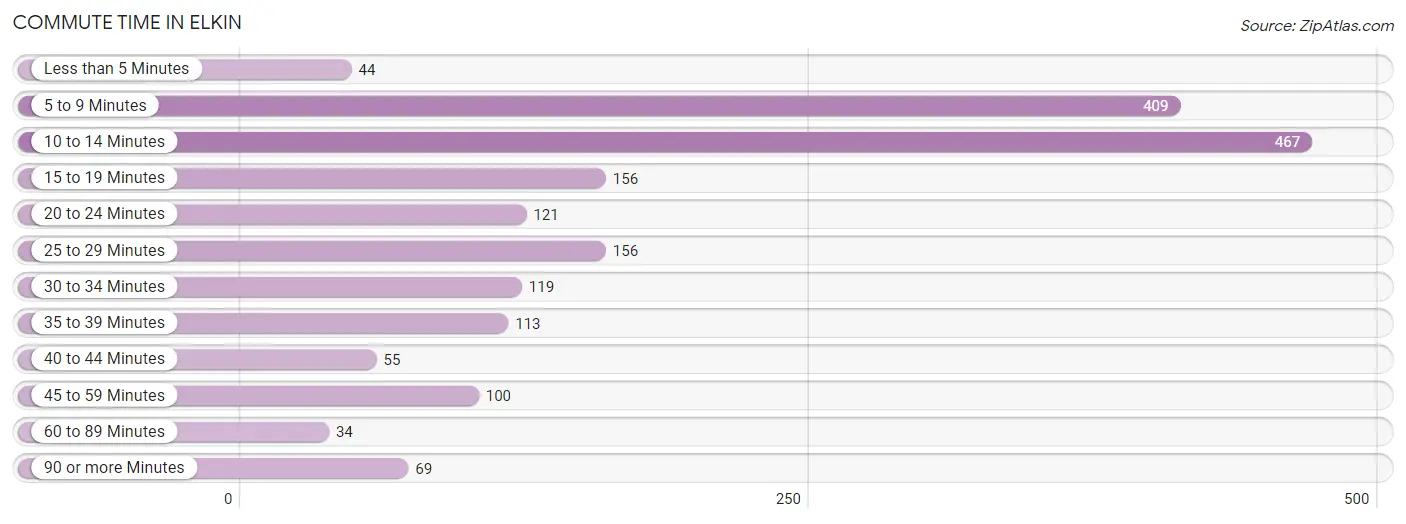
| Commute Time | # Commuters | % Commuters |
| Less than 5 Minutes | 44 | 2.4% |
| 5 to 9 Minutes | 409 | 22.2% |
| 10 to 14 Minutes | 467 | 25.3% |
| 15 to 19 Minutes | 156 | 8.5% |
| 20 to 24 Minutes | 121 | 6.6% |
| 25 to 29 Minutes | 156 | 8.5% |
| 30 to 34 Minutes | 119 | 6.5% |
| 35 to 39 Minutes | 113 | 6.1% |
| 40 to 44 Minutes | 55 | 3.0% |
| 45 to 59 Minutes | 100 | 5.4% |
| 60 to 89 Minutes | 34 | 1.8% |
| 90 or more Minutes | 69 | 3.7% |
Commute Time by Sex in Elkin
The most common commute times in Elkin are 10 to 14 minutes (307 commuters, 27.8%) for males and 5 to 9 minutes (226 commuters, 30.6%) for females.
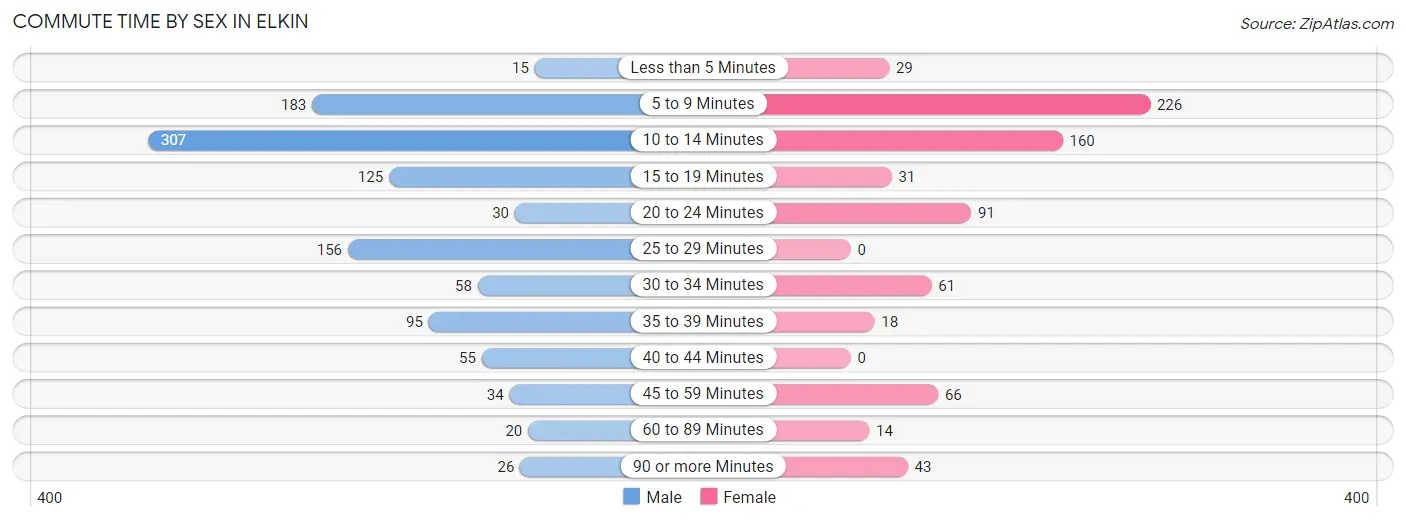
| Commute Time | Male | Female |
| Less than 5 Minutes | 15 (1.4%) | 29 (3.9%) |
| 5 to 9 Minutes | 183 (16.6%) | 226 (30.6%) |
| 10 to 14 Minutes | 307 (27.8%) | 160 (21.6%) |
| 15 to 19 Minutes | 125 (11.3%) | 31 (4.2%) |
| 20 to 24 Minutes | 30 (2.7%) | 91 (12.3%) |
| 25 to 29 Minutes | 156 (14.1%) | 0 (0.0%) |
| 30 to 34 Minutes | 58 (5.2%) | 61 (8.3%) |
| 35 to 39 Minutes | 95 (8.6%) | 18 (2.4%) |
| 40 to 44 Minutes | 55 (5.0%) | 0 (0.0%) |
| 45 to 59 Minutes | 34 (3.1%) | 66 (8.9%) |
| 60 to 89 Minutes | 20 (1.8%) | 14 (1.9%) |
| 90 or more Minutes | 26 (2.4%) | 43 (5.8%) |
Time of Departure to Work by Sex in Elkin
The most frequent times of departure to work in Elkin are 12:00 PM to 3:59 PM (274, 24.8%) for males and 9:00 AM to 9:59 AM (141, 19.1%) for females.
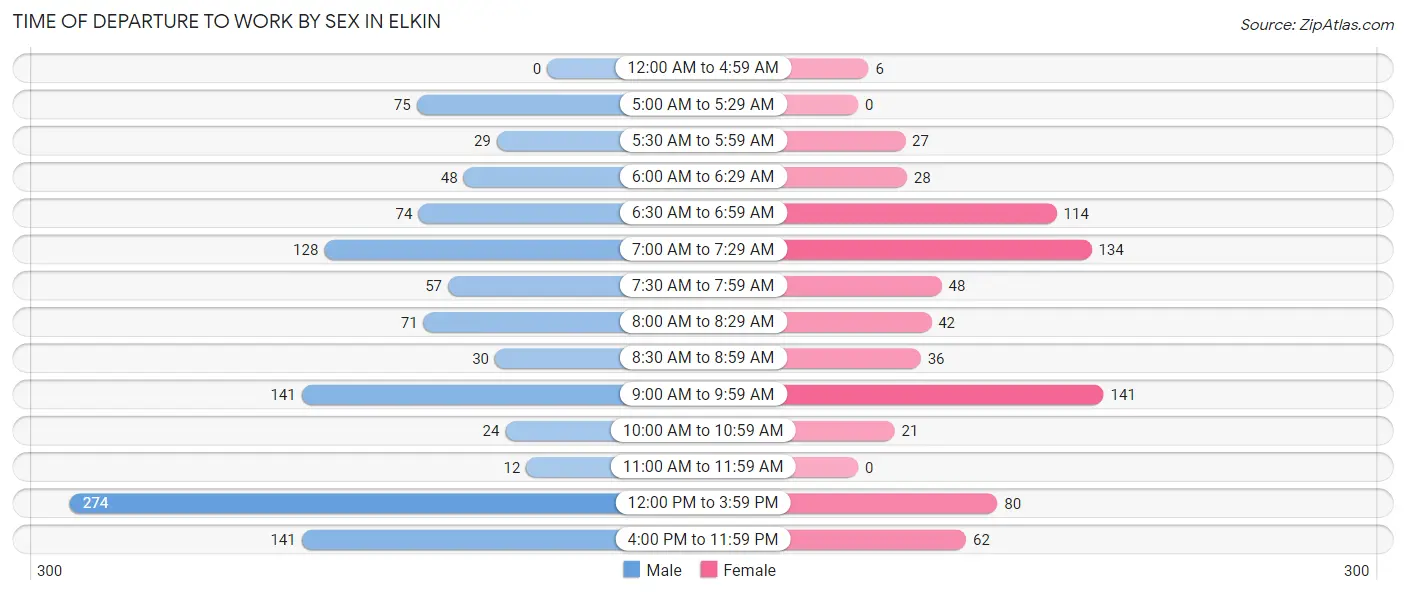
| Time of Departure | Male | Female |
| 12:00 AM to 4:59 AM | 0 (0.0%) | 6 (0.8%) |
| 5:00 AM to 5:29 AM | 75 (6.8%) | 0 (0.0%) |
| 5:30 AM to 5:59 AM | 29 (2.6%) | 27 (3.6%) |
| 6:00 AM to 6:29 AM | 48 (4.3%) | 28 (3.8%) |
| 6:30 AM to 6:59 AM | 74 (6.7%) | 114 (15.4%) |
| 7:00 AM to 7:29 AM | 128 (11.6%) | 134 (18.1%) |
| 7:30 AM to 7:59 AM | 57 (5.2%) | 48 (6.5%) |
| 8:00 AM to 8:29 AM | 71 (6.4%) | 42 (5.7%) |
| 8:30 AM to 8:59 AM | 30 (2.7%) | 36 (4.9%) |
| 9:00 AM to 9:59 AM | 141 (12.8%) | 141 (19.1%) |
| 10:00 AM to 10:59 AM | 24 (2.2%) | 21 (2.8%) |
| 11:00 AM to 11:59 AM | 12 (1.1%) | 0 (0.0%) |
| 12:00 PM to 3:59 PM | 274 (24.8%) | 80 (10.8%) |
| 4:00 PM to 11:59 PM | 141 (12.8%) | 62 (8.4%) |
| Total | 1,104 (100.0%) | 739 (100.0%) |
Housing Occupancy in Elkin
Occupancy by Ownership in Elkin
Of the total 1,663 dwellings in Elkin, owner-occupied units account for 1,041 (62.6%), while renter-occupied units make up 622 (37.4%).
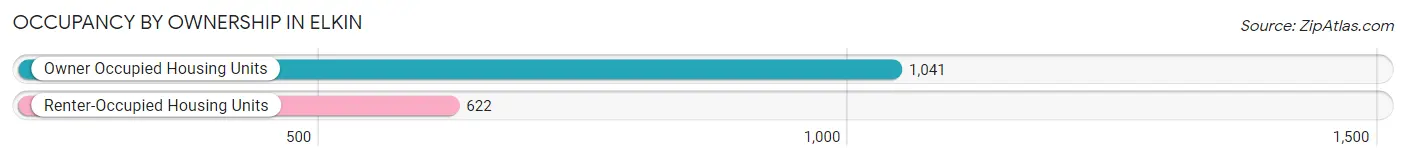
| Occupancy | # Housing Units | % Housing Units |
| Owner Occupied Housing Units | 1,041 | 62.6% |
| Renter-Occupied Housing Units | 622 | 37.4% |
| Total Occupied Housing Units | 1,663 | 100.0% |
Occupancy by Household Size in Elkin
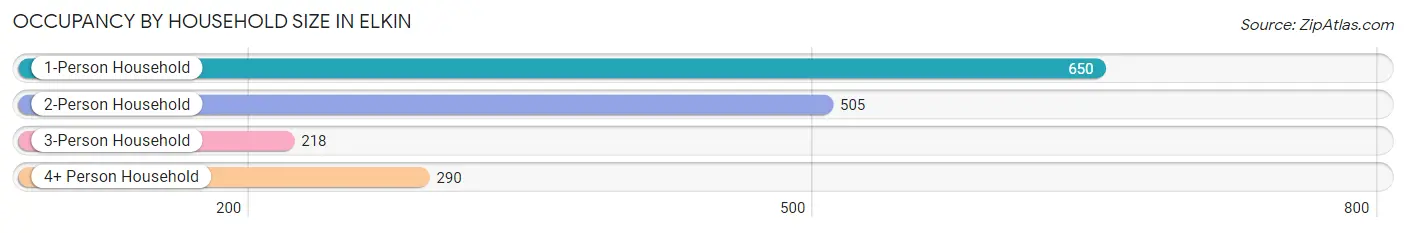
| Household Size | # Housing Units | % Housing Units |
| 1-Person Household | 650 | 39.1% |
| 2-Person Household | 505 | 30.4% |
| 3-Person Household | 218 | 13.1% |
| 4+ Person Household | 290 | 17.4% |
| Total Housing Units | 1,663 | 100.0% |
Occupancy by Ownership by Household Size in Elkin
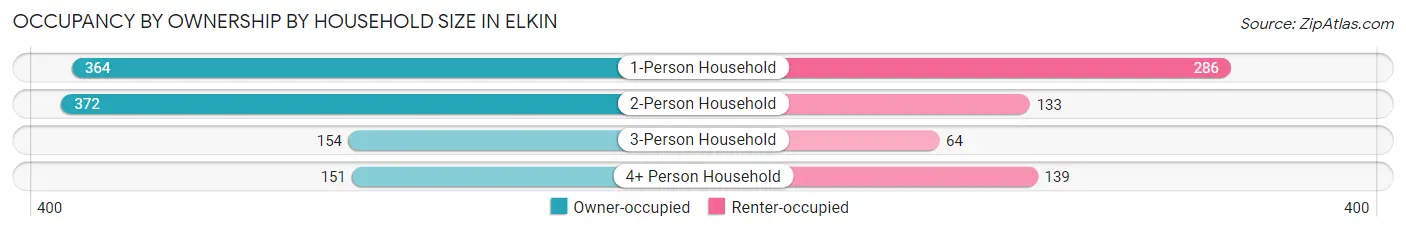
| Household Size | Owner-occupied | Renter-occupied |
| 1-Person Household | 364 (56.0%) | 286 (44.0%) |
| 2-Person Household | 372 (73.7%) | 133 (26.3%) |
| 3-Person Household | 154 (70.6%) | 64 (29.4%) |
| 4+ Person Household | 151 (52.1%) | 139 (47.9%) |
| Total Housing Units | 1,041 (62.6%) | 622 (37.4%) |
Occupancy by Educational Attainment in Elkin
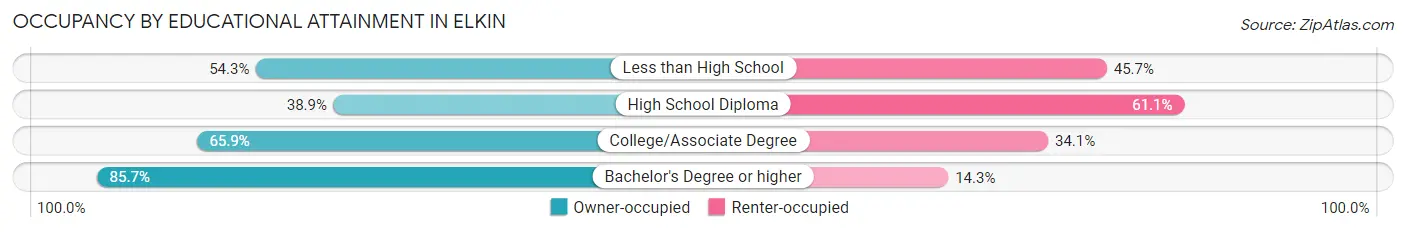
| Household Size | Owner-occupied | Renter-occupied |
| Less than High School | 127 (54.3%) | 107 (45.7%) |
| High School Diploma | 156 (38.9%) | 245 (61.1%) |
| College/Associate Degree | 410 (65.9%) | 212 (34.1%) |
| Bachelor's Degree or higher | 348 (85.7%) | 58 (14.3%) |
Occupancy by Age of Householder in Elkin
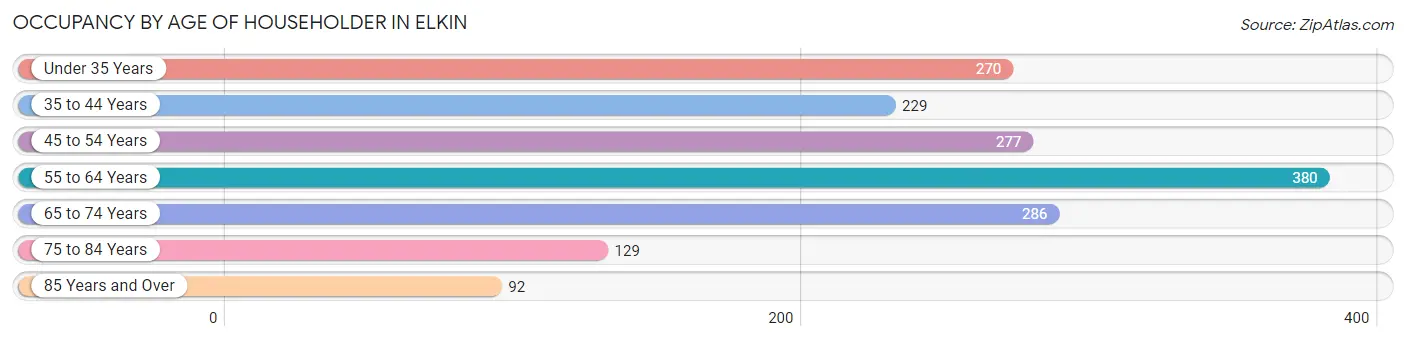
| Age Bracket | # Households | % Households |
| Under 35 Years | 270 | 16.2% |
| 35 to 44 Years | 229 | 13.8% |
| 45 to 54 Years | 277 | 16.7% |
| 55 to 64 Years | 380 | 22.9% |
| 65 to 74 Years | 286 | 17.2% |
| 75 to 84 Years | 129 | 7.8% |
| 85 Years and Over | 92 | 5.5% |
| Total | 1,663 | 100.0% |
Housing Finances in Elkin
Median Income by Occupancy in Elkin
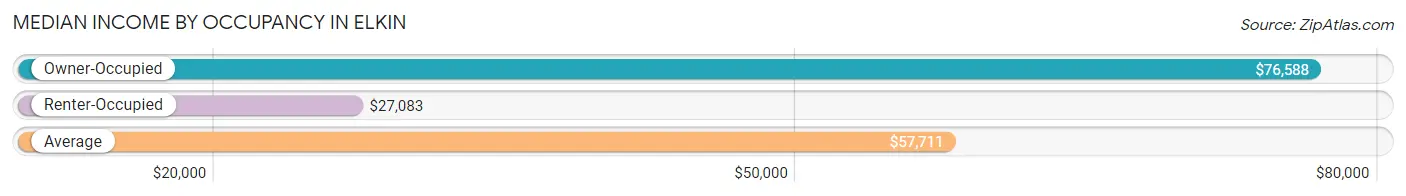
| Occupancy Type | # Households | Median Income |
| Owner-Occupied | 1,041 (62.6%) | $76,588 |
| Renter-Occupied | 622 (37.4%) | $27,083 |
| Average | 1,663 (100.0%) | $57,711 |
Occupancy by Householder Income Bracket in Elkin
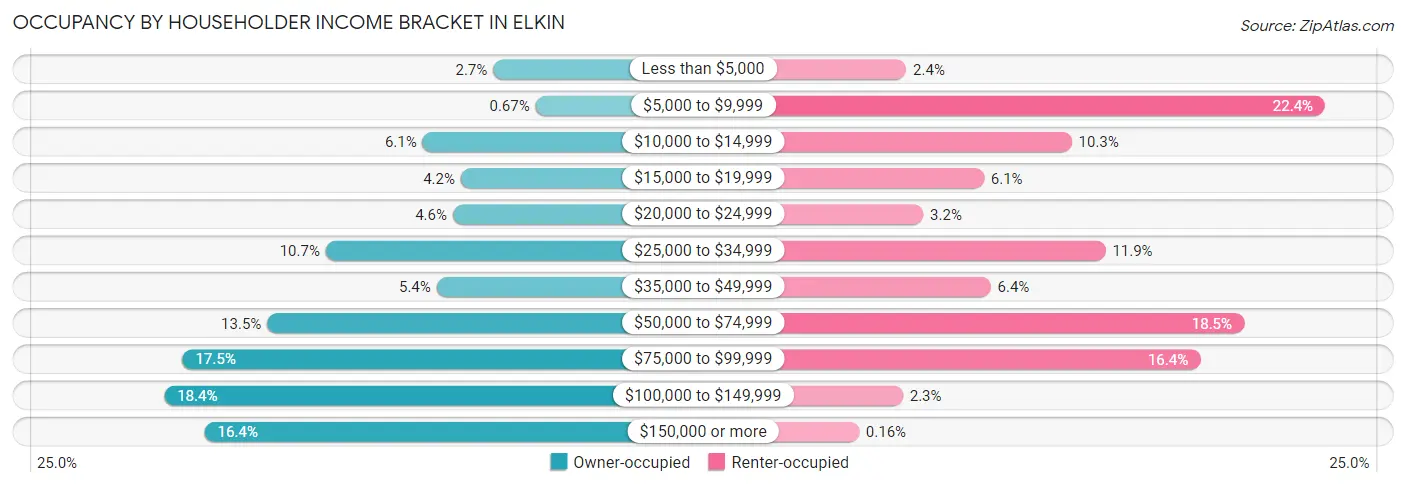
| Income Bracket | Owner-occupied | Renter-occupied |
| Less than $5,000 | 28 (2.7%) | 15 (2.4%) |
| $5,000 to $9,999 | 7 (0.7%) | 139 (22.4%) |
| $10,000 to $14,999 | 63 (6.0%) | 64 (10.3%) |
| $15,000 to $19,999 | 44 (4.2%) | 38 (6.1%) |
| $20,000 to $24,999 | 48 (4.6%) | 20 (3.2%) |
| $25,000 to $34,999 | 111 (10.7%) | 74 (11.9%) |
| $35,000 to $49,999 | 56 (5.4%) | 40 (6.4%) |
| $50,000 to $74,999 | 140 (13.5%) | 115 (18.5%) |
| $75,000 to $99,999 | 182 (17.5%) | 102 (16.4%) |
| $100,000 to $149,999 | 191 (18.3%) | 14 (2.2%) |
| $150,000 or more | 171 (16.4%) | 1 (0.2%) |
| Total | 1,041 (100.0%) | 622 (100.0%) |
Monthly Housing Cost Tiers in Elkin
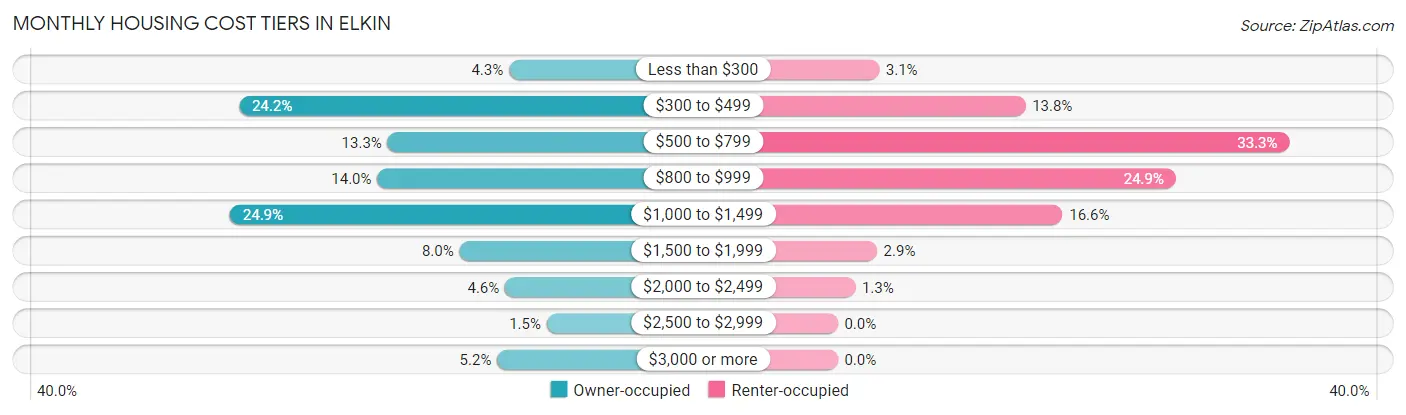
| Monthly Cost | Owner-occupied | Renter-occupied |
| Less than $300 | 45 (4.3%) | 19 (3.0%) |
| $300 to $499 | 252 (24.2%) | 86 (13.8%) |
| $500 to $799 | 138 (13.3%) | 207 (33.3%) |
| $800 to $999 | 146 (14.0%) | 155 (24.9%) |
| $1,000 to $1,499 | 259 (24.9%) | 103 (16.6%) |
| $1,500 to $1,999 | 83 (8.0%) | 18 (2.9%) |
| $2,000 to $2,499 | 48 (4.6%) | 8 (1.3%) |
| $2,500 to $2,999 | 16 (1.5%) | 0 (0.0%) |
| $3,000 or more | 54 (5.2%) | 0 (0.0%) |
| Total | 1,041 (100.0%) | 622 (100.0%) |
Physical Housing Characteristics in Elkin
Housing Structures in Elkin
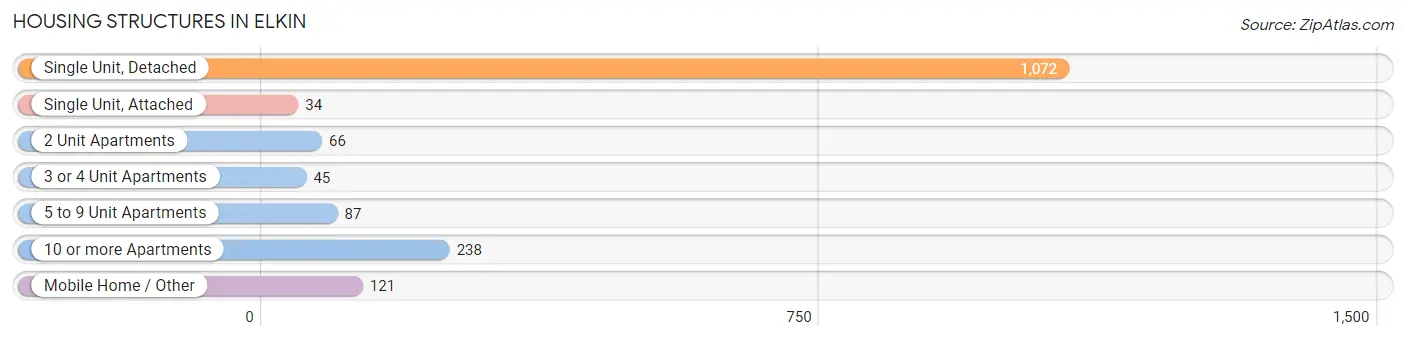
| Structure Type | # Housing Units | % Housing Units |
| Single Unit, Detached | 1,072 | 64.5% |
| Single Unit, Attached | 34 | 2.0% |
| 2 Unit Apartments | 66 | 4.0% |
| 3 or 4 Unit Apartments | 45 | 2.7% |
| 5 to 9 Unit Apartments | 87 | 5.2% |
| 10 or more Apartments | 238 | 14.3% |
| Mobile Home / Other | 121 | 7.3% |
| Total | 1,663 | 100.0% |
Housing Structures by Occupancy in Elkin
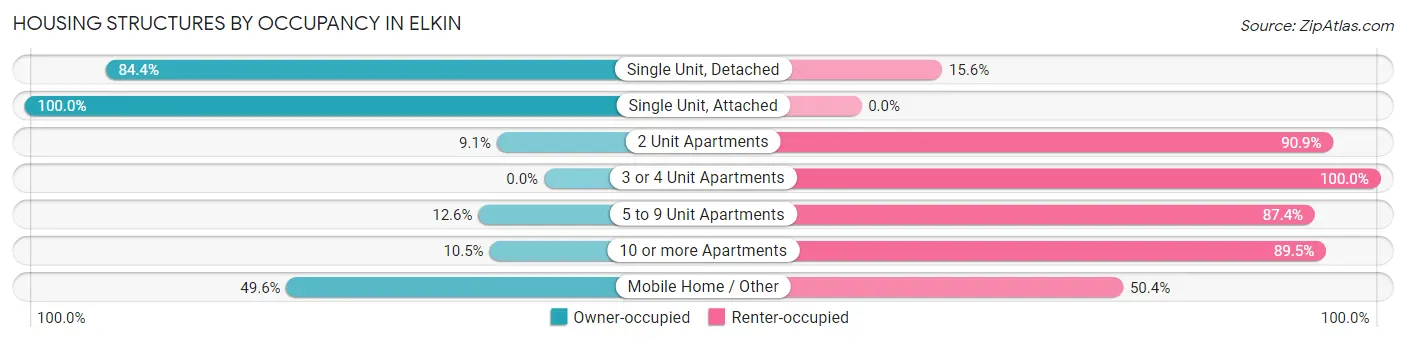
| Structure Type | Owner-occupied | Renter-occupied |
| Single Unit, Detached | 905 (84.4%) | 167 (15.6%) |
| Single Unit, Attached | 34 (100.0%) | 0 (0.0%) |
| 2 Unit Apartments | 6 (9.1%) | 60 (90.9%) |
| 3 or 4 Unit Apartments | 0 (0.0%) | 45 (100.0%) |
| 5 to 9 Unit Apartments | 11 (12.6%) | 76 (87.4%) |
| 10 or more Apartments | 25 (10.5%) | 213 (89.5%) |
| Mobile Home / Other | 60 (49.6%) | 61 (50.4%) |
| Total | 1,041 (62.6%) | 622 (37.4%) |
Housing Structures by Number of Rooms in Elkin
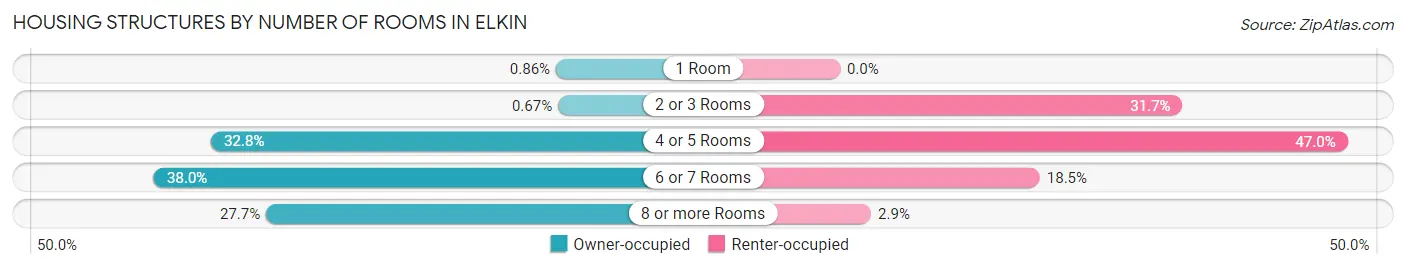
| Number of Rooms | Owner-occupied | Renter-occupied |
| 1 Room | 9 (0.9%) | 0 (0.0%) |
| 2 or 3 Rooms | 7 (0.7%) | 197 (31.7%) |
| 4 or 5 Rooms | 341 (32.8%) | 292 (46.9%) |
| 6 or 7 Rooms | 396 (38.0%) | 115 (18.5%) |
| 8 or more Rooms | 288 (27.7%) | 18 (2.9%) |
| Total | 1,041 (100.0%) | 622 (100.0%) |
Housing Structure by Heating Type in Elkin
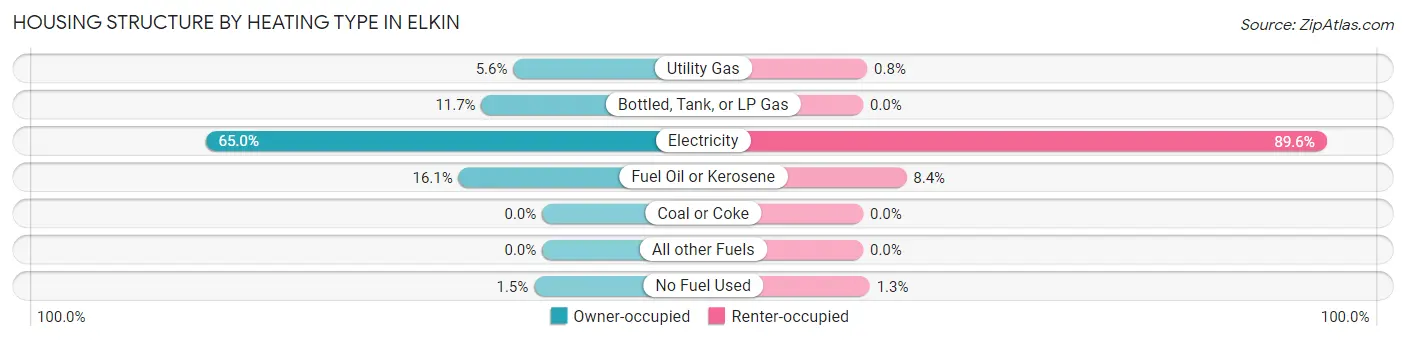
| Heating Type | Owner-occupied | Renter-occupied |
| Utility Gas | 58 (5.6%) | 5 (0.8%) |
| Bottled, Tank, or LP Gas | 122 (11.7%) | 0 (0.0%) |
| Electricity | 677 (65.0%) | 557 (89.5%) |
| Fuel Oil or Kerosene | 168 (16.1%) | 52 (8.4%) |
| Coal or Coke | 0 (0.0%) | 0 (0.0%) |
| All other Fuels | 0 (0.0%) | 0 (0.0%) |
| No Fuel Used | 16 (1.5%) | 8 (1.3%) |
| Total | 1,041 (100.0%) | 622 (100.0%) |
Household Vehicle Usage in Elkin
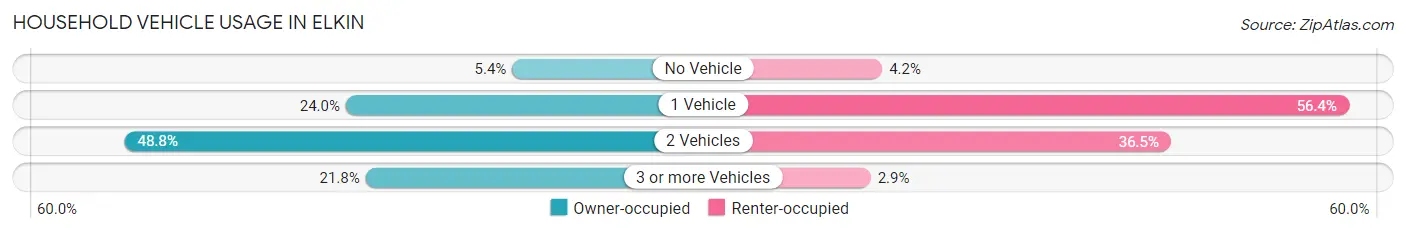
| Vehicles per Household | Owner-occupied | Renter-occupied |
| No Vehicle | 56 (5.4%) | 26 (4.2%) |
| 1 Vehicle | 250 (24.0%) | 351 (56.4%) |
| 2 Vehicles | 508 (48.8%) | 227 (36.5%) |
| 3 or more Vehicles | 227 (21.8%) | 18 (2.9%) |
| Total | 1,041 (100.0%) | 622 (100.0%) |
Real Estate & Mortgages in Elkin
Real Estate and Mortgage Overview in Elkin
| Characteristic | Without Mortgage | With Mortgage |
| Housing Units | 462 | 579 |
| Median Property Value | $141,300 | $204,300 |
| Median Household Income | $35,729 | $116 |
| Monthly Housing Costs | $447 | $9 |
| Real Estate Taxes | $1,335 | $0 |
Property Value by Mortgage Status in Elkin
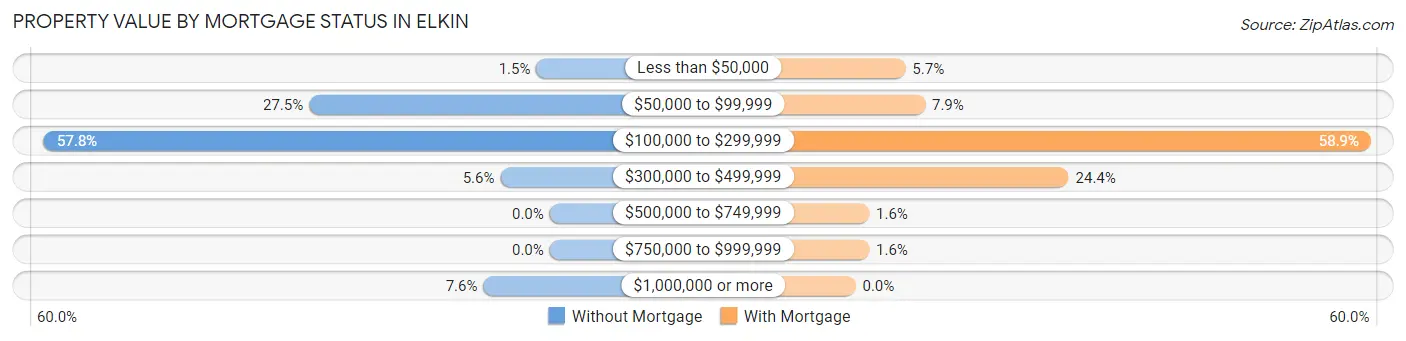
| Property Value | Without Mortgage | With Mortgage |
| Less than $50,000 | 7 (1.5%) | 33 (5.7%) |
| $50,000 to $99,999 | 127 (27.5%) | 46 (7.9%) |
| $100,000 to $299,999 | 267 (57.8%) | 341 (58.9%) |
| $300,000 to $499,999 | 26 (5.6%) | 141 (24.3%) |
| $500,000 to $749,999 | 0 (0.0%) | 9 (1.5%) |
| $750,000 to $999,999 | 0 (0.0%) | 9 (1.5%) |
| $1,000,000 or more | 35 (7.6%) | 0 (0.0%) |
| Total | 462 (100.0%) | 579 (100.0%) |
Household Income by Mortgage Status in Elkin
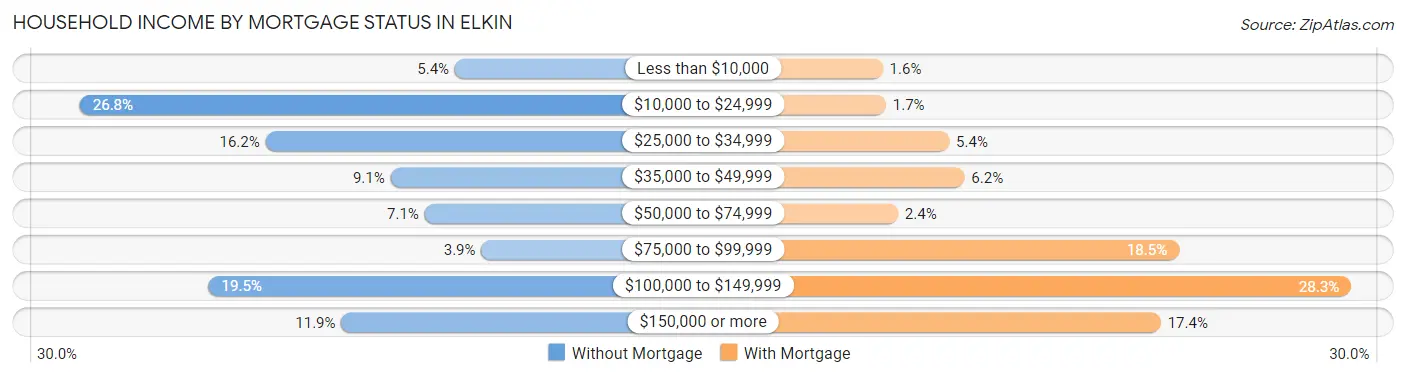
| Household Income | Without Mortgage | With Mortgage |
| Less than $10,000 | 25 (5.4%) | 9 (1.5%) |
| $10,000 to $24,999 | 124 (26.8%) | 10 (1.7%) |
| $25,000 to $34,999 | 75 (16.2%) | 31 (5.3%) |
| $35,000 to $49,999 | 42 (9.1%) | 36 (6.2%) |
| $50,000 to $74,999 | 33 (7.1%) | 14 (2.4%) |
| $75,000 to $99,999 | 18 (3.9%) | 107 (18.5%) |
| $100,000 to $149,999 | 90 (19.5%) | 164 (28.3%) |
| $150,000 or more | 55 (11.9%) | 101 (17.4%) |
| Total | 462 (100.0%) | 579 (100.0%) |
Property Value to Household Income Ratio in Elkin
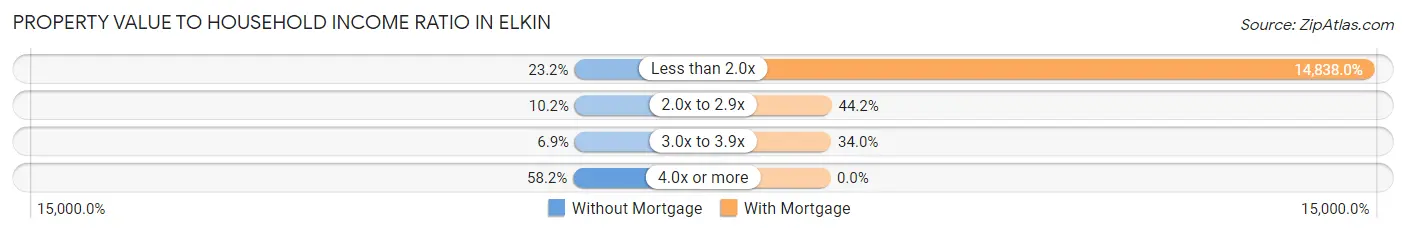
| Value-to-Income Ratio | Without Mortgage | With Mortgage |
| Less than 2.0x | 107 (23.2%) | 85,912 (14,838.0%) |
| 2.0x to 2.9x | 47 (10.2%) | 256 (44.2%) |
| 3.0x to 3.9x | 32 (6.9%) | 197 (34.0%) |
| 4.0x or more | 269 (58.2%) | 0 (0.0%) |
| Total | 462 (100.0%) | 579 (100.0%) |
Real Estate Taxes by Mortgage Status in Elkin
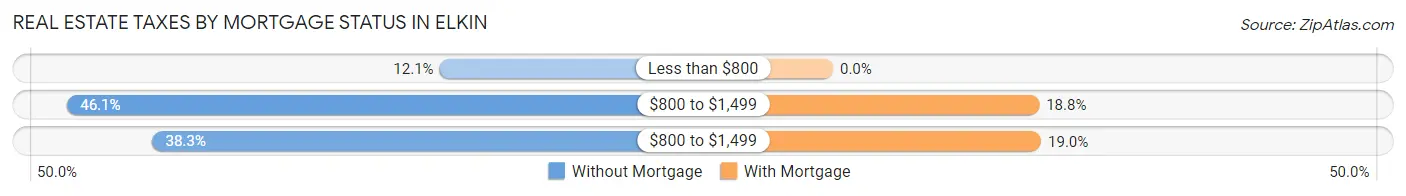
| Property Taxes | Without Mortgage | With Mortgage |
| Less than $800 | 56 (12.1%) | 0 (0.0%) |
| $800 to $1,499 | 213 (46.1%) | 109 (18.8%) |
| $800 to $1,499 | 177 (38.3%) | 110 (19.0%) |
| Total | 462 (100.0%) | 579 (100.0%) |
Health & Disability in Elkin
Health Insurance Coverage by Age in Elkin
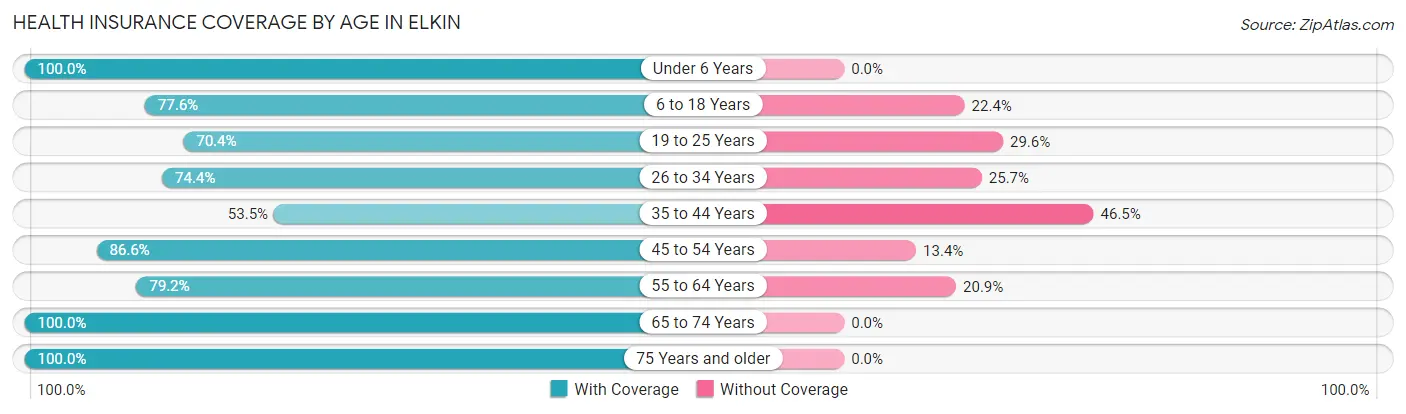
| Age Bracket | With Coverage | Without Coverage |
| Under 6 Years | 160 (100.0%) | 0 (0.0%) |
| 6 to 18 Years | 591 (77.6%) | 171 (22.4%) |
| 19 to 25 Years | 283 (70.4%) | 119 (29.6%) |
| 26 to 34 Years | 229 (74.4%) | 79 (25.7%) |
| 35 to 44 Years | 297 (53.5%) | 258 (46.5%) |
| 45 to 54 Years | 362 (86.6%) | 56 (13.4%) |
| 55 to 64 Years | 429 (79.1%) | 113 (20.8%) |
| 65 to 74 Years | 397 (100.0%) | 0 (0.0%) |
| 75 Years and older | 279 (100.0%) | 0 (0.0%) |
| Total | 3,027 (79.2%) | 796 (20.8%) |
Health Insurance Coverage by Citizenship Status in Elkin
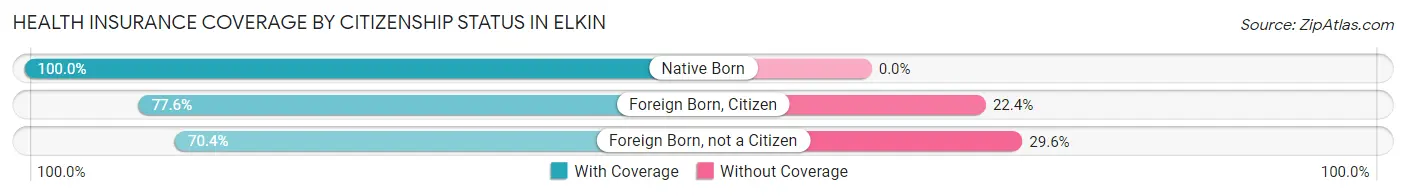
| Citizenship Status | With Coverage | Without Coverage |
| Native Born | 160 (100.0%) | 0 (0.0%) |
| Foreign Born, Citizen | 591 (77.6%) | 171 (22.4%) |
| Foreign Born, not a Citizen | 283 (70.4%) | 119 (29.6%) |
Health Insurance Coverage by Household Income in Elkin
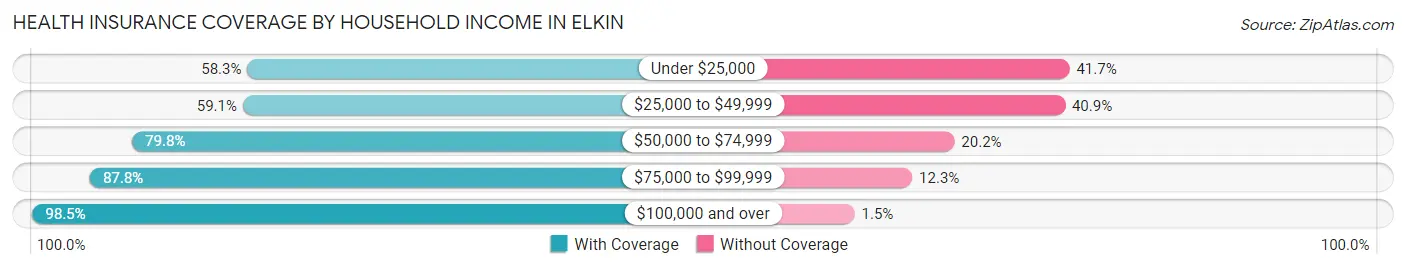
| Household Income | With Coverage | Without Coverage |
| Under $25,000 | 345 (58.3%) | 247 (41.7%) |
| $25,000 to $49,999 | 428 (59.1%) | 296 (40.9%) |
| $50,000 to $74,999 | 491 (79.8%) | 124 (20.2%) |
| $75,000 to $99,999 | 802 (87.7%) | 112 (12.2%) |
| $100,000 and over | 947 (98.5%) | 14 (1.5%) |
Public vs Private Health Insurance Coverage by Age in Elkin
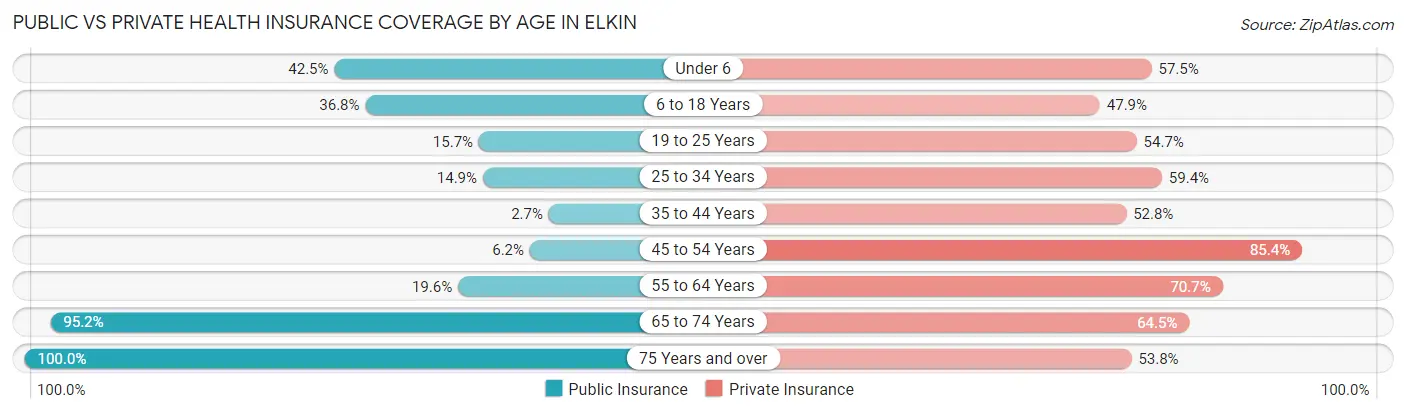
| Age Bracket | Public Insurance | Private Insurance |
| Under 6 | 68 (42.5%) | 92 (57.5%) |
| 6 to 18 Years | 280 (36.7%) | 365 (47.9%) |
| 19 to 25 Years | 63 (15.7%) | 220 (54.7%) |
| 25 to 34 Years | 46 (14.9%) | 183 (59.4%) |
| 35 to 44 Years | 15 (2.7%) | 293 (52.8%) |
| 45 to 54 Years | 26 (6.2%) | 357 (85.4%) |
| 55 to 64 Years | 106 (19.6%) | 383 (70.7%) |
| 65 to 74 Years | 378 (95.2%) | 256 (64.5%) |
| 75 Years and over | 279 (100.0%) | 150 (53.8%) |
| Total | 1,261 (33.0%) | 2,299 (60.1%) |
Disability Status by Sex by Age in Elkin
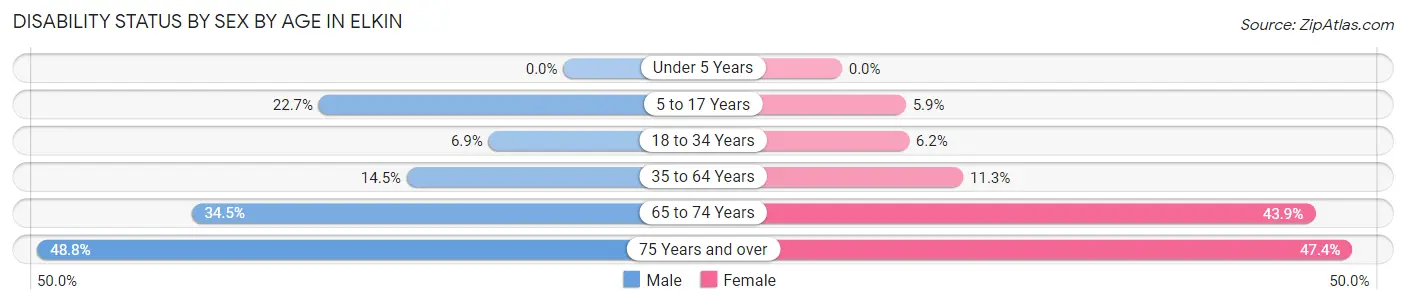
| Age Bracket | Male | Female |
| Under 5 Years | 0 (0.0%) | 0 (0.0%) |
| 5 to 17 Years | 86 (22.7%) | 23 (5.9%) |
| 18 to 34 Years | 29 (6.9%) | 20 (6.2%) |
| 35 to 64 Years | 122 (14.5%) | 76 (11.3%) |
| 65 to 74 Years | 49 (34.5%) | 112 (43.9%) |
| 75 Years and over | 62 (48.8%) | 72 (47.4%) |
Disability Class by Sex by Age in Elkin
Disability Class: Hearing Difficulty
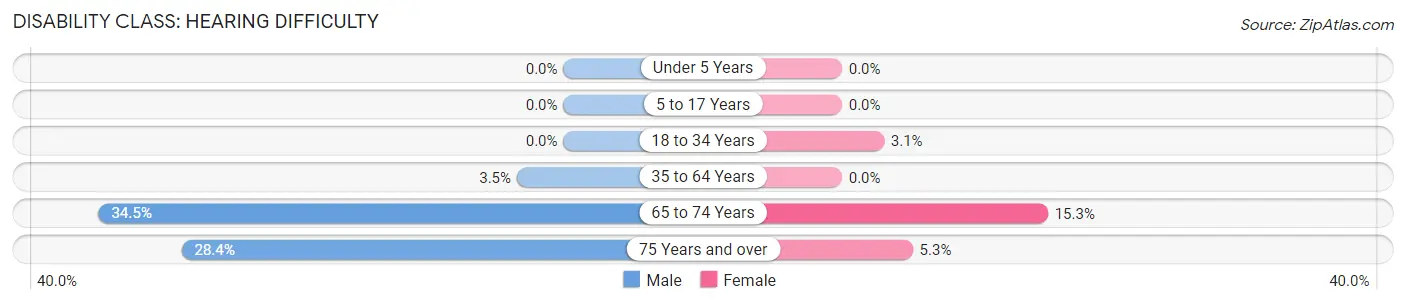
| Age Bracket | Male | Female |
| Under 5 Years | 0 (0.0%) | 0 (0.0%) |
| 5 to 17 Years | 0 (0.0%) | 0 (0.0%) |
| 18 to 34 Years | 0 (0.0%) | 10 (3.1%) |
| 35 to 64 Years | 29 (3.5%) | 0 (0.0%) |
| 65 to 74 Years | 49 (34.5%) | 39 (15.3%) |
| 75 Years and over | 36 (28.3%) | 8 (5.3%) |
Disability Class: Vision Difficulty
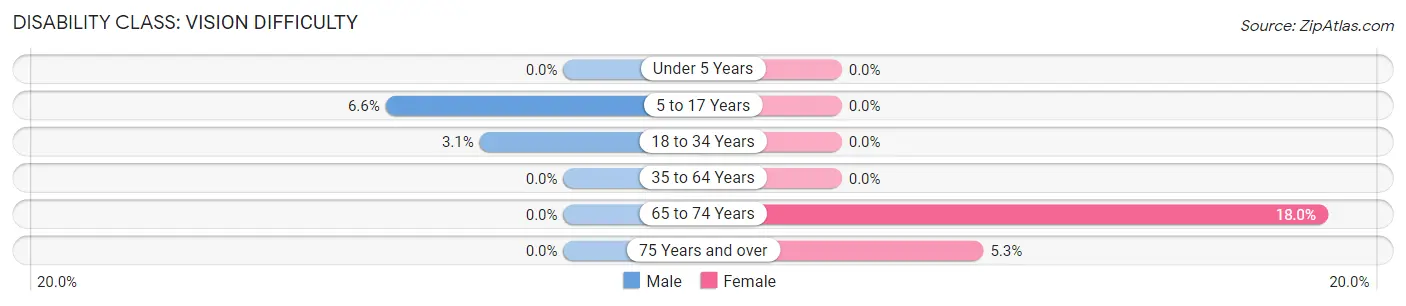
| Age Bracket | Male | Female |
| Under 5 Years | 0 (0.0%) | 0 (0.0%) |
| 5 to 17 Years | 25 (6.6%) | 0 (0.0%) |
| 18 to 34 Years | 13 (3.1%) | 0 (0.0%) |
| 35 to 64 Years | 0 (0.0%) | 0 (0.0%) |
| 65 to 74 Years | 0 (0.0%) | 46 (18.0%) |
| 75 Years and over | 0 (0.0%) | 8 (5.3%) |
Disability Class: Cognitive Difficulty
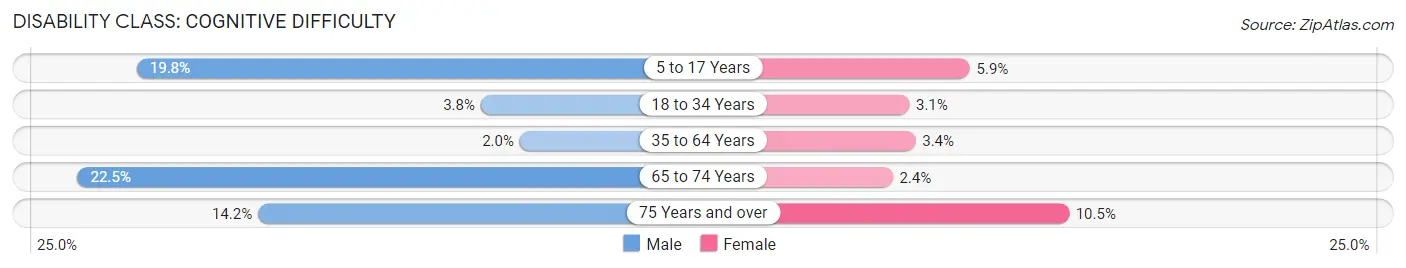
| Age Bracket | Male | Female |
| 5 to 17 Years | 75 (19.8%) | 23 (5.9%) |
| 18 to 34 Years | 16 (3.8%) | 10 (3.1%) |
| 35 to 64 Years | 17 (2.0%) | 23 (3.4%) |
| 65 to 74 Years | 32 (22.5%) | 6 (2.4%) |
| 75 Years and over | 18 (14.2%) | 16 (10.5%) |
Disability Class: Ambulatory Difficulty
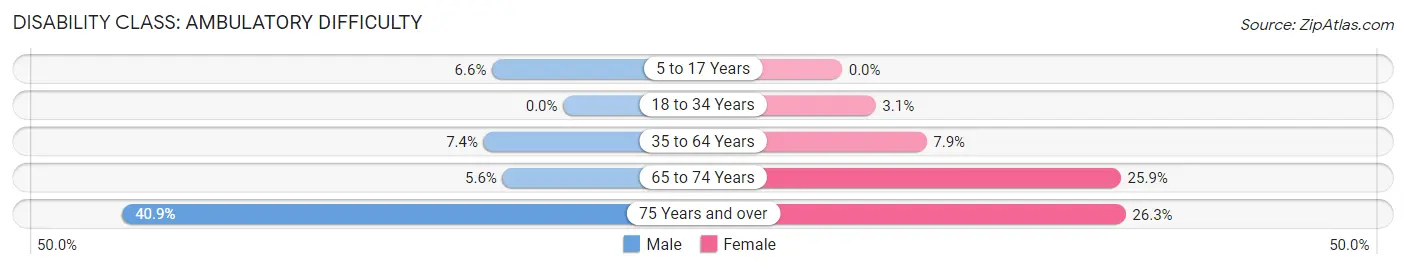
| Age Bracket | Male | Female |
| 5 to 17 Years | 25 (6.6%) | 0 (0.0%) |
| 18 to 34 Years | 0 (0.0%) | 10 (3.1%) |
| 35 to 64 Years | 62 (7.4%) | 53 (7.9%) |
| 65 to 74 Years | 8 (5.6%) | 66 (25.9%) |
| 75 Years and over | 52 (40.9%) | 40 (26.3%) |
Disability Class: Self-Care Difficulty
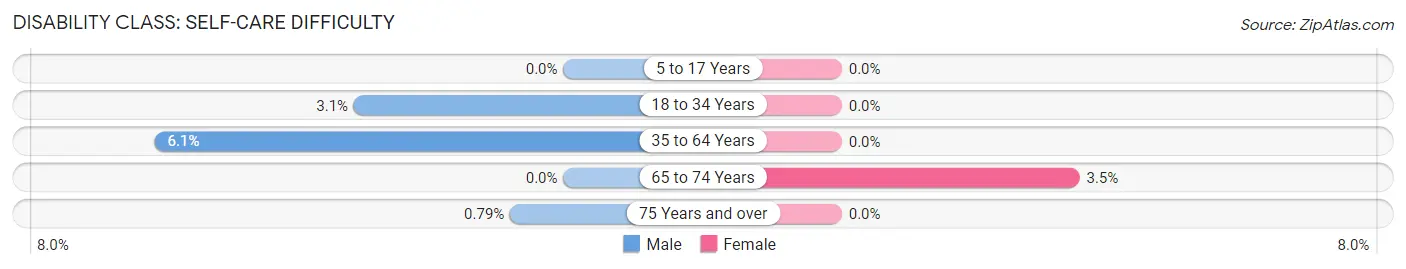
| Age Bracket | Male | Female |
| 5 to 17 Years | 0 (0.0%) | 0 (0.0%) |
| 18 to 34 Years | 13 (3.1%) | 0 (0.0%) |
| 35 to 64 Years | 51 (6.1%) | 0 (0.0%) |
| 65 to 74 Years | 0 (0.0%) | 9 (3.5%) |
| 75 Years and over | 1 (0.8%) | 0 (0.0%) |
Technology Access in Elkin
Computing Device Access in Elkin
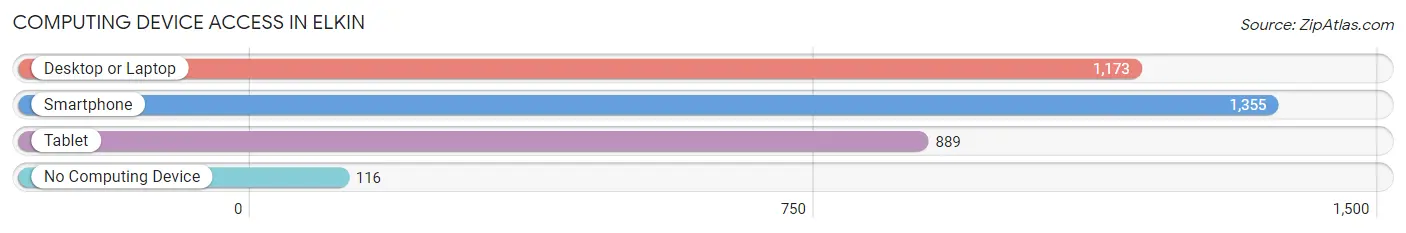
| Device Type | # Households | % Households |
| Desktop or Laptop | 1,173 | 70.5% |
| Smartphone | 1,355 | 81.5% |
| Tablet | 889 | 53.5% |
| No Computing Device | 116 | 7.0% |
| Total | 1,663 | 100.0% |
Internet Access in Elkin
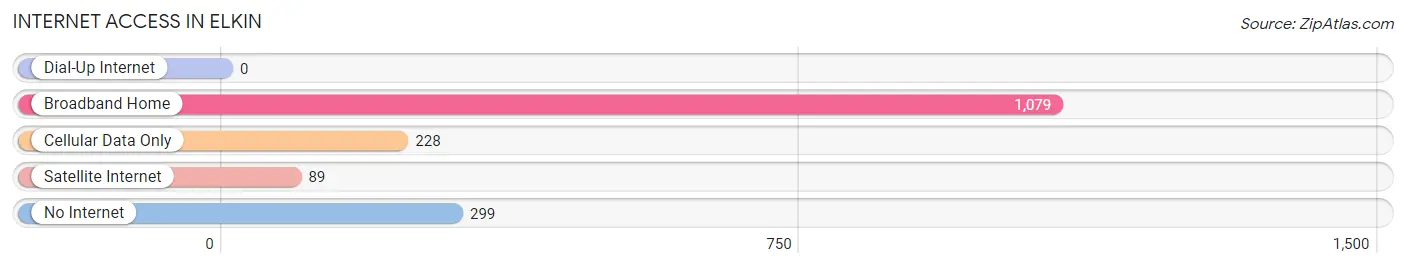
| Internet Type | # Households | % Households |
| Dial-Up Internet | 0 | 0.0% |
| Broadband Home | 1,079 | 64.9% |
| Cellular Data Only | 228 | 13.7% |
| Satellite Internet | 89 | 5.3% |
| No Internet | 299 | 18.0% |
| Total | 1,663 | 100.0% |
Elkin Summary
Elkin, North Carolina is a small town located in the foothills of the Blue Ridge Mountains in the northwestern part of the state. It is situated in the Yadkin Valley, which is known for its rolling hills, lush forests, and abundant wildlife. The town was founded in 1799 and has a population of approximately 4,000 people.
Geography
Elkin is located in the foothills of the Blue Ridge Mountains in the northwestern part of North Carolina. It is situated in the Yadkin Valley, which is known for its rolling hills, lush forests, and abundant wildlife. The town is located along the banks of the Yadkin River, which is a major tributary of the Catawba River. The town is surrounded by the towns of Jonesville, North Wilkesboro, and Wilkesboro.
The town is located at an elevation of 1,000 feet above sea level and has a total area of 2.2 square miles. The climate in Elkin is mild and humid, with temperatures ranging from the low 30s in the winter to the mid-80s in the summer.
Economy
Elkin’s economy is largely based on agriculture and tourism. The town is home to several wineries, including the award-winning Shelton Vineyards. The town is also home to several small businesses, including restaurants, antique stores, and art galleries.
The town is also home to several manufacturing companies, including Elkin Plastics, which produces plastic products for the automotive industry. The town is also home to several furniture manufacturers, including Elkin Furniture, which produces high-end furniture for the home and office.
Demographics
As of the 2010 census, Elkin had a population of 4,001 people. The racial makeup of the town was 94.3% White, 2.7% African American, 0.3% Native American, 0.7% Asian, 0.1% Pacific Islander, and 1.8% from other races. The median household income was $35,945, and the median family income was $41,945.
The town is home to several churches, including the Elkin United Methodist Church, the Elkin Baptist Church, and the Elkin Presbyterian Church. The town is also home to several schools, including Elkin High School, Elkin Middle School, and Elkin Elementary School.
Conclusion
Elkin, North Carolina is a small town located in the foothills of the Blue Ridge Mountains in the northwestern part of the state. It is situated in the Yadkin Valley, which is known for its rolling hills, lush forests, and abundant wildlife. The town was founded in 1799 and has a population of approximately 4,000 people. The town’s economy is largely based on agriculture and tourism, and it is home to several wineries, small businesses, and manufacturing companies. The town is also home to several churches and schools.
Common Questions
What is Per Capita Income in Elkin?
Per Capita income in Elkin is $30,891.
What is the Median Family Income in Elkin?
Median Family Income in Elkin is $81,369.
What is the Median Household income in Elkin?
Median Household Income in Elkin is $57,711.
What is Income or Wage Gap in Elkin?
Income or Wage Gap in Elkin is 22.5%.
Women in Elkin earn 77.5 cents for every dollar earned by a man.
What is Family Income Deficit in Elkin?
Family Income Deficit in Elkin is $5,021.
Families that are below poverty line in Elkin earn $5,021 less on average than the poverty threshold level.
What is Inequality or Gini Index in Elkin?
Inequality or Gini Index in Elkin is 0.49.
What is the Total Population of Elkin?
Total Population of Elkin is 4,026.
What is the Total Male Population of Elkin?
Total Male Population of Elkin is 1,951.
What is the Total Female Population of Elkin?
Total Female Population of Elkin is 2,075.
What is the Ratio of Males per 100 Females in Elkin?
There are 94.02 Males per 100 Females in Elkin.
What is the Ratio of Females per 100 Males in Elkin?
There are 106.36 Females per 100 Males in Elkin.
What is the Median Population Age in Elkin?
Median Population Age in Elkin is 41.9 Years.
What is the Average Family Size in Elkin
Average Family Size in Elkin is 3.2 People.
What is the Average Household Size in Elkin
Average Household Size in Elkin is 2.3 People.
How Large is the Labor Force in Elkin?
There are 2,101 People in the Labor Forcein in Elkin.
What is the Percentage of People in the Labor Force in Elkin?
64.7% of People are in the Labor Force in Elkin.
What is the Unemployment Rate in Elkin?
Unemployment Rate in Elkin is 3.1%.