Liberty, NC Map & Demographics
Liberty Map
Liberty Overview
$25,940
PER CAPITA INCOME
$62,917
AVG FAMILY INCOME
$48,672
AVG HOUSEHOLD INCOME
6.0%
WAGE / INCOME GAP [ % ]
94.0¢/ $1
WAGE / INCOME GAP [ $ ]
$16,323
FAMILY INCOME DEFICIT
0.46
INEQUALITY / GINI INDEX
2,666
TOTAL POPULATION
1,337
MALE POPULATION
1,329
FEMALE POPULATION
100.60
MALES / 100 FEMALES
99.40
FEMALES / 100 MALES
41.2
MEDIAN AGE
3.3
AVG FAMILY SIZE
2.4
AVG HOUSEHOLD SIZE
1,409
LABOR FORCE [ PEOPLE ]
64.6%
PERCENT IN LABOR FORCE
10.2%
UNEMPLOYMENT RATE
Liberty Zip Codes
Liberty Area Codes
Income in Liberty
Income Overview in Liberty
Per Capita Income in Liberty is $25,940, while median incomes of families and households are $62,917 and $48,672 respectively.
| Characteristic | Number | Measure |
| Per Capita Income | 2,666 | $25,940 |
| Median Family Income | 647 | $62,917 |
| Mean Family Income | 647 | $80,953 |
| Median Household Income | 1,083 | $48,672 |
| Mean Household Income | 1,083 | $60,971 |
| Income Deficit | 647 | $16,323 |
| Wage / Income Gap (%) | 2,666 | 5.99% |
| Wage / Income Gap ($) | 2,666 | 94.01¢ per $1 |
| Gini / Inequality Index | 2,666 | 0.46 |
Earnings by Sex in Liberty
Average Earnings in Liberty are $28,790, $29,490 for men and $27,725 for women, a difference of 6.0%.
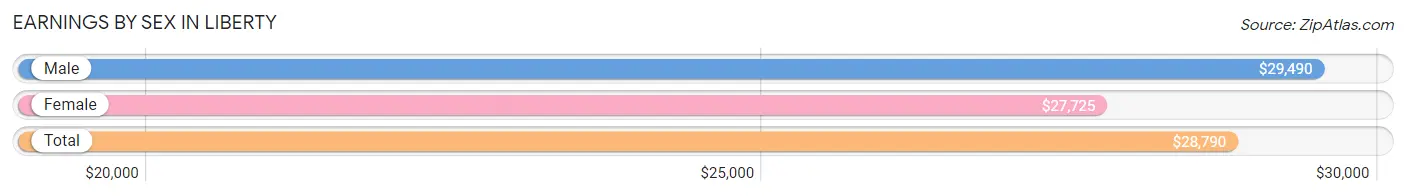
| Sex | Number | Average Earnings |
| Male | 669 (49.1%) | $29,490 |
| Female | 693 (50.9%) | $27,725 |
| Total | 1,362 (100.0%) | $28,790 |
Earnings by Sex by Income Bracket in Liberty
The most common earnings brackets in Liberty are $10,000 to $12,499 for men (102 | 15.2%) and $2,499 or less for women (111 | 16.0%).
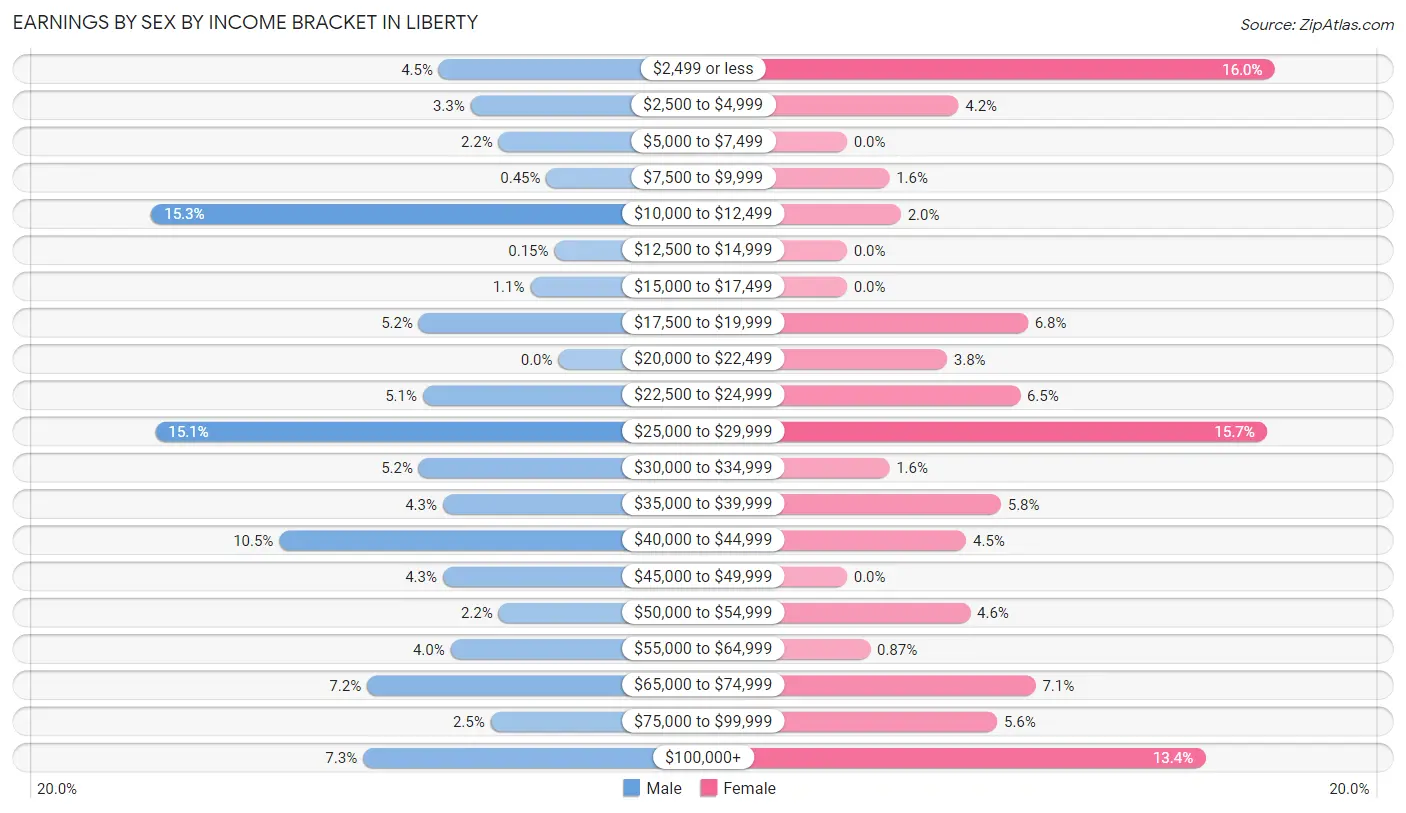
| Income | Male | Female |
| $2,499 or less | 30 (4.5%) | 111 (16.0%) |
| $2,500 to $4,999 | 22 (3.3%) | 29 (4.2%) |
| $5,000 to $7,499 | 15 (2.2%) | 0 (0.0%) |
| $7,500 to $9,999 | 3 (0.4%) | 11 (1.6%) |
| $10,000 to $12,499 | 102 (15.2%) | 14 (2.0%) |
| $12,500 to $14,999 | 1 (0.2%) | 0 (0.0%) |
| $15,000 to $17,499 | 7 (1.1%) | 0 (0.0%) |
| $17,500 to $19,999 | 35 (5.2%) | 47 (6.8%) |
| $20,000 to $22,499 | 0 (0.0%) | 26 (3.7%) |
| $22,500 to $24,999 | 34 (5.1%) | 45 (6.5%) |
| $25,000 to $29,999 | 101 (15.1%) | 109 (15.7%) |
| $30,000 to $34,999 | 35 (5.2%) | 11 (1.6%) |
| $35,000 to $39,999 | 29 (4.3%) | 40 (5.8%) |
| $40,000 to $44,999 | 70 (10.5%) | 31 (4.5%) |
| $45,000 to $49,999 | 29 (4.3%) | 0 (0.0%) |
| $50,000 to $54,999 | 15 (2.2%) | 32 (4.6%) |
| $55,000 to $64,999 | 27 (4.0%) | 6 (0.9%) |
| $65,000 to $74,999 | 48 (7.2%) | 49 (7.1%) |
| $75,000 to $99,999 | 17 (2.5%) | 39 (5.6%) |
| $100,000+ | 49 (7.3%) | 93 (13.4%) |
| Total | 669 (100.0%) | 693 (100.0%) |
Earnings by Sex by Educational Attainment in Liberty
Average earnings in Liberty are $35,603 for men and $28,875 for women, a difference of 18.9%. Men with an educational attainment of bachelor's degree enjoy the highest average annual earnings of $41,842, while those with high school diploma education earn the least with $28,300. Women with an educational attainment of bachelor's degree earn the most with the average annual earnings of $68,750, while those with high school diploma education have the smallest earnings of $24,073.
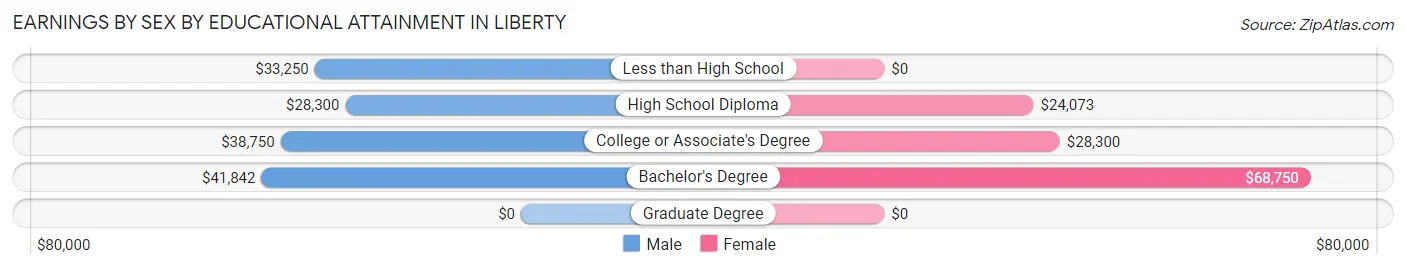
| Educational Attainment | Male Income | Female Income |
| Less than High School | $33,250 | $0 |
| High School Diploma | $28,300 | $24,073 |
| College or Associate's Degree | $38,750 | $28,300 |
| Bachelor's Degree | $41,842 | $68,750 |
| Graduate Degree | - | - |
| Total | $35,603 | $28,875 |
Family Income in Liberty
Family Income Brackets in Liberty
According to the Liberty family income data, there are 149 families falling into the $50,000 to $74,999 income range, which is the most common income bracket and makes up 23.0% of all families. Conversely, the $10,000 to $14,999 income bracket is the least frequent group with only 5 families (0.8%) belonging to this category.
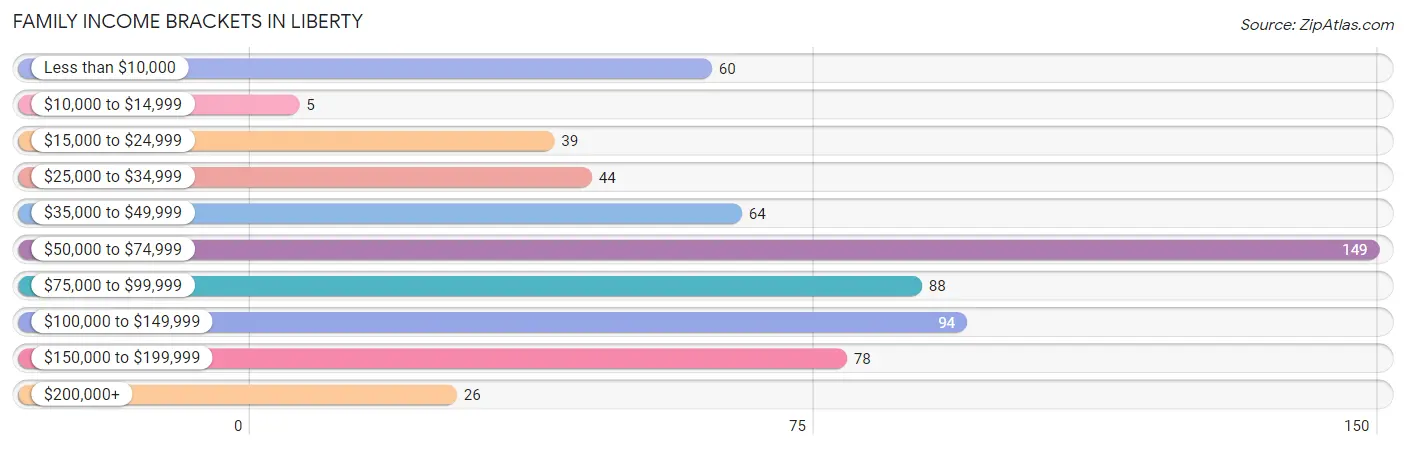
| Income Bracket | # Families | % Families |
| Less than $10,000 | 60 | 9.3% |
| $10,000 to $14,999 | 5 | 0.8% |
| $15,000 to $24,999 | 39 | 6.0% |
| $25,000 to $34,999 | 44 | 6.8% |
| $35,000 to $49,999 | 64 | 9.9% |
| $50,000 to $74,999 | 149 | 23.0% |
| $75,000 to $99,999 | 88 | 13.6% |
| $100,000 to $149,999 | 94 | 14.5% |
| $150,000 to $199,999 | 78 | 12.1% |
| $200,000+ | 26 | 4.0% |
Family Income by Famaliy Size in Liberty
5-person families (89 | 13.8%) account for the highest median family income in Liberty with $180,275 per family, while 5-person families (89 | 13.8%) have the highest median income of $36,055 per family member.
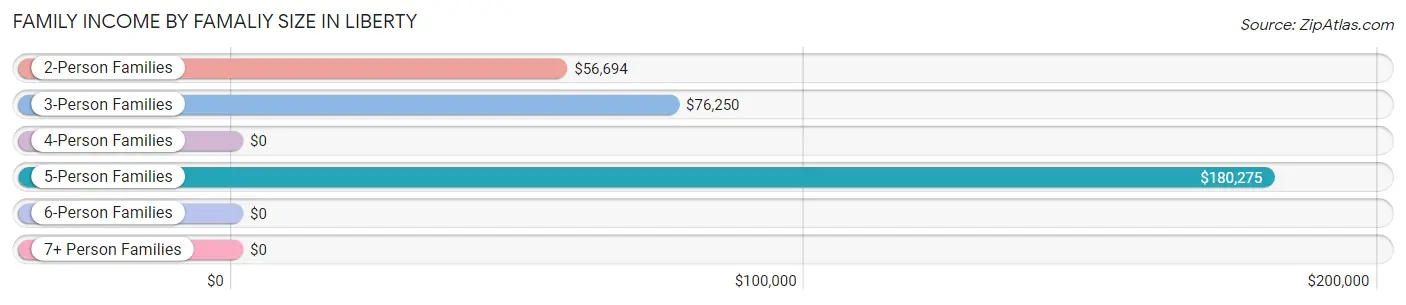
| Income Bracket | # Families | Median Income |
| 2-Person Families | 360 (55.6%) | $56,694 |
| 3-Person Families | 116 (17.9%) | $76,250 |
| 4-Person Families | 49 (7.6%) | $0 |
| 5-Person Families | 89 (13.8%) | $180,275 |
| 6-Person Families | 8 (1.2%) | $0 |
| 7+ Person Families | 25 (3.9%) | $0 |
| Total | 647 (100.0%) | $62,917 |
Family Income by Number of Earners in Liberty
The median family income in Liberty is $62,917, with families comprising 3+ earners (106) having the highest median family income of $180,150, while families with 1 earner (257) have the lowest median family income of $35,625, accounting for 16.4% and 39.7% of families, respectively.
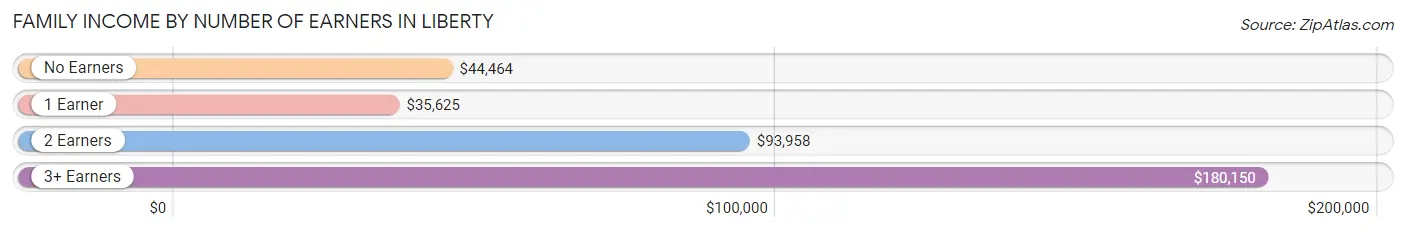
| Number of Earners | # Families | Median Income |
| No Earners | 62 (9.6%) | $44,464 |
| 1 Earner | 257 (39.7%) | $35,625 |
| 2 Earners | 222 (34.3%) | $93,958 |
| 3+ Earners | 106 (16.4%) | $180,150 |
| Total | 647 (100.0%) | $62,917 |
Household Income in Liberty
Household Income Brackets in Liberty
With 247 households falling in the category, the $50,000 to $74,999 income range is the most frequent in Liberty, accounting for 22.8% of all households. In contrast, only 26 households (2.4%) fall into the $200,000+ income bracket, making it the least populous group.
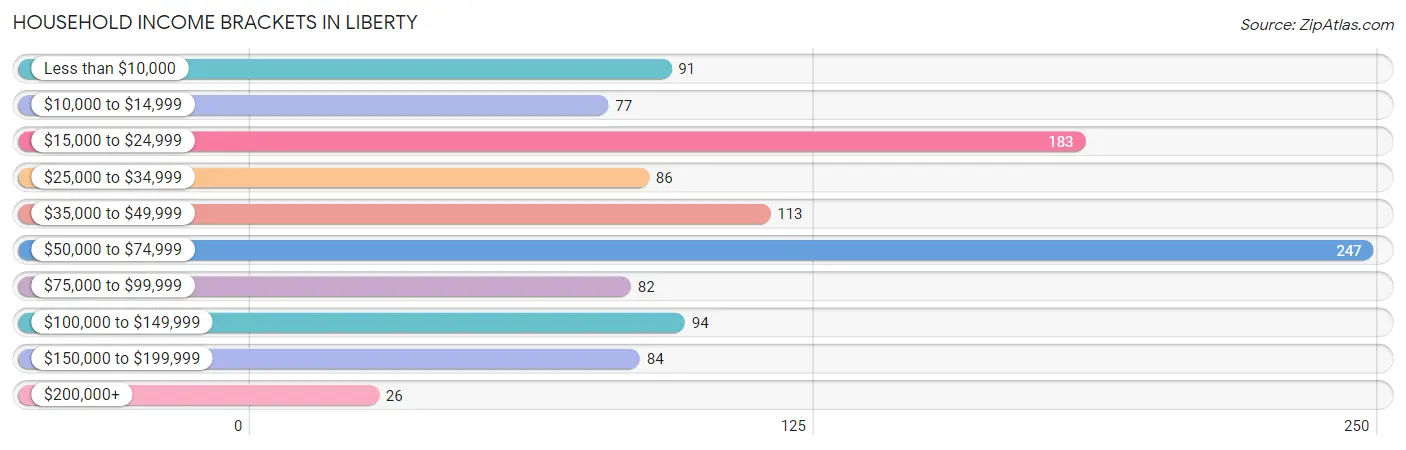
| Income Bracket | # Households | % Households |
| Less than $10,000 | 91 | 8.4% |
| $10,000 to $14,999 | 77 | 7.1% |
| $15,000 to $24,999 | 183 | 16.9% |
| $25,000 to $34,999 | 86 | 7.9% |
| $35,000 to $49,999 | 113 | 10.4% |
| $50,000 to $74,999 | 247 | 22.8% |
| $75,000 to $99,999 | 82 | 7.6% |
| $100,000 to $149,999 | 94 | 8.7% |
| $150,000 to $199,999 | 84 | 7.8% |
| $200,000+ | 26 | 2.4% |
Household Income by Householder Age in Liberty
The median household income in Liberty is $48,672, with the highest median household income of $97,679 found in the 45 to 64 years age bracket for the primary householder. A total of 381 households (35.2%) fall into this category. Meanwhile, the 65+ years age bracket for the primary householder has the lowest median household income of $18,257, with 465 households (42.9%) in this group.
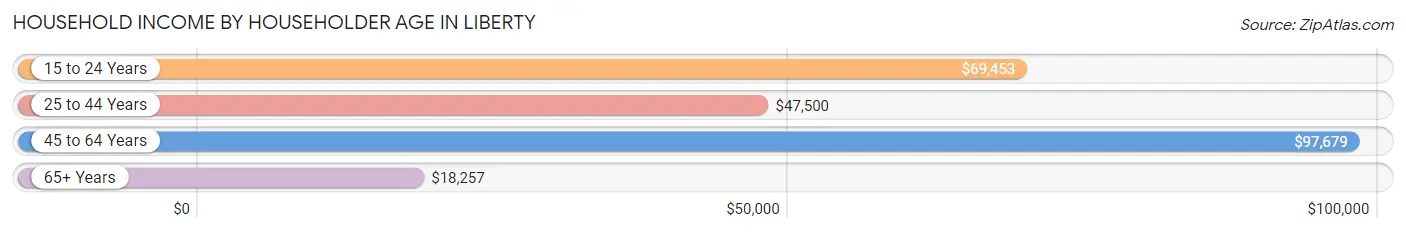
| Income Bracket | # Households | Median Income |
| 15 to 24 Years | 25 (2.3%) | $69,453 |
| 25 to 44 Years | 212 (19.6%) | $47,500 |
| 45 to 64 Years | 381 (35.2%) | $97,679 |
| 65+ Years | 465 (42.9%) | $18,257 |
| Total | 1,083 (100.0%) | $48,672 |
Poverty in Liberty
Income Below Poverty by Sex and Age in Liberty
With 21.0% poverty level for males and 19.0% for females among the residents of Liberty, 5 year old males and 12 to 14 year old females are the most vulnerable to poverty, with 12 males (75.0%) and 18 females (45.0%) in their respective age groups living below the poverty level.
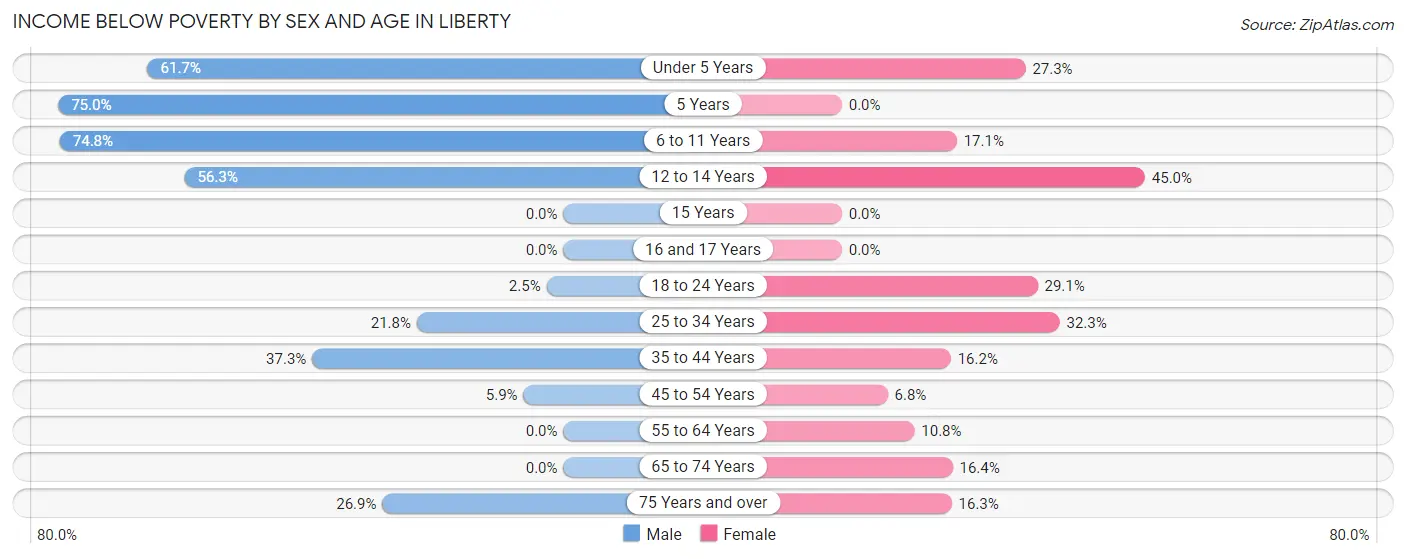
| Age Bracket | Male | Female |
| Under 5 Years | 50 (61.7%) | 21 (27.3%) |
| 5 Years | 12 (75.0%) | 0 (0.0%) |
| 6 to 11 Years | 77 (74.8%) | 14 (17.1%) |
| 12 to 14 Years | 9 (56.2%) | 18 (45.0%) |
| 15 Years | 0 (0.0%) | 0 (0.0%) |
| 16 and 17 Years | 0 (0.0%) | 0 (0.0%) |
| 18 to 24 Years | 4 (2.5%) | 25 (29.1%) |
| 25 to 34 Years | 42 (21.8%) | 65 (32.3%) |
| 35 to 44 Years | 47 (37.3%) | 22 (16.2%) |
| 45 to 54 Years | 8 (5.9%) | 10 (6.8%) |
| 55 to 64 Years | 0 (0.0%) | 18 (10.8%) |
| 65 to 74 Years | 0 (0.0%) | 37 (16.4%) |
| 75 Years and over | 32 (26.9%) | 23 (16.3%) |
| Total | 281 (21.0%) | 253 (19.0%) |
Income Above Poverty by Sex and Age in Liberty
According to the poverty statistics in Liberty, males aged 15 years and females aged 5 years are the age groups that are most secure financially, with 100.0% of males and 100.0% of females in these age groups living above the poverty line.
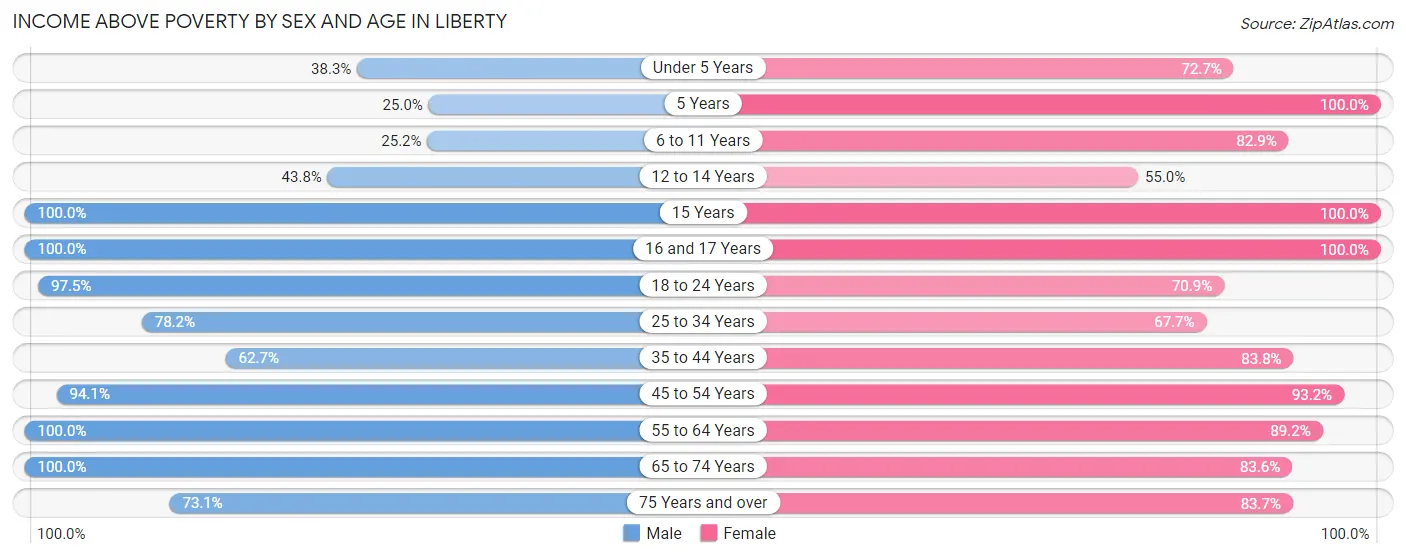
| Age Bracket | Male | Female |
| Under 5 Years | 31 (38.3%) | 56 (72.7%) |
| 5 Years | 4 (25.0%) | 11 (100.0%) |
| 6 to 11 Years | 26 (25.2%) | 68 (82.9%) |
| 12 to 14 Years | 7 (43.8%) | 22 (55.0%) |
| 15 Years | 53 (100.0%) | 6 (100.0%) |
| 16 and 17 Years | 40 (100.0%) | 10 (100.0%) |
| 18 to 24 Years | 156 (97.5%) | 61 (70.9%) |
| 25 to 34 Years | 151 (78.2%) | 136 (67.7%) |
| 35 to 44 Years | 79 (62.7%) | 114 (83.8%) |
| 45 to 54 Years | 127 (94.1%) | 137 (93.2%) |
| 55 to 64 Years | 170 (100.0%) | 149 (89.2%) |
| 65 to 74 Years | 125 (100.0%) | 188 (83.6%) |
| 75 Years and over | 87 (73.1%) | 118 (83.7%) |
| Total | 1,056 (79.0%) | 1,076 (81.0%) |
Income Below Poverty Among Married-Couple Families in Liberty
The poverty statistics for married-couple families in Liberty show that 5.0% or 22 of the total 441 families live below the poverty line. Families with 5 or more children have the highest poverty rate of 50.0%, comprising of 7 families. On the other hand, families with 1 or 2 children have the lowest poverty rate of 0.0%, which includes 0 families.
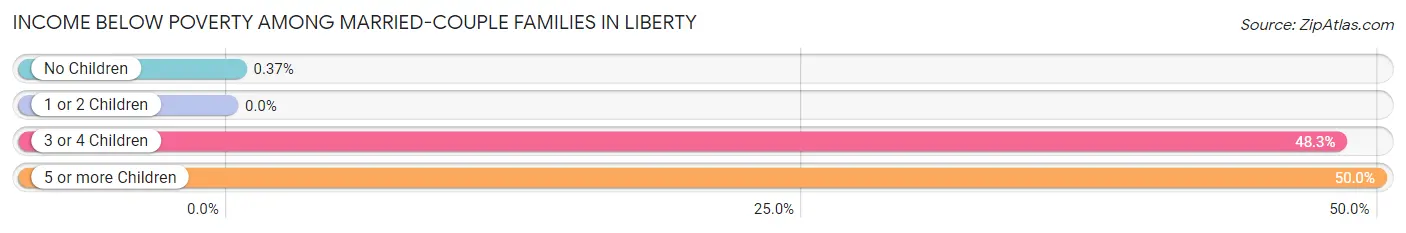
| Children | Above Poverty | Below Poverty |
| No Children | 270 (99.6%) | 1 (0.4%) |
| 1 or 2 Children | 127 (100.0%) | 0 (0.0%) |
| 3 or 4 Children | 15 (51.7%) | 14 (48.3%) |
| 5 or more Children | 7 (50.0%) | 7 (50.0%) |
| Total | 419 (95.0%) | 22 (5.0%) |
Income Below Poverty Among Single-Parent Households in Liberty
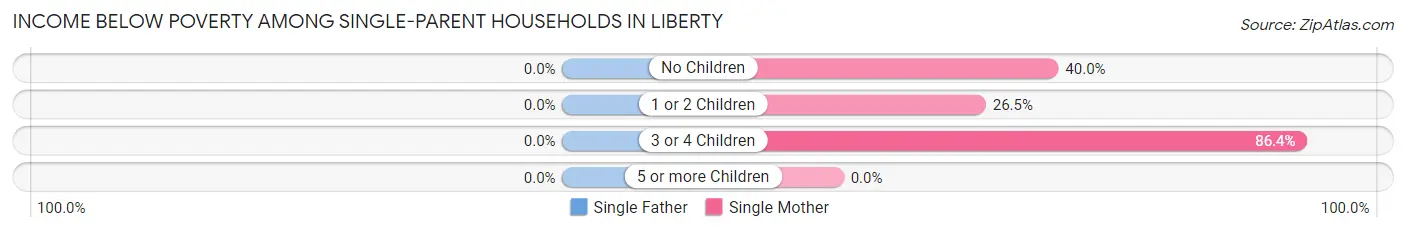
| Children | Single Father | Single Mother |
| No Children | 0 (0.0%) | 34 (40.0%) |
| 1 or 2 Children | 0 (0.0%) | 18 (26.5%) |
| 3 or 4 Children | 0 (0.0%) | 19 (86.4%) |
| 5 or more Children | 0 (0.0%) | 0 (0.0%) |
| Total | 0 (0.0%) | 71 (40.6%) |
Income Below Poverty Among Married-Couple vs Single-Parent Households in Liberty
The poverty data for Liberty shows that 22 of the married-couple family households (5.0%) and 71 of the single-parent households (34.5%) are living below the poverty level. Within the married-couple family households, those with 5 or more children have the highest poverty rate, with 7 households (50.0%) falling below the poverty line. Among the single-parent households, those with 3 or 4 children have the highest poverty rate, with 19 household (86.4%) living below poverty.
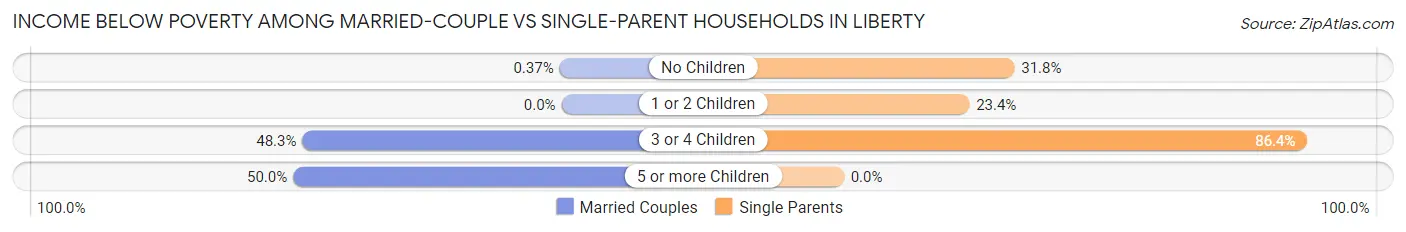
| Children | Married-Couple Families | Single-Parent Households |
| No Children | 1 (0.4%) | 34 (31.8%) |
| 1 or 2 Children | 0 (0.0%) | 18 (23.4%) |
| 3 or 4 Children | 14 (48.3%) | 19 (86.4%) |
| 5 or more Children | 7 (50.0%) | 0 (0.0%) |
| Total | 22 (5.0%) | 71 (34.5%) |
Race in Liberty
The most populous races in Liberty are White / Caucasian (1,560 | 58.5%), Hispanic or Latino (540 | 20.3%), and Black / African American (488 | 18.3%).
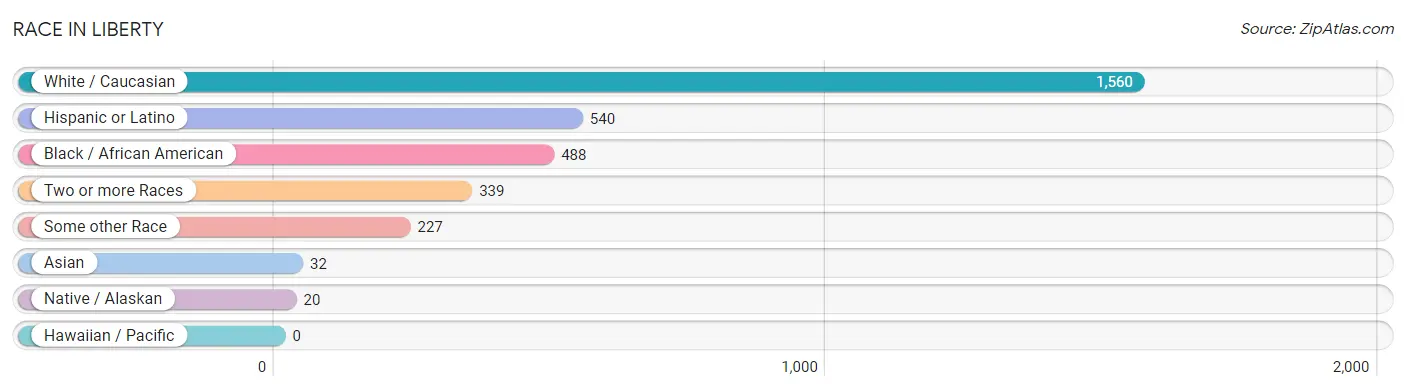
| Race | # Population | % Population |
| Asian | 32 | 1.2% |
| Black / African American | 488 | 18.3% |
| Hawaiian / Pacific | 0 | 0.0% |
| Hispanic or Latino | 540 | 20.3% |
| Native / Alaskan | 20 | 0.7% |
| White / Caucasian | 1,560 | 58.5% |
| Two or more Races | 339 | 12.7% |
| Some other Race | 227 | 8.5% |
| Total | 2,666 | 100.0% |
Ancestry in Liberty
The most populous ancestries reported in Liberty are Mexican (531 | 19.9%), English (374 | 14.0%), German (319 | 12.0%), Irish (289 | 10.8%), and Subsaharan African (105 | 3.9%), together accounting for 60.7% of all Liberty residents.
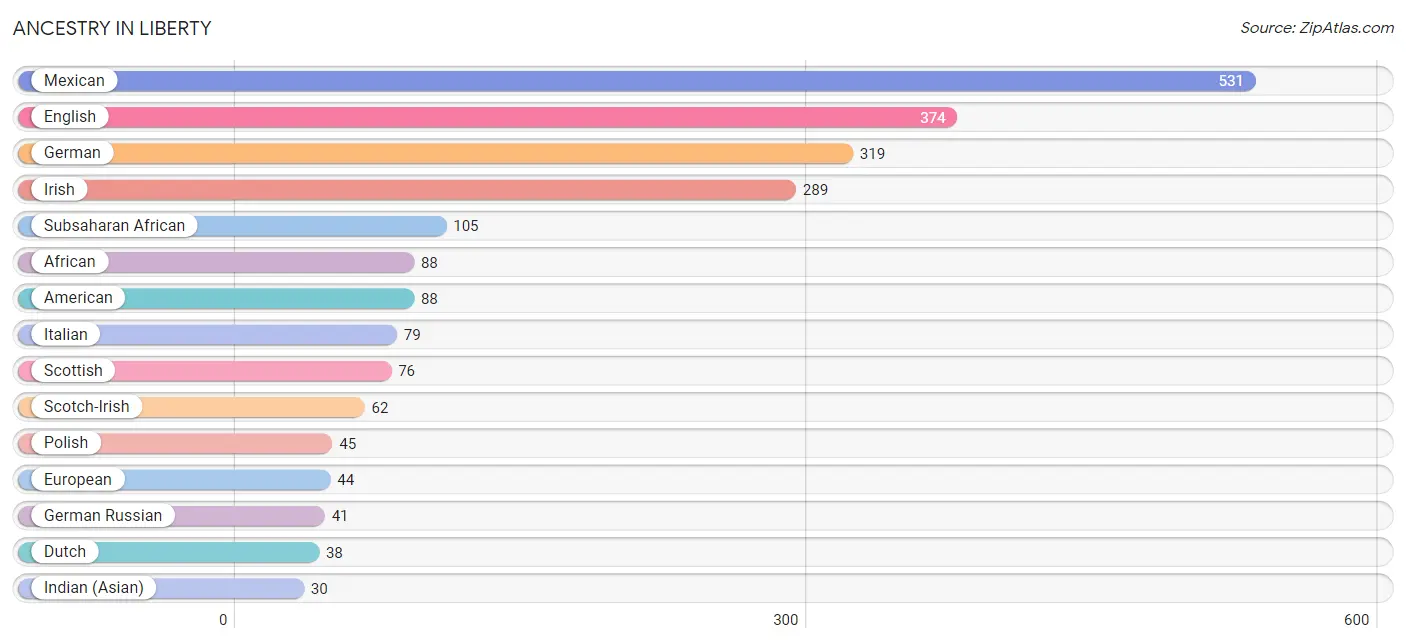
| Ancestry | # Population | % Population |
| African | 88 | 3.3% |
| American | 88 | 3.3% |
| Armenian | 20 | 0.7% |
| Blackfeet | 15 | 0.6% |
| Central American | 9 | 0.3% |
| Czech | 5 | 0.2% |
| Dutch | 38 | 1.4% |
| English | 374 | 14.0% |
| European | 44 | 1.7% |
| French | 10 | 0.4% |
| French Canadian | 5 | 0.2% |
| German | 319 | 12.0% |
| German Russian | 41 | 1.5% |
| Greek | 11 | 0.4% |
| Honduran | 9 | 0.3% |
| Indian (Asian) | 30 | 1.1% |
| Irish | 289 | 10.8% |
| Italian | 79 | 3.0% |
| Mexican | 531 | 19.9% |
| Mexican American Indian | 20 | 0.7% |
| Nigerian | 17 | 0.6% |
| Polish | 45 | 1.7% |
| Scotch-Irish | 62 | 2.3% |
| Scottish | 76 | 2.9% |
| Slovak | 8 | 0.3% |
| Subsaharan African | 105 | 3.9% |
| Swedish | 7 | 0.3% |
| Thai | 2 | 0.1% | View All 28 Rows |
Immigrants in Liberty
The most numerous immigrant groups reported in Liberty came from Central America (348 | 13.1%), Latin America (348 | 13.1%), Mexico (339 | 12.7%), Asia (32 | 1.2%), and China (30 | 1.1%), together accounting for 41.1% of all Liberty residents.
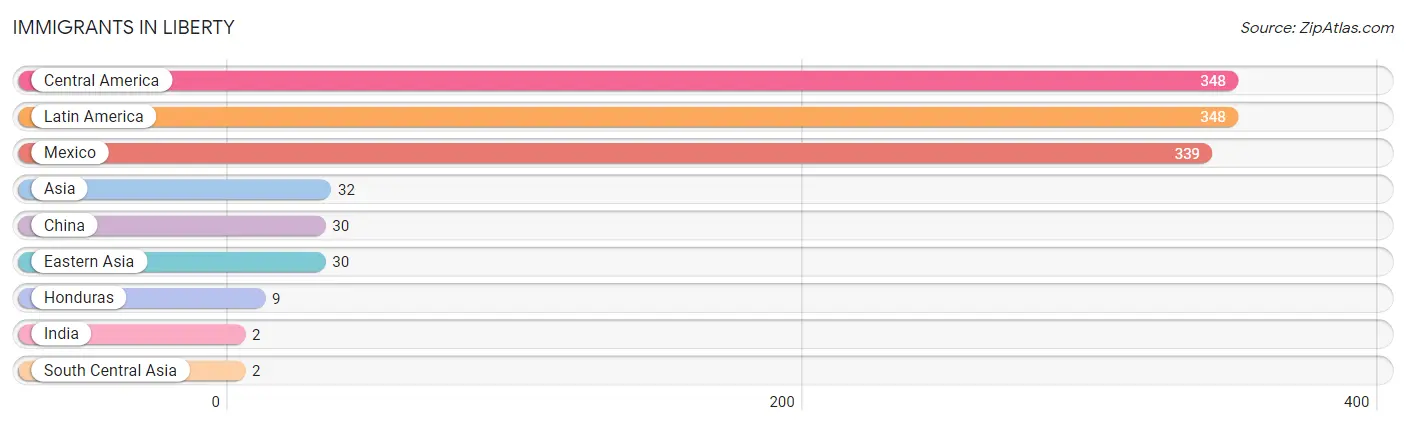
| Immigration Origin | # Population | % Population |
| Asia | 32 | 1.2% |
| Central America | 348 | 13.1% |
| China | 30 | 1.1% |
| Eastern Asia | 30 | 1.1% |
| Honduras | 9 | 0.3% |
| India | 2 | 0.1% |
| Latin America | 348 | 13.1% |
| Mexico | 339 | 12.7% |
| South Central Asia | 2 | 0.1% | View All 9 Rows |
Sex and Age in Liberty
Sex and Age in Liberty
The most populous age groups in Liberty are 25 to 29 Years (144 | 10.8%) for men and 70 to 74 Years (153 | 11.5%) for women.
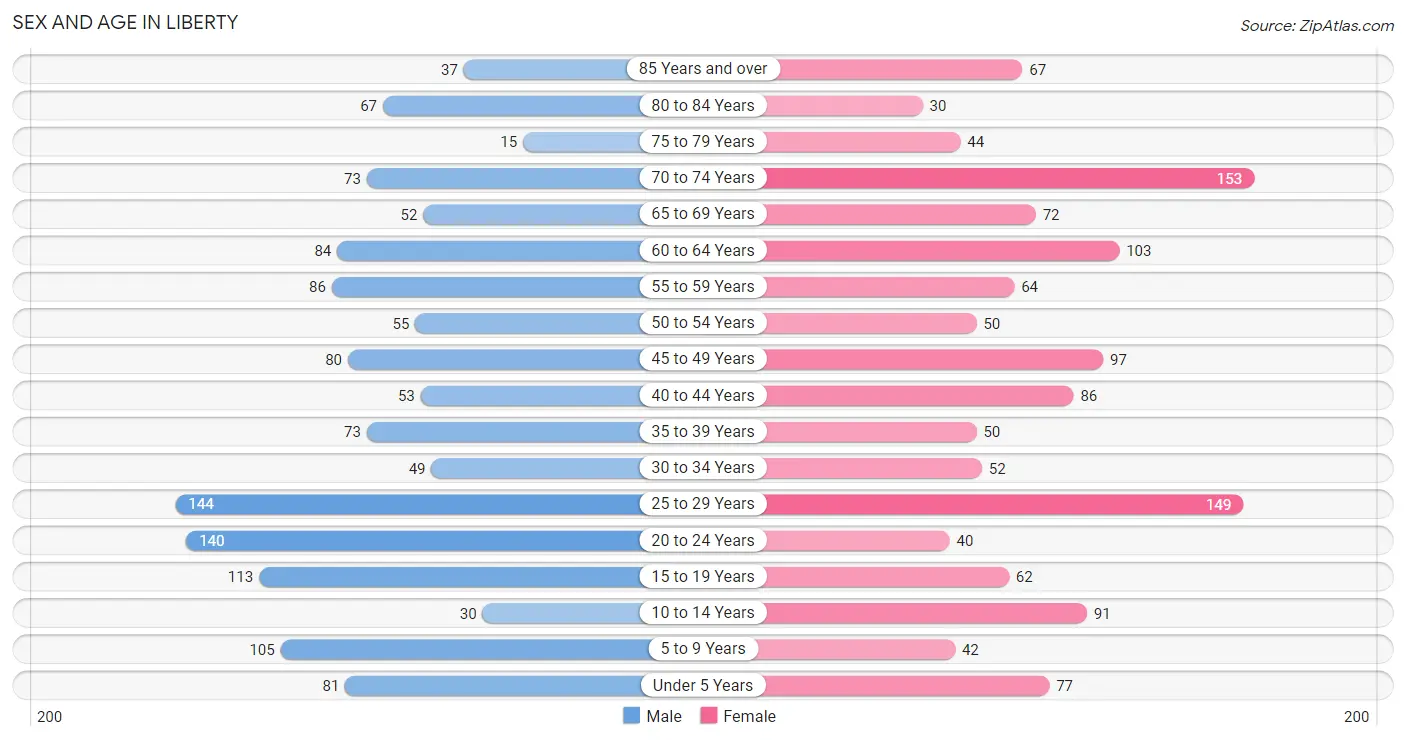
| Age Bracket | Male | Female |
| Under 5 Years | 81 (6.1%) | 77 (5.8%) |
| 5 to 9 Years | 105 (7.9%) | 42 (3.2%) |
| 10 to 14 Years | 30 (2.2%) | 91 (6.9%) |
| 15 to 19 Years | 113 (8.5%) | 62 (4.7%) |
| 20 to 24 Years | 140 (10.5%) | 40 (3.0%) |
| 25 to 29 Years | 144 (10.8%) | 149 (11.2%) |
| 30 to 34 Years | 49 (3.7%) | 52 (3.9%) |
| 35 to 39 Years | 73 (5.5%) | 50 (3.8%) |
| 40 to 44 Years | 53 (4.0%) | 86 (6.5%) |
| 45 to 49 Years | 80 (6.0%) | 97 (7.3%) |
| 50 to 54 Years | 55 (4.1%) | 50 (3.8%) |
| 55 to 59 Years | 86 (6.4%) | 64 (4.8%) |
| 60 to 64 Years | 84 (6.3%) | 103 (7.7%) |
| 65 to 69 Years | 52 (3.9%) | 72 (5.4%) |
| 70 to 74 Years | 73 (5.5%) | 153 (11.5%) |
| 75 to 79 Years | 15 (1.1%) | 44 (3.3%) |
| 80 to 84 Years | 67 (5.0%) | 30 (2.3%) |
| 85 Years and over | 37 (2.8%) | 67 (5.0%) |
| Total | 1,337 (100.0%) | 1,329 (100.0%) |
Families and Households in Liberty
Median Family Size in Liberty
The median family size in Liberty is 3.33 persons per family, with married-couple families (441 | 68.2%) accounting for the largest median family size of 3.6 persons per family. On the other hand, single male/father families (31 | 4.8%) represent the smallest median family size with 2.29 persons per family.
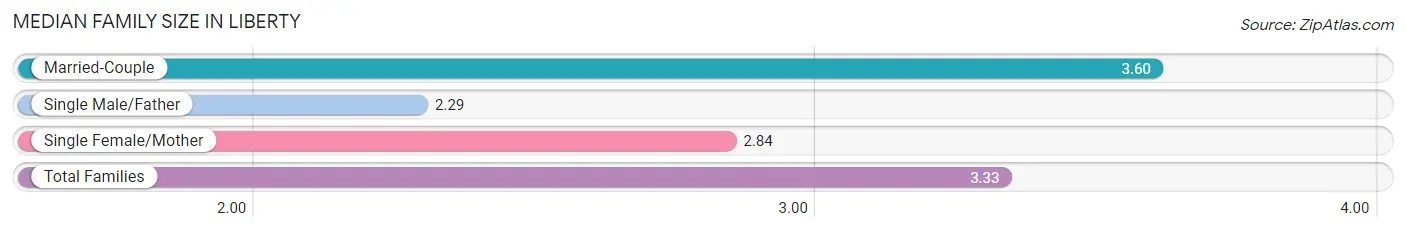
| Family Type | # Families | Family Size |
| Married-Couple | 441 (68.2%) | 3.60 |
| Single Male/Father | 31 (4.8%) | 2.29 |
| Single Female/Mother | 175 (27.1%) | 2.84 |
| Total Families | 647 (100.0%) | 3.33 |
Median Household Size in Liberty
The median household size in Liberty is 2.44 persons per household, with married-couple households (441 | 40.7%) accounting for the largest median household size of 3.6 persons per household. non-family households (436 | 40.3%) represent the smallest median household size with 1.06 persons per household.
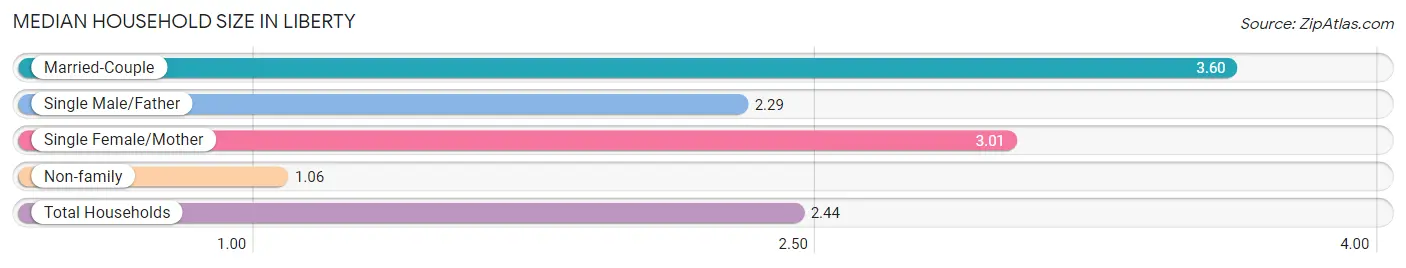
| Household Type | # Households | Household Size |
| Married-Couple | 441 (40.7%) | 3.60 |
| Single Male/Father | 31 (2.9%) | 2.29 |
| Single Female/Mother | 175 (16.2%) | 3.01 |
| Non-family | 436 (40.3%) | 1.06 |
| Total Households | 1,083 (100.0%) | 2.44 |
Household Size by Marriage Status in Liberty
Out of a total of 1,083 households in Liberty, 647 (59.7%) are family households, while 436 (40.3%) are nonfamily households. The most numerous type of family households are 2-person households, comprising 328, and the most common type of nonfamily households are 1-person households, comprising 410.
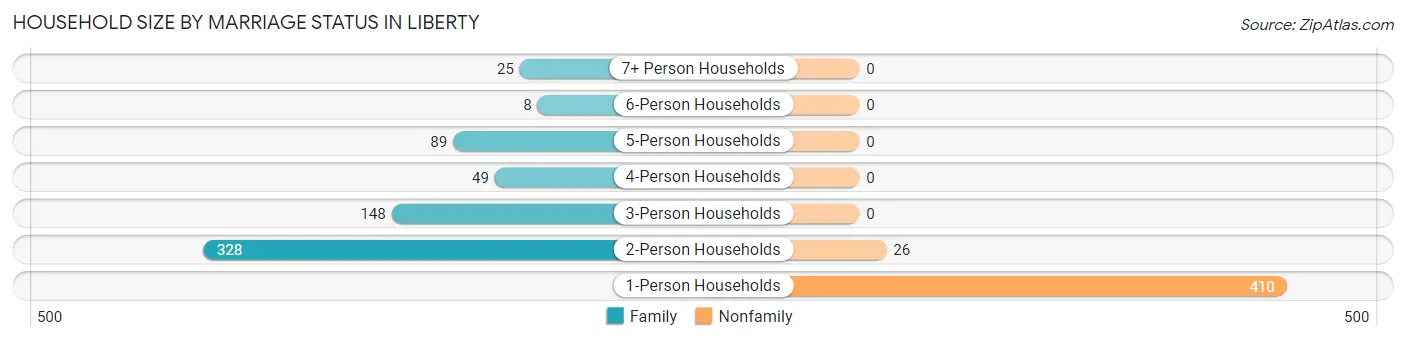
| Household Size | Family Households | Nonfamily Households |
| 1-Person Households | - | 410 (37.9%) |
| 2-Person Households | 328 (30.3%) | 26 (2.4%) |
| 3-Person Households | 148 (13.7%) | 0 (0.0%) |
| 4-Person Households | 49 (4.5%) | 0 (0.0%) |
| 5-Person Households | 89 (8.2%) | 0 (0.0%) |
| 6-Person Households | 8 (0.7%) | 0 (0.0%) |
| 7+ Person Households | 25 (2.3%) | 0 (0.0%) |
| Total | 647 (59.7%) | 436 (40.3%) |
Female Fertility in Liberty
Fertility by Age in Liberty
Average fertility rate in Liberty is 131.0 births per 1,000 women. Women in the age bracket of 15 to 19 years have the highest fertility rate with 403.0 births per 1,000 women. Women in the age bracket of 20 to 34 years acount for 52.0% of all women with births.
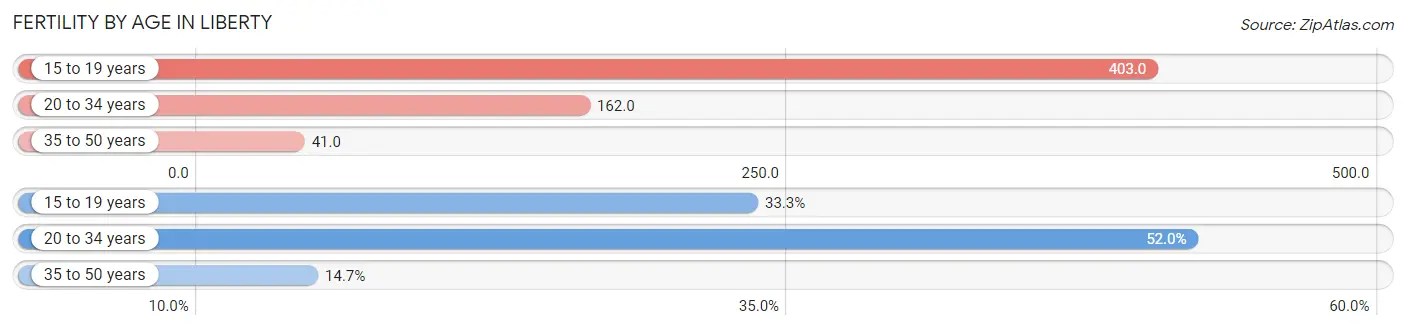
| Age Bracket | Women with Births | Births / 1,000 Women |
| 15 to 19 years | 25 (33.3%) | 403.0 |
| 20 to 34 years | 39 (52.0%) | 162.0 |
| 35 to 50 years | 11 (14.7%) | 41.0 |
| Total | 75 (100.0%) | 131.0 |
Fertility by Age by Marriage Status in Liberty
30.7% of women with births (75) in Liberty are married. The highest percentage of unmarried women with births falls into 15 to 19 years age bracket with 100.0% of them unmarried at the time of birth, while the lowest percentage of unmarried women with births belong to 35 to 50 years age bracket with 0.0% of them unmarried.
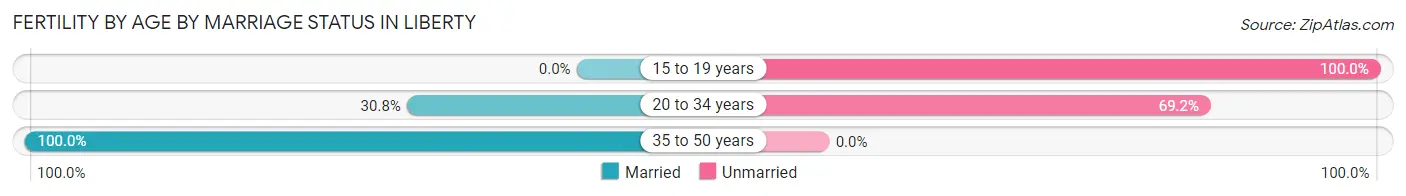
| Age Bracket | Married | Unmarried |
| 15 to 19 years | 0 (0.0%) | 25 (100.0%) |
| 20 to 34 years | 12 (30.8%) | 27 (69.2%) |
| 35 to 50 years | 11 (100.0%) | 0 (0.0%) |
| Total | 23 (30.7%) | 52 (69.3%) |
Fertility by Education in Liberty
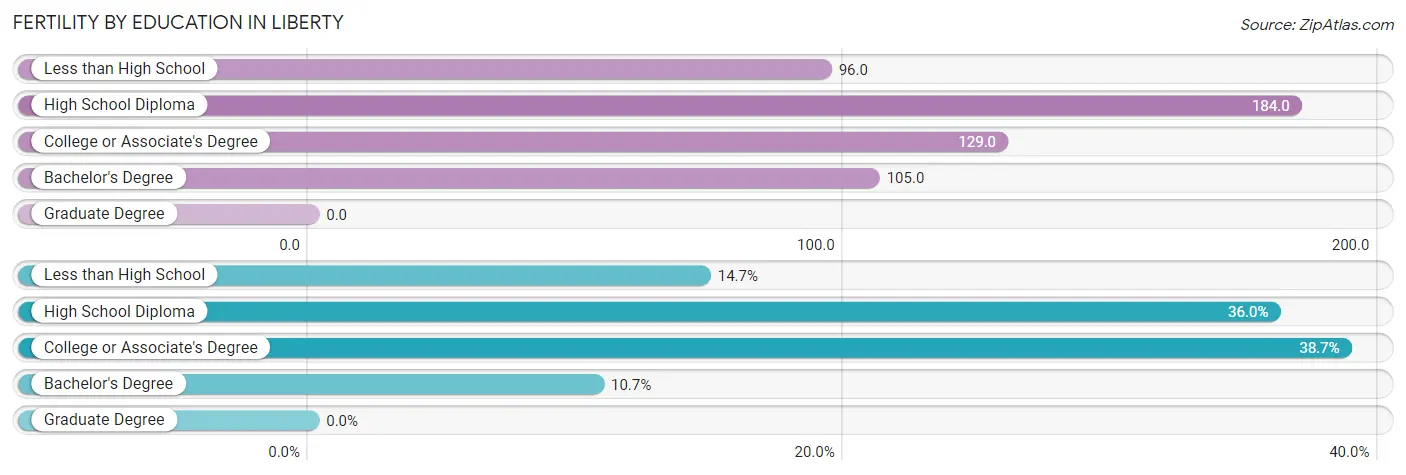
| Educational Attainment | Women with Births | Births / 1,000 Women |
| Less than High School | 11 (14.7%) | 96.0 |
| High School Diploma | 27 (36.0%) | 184.0 |
| College or Associate's Degree | 29 (38.7%) | 129.0 |
| Bachelor's Degree | 8 (10.7%) | 105.0 |
| Graduate Degree | 0 (0.0%) | 0.0 |
| Total | 75 (100.0%) | 131.0 |
Fertility by Education by Marriage Status in Liberty
69.3% of women with births in Liberty are unmarried. Women with the educational attainment of less than high school are most likely to be married with 100.0% of them married at childbirth, while women with the educational attainment of high school diploma are least likely to be married with 100.0% of them unmarried at childbirth.
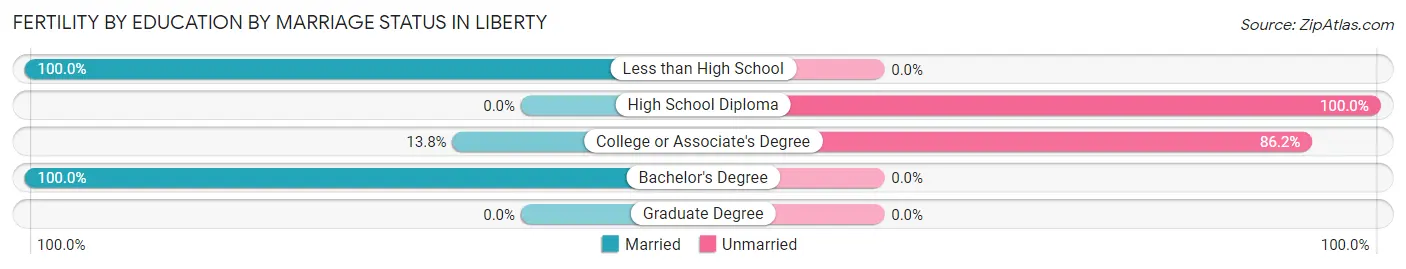
| Educational Attainment | Married | Unmarried |
| Less than High School | 11 (100.0%) | 0 (0.0%) |
| High School Diploma | 0 (0.0%) | 27 (100.0%) |
| College or Associate's Degree | 4 (13.8%) | 25 (86.2%) |
| Bachelor's Degree | 8 (100.0%) | 0 (0.0%) |
| Graduate Degree | 0 (0.0%) | 0 (0.0%) |
| Total | 23 (30.7%) | 52 (69.3%) |
Employment Characteristics in Liberty
Employment by Class of Employer in Liberty
Among the 1,233 employed individuals in Liberty, private company employees (1,048 | 85.0%), not-for-profit organizations (59 | 4.8%), and local government employees (42 | 3.4%) make up the most common classes of employment.
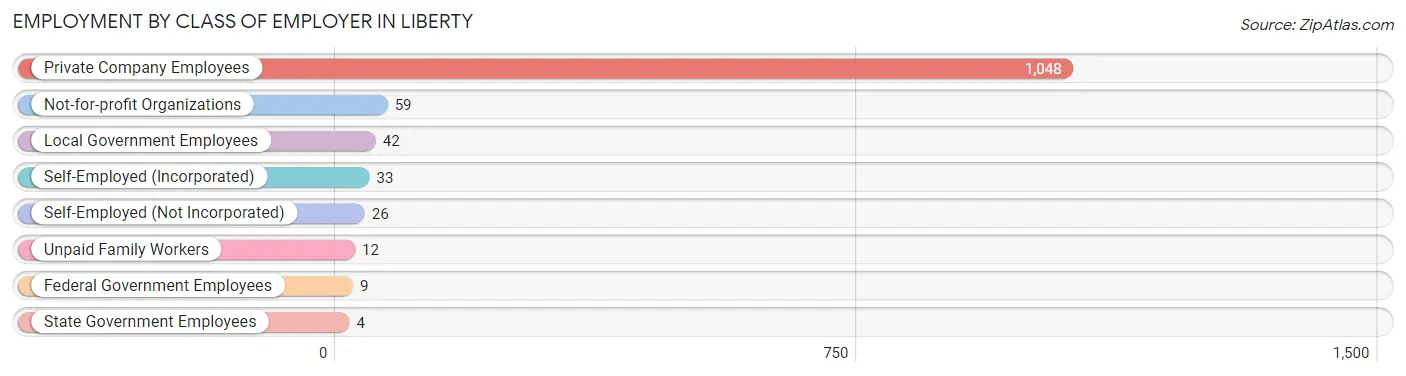
| Employer Class | # Employees | % Employees |
| Private Company Employees | 1,048 | 85.0% |
| Self-Employed (Incorporated) | 33 | 2.7% |
| Self-Employed (Not Incorporated) | 26 | 2.1% |
| Not-for-profit Organizations | 59 | 4.8% |
| Local Government Employees | 42 | 3.4% |
| State Government Employees | 4 | 0.3% |
| Federal Government Employees | 9 | 0.7% |
| Unpaid Family Workers | 12 | 1.0% |
| Total | 1,233 | 100.0% |
Employment Status by Age in Liberty
According to the labor force statistics for Liberty, out of the total population over 16 years of age (2,181), 64.6% or 1,409 individuals are in the labor force, with 10.2% or 144 of them unemployed. The age group with the highest labor force participation rate is 20 to 24 years, with 94.4% or 170 individuals in the labor force. Within the labor force, the 16 to 19 years age range has the highest percentage of unemployed individuals, with 50.0% or 30 of them being unemployed.
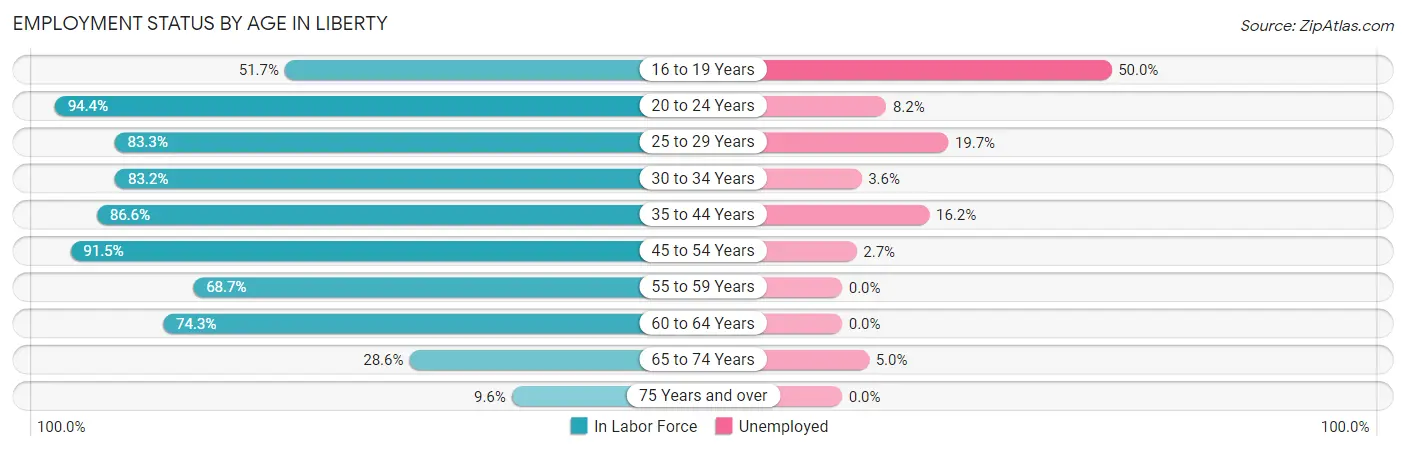
| Age Bracket | In Labor Force | Unemployed |
| 16 to 19 Years | 60 (51.7%) | 30 (50.0%) |
| 20 to 24 Years | 170 (94.4%) | 14 (8.2%) |
| 25 to 29 Years | 244 (83.3%) | 48 (19.7%) |
| 30 to 34 Years | 84 (83.2%) | 3 (3.6%) |
| 35 to 44 Years | 227 (86.6%) | 37 (16.2%) |
| 45 to 54 Years | 258 (91.5%) | 7 (2.7%) |
| 55 to 59 Years | 103 (68.7%) | 0 (0.0%) |
| 60 to 64 Years | 139 (74.3%) | 0 (0.0%) |
| 65 to 74 Years | 100 (28.6%) | 5 (5.0%) |
| 75 Years and over | 25 (9.6%) | 0 (0.0%) |
| Total | 1,409 (64.6%) | 144 (10.2%) |
Employment Status by Educational Attainment in Liberty
According to labor force statistics for Liberty, 82.7% of individuals (1,054) out of the total population between 25 and 64 years of age (1,275) are in the labor force, with 9.0% or 95 of them being unemployed. The group with the highest labor force participation rate are those with the educational attainment of bachelor's degree or higher, with 93.8% or 181 individuals in the labor force. Within the labor force, individuals with college / associate degree education have the highest percentage of unemployment, with 16.6% or 57 of them being unemployed.
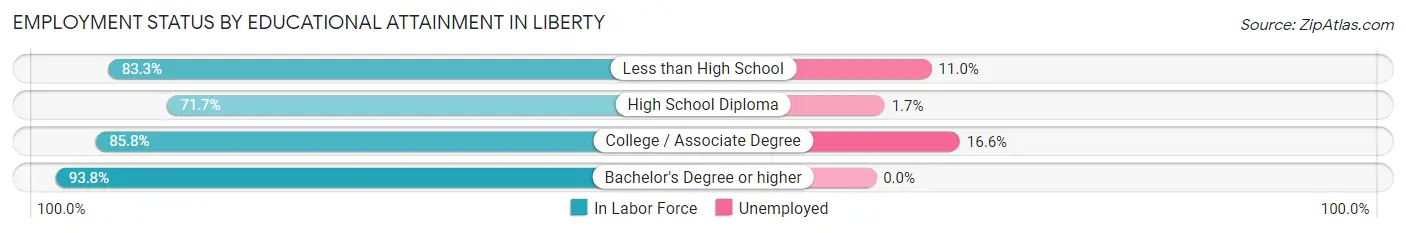
| Educational Attainment | In Labor Force | Unemployed |
| Less than High School | 300 (83.3%) | 40 (11.0%) |
| High School Diploma | 231 (71.7%) | 5 (1.7%) |
| College / Associate Degree | 343 (85.8%) | 66 (16.6%) |
| Bachelor's Degree or higher | 181 (93.8%) | 0 (0.0%) |
| Total | 1,054 (82.7%) | 115 (9.0%) |
Employment Occupations by Sex in Liberty
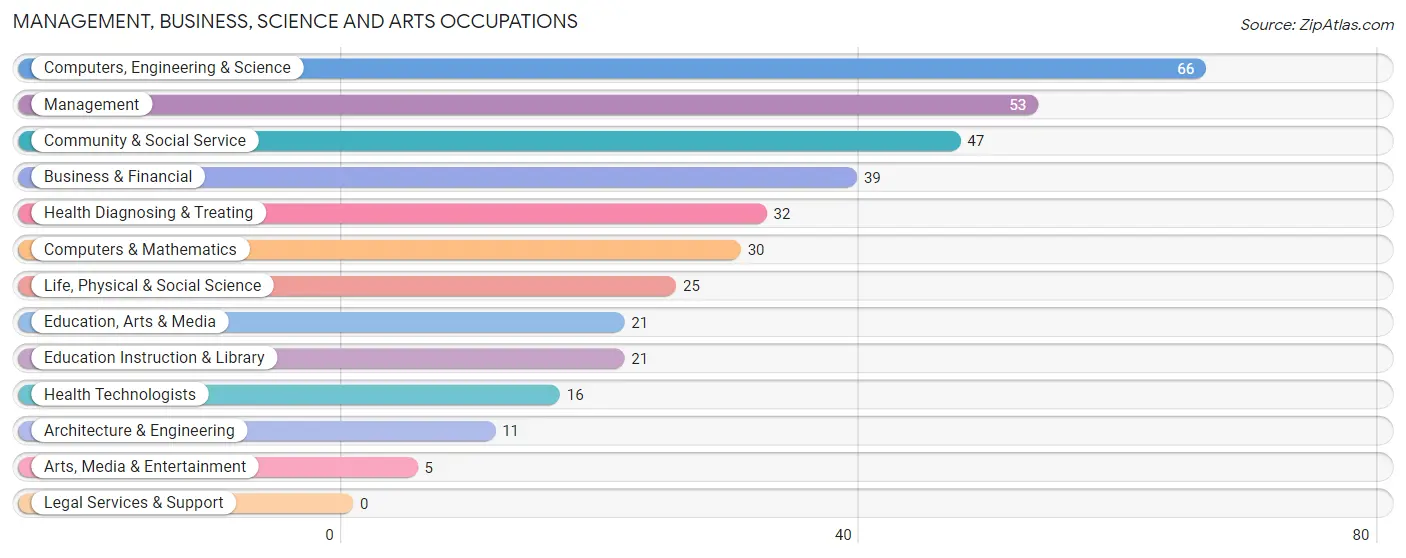
Management, Business, Science and Arts Occupations
The most common Management, Business, Science and Arts occupations in Liberty are Computers, Engineering & Science (66 | 5.2%), Management (53 | 4.2%), Community & Social Service (47 | 3.7%), Business & Financial (39 | 3.1%), and Health Diagnosing & Treating (32 | 2.5%).
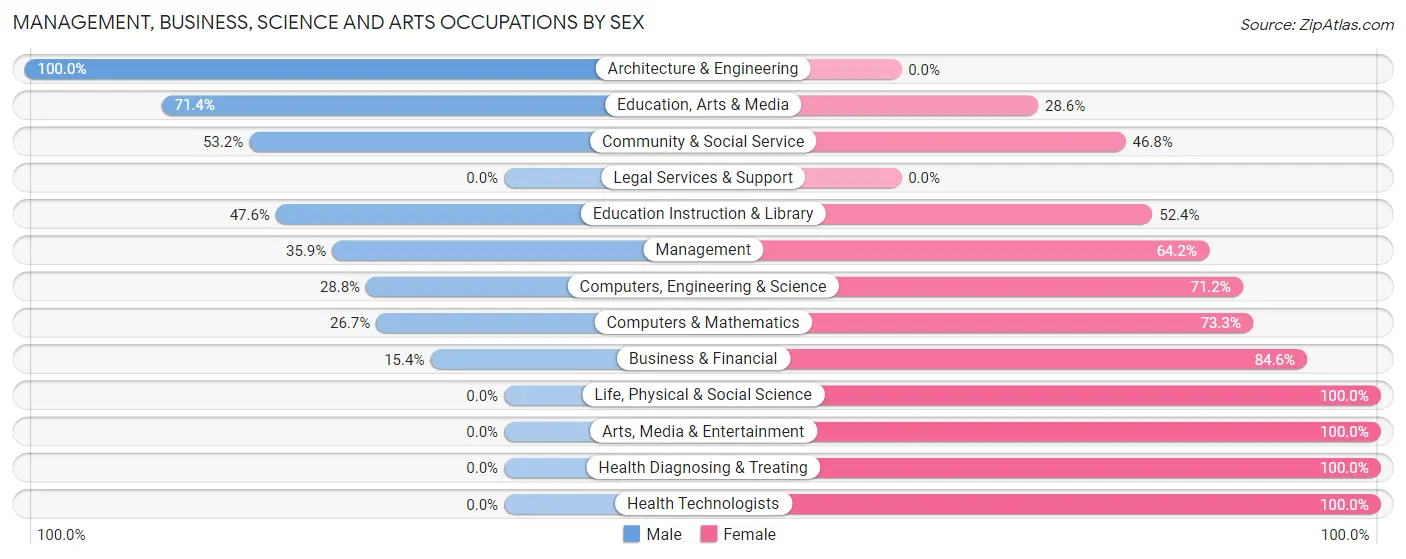
Management, Business, Science and Arts Occupations by Sex
Within the Management, Business, Science and Arts occupations in Liberty, the most male-oriented occupations are Architecture & Engineering (100.0%), Education, Arts & Media (71.4%), and Community & Social Service (53.2%), while the most female-oriented occupations are Life, Physical & Social Science (100.0%), Arts, Media & Entertainment (100.0%), and Health Diagnosing & Treating (100.0%).
| Occupation | Male | Female |
| Management | 19 (35.8%) | 34 (64.1%) |
| Business & Financial | 6 (15.4%) | 33 (84.6%) |
| Computers, Engineering & Science | 19 (28.8%) | 47 (71.2%) |
| Computers & Mathematics | 8 (26.7%) | 22 (73.3%) |
| Architecture & Engineering | 11 (100.0%) | 0 (0.0%) |
| Life, Physical & Social Science | 0 (0.0%) | 25 (100.0%) |
| Community & Social Service | 25 (53.2%) | 22 (46.8%) |
| Education, Arts & Media | 15 (71.4%) | 6 (28.6%) |
| Legal Services & Support | 0 (0.0%) | 0 (0.0%) |
| Education Instruction & Library | 10 (47.6%) | 11 (52.4%) |
| Arts, Media & Entertainment | 0 (0.0%) | 5 (100.0%) |
| Health Diagnosing & Treating | 0 (0.0%) | 32 (100.0%) |
| Health Technologists | 0 (0.0%) | 16 (100.0%) |
| Total (Category) | 69 (29.1%) | 168 (70.9%) |
| Total (Overall) | 645 (51.1%) | 617 (48.9%) |
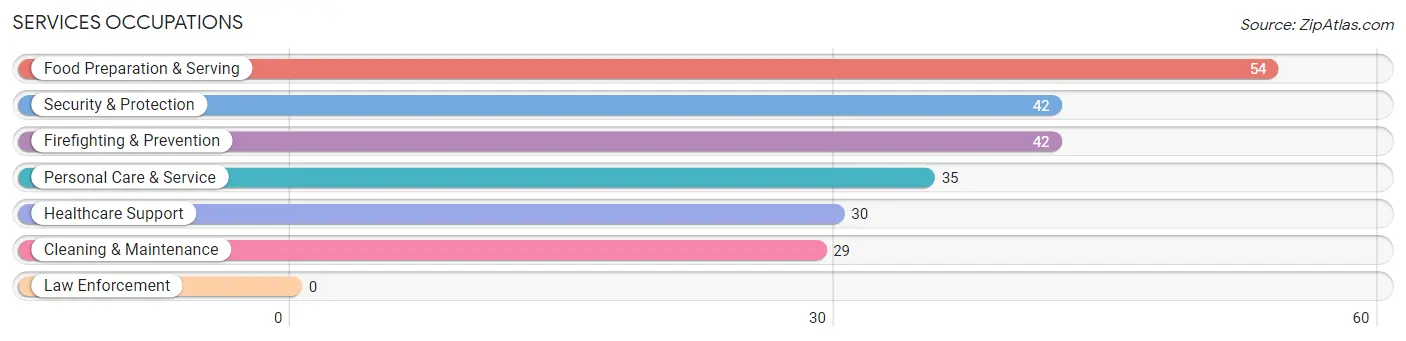
Services Occupations
The most common Services occupations in Liberty are Food Preparation & Serving (54 | 4.3%), Security & Protection (42 | 3.3%), Firefighting & Prevention (42 | 3.3%), Personal Care & Service (35 | 2.8%), and Healthcare Support (30 | 2.4%).
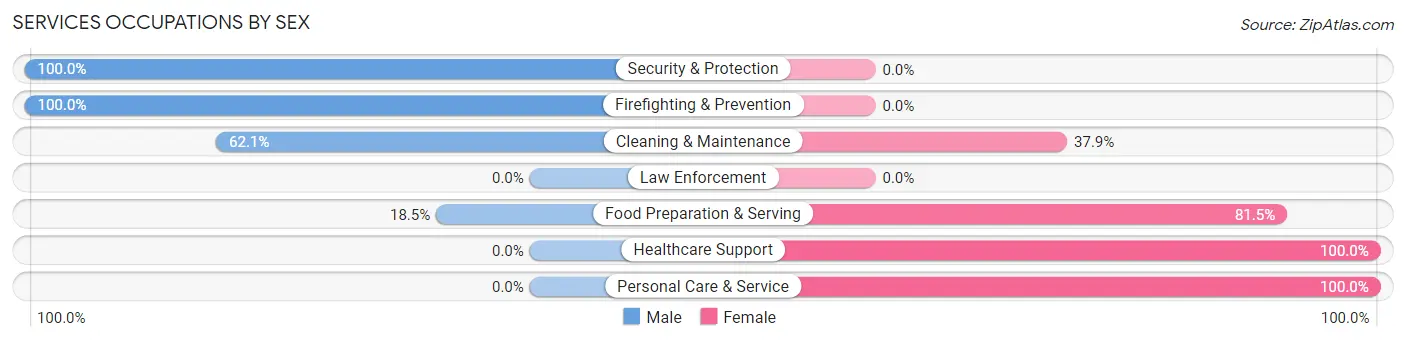
Services Occupations by Sex
Within the Services occupations in Liberty, the most male-oriented occupations are Security & Protection (100.0%), Firefighting & Prevention (100.0%), and Cleaning & Maintenance (62.1%), while the most female-oriented occupations are Healthcare Support (100.0%), Personal Care & Service (100.0%), and Food Preparation & Serving (81.5%).
| Occupation | Male | Female |
| Healthcare Support | 0 (0.0%) | 30 (100.0%) |
| Security & Protection | 42 (100.0%) | 0 (0.0%) |
| Firefighting & Prevention | 42 (100.0%) | 0 (0.0%) |
| Law Enforcement | 0 (0.0%) | 0 (0.0%) |
| Food Preparation & Serving | 10 (18.5%) | 44 (81.5%) |
| Cleaning & Maintenance | 18 (62.1%) | 11 (37.9%) |
| Personal Care & Service | 0 (0.0%) | 35 (100.0%) |
| Total (Category) | 70 (36.8%) | 120 (63.2%) |
| Total (Overall) | 645 (51.1%) | 617 (48.9%) |
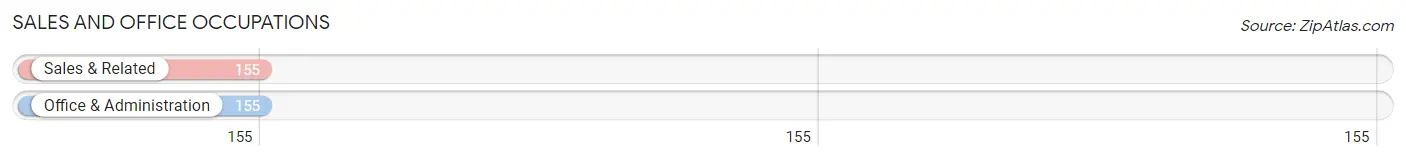
Sales and Office Occupations
The most common Sales and Office occupations in Liberty are Sales & Related (155 | 12.3%), and Office & Administration (155 | 12.3%).
Sales and Office Occupations by Sex
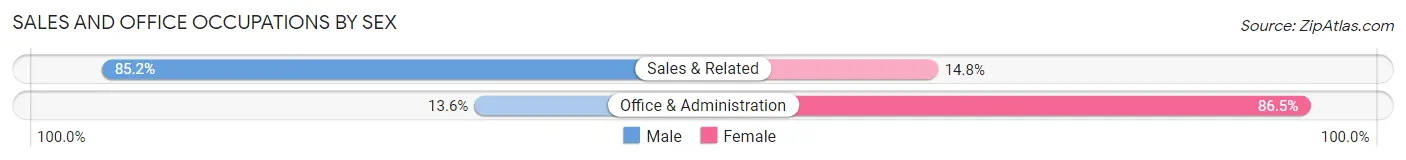
| Occupation | Male | Female |
| Sales & Related | 132 (85.2%) | 23 (14.8%) |
| Office & Administration | 21 (13.6%) | 134 (86.5%) |
| Total (Category) | 153 (49.3%) | 157 (50.6%) |
| Total (Overall) | 645 (51.1%) | 617 (48.9%) |
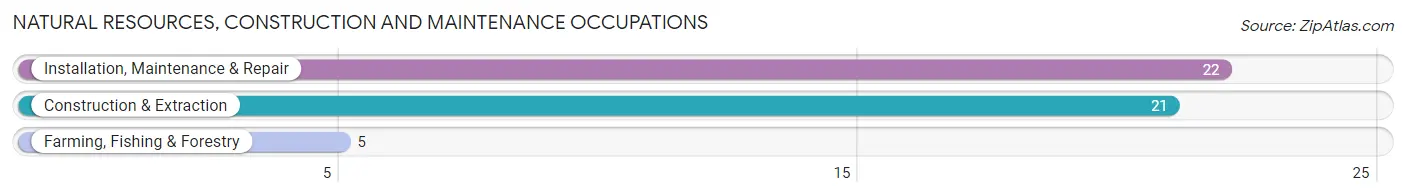
Natural Resources, Construction and Maintenance Occupations
The most common Natural Resources, Construction and Maintenance occupations in Liberty are Installation, Maintenance & Repair (22 | 1.7%), Construction & Extraction (21 | 1.7%), and Farming, Fishing & Forestry (5 | 0.4%).
Natural Resources, Construction and Maintenance Occupations by Sex
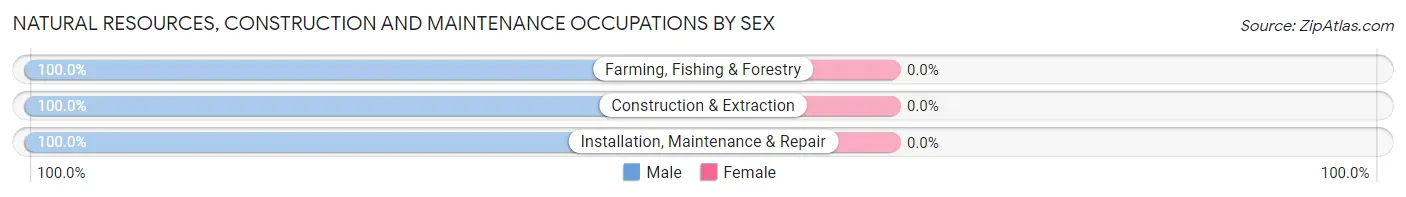
| Occupation | Male | Female |
| Farming, Fishing & Forestry | 5 (100.0%) | 0 (0.0%) |
| Construction & Extraction | 21 (100.0%) | 0 (0.0%) |
| Installation, Maintenance & Repair | 22 (100.0%) | 0 (0.0%) |
| Total (Category) | 48 (100.0%) | 0 (0.0%) |
| Total (Overall) | 645 (51.1%) | 617 (48.9%) |
Production, Transportation and Moving Occupations
The most common Production, Transportation and Moving occupations in Liberty are Production (254 | 20.1%), Material Moving (115 | 9.1%), and Transportation (108 | 8.6%).
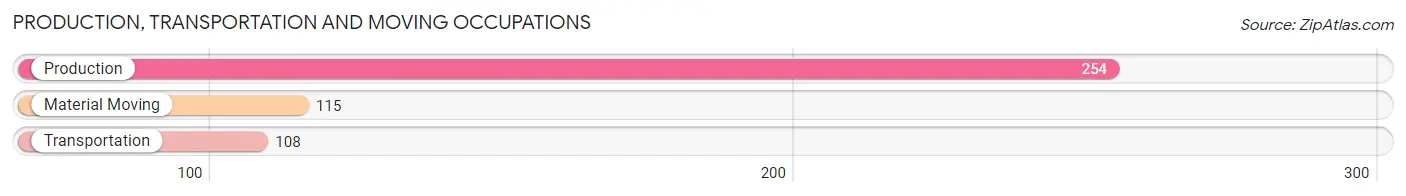
Production, Transportation and Moving Occupations by Sex
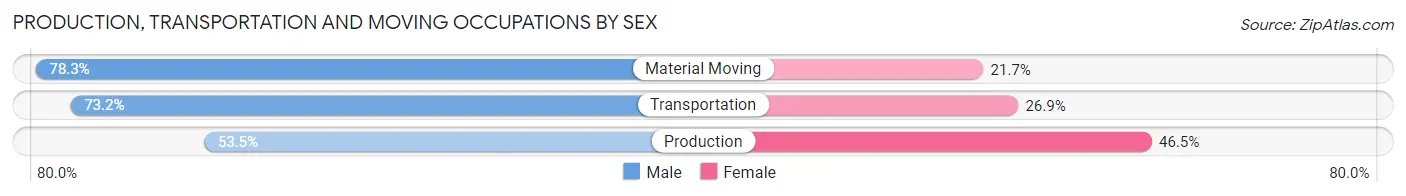
| Occupation | Male | Female |
| Production | 136 (53.5%) | 118 (46.5%) |
| Transportation | 79 (73.2%) | 29 (26.9%) |
| Material Moving | 90 (78.3%) | 25 (21.7%) |
| Total (Category) | 305 (63.9%) | 172 (36.1%) |
| Total (Overall) | 645 (51.1%) | 617 (48.9%) |
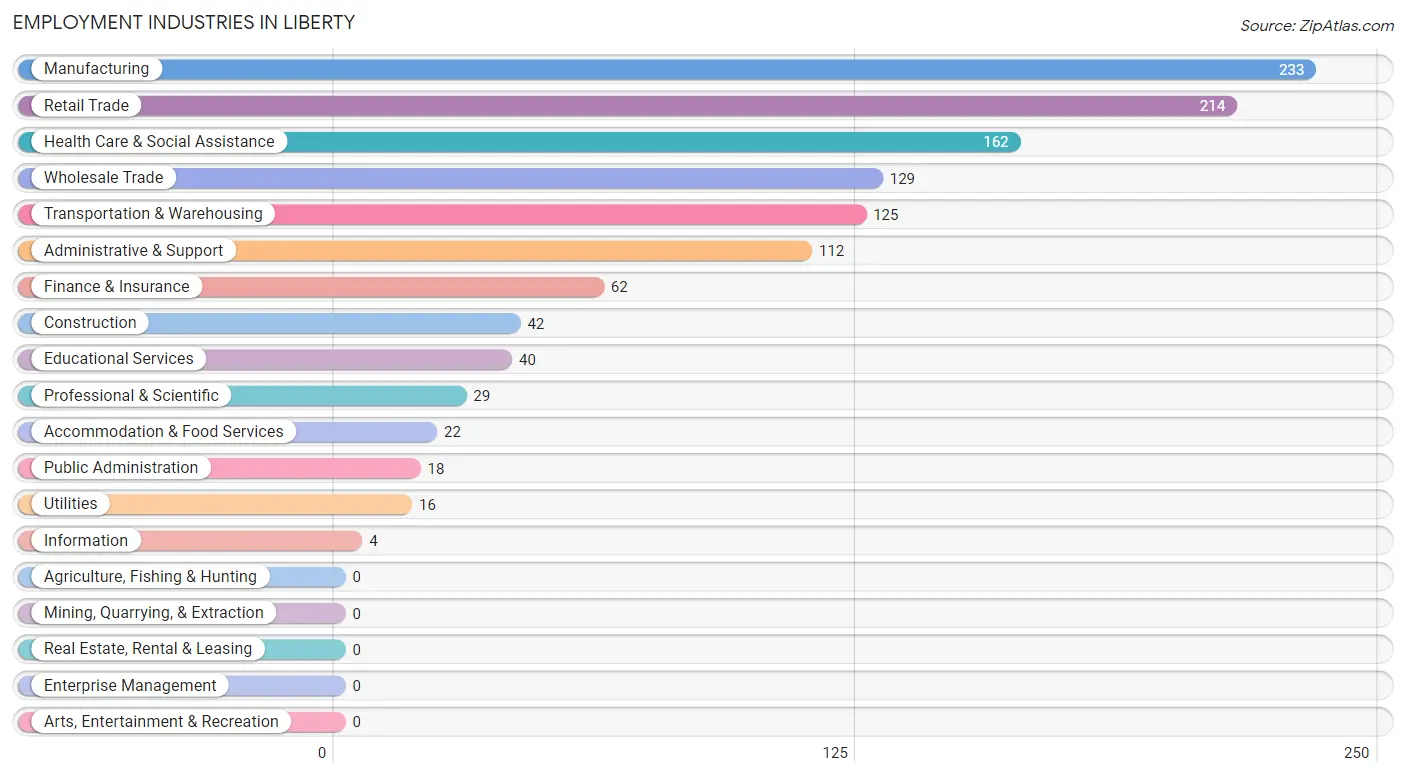
Employment Industries by Sex in Liberty
Employment Industries in Liberty
The major employment industries in Liberty include Manufacturing (233 | 18.5%), Retail Trade (214 | 17.0%), Health Care & Social Assistance (162 | 12.8%), Wholesale Trade (129 | 10.2%), and Transportation & Warehousing (125 | 9.9%).
Employment Industries by Sex in Liberty
The Liberty industries that see more men than women are Administrative & Support (87.5%), Wholesale Trade (82.2%), and Construction (73.8%), whereas the industries that tend to have a higher number of women are Utilities (100.0%), Information (100.0%), and Health Care & Social Assistance (86.4%).
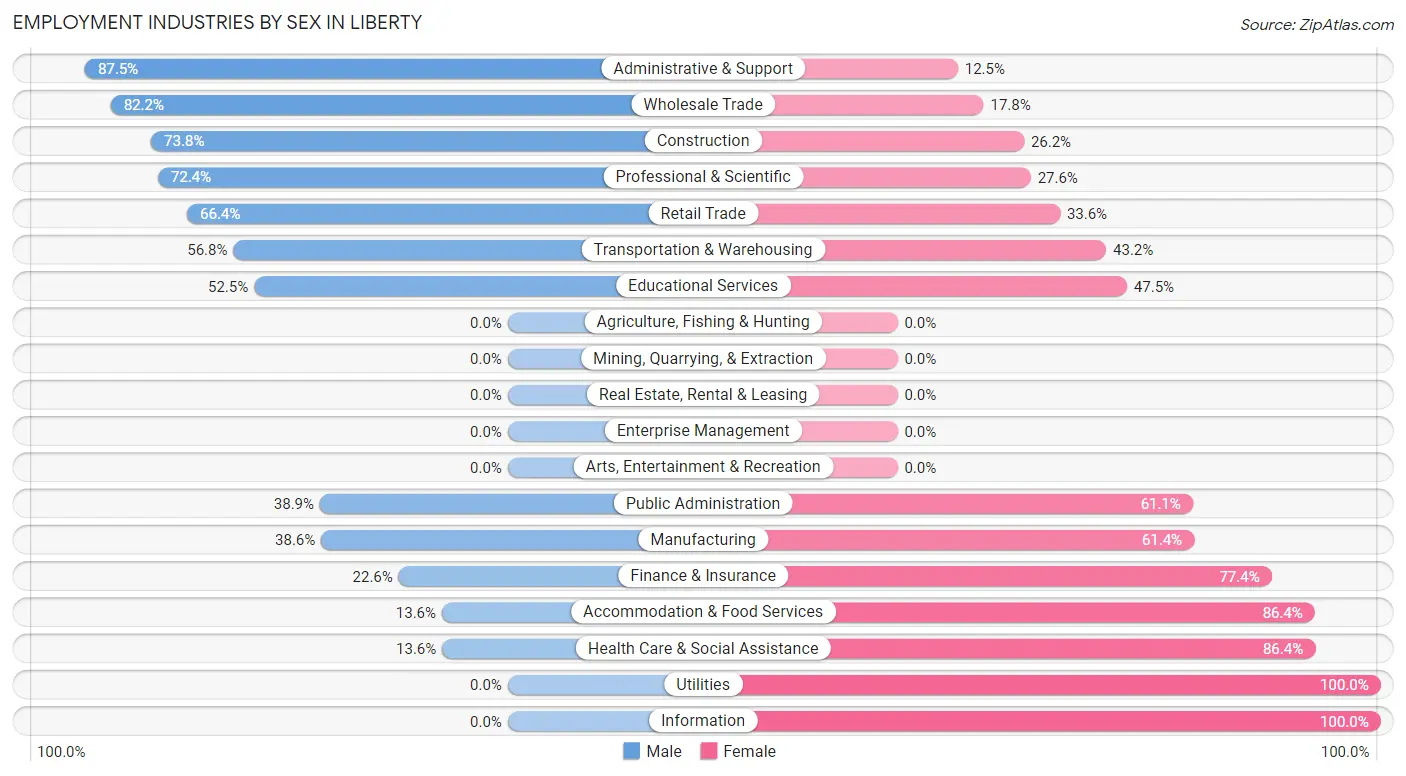
| Industry | Male | Female |
| Agriculture, Fishing & Hunting | 0 (0.0%) | 0 (0.0%) |
| Mining, Quarrying, & Extraction | 0 (0.0%) | 0 (0.0%) |
| Construction | 31 (73.8%) | 11 (26.2%) |
| Manufacturing | 90 (38.6%) | 143 (61.4%) |
| Wholesale Trade | 106 (82.2%) | 23 (17.8%) |
| Retail Trade | 142 (66.4%) | 72 (33.6%) |
| Transportation & Warehousing | 71 (56.8%) | 54 (43.2%) |
| Utilities | 0 (0.0%) | 16 (100.0%) |
| Information | 0 (0.0%) | 4 (100.0%) |
| Finance & Insurance | 14 (22.6%) | 48 (77.4%) |
| Real Estate, Rental & Leasing | 0 (0.0%) | 0 (0.0%) |
| Professional & Scientific | 21 (72.4%) | 8 (27.6%) |
| Enterprise Management | 0 (0.0%) | 0 (0.0%) |
| Administrative & Support | 98 (87.5%) | 14 (12.5%) |
| Educational Services | 21 (52.5%) | 19 (47.5%) |
| Health Care & Social Assistance | 22 (13.6%) | 140 (86.4%) |
| Arts, Entertainment & Recreation | 0 (0.0%) | 0 (0.0%) |
| Accommodation & Food Services | 3 (13.6%) | 19 (86.4%) |
| Public Administration | 7 (38.9%) | 11 (61.1%) |
| Total | 645 (51.1%) | 617 (48.9%) |
Education in Liberty
School Enrollment in Liberty
The most common levels of schooling among the 551 students in Liberty are high school (153 | 27.8%), elementary school (150 | 27.2%), and college / undergraduate (114 | 20.7%).
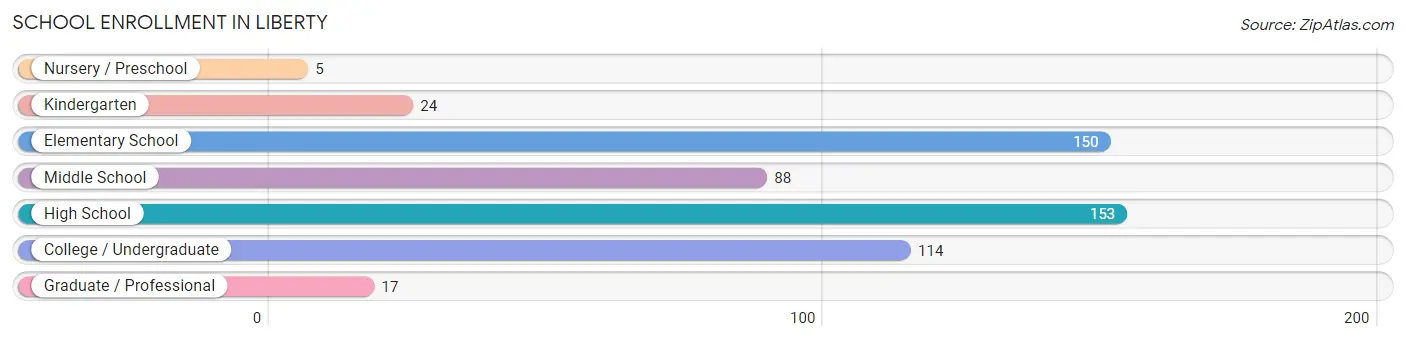
| School Level | # Students | % Students |
| Nursery / Preschool | 5 | 0.9% |
| Kindergarten | 24 | 4.4% |
| Elementary School | 150 | 27.2% |
| Middle School | 88 | 16.0% |
| High School | 153 | 27.8% |
| College / Undergraduate | 114 | 20.7% |
| Graduate / Professional | 17 | 3.1% |
| Total | 551 | 100.0% |
School Enrollment by Age by Funding Source in Liberty
Out of a total of 551 students who are enrolled in schools in Liberty, 89 (16.2%) attend a private institution, while the remaining 462 (83.8%) are enrolled in public schools. The age group of 10 to 14 year olds has the highest likelihood of being enrolled in private schools, with 46 (38.0% in the age bracket) enrolled. Conversely, the age group of 3 to 4 year olds has the lowest likelihood of being enrolled in a private school, with 2 (100.0% in the age bracket) attending a public institution.
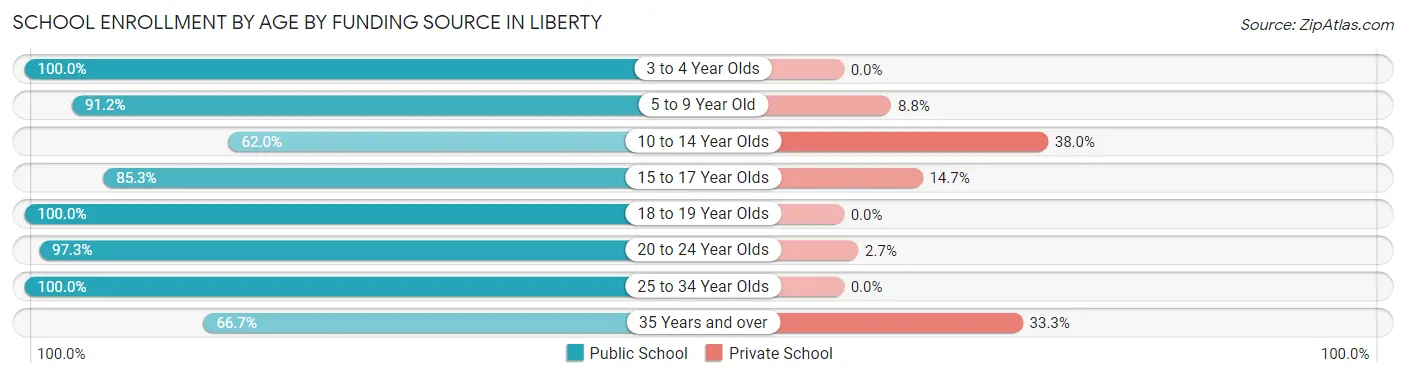
| Age Bracket | Public School | Private School |
| 3 to 4 Year Olds | 2 (100.0%) | 0 (0.0%) |
| 5 to 9 Year Old | 134 (91.2%) | 13 (8.8%) |
| 10 to 14 Year Olds | 75 (62.0%) | 46 (38.0%) |
| 15 to 17 Year Olds | 93 (85.3%) | 16 (14.7%) |
| 18 to 19 Year Olds | 58 (100.0%) | 0 (0.0%) |
| 20 to 24 Year Olds | 36 (97.3%) | 1 (2.7%) |
| 25 to 34 Year Olds | 38 (100.0%) | 0 (0.0%) |
| 35 Years and over | 26 (66.7%) | 13 (33.3%) |
| Total | 462 (83.8%) | 89 (16.2%) |
Educational Attainment by Field of Study in Liberty
Business (57 | 19.3%), arts & humanities (45 | 15.2%), education (42 | 14.2%), science & technology (29 | 9.8%), and communications (25 | 8.5%) are the most common fields of study among 295 individuals in Liberty who have obtained a bachelor's degree or higher.
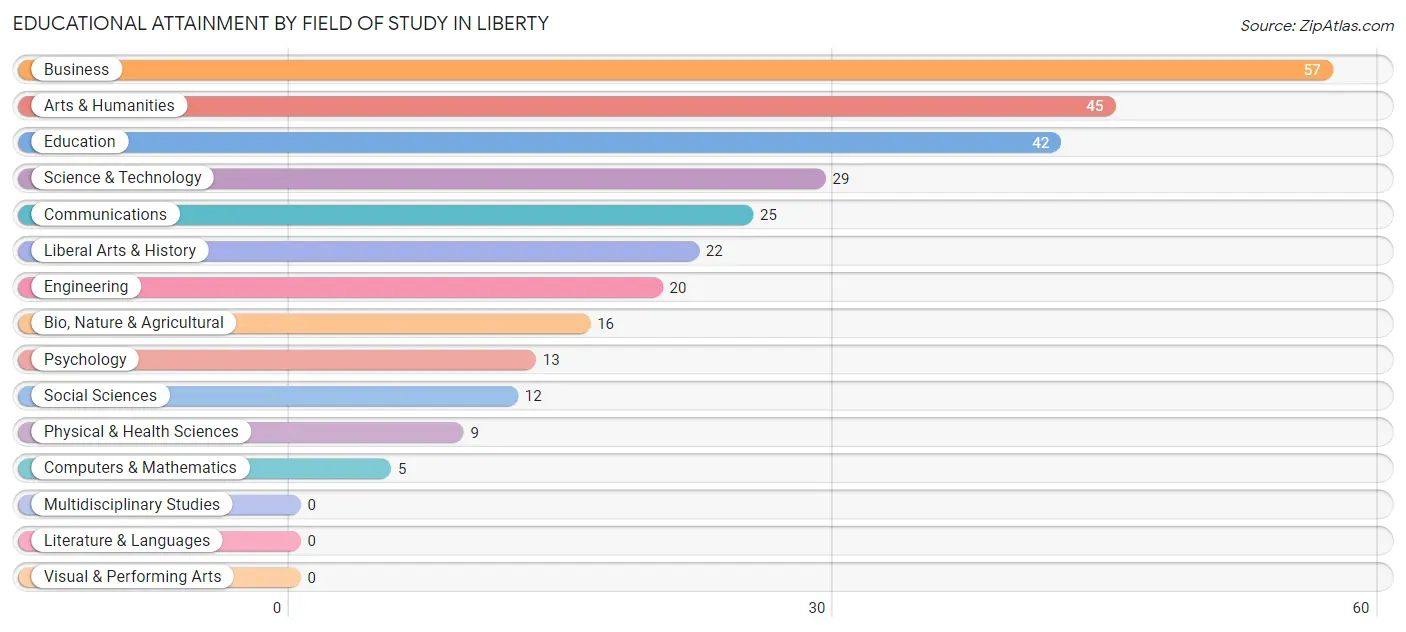
| Field of Study | # Graduates | % Graduates |
| Computers & Mathematics | 5 | 1.7% |
| Bio, Nature & Agricultural | 16 | 5.4% |
| Physical & Health Sciences | 9 | 3.0% |
| Psychology | 13 | 4.4% |
| Social Sciences | 12 | 4.1% |
| Engineering | 20 | 6.8% |
| Multidisciplinary Studies | 0 | 0.0% |
| Science & Technology | 29 | 9.8% |
| Business | 57 | 19.3% |
| Education | 42 | 14.2% |
| Literature & Languages | 0 | 0.0% |
| Liberal Arts & History | 22 | 7.5% |
| Visual & Performing Arts | 0 | 0.0% |
| Communications | 25 | 8.5% |
| Arts & Humanities | 45 | 15.2% |
| Total | 295 | 100.0% |
Transportation & Commute in Liberty
Vehicle Availability by Sex in Liberty
The most prevalent vehicle ownership categories in Liberty are males with 2 vehicles (225, accounting for 35.0%) and females with 2 vehicles (235, making up 38.1%).
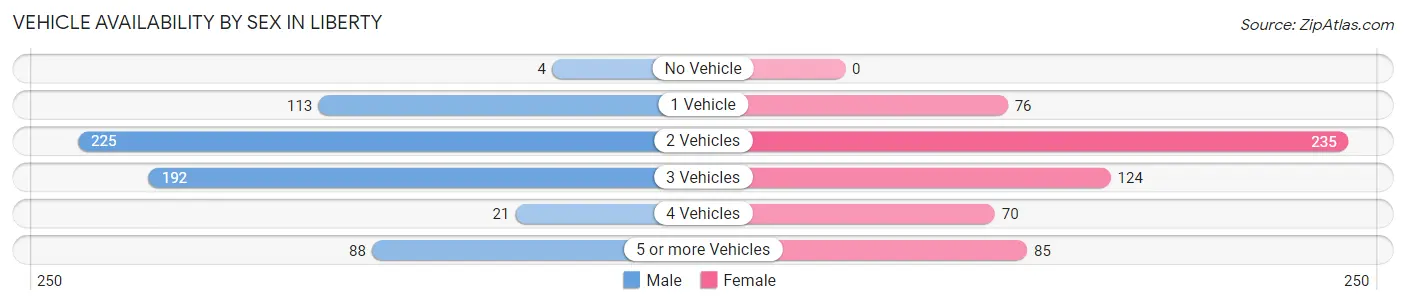
| Vehicles Available | Male | Female |
| No Vehicle | 4 (0.6%) | 0 (0.0%) |
| 1 Vehicle | 113 (17.6%) | 76 (12.9%) |
| 2 Vehicles | 225 (35.0%) | 235 (39.8%) |
| 3 Vehicles | 192 (29.9%) | 124 (21.0%) |
| 4 Vehicles | 21 (3.3%) | 70 (11.9%) |
| 5 or more Vehicles | 88 (13.7%) | 85 (14.4%) |
| Total | 643 (100.0%) | 590 (100.0%) |
Commute Time in Liberty
The most frequently occuring commute durations in Liberty are 30 to 34 minutes (229 commuters, 20.1%), 5 to 9 minutes (210 commuters, 18.5%), and 25 to 29 minutes (168 commuters, 14.8%).
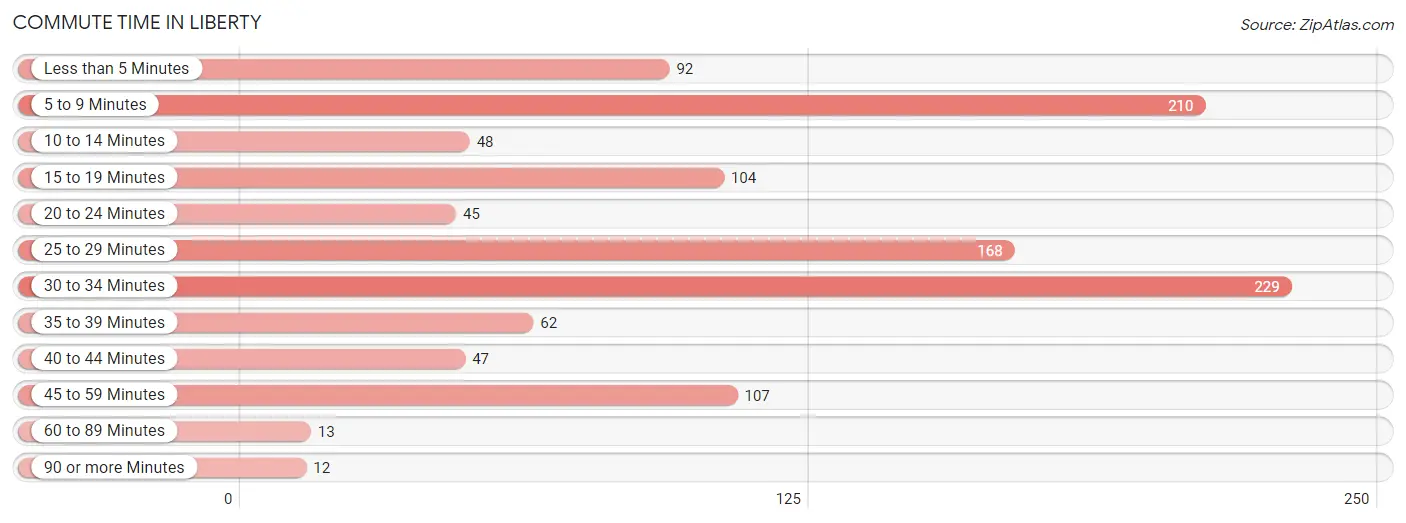
| Commute Time | # Commuters | % Commuters |
| Less than 5 Minutes | 92 | 8.1% |
| 5 to 9 Minutes | 210 | 18.5% |
| 10 to 14 Minutes | 48 | 4.2% |
| 15 to 19 Minutes | 104 | 9.1% |
| 20 to 24 Minutes | 45 | 4.0% |
| 25 to 29 Minutes | 168 | 14.8% |
| 30 to 34 Minutes | 229 | 20.1% |
| 35 to 39 Minutes | 62 | 5.4% |
| 40 to 44 Minutes | 47 | 4.1% |
| 45 to 59 Minutes | 107 | 9.4% |
| 60 to 89 Minutes | 13 | 1.1% |
| 90 or more Minutes | 12 | 1.1% |
Commute Time by Sex in Liberty
The most common commute times in Liberty are 5 to 9 minutes (165 commuters, 26.9%) for males and 30 to 34 minutes (142 commuters, 27.1%) for females.
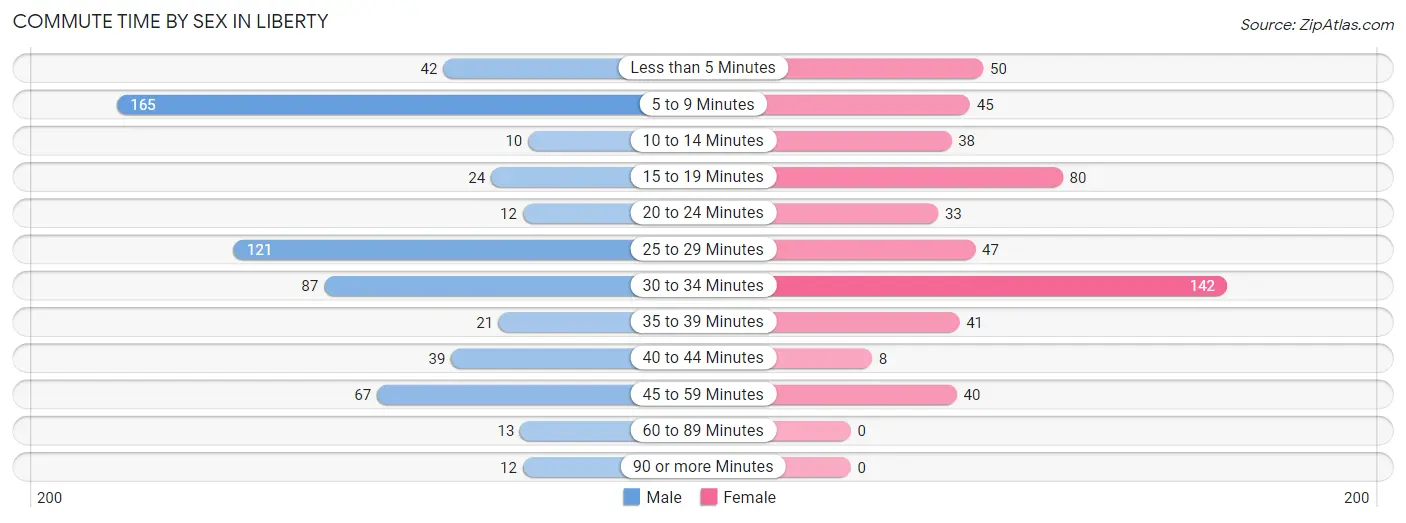
| Commute Time | Male | Female |
| Less than 5 Minutes | 42 (6.9%) | 50 (9.5%) |
| 5 to 9 Minutes | 165 (26.9%) | 45 (8.6%) |
| 10 to 14 Minutes | 10 (1.6%) | 38 (7.2%) |
| 15 to 19 Minutes | 24 (3.9%) | 80 (15.3%) |
| 20 to 24 Minutes | 12 (2.0%) | 33 (6.3%) |
| 25 to 29 Minutes | 121 (19.7%) | 47 (9.0%) |
| 30 to 34 Minutes | 87 (14.2%) | 142 (27.1%) |
| 35 to 39 Minutes | 21 (3.4%) | 41 (7.8%) |
| 40 to 44 Minutes | 39 (6.4%) | 8 (1.5%) |
| 45 to 59 Minutes | 67 (10.9%) | 40 (7.6%) |
| 60 to 89 Minutes | 13 (2.1%) | 0 (0.0%) |
| 90 or more Minutes | 12 (2.0%) | 0 (0.0%) |
Time of Departure to Work by Sex in Liberty
The most frequent times of departure to work in Liberty are 6:30 AM to 6:59 AM (167, 27.2%) for males and 5:30 AM to 5:59 AM (92, 17.6%) for females.
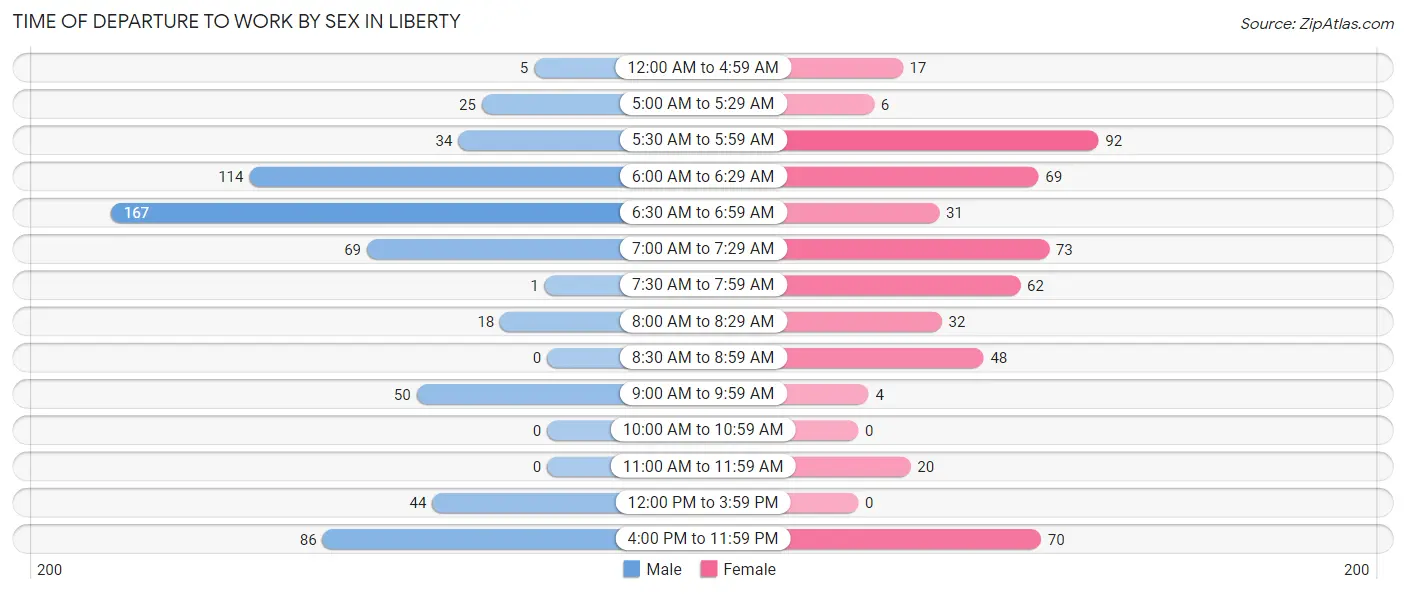
| Time of Departure | Male | Female |
| 12:00 AM to 4:59 AM | 5 (0.8%) | 17 (3.2%) |
| 5:00 AM to 5:29 AM | 25 (4.1%) | 6 (1.1%) |
| 5:30 AM to 5:59 AM | 34 (5.6%) | 92 (17.6%) |
| 6:00 AM to 6:29 AM | 114 (18.6%) | 69 (13.2%) |
| 6:30 AM to 6:59 AM | 167 (27.2%) | 31 (5.9%) |
| 7:00 AM to 7:29 AM | 69 (11.3%) | 73 (13.9%) |
| 7:30 AM to 7:59 AM | 1 (0.2%) | 62 (11.8%) |
| 8:00 AM to 8:29 AM | 18 (2.9%) | 32 (6.1%) |
| 8:30 AM to 8:59 AM | 0 (0.0%) | 48 (9.2%) |
| 9:00 AM to 9:59 AM | 50 (8.2%) | 4 (0.8%) |
| 10:00 AM to 10:59 AM | 0 (0.0%) | 0 (0.0%) |
| 11:00 AM to 11:59 AM | 0 (0.0%) | 20 (3.8%) |
| 12:00 PM to 3:59 PM | 44 (7.2%) | 0 (0.0%) |
| 4:00 PM to 11:59 PM | 86 (14.0%) | 70 (13.4%) |
| Total | 613 (100.0%) | 524 (100.0%) |
Housing Occupancy in Liberty
Occupancy by Ownership in Liberty
Of the total 1,083 dwellings in Liberty, owner-occupied units account for 566 (52.3%), while renter-occupied units make up 517 (47.7%).
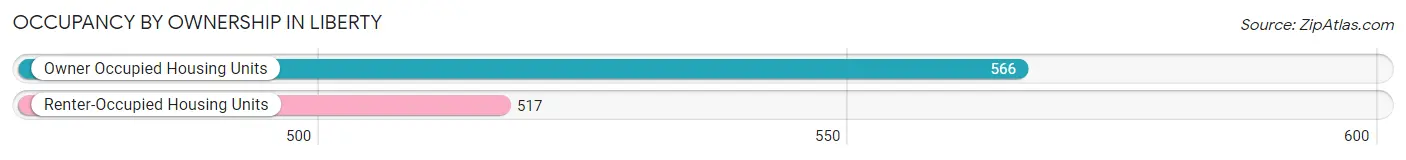
| Occupancy | # Housing Units | % Housing Units |
| Owner Occupied Housing Units | 566 | 52.3% |
| Renter-Occupied Housing Units | 517 | 47.7% |
| Total Occupied Housing Units | 1,083 | 100.0% |
Occupancy by Household Size in Liberty
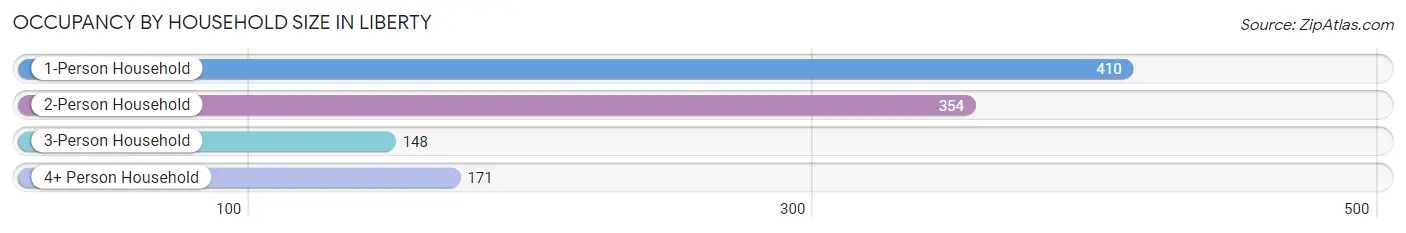
| Household Size | # Housing Units | % Housing Units |
| 1-Person Household | 410 | 37.9% |
| 2-Person Household | 354 | 32.7% |
| 3-Person Household | 148 | 13.7% |
| 4+ Person Household | 171 | 15.8% |
| Total Housing Units | 1,083 | 100.0% |
Occupancy by Ownership by Household Size in Liberty
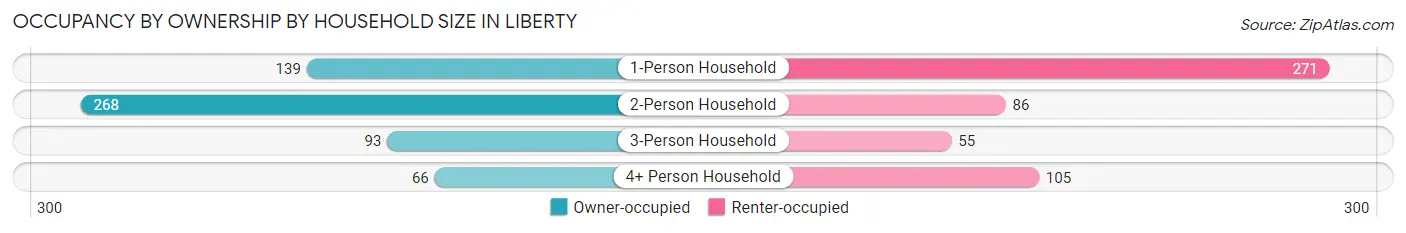
| Household Size | Owner-occupied | Renter-occupied |
| 1-Person Household | 139 (33.9%) | 271 (66.1%) |
| 2-Person Household | 268 (75.7%) | 86 (24.3%) |
| 3-Person Household | 93 (62.8%) | 55 (37.2%) |
| 4+ Person Household | 66 (38.6%) | 105 (61.4%) |
| Total Housing Units | 566 (52.3%) | 517 (47.7%) |
Occupancy by Educational Attainment in Liberty
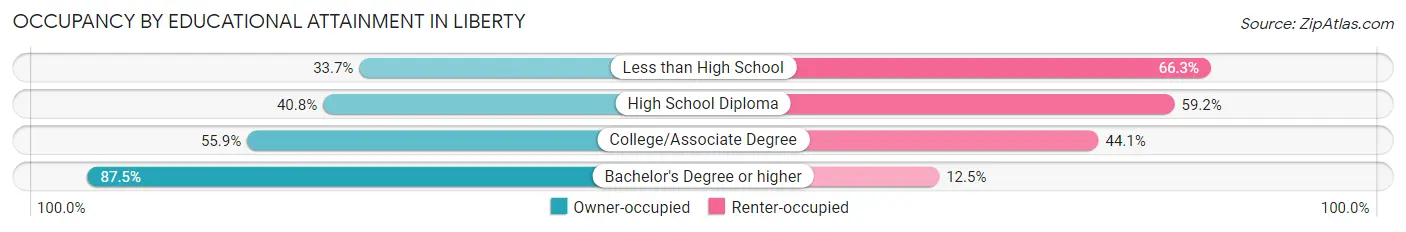
| Household Size | Owner-occupied | Renter-occupied |
| Less than High School | 68 (33.7%) | 134 (66.3%) |
| High School Diploma | 136 (40.8%) | 197 (59.2%) |
| College/Associate Degree | 208 (55.9%) | 164 (44.1%) |
| Bachelor's Degree or higher | 154 (87.5%) | 22 (12.5%) |
Occupancy by Age of Householder in Liberty
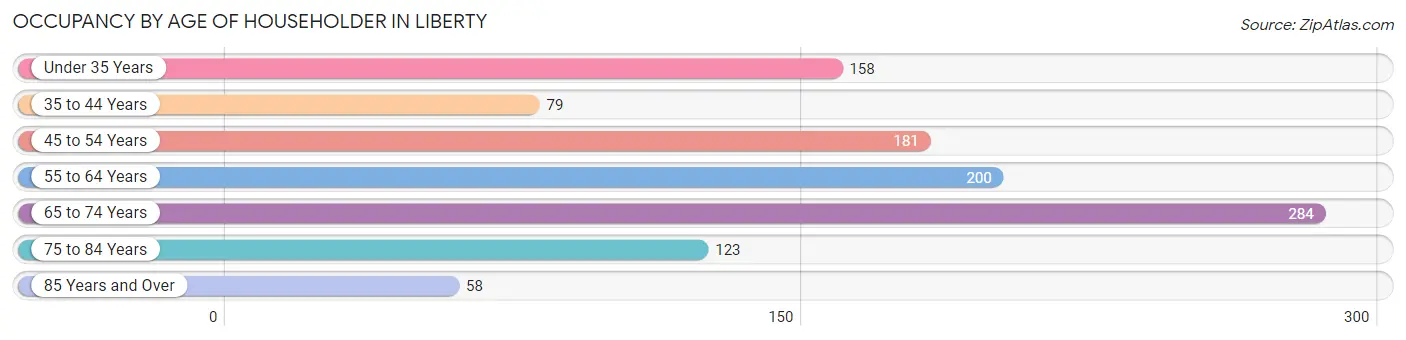
| Age Bracket | # Households | % Households |
| Under 35 Years | 158 | 14.6% |
| 35 to 44 Years | 79 | 7.3% |
| 45 to 54 Years | 181 | 16.7% |
| 55 to 64 Years | 200 | 18.5% |
| 65 to 74 Years | 284 | 26.2% |
| 75 to 84 Years | 123 | 11.4% |
| 85 Years and Over | 58 | 5.4% |
| Total | 1,083 | 100.0% |
Housing Finances in Liberty
Median Income by Occupancy in Liberty
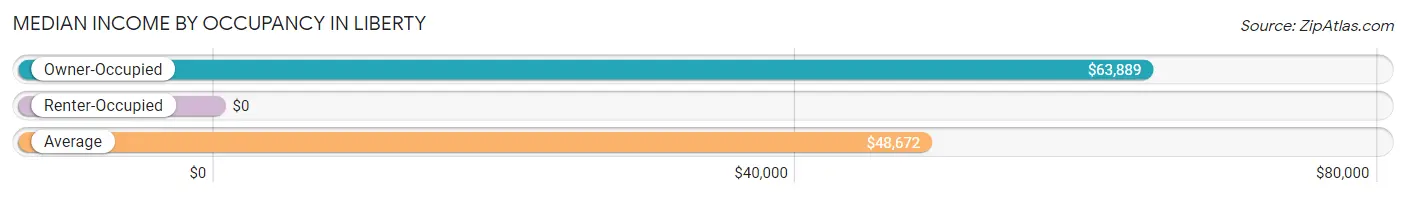
| Occupancy Type | # Households | Median Income |
| Owner-Occupied | 566 (52.3%) | $63,889 |
| Renter-Occupied | 517 (47.7%) | $0 |
| Average | 1,083 (100.0%) | $48,672 |
Occupancy by Householder Income Bracket in Liberty
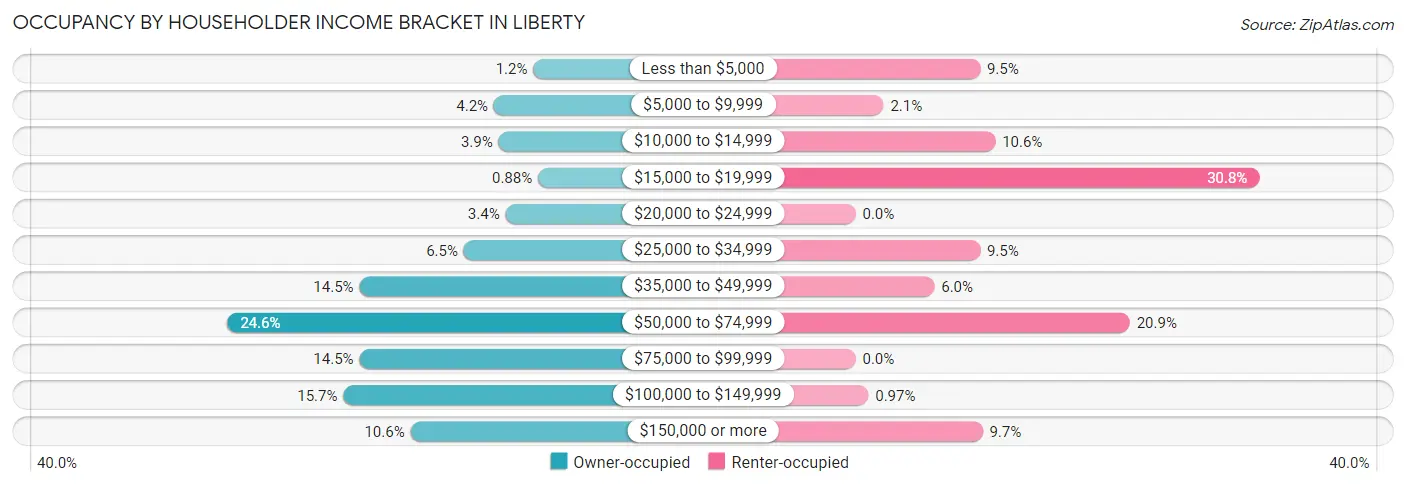
| Income Bracket | Owner-occupied | Renter-occupied |
| Less than $5,000 | 7 (1.2%) | 49 (9.5%) |
| $5,000 to $9,999 | 24 (4.2%) | 11 (2.1%) |
| $10,000 to $14,999 | 22 (3.9%) | 55 (10.6%) |
| $15,000 to $19,999 | 5 (0.9%) | 159 (30.7%) |
| $20,000 to $24,999 | 19 (3.4%) | 0 (0.0%) |
| $25,000 to $34,999 | 37 (6.5%) | 49 (9.5%) |
| $35,000 to $49,999 | 82 (14.5%) | 31 (6.0%) |
| $50,000 to $74,999 | 139 (24.6%) | 108 (20.9%) |
| $75,000 to $99,999 | 82 (14.5%) | 0 (0.0%) |
| $100,000 to $149,999 | 89 (15.7%) | 5 (1.0%) |
| $150,000 or more | 60 (10.6%) | 50 (9.7%) |
| Total | 566 (100.0%) | 517 (100.0%) |
Monthly Housing Cost Tiers in Liberty
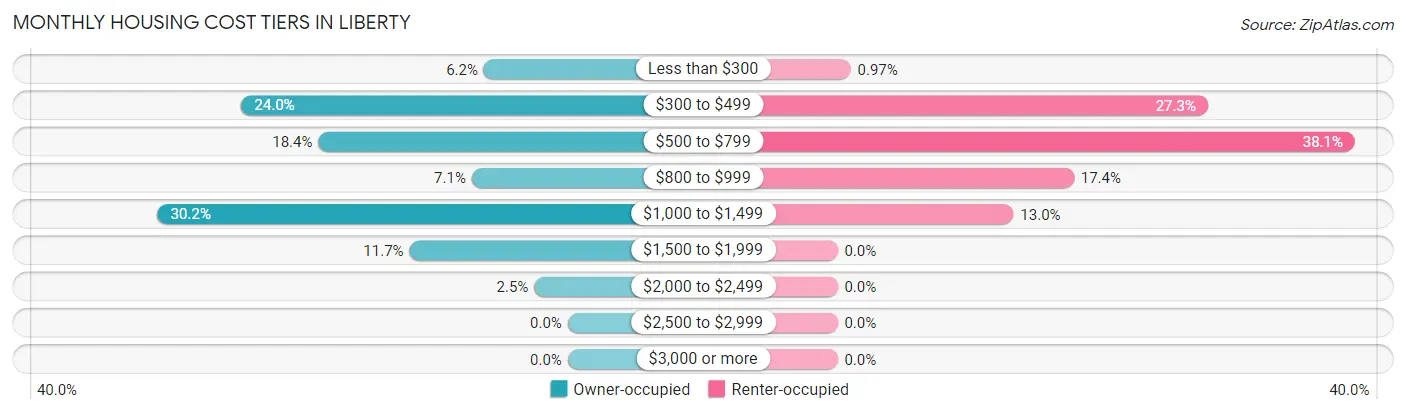
| Monthly Cost | Owner-occupied | Renter-occupied |
| Less than $300 | 35 (6.2%) | 5 (1.0%) |
| $300 to $499 | 136 (24.0%) | 141 (27.3%) |
| $500 to $799 | 104 (18.4%) | 197 (38.1%) |
| $800 to $999 | 40 (7.1%) | 90 (17.4%) |
| $1,000 to $1,499 | 171 (30.2%) | 67 (13.0%) |
| $1,500 to $1,999 | 66 (11.7%) | 0 (0.0%) |
| $2,000 to $2,499 | 14 (2.5%) | 0 (0.0%) |
| $2,500 to $2,999 | 0 (0.0%) | 0 (0.0%) |
| $3,000 or more | 0 (0.0%) | 0 (0.0%) |
| Total | 566 (100.0%) | 517 (100.0%) |
Physical Housing Characteristics in Liberty
Housing Structures in Liberty
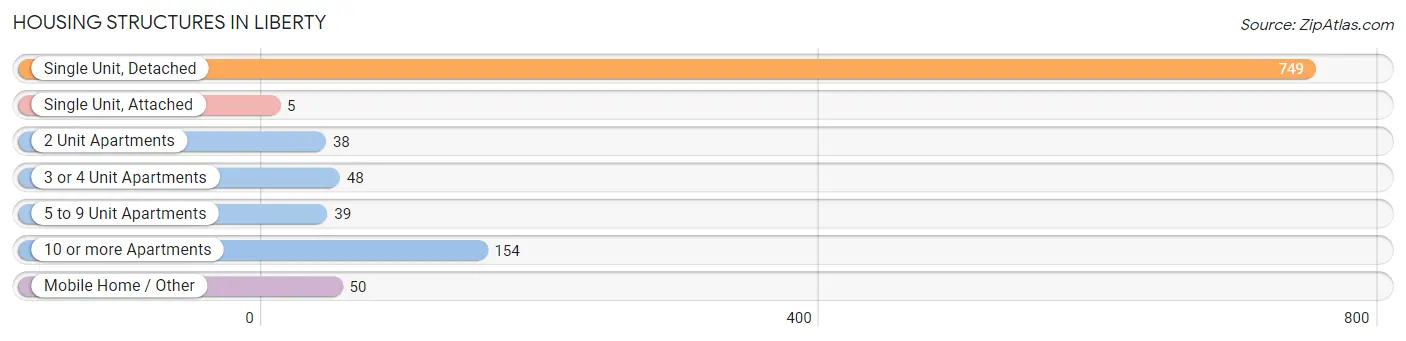
| Structure Type | # Housing Units | % Housing Units |
| Single Unit, Detached | 749 | 69.2% |
| Single Unit, Attached | 5 | 0.5% |
| 2 Unit Apartments | 38 | 3.5% |
| 3 or 4 Unit Apartments | 48 | 4.4% |
| 5 to 9 Unit Apartments | 39 | 3.6% |
| 10 or more Apartments | 154 | 14.2% |
| Mobile Home / Other | 50 | 4.6% |
| Total | 1,083 | 100.0% |
Housing Structures by Occupancy in Liberty
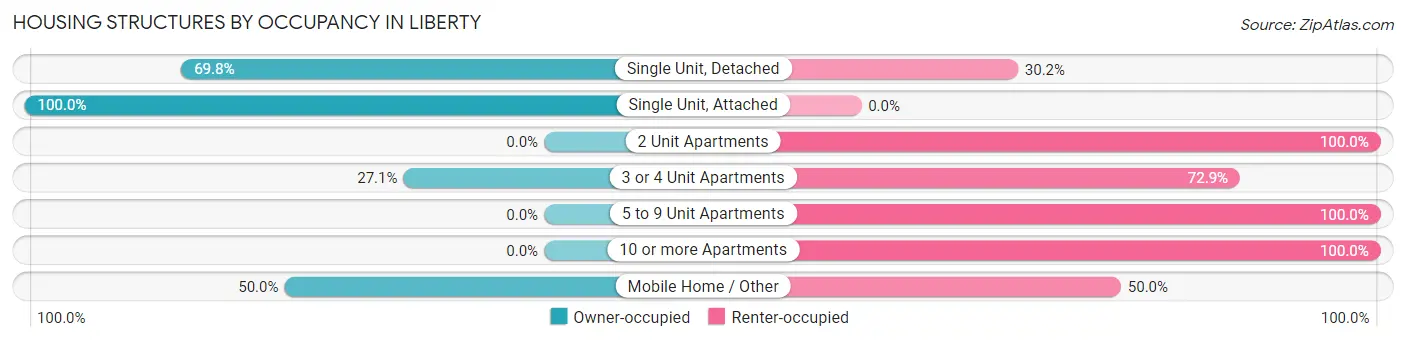
| Structure Type | Owner-occupied | Renter-occupied |
| Single Unit, Detached | 523 (69.8%) | 226 (30.2%) |
| Single Unit, Attached | 5 (100.0%) | 0 (0.0%) |
| 2 Unit Apartments | 0 (0.0%) | 38 (100.0%) |
| 3 or 4 Unit Apartments | 13 (27.1%) | 35 (72.9%) |
| 5 to 9 Unit Apartments | 0 (0.0%) | 39 (100.0%) |
| 10 or more Apartments | 0 (0.0%) | 154 (100.0%) |
| Mobile Home / Other | 25 (50.0%) | 25 (50.0%) |
| Total | 566 (52.3%) | 517 (47.7%) |
Housing Structures by Number of Rooms in Liberty
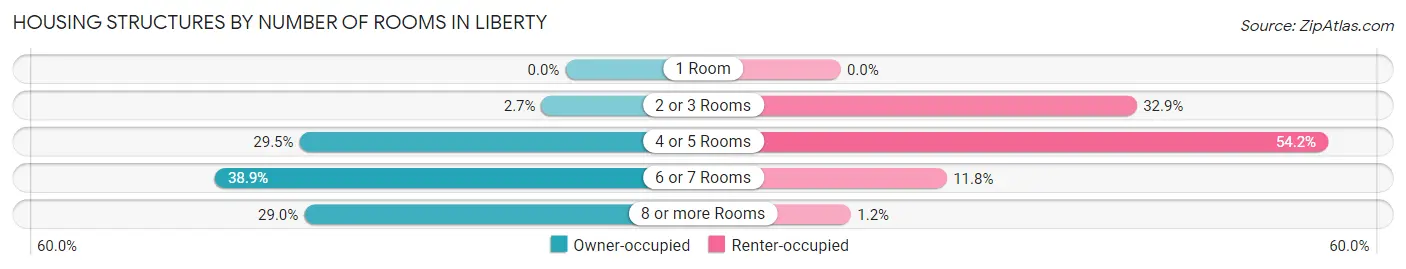
| Number of Rooms | Owner-occupied | Renter-occupied |
| 1 Room | 0 (0.0%) | 0 (0.0%) |
| 2 or 3 Rooms | 15 (2.6%) | 170 (32.9%) |
| 4 or 5 Rooms | 167 (29.5%) | 280 (54.2%) |
| 6 or 7 Rooms | 220 (38.9%) | 61 (11.8%) |
| 8 or more Rooms | 164 (29.0%) | 6 (1.2%) |
| Total | 566 (100.0%) | 517 (100.0%) |
Housing Structure by Heating Type in Liberty
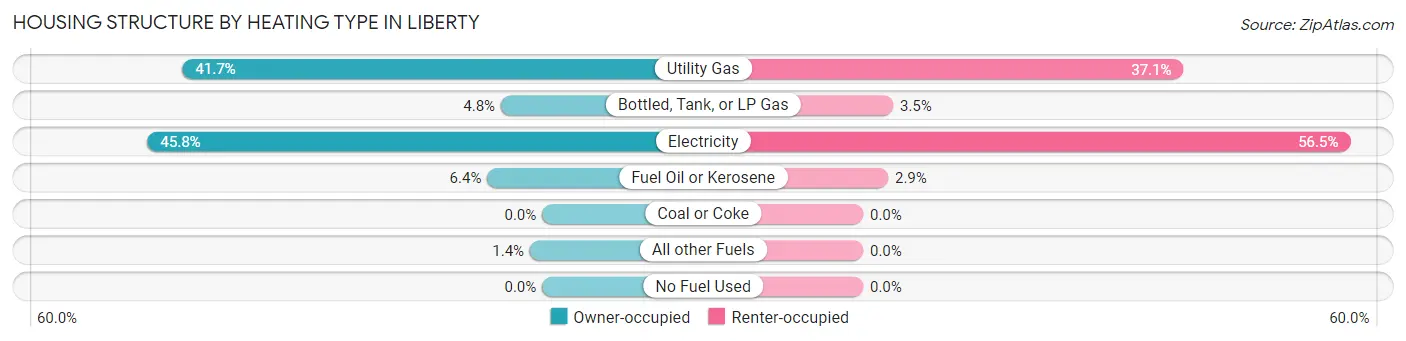
| Heating Type | Owner-occupied | Renter-occupied |
| Utility Gas | 236 (41.7%) | 192 (37.1%) |
| Bottled, Tank, or LP Gas | 27 (4.8%) | 18 (3.5%) |
| Electricity | 259 (45.8%) | 292 (56.5%) |
| Fuel Oil or Kerosene | 36 (6.4%) | 15 (2.9%) |
| Coal or Coke | 0 (0.0%) | 0 (0.0%) |
| All other Fuels | 8 (1.4%) | 0 (0.0%) |
| No Fuel Used | 0 (0.0%) | 0 (0.0%) |
| Total | 566 (100.0%) | 517 (100.0%) |
Household Vehicle Usage in Liberty
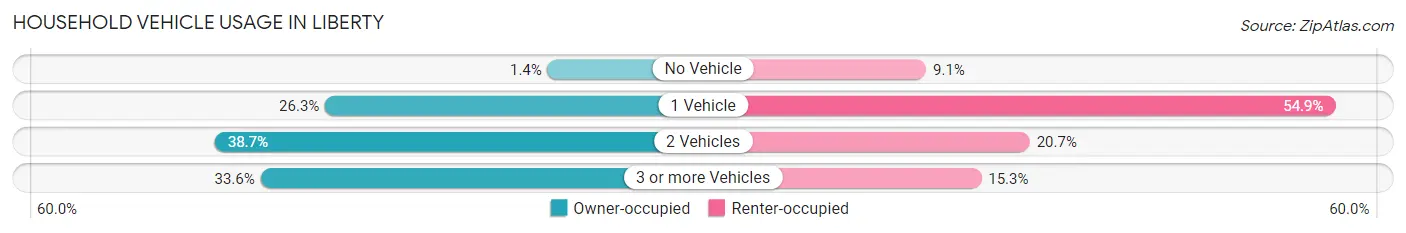
| Vehicles per Household | Owner-occupied | Renter-occupied |
| No Vehicle | 8 (1.4%) | 47 (9.1%) |
| 1 Vehicle | 149 (26.3%) | 284 (54.9%) |
| 2 Vehicles | 219 (38.7%) | 107 (20.7%) |
| 3 or more Vehicles | 190 (33.6%) | 79 (15.3%) |
| Total | 566 (100.0%) | 517 (100.0%) |
Real Estate & Mortgages in Liberty
Real Estate and Mortgage Overview in Liberty
| Characteristic | Without Mortgage | With Mortgage |
| Housing Units | 250 | 316 |
| Median Property Value | $125,800 | $183,500 |
| Median Household Income | $43,333 | $60 |
| Monthly Housing Costs | $447 | $0 |
| Real Estate Taxes | $940 | $1 |
Property Value by Mortgage Status in Liberty
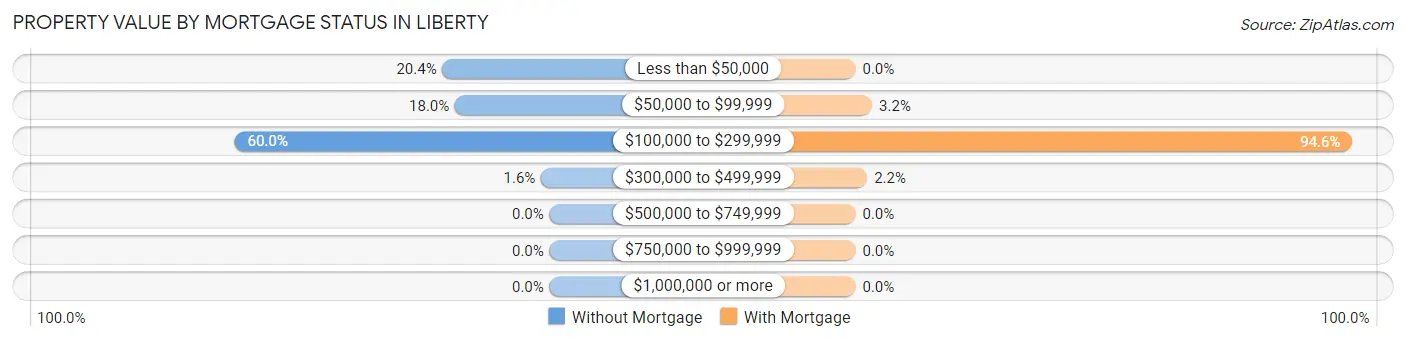
| Property Value | Without Mortgage | With Mortgage |
| Less than $50,000 | 51 (20.4%) | 0 (0.0%) |
| $50,000 to $99,999 | 45 (18.0%) | 10 (3.2%) |
| $100,000 to $299,999 | 150 (60.0%) | 299 (94.6%) |
| $300,000 to $499,999 | 4 (1.6%) | 7 (2.2%) |
| $500,000 to $749,999 | 0 (0.0%) | 0 (0.0%) |
| $750,000 to $999,999 | 0 (0.0%) | 0 (0.0%) |
| $1,000,000 or more | 0 (0.0%) | 0 (0.0%) |
| Total | 250 (100.0%) | 316 (100.0%) |
Household Income by Mortgage Status in Liberty
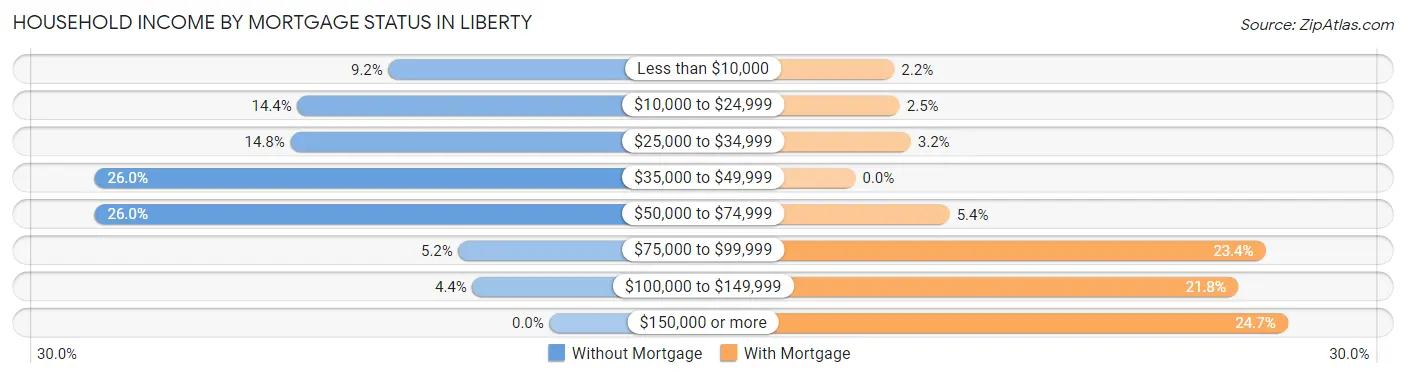
| Household Income | Without Mortgage | With Mortgage |
| Less than $10,000 | 23 (9.2%) | 7 (2.2%) |
| $10,000 to $24,999 | 36 (14.4%) | 8 (2.5%) |
| $25,000 to $34,999 | 37 (14.8%) | 10 (3.2%) |
| $35,000 to $49,999 | 65 (26.0%) | 0 (0.0%) |
| $50,000 to $74,999 | 65 (26.0%) | 17 (5.4%) |
| $75,000 to $99,999 | 13 (5.2%) | 74 (23.4%) |
| $100,000 to $149,999 | 11 (4.4%) | 69 (21.8%) |
| $150,000 or more | 0 (0.0%) | 78 (24.7%) |
| Total | 250 (100.0%) | 316 (100.0%) |
Property Value to Household Income Ratio in Liberty
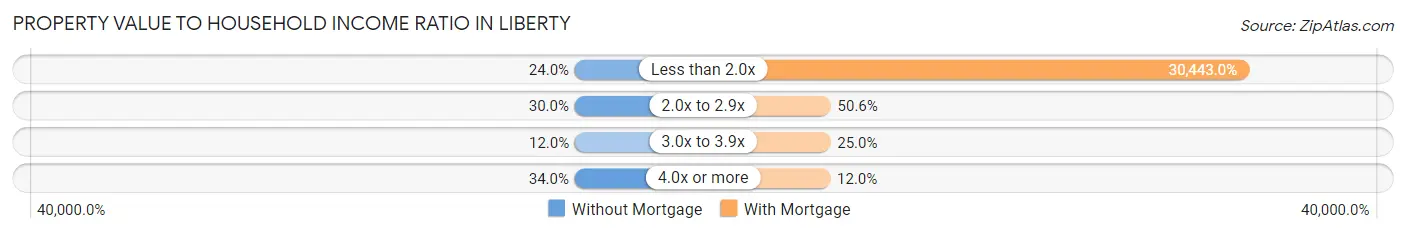
| Value-to-Income Ratio | Without Mortgage | With Mortgage |
| Less than 2.0x | 60 (24.0%) | 96,200 (30,443.0%) |
| 2.0x to 2.9x | 75 (30.0%) | 160 (50.6%) |
| 3.0x to 3.9x | 30 (12.0%) | 79 (25.0%) |
| 4.0x or more | 85 (34.0%) | 38 (12.0%) |
| Total | 250 (100.0%) | 316 (100.0%) |
Real Estate Taxes by Mortgage Status in Liberty
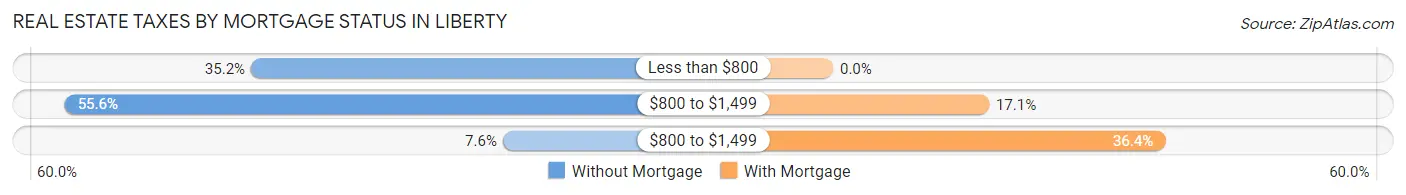
| Property Taxes | Without Mortgage | With Mortgage |
| Less than $800 | 88 (35.2%) | 0 (0.0%) |
| $800 to $1,499 | 139 (55.6%) | 54 (17.1%) |
| $800 to $1,499 | 19 (7.6%) | 115 (36.4%) |
| Total | 250 (100.0%) | 316 (100.0%) |
Health & Disability in Liberty
Health Insurance Coverage by Age in Liberty
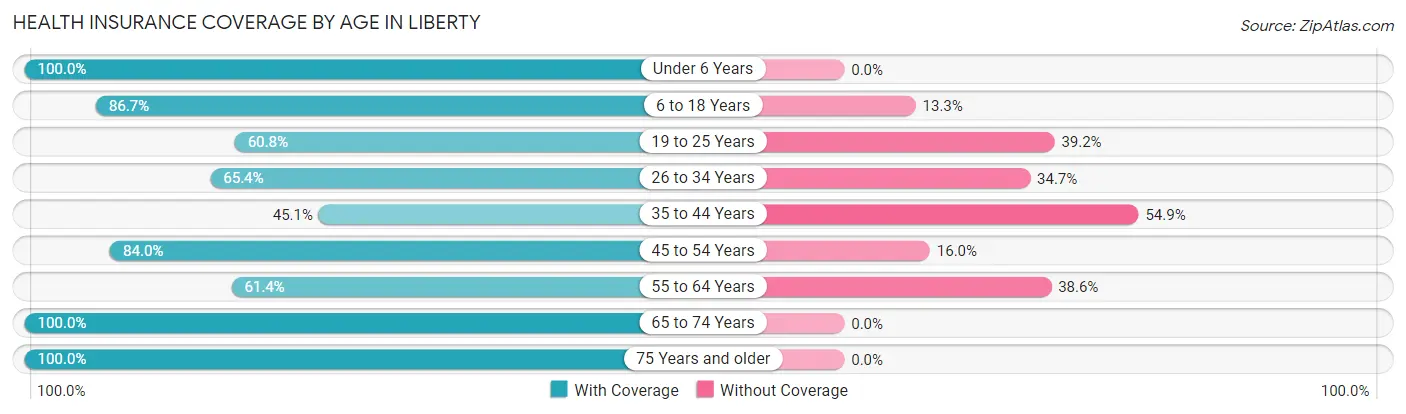
| Age Bracket | With Coverage | Without Coverage |
| Under 6 Years | 185 (100.0%) | 0 (0.0%) |
| 6 to 18 Years | 339 (86.7%) | 52 (13.3%) |
| 19 to 25 Years | 180 (60.8%) | 116 (39.2%) |
| 26 to 34 Years | 198 (65.3%) | 105 (34.6%) |
| 35 to 44 Years | 116 (45.1%) | 141 (54.9%) |
| 45 to 54 Years | 237 (84.0%) | 45 (16.0%) |
| 55 to 64 Years | 207 (61.4%) | 130 (38.6%) |
| 65 to 74 Years | 350 (100.0%) | 0 (0.0%) |
| 75 Years and older | 260 (100.0%) | 0 (0.0%) |
| Total | 2,072 (77.9%) | 589 (22.1%) |
Health Insurance Coverage by Citizenship Status in Liberty
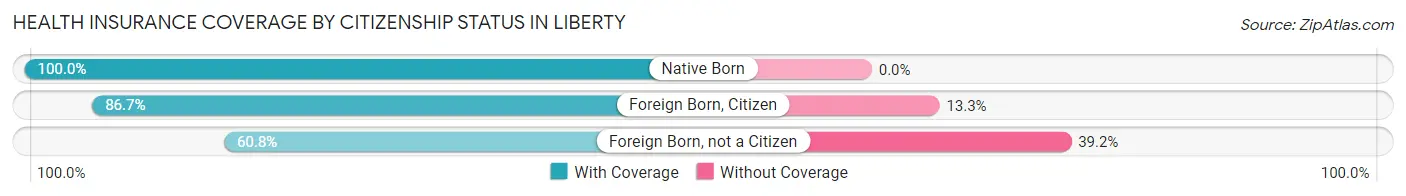
| Citizenship Status | With Coverage | Without Coverage |
| Native Born | 185 (100.0%) | 0 (0.0%) |
| Foreign Born, Citizen | 339 (86.7%) | 52 (13.3%) |
| Foreign Born, not a Citizen | 180 (60.8%) | 116 (39.2%) |
Health Insurance Coverage by Household Income in Liberty
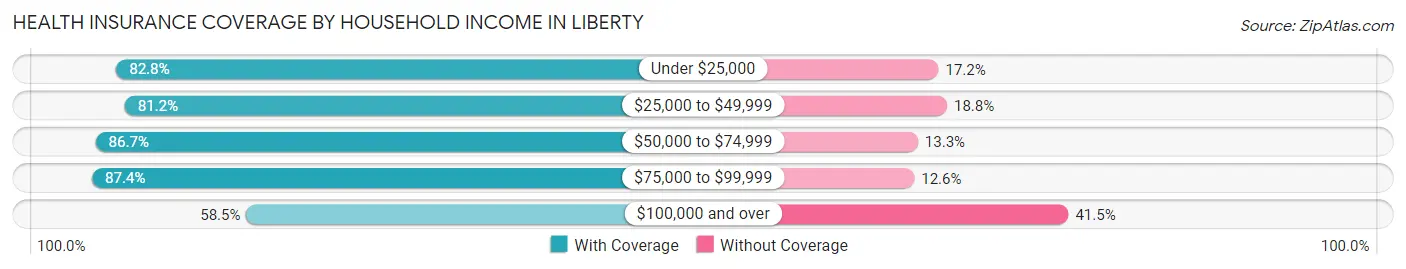
| Household Income | With Coverage | Without Coverage |
| Under $25,000 | 554 (82.8%) | 115 (17.2%) |
| $25,000 to $49,999 | 320 (81.2%) | 74 (18.8%) |
| $50,000 to $74,999 | 540 (86.7%) | 83 (13.3%) |
| $75,000 to $99,999 | 242 (87.4%) | 35 (12.6%) |
| $100,000 and over | 397 (58.5%) | 282 (41.5%) |
Public vs Private Health Insurance Coverage by Age in Liberty
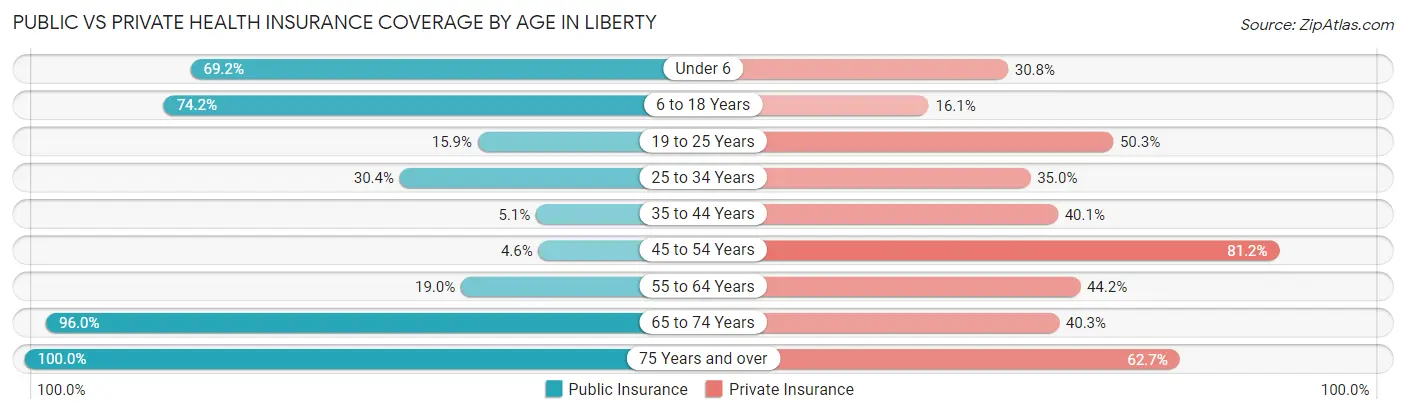
| Age Bracket | Public Insurance | Private Insurance |
| Under 6 | 128 (69.2%) | 57 (30.8%) |
| 6 to 18 Years | 290 (74.2%) | 63 (16.1%) |
| 19 to 25 Years | 47 (15.9%) | 149 (50.3%) |
| 25 to 34 Years | 92 (30.4%) | 106 (35.0%) |
| 35 to 44 Years | 13 (5.1%) | 103 (40.1%) |
| 45 to 54 Years | 13 (4.6%) | 229 (81.2%) |
| 55 to 64 Years | 64 (19.0%) | 149 (44.2%) |
| 65 to 74 Years | 336 (96.0%) | 141 (40.3%) |
| 75 Years and over | 260 (100.0%) | 163 (62.7%) |
| Total | 1,243 (46.7%) | 1,160 (43.6%) |
Disability Status by Sex by Age in Liberty
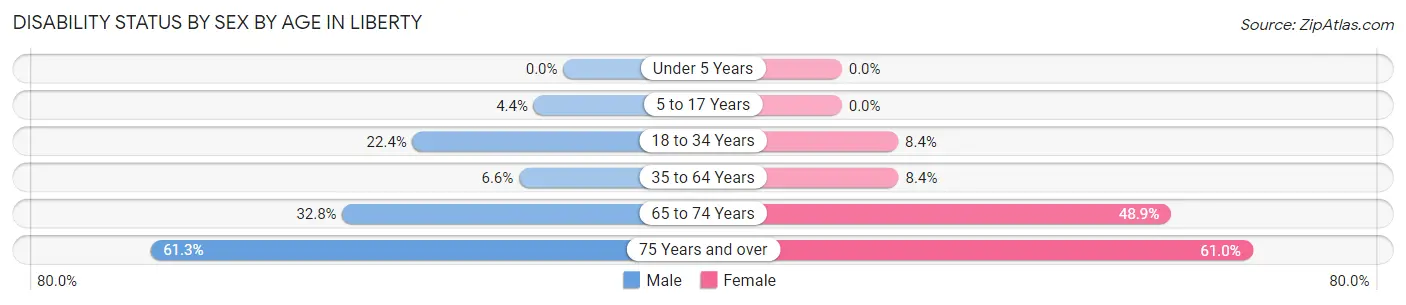
| Age Bracket | Male | Female |
| Under 5 Years | 0 (0.0%) | 0 (0.0%) |
| 5 to 17 Years | 10 (4.4%) | 0 (0.0%) |
| 18 to 34 Years | 79 (22.4%) | 24 (8.4%) |
| 35 to 64 Years | 28 (6.6%) | 38 (8.4%) |
| 65 to 74 Years | 41 (32.8%) | 110 (48.9%) |
| 75 Years and over | 73 (61.3%) | 86 (61.0%) |
Disability Class by Sex by Age in Liberty
Disability Class: Hearing Difficulty
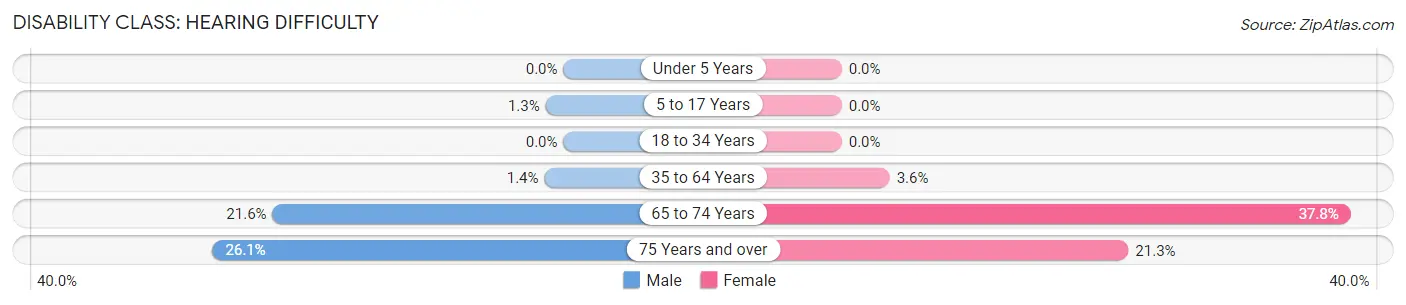
| Age Bracket | Male | Female |
| Under 5 Years | 0 (0.0%) | 0 (0.0%) |
| 5 to 17 Years | 3 (1.3%) | 0 (0.0%) |
| 18 to 34 Years | 0 (0.0%) | 0 (0.0%) |
| 35 to 64 Years | 6 (1.4%) | 16 (3.6%) |
| 65 to 74 Years | 27 (21.6%) | 85 (37.8%) |
| 75 Years and over | 31 (26.1%) | 30 (21.3%) |
Disability Class: Vision Difficulty
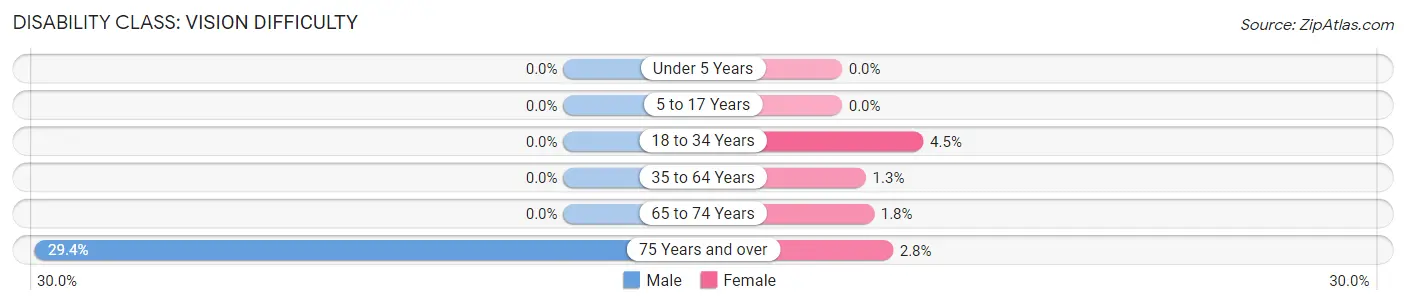
| Age Bracket | Male | Female |
| Under 5 Years | 0 (0.0%) | 0 (0.0%) |
| 5 to 17 Years | 0 (0.0%) | 0 (0.0%) |
| 18 to 34 Years | 0 (0.0%) | 13 (4.5%) |
| 35 to 64 Years | 0 (0.0%) | 6 (1.3%) |
| 65 to 74 Years | 0 (0.0%) | 4 (1.8%) |
| 75 Years and over | 35 (29.4%) | 4 (2.8%) |
Disability Class: Cognitive Difficulty
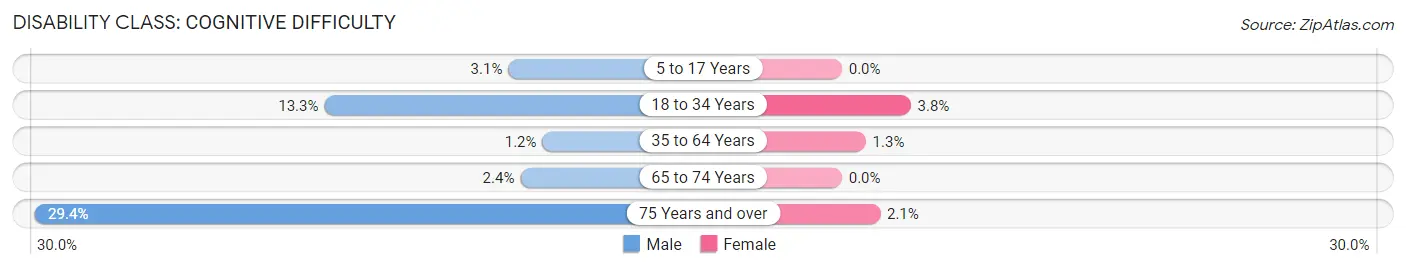
| Age Bracket | Male | Female |
| 5 to 17 Years | 7 (3.1%) | 0 (0.0%) |
| 18 to 34 Years | 47 (13.3%) | 11 (3.8%) |
| 35 to 64 Years | 5 (1.2%) | 6 (1.3%) |
| 65 to 74 Years | 3 (2.4%) | 0 (0.0%) |
| 75 Years and over | 35 (29.4%) | 3 (2.1%) |
Disability Class: Ambulatory Difficulty
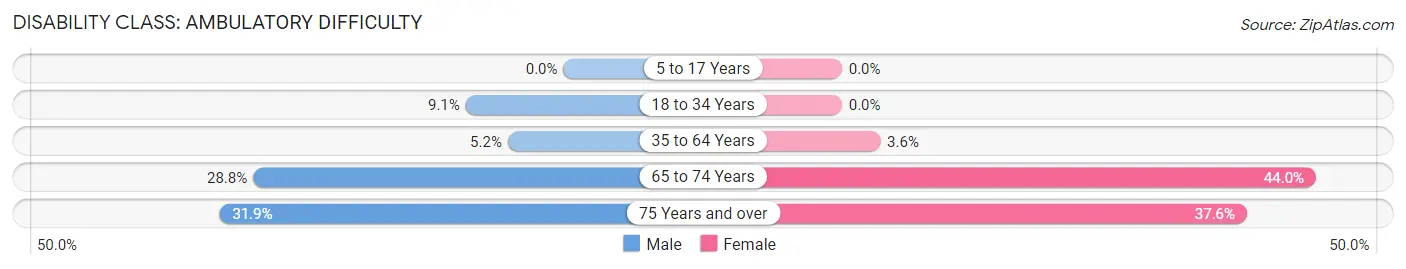
| Age Bracket | Male | Female |
| 5 to 17 Years | 0 (0.0%) | 0 (0.0%) |
| 18 to 34 Years | 32 (9.1%) | 0 (0.0%) |
| 35 to 64 Years | 22 (5.2%) | 16 (3.6%) |
| 65 to 74 Years | 36 (28.8%) | 99 (44.0%) |
| 75 Years and over | 38 (31.9%) | 53 (37.6%) |
Disability Class: Self-Care Difficulty
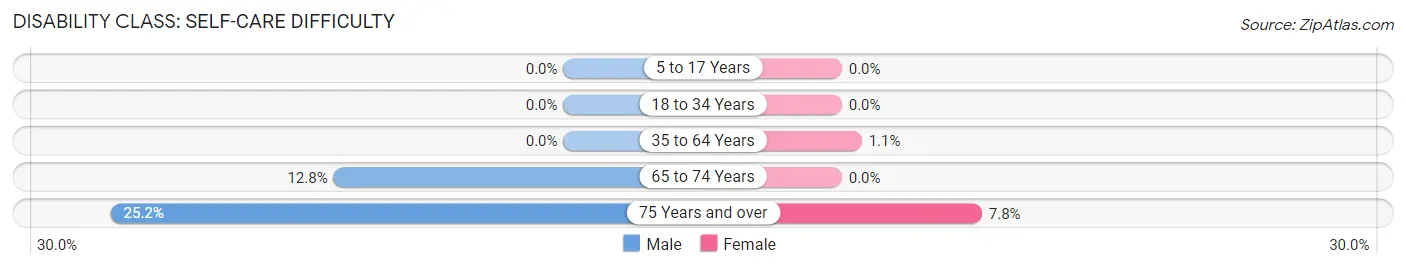
| Age Bracket | Male | Female |
| 5 to 17 Years | 0 (0.0%) | 0 (0.0%) |
| 18 to 34 Years | 0 (0.0%) | 0 (0.0%) |
| 35 to 64 Years | 0 (0.0%) | 5 (1.1%) |
| 65 to 74 Years | 16 (12.8%) | 0 (0.0%) |
| 75 Years and over | 30 (25.2%) | 11 (7.8%) |
Technology Access in Liberty
Computing Device Access in Liberty
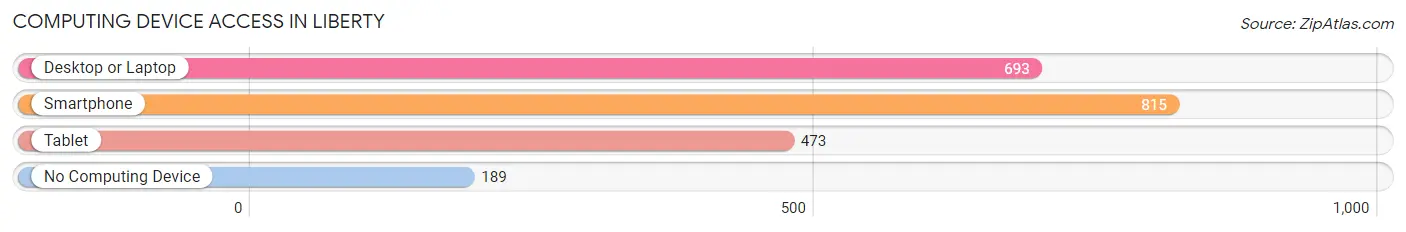
| Device Type | # Households | % Households |
| Desktop or Laptop | 693 | 64.0% |
| Smartphone | 815 | 75.2% |
| Tablet | 473 | 43.7% |
| No Computing Device | 189 | 17.4% |
| Total | 1,083 | 100.0% |
Internet Access in Liberty
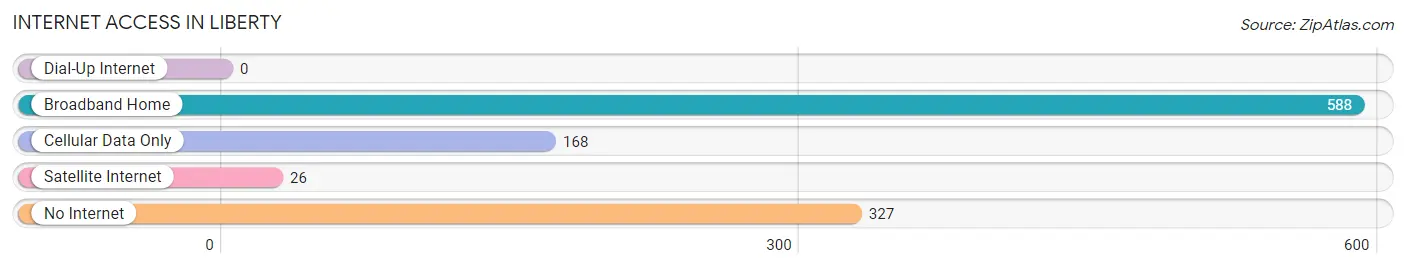
| Internet Type | # Households | % Households |
| Dial-Up Internet | 0 | 0.0% |
| Broadband Home | 588 | 54.3% |
| Cellular Data Only | 168 | 15.5% |
| Satellite Internet | 26 | 2.4% |
| No Internet | 327 | 30.2% |
| Total | 1,083 | 100.0% |
Liberty Summary
Liberty, North Carolina is a small town located in the heart of North Carolina’s Randolph County. It is situated in the foothills of the Blue Ridge Mountains, and is home to a population of approximately 1,400 people. The town is known for its rich history, beautiful scenery, and friendly people.
History
The town of Liberty was founded in 1790 by a group of settlers from Pennsylvania. The town was originally named Libertyville, but the name was changed to Liberty in 1820. The town was named after the Liberty Bell, which was a symbol of the American Revolution. The town was an important stop on the stagecoach route between Greensboro and Salisbury.
In the late 1800s, Liberty became a popular destination for tourists. The town was known for its mineral springs, which were believed to have healing properties. The town also had a number of hotels and resorts, which attracted visitors from all over the country.
In the early 1900s, Liberty became a center for the textile industry. The town was home to several cotton mills, which provided employment for many of the town’s residents. The town also had a number of other businesses, including a furniture factory, a canning factory, and a shoe factory.
Geography
Liberty is located in the foothills of the Blue Ridge Mountains. The town is situated in a valley, which is surrounded by rolling hills and lush forests. The town is located near the Uwharrie National Forest, which is a popular destination for outdoor activities such as hiking, camping, and fishing.
The town is located approximately 30 miles from Greensboro, North Carolina, and is accessible by Interstate 85. The town is also located near the Yadkin River, which is a popular destination for canoeing and kayaking.
Economy
The economy of Liberty is largely based on agriculture and tourism. The town is home to several farms, which produce a variety of crops, including corn, soybeans, and tobacco. The town is also home to several wineries, which produce a variety of wines.
The town is also a popular destination for tourists. The town is home to several historic sites, including the Liberty Bell Museum and the Liberty Historic District. The town also has a number of restaurants, shops, and other attractions.
Demographics
As of the 2010 census, the population of Liberty was 1,400. The town is predominantly white, with approximately 90% of the population being Caucasian. The town also has a small African American population, with approximately 5% of the population being African American. The town also has a small Hispanic population, with approximately 2% of the population being Hispanic.
Conclusion
Liberty, North Carolina is a small town located in the heart of North Carolina’s Randolph County. The town is known for its rich history, beautiful scenery, and friendly people. The town’s economy is largely based on agriculture and tourism, and the town is home to several historic sites and attractions. The town has a predominantly white population, with a small African American and Hispanic population.
Common Questions
What is Per Capita Income in Liberty?
Per Capita income in Liberty is $25,940.
What is the Median Family Income in Liberty?
Median Family Income in Liberty is $62,917.
What is the Median Household income in Liberty?
Median Household Income in Liberty is $48,672.
What is Income or Wage Gap in Liberty?
Income or Wage Gap in Liberty is 6.0%.
Women in Liberty earn 94.0 cents for every dollar earned by a man.
What is Family Income Deficit in Liberty?
Family Income Deficit in Liberty is $16,323.
Families that are below poverty line in Liberty earn $16,323 less on average than the poverty threshold level.
What is Inequality or Gini Index in Liberty?
Inequality or Gini Index in Liberty is 0.46.
What is the Total Population of Liberty?
Total Population of Liberty is 2,666.
What is the Total Male Population of Liberty?
Total Male Population of Liberty is 1,337.
What is the Total Female Population of Liberty?
Total Female Population of Liberty is 1,329.
What is the Ratio of Males per 100 Females in Liberty?
There are 100.60 Males per 100 Females in Liberty.
What is the Ratio of Females per 100 Males in Liberty?
There are 99.40 Females per 100 Males in Liberty.
What is the Median Population Age in Liberty?
Median Population Age in Liberty is 41.2 Years.
What is the Average Family Size in Liberty
Average Family Size in Liberty is 3.3 People.
What is the Average Household Size in Liberty
Average Household Size in Liberty is 2.4 People.
How Large is the Labor Force in Liberty?
There are 1,409 People in the Labor Forcein in Liberty.
What is the Percentage of People in the Labor Force in Liberty?
64.6% of People are in the Labor Force in Liberty.
What is the Unemployment Rate in Liberty?
Unemployment Rate in Liberty is 10.2%.