Sanford, NC Map & Demographics
Sanford Map
Sanford Overview
$26,884
PER CAPITA INCOME
$61,487
AVG FAMILY INCOME
$52,951
AVG HOUSEHOLD INCOME
25.8%
WAGE / INCOME GAP [ % ]
74.2¢/ $1
WAGE / INCOME GAP [ $ ]
$11,397
FAMILY INCOME DEFICIT
0.46
INEQUALITY / GINI INDEX
30,373
TOTAL POPULATION
14,931
MALE POPULATION
15,442
FEMALE POPULATION
96.69
MALES / 100 FEMALES
103.42
FEMALES / 100 MALES
34.6
MEDIAN AGE
3.3
AVG FAMILY SIZE
2.7
AVG HOUSEHOLD SIZE
14,469
LABOR FORCE [ PEOPLE ]
63.2%
PERCENT IN LABOR FORCE
5.7%
UNEMPLOYMENT RATE
Sanford Area Codes
Income in Sanford
Income Overview in Sanford
Per Capita Income in Sanford is $26,884, while median incomes of families and households are $61,487 and $52,951 respectively.
| Characteristic | Number | Measure |
| Per Capita Income | 30,373 | $26,884 |
| Median Family Income | 7,283 | $61,487 |
| Mean Family Income | 7,283 | $81,295 |
| Median Household Income | 10,863 | $52,951 |
| Mean Household Income | 10,863 | $71,527 |
| Income Deficit | 7,283 | $11,397 |
| Wage / Income Gap (%) | 30,373 | 25.79% |
| Wage / Income Gap ($) | 30,373 | 74.21¢ per $1 |
| Gini / Inequality Index | 30,373 | 0.46 |
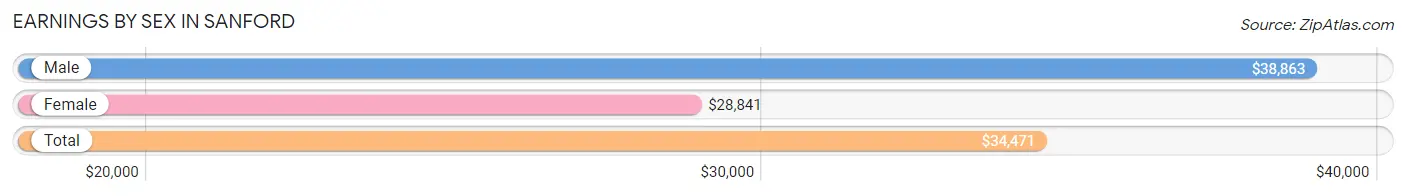
Earnings by Sex in Sanford
Average Earnings in Sanford are $34,471, $38,863 for men and $28,841 for women, a difference of 25.8%.
| Sex | Number | Average Earnings |
| Male | 8,068 (53.8%) | $38,863 |
| Female | 6,928 (46.2%) | $28,841 |
| Total | 14,996 (100.0%) | $34,471 |
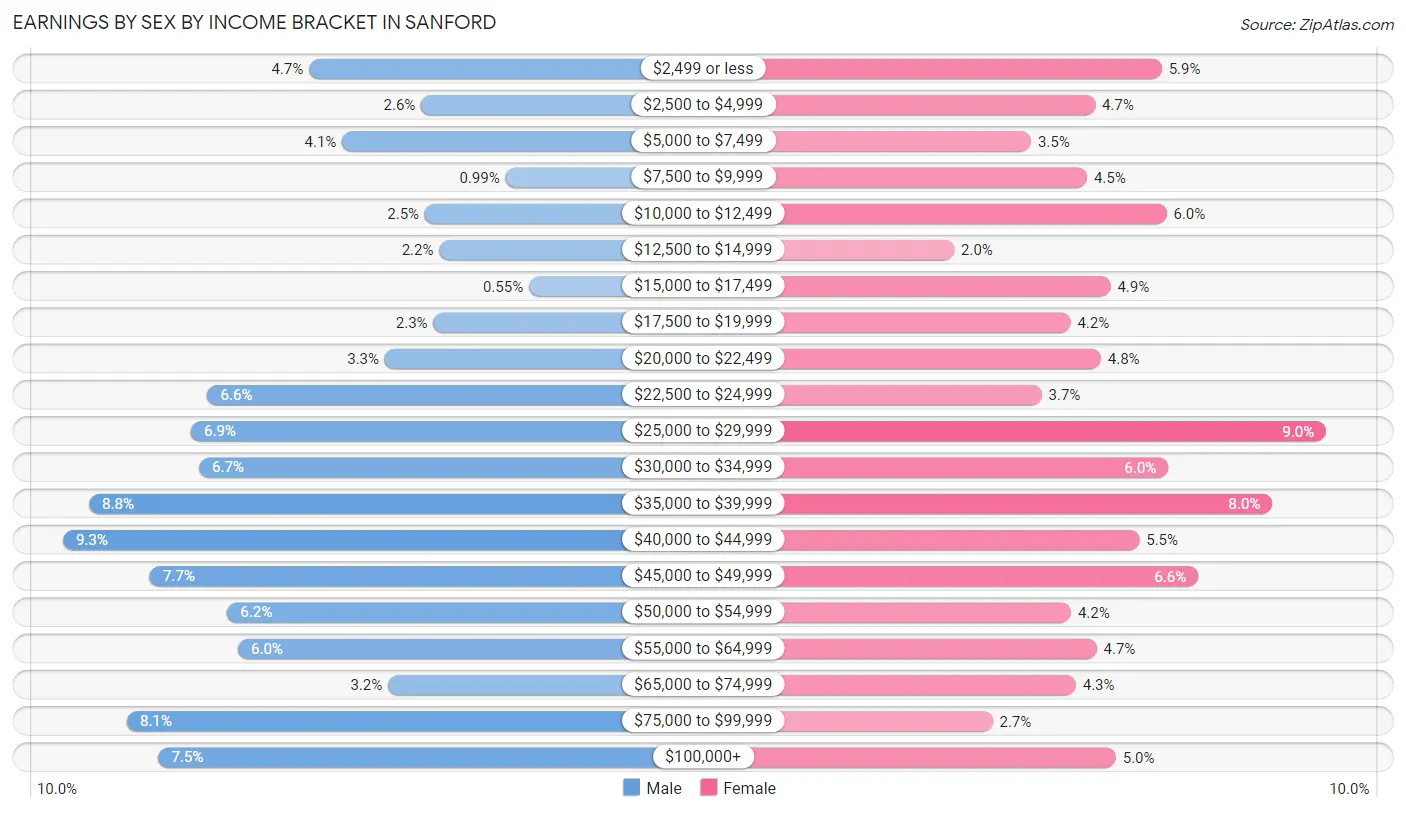
Earnings by Sex by Income Bracket in Sanford
The most common earnings brackets in Sanford are $40,000 to $44,999 for men (749 | 9.3%) and $25,000 to $29,999 for women (622 | 9.0%).
| Income | Male | Female |
| $2,499 or less | 377 (4.7%) | 409 (5.9%) |
| $2,500 to $4,999 | 207 (2.6%) | 322 (4.6%) |
| $5,000 to $7,499 | 327 (4.1%) | 239 (3.5%) |
| $7,500 to $9,999 | 80 (1.0%) | 312 (4.5%) |
| $10,000 to $12,499 | 202 (2.5%) | 415 (6.0%) |
| $12,500 to $14,999 | 180 (2.2%) | 139 (2.0%) |
| $15,000 to $17,499 | 44 (0.5%) | 342 (4.9%) |
| $17,500 to $19,999 | 189 (2.3%) | 290 (4.2%) |
| $20,000 to $22,499 | 262 (3.3%) | 330 (4.8%) |
| $22,500 to $24,999 | 530 (6.6%) | 253 (3.6%) |
| $25,000 to $29,999 | 555 (6.9%) | 622 (9.0%) |
| $30,000 to $34,999 | 543 (6.7%) | 417 (6.0%) |
| $35,000 to $39,999 | 709 (8.8%) | 552 (8.0%) |
| $40,000 to $44,999 | 749 (9.3%) | 380 (5.5%) |
| $45,000 to $49,999 | 617 (7.6%) | 456 (6.6%) |
| $50,000 to $54,999 | 500 (6.2%) | 291 (4.2%) |
| $55,000 to $64,999 | 484 (6.0%) | 324 (4.7%) |
| $65,000 to $74,999 | 257 (3.2%) | 297 (4.3%) |
| $75,000 to $99,999 | 652 (8.1%) | 189 (2.7%) |
| $100,000+ | 604 (7.5%) | 349 (5.0%) |
| Total | 8,068 (100.0%) | 6,928 (100.0%) |
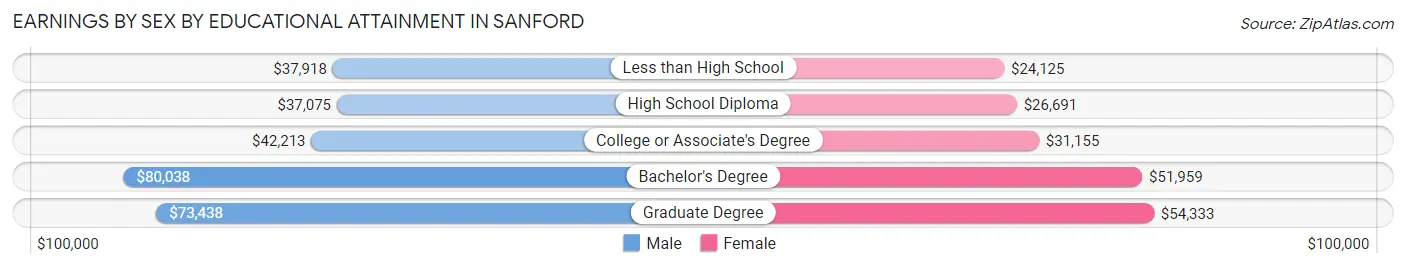
Earnings by Sex by Educational Attainment in Sanford
Average earnings in Sanford are $41,711 for men and $33,025 for women, a difference of 20.8%. Men with an educational attainment of bachelor's degree enjoy the highest average annual earnings of $80,038, while those with high school diploma education earn the least with $37,075. Women with an educational attainment of graduate degree earn the most with the average annual earnings of $54,333, while those with less than high school education have the smallest earnings of $24,125.
| Educational Attainment | Male Income | Female Income |
| Less than High School | $37,918 | $24,125 |
| High School Diploma | $37,075 | $26,691 |
| College or Associate's Degree | $42,213 | $31,155 |
| Bachelor's Degree | $80,038 | $51,959 |
| Graduate Degree | $73,438 | $54,333 |
| Total | $41,711 | $33,025 |
Family Income in Sanford
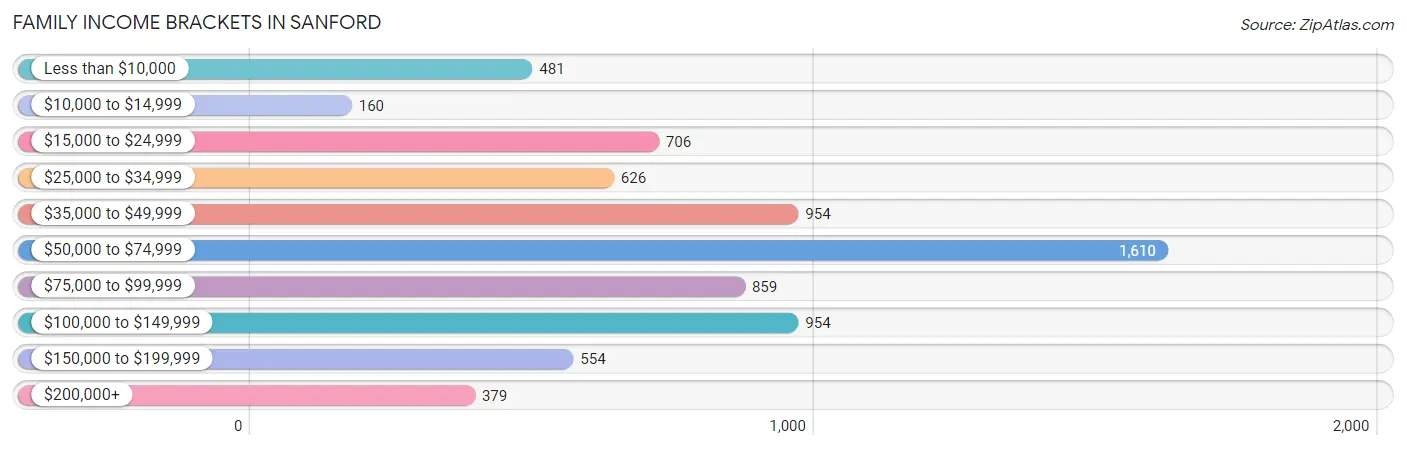
Family Income Brackets in Sanford
According to the Sanford family income data, there are 1,610 families falling into the $50,000 to $74,999 income range, which is the most common income bracket and makes up 22.1% of all families. Conversely, the $10,000 to $14,999 income bracket is the least frequent group with only 160 families (2.2%) belonging to this category.
| Income Bracket | # Families | % Families |
| Less than $10,000 | 481 | 6.6% |
| $10,000 to $14,999 | 160 | 2.2% |
| $15,000 to $24,999 | 706 | 9.7% |
| $25,000 to $34,999 | 626 | 8.6% |
| $35,000 to $49,999 | 954 | 13.1% |
| $50,000 to $74,999 | 1,610 | 22.1% |
| $75,000 to $99,999 | 859 | 11.8% |
| $100,000 to $149,999 | 954 | 13.1% |
| $150,000 to $199,999 | 554 | 7.6% |
| $200,000+ | 379 | 5.2% |
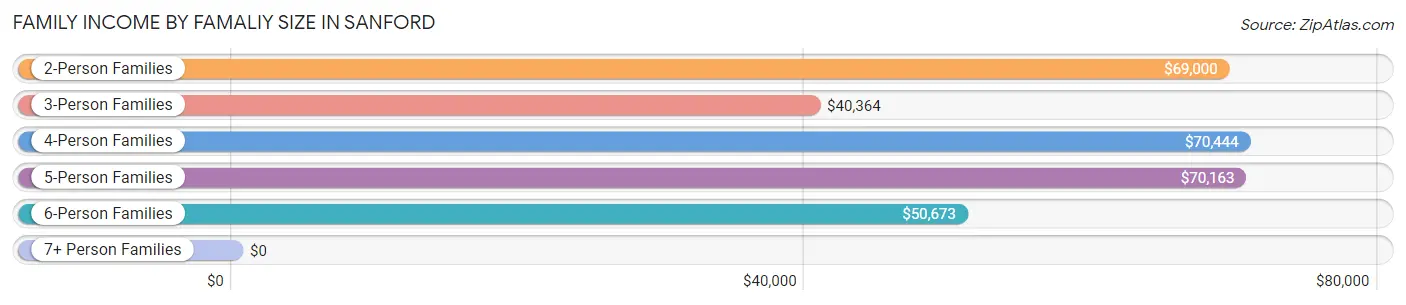
Family Income by Famaliy Size in Sanford
4-person families (1,383 | 19.0%) account for the highest median family income in Sanford with $70,444 per family, while 2-person families (2,782 | 38.2%) have the highest median income of $34,500 per family member.
| Income Bracket | # Families | Median Income |
| 2-Person Families | 2,782 (38.2%) | $69,000 |
| 3-Person Families | 1,750 (24.0%) | $40,364 |
| 4-Person Families | 1,383 (19.0%) | $70,444 |
| 5-Person Families | 983 (13.5%) | $70,163 |
| 6-Person Families | 258 (3.5%) | $50,673 |
| 7+ Person Families | 127 (1.7%) | $0 |
| Total | 7,283 (100.0%) | $61,487 |
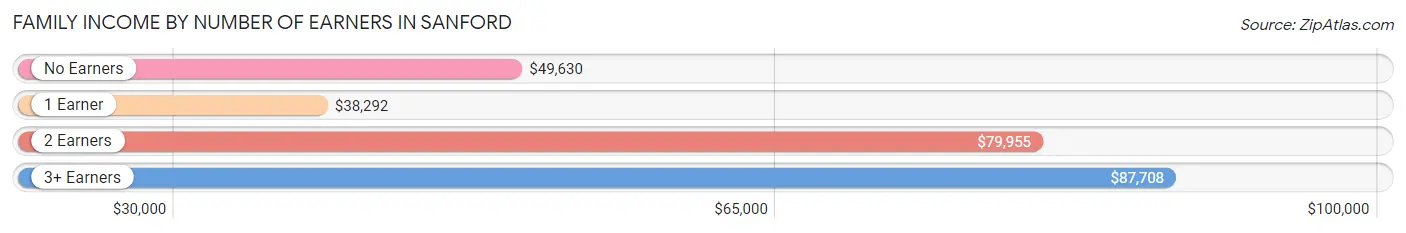
Family Income by Number of Earners in Sanford
The median family income in Sanford is $61,487, with families comprising 3+ earners (956) having the highest median family income of $87,708, while families with 1 earner (2,813) have the lowest median family income of $38,292, accounting for 13.1% and 38.6% of families, respectively.
| Number of Earners | # Families | Median Income |
| No Earners | 1,042 (14.3%) | $49,630 |
| 1 Earner | 2,813 (38.6%) | $38,292 |
| 2 Earners | 2,472 (33.9%) | $79,955 |
| 3+ Earners | 956 (13.1%) | $87,708 |
| Total | 7,283 (100.0%) | $61,487 |
Household Income in Sanford
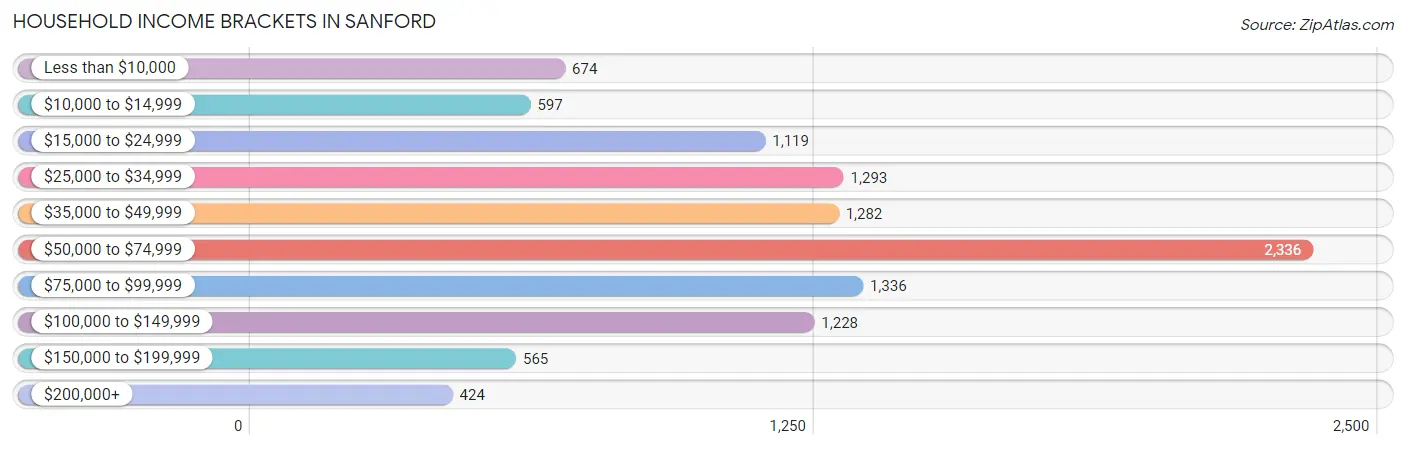
Household Income Brackets in Sanford
With 2,336 households falling in the category, the $50,000 to $74,999 income range is the most frequent in Sanford, accounting for 21.5% of all households. In contrast, only 424 households (3.9%) fall into the $200,000+ income bracket, making it the least populous group.
| Income Bracket | # Households | % Households |
| Less than $10,000 | 674 | 6.2% |
| $10,000 to $14,999 | 597 | 5.5% |
| $15,000 to $24,999 | 1,119 | 10.3% |
| $25,000 to $34,999 | 1,293 | 11.9% |
| $35,000 to $49,999 | 1,282 | 11.8% |
| $50,000 to $74,999 | 2,336 | 21.5% |
| $75,000 to $99,999 | 1,336 | 12.3% |
| $100,000 to $149,999 | 1,228 | 11.3% |
| $150,000 to $199,999 | 565 | 5.2% |
| $200,000+ | 424 | 3.9% |
Household Income by Householder Age in Sanford
The median household income in Sanford is $52,951, with the highest median household income of $63,483 found in the 45 to 64 years age bracket for the primary householder. A total of 3,745 households (34.5%) fall into this category. Meanwhile, the 65+ years age bracket for the primary householder has the lowest median household income of $44,805, with 2,753 households (25.3%) in this group.
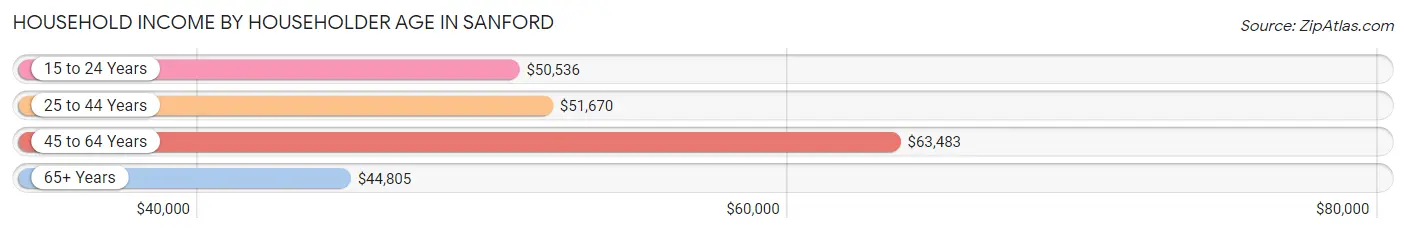
| Income Bracket | # Households | Median Income |
| 15 to 24 Years | 398 (3.7%) | $50,536 |
| 25 to 44 Years | 3,967 (36.5%) | $51,670 |
| 45 to 64 Years | 3,745 (34.5%) | $63,483 |
| 65+ Years | 2,753 (25.3%) | $44,805 |
| Total | 10,863 (100.0%) | $52,951 |
Poverty in Sanford
Income Below Poverty by Sex and Age in Sanford
With 19.3% poverty level for males and 23.6% for females among the residents of Sanford, 15 year old males and 5 year old females are the most vulnerable to poverty, with 108 males (44.6%) and 127 females (52.0%) in their respective age groups living below the poverty level.
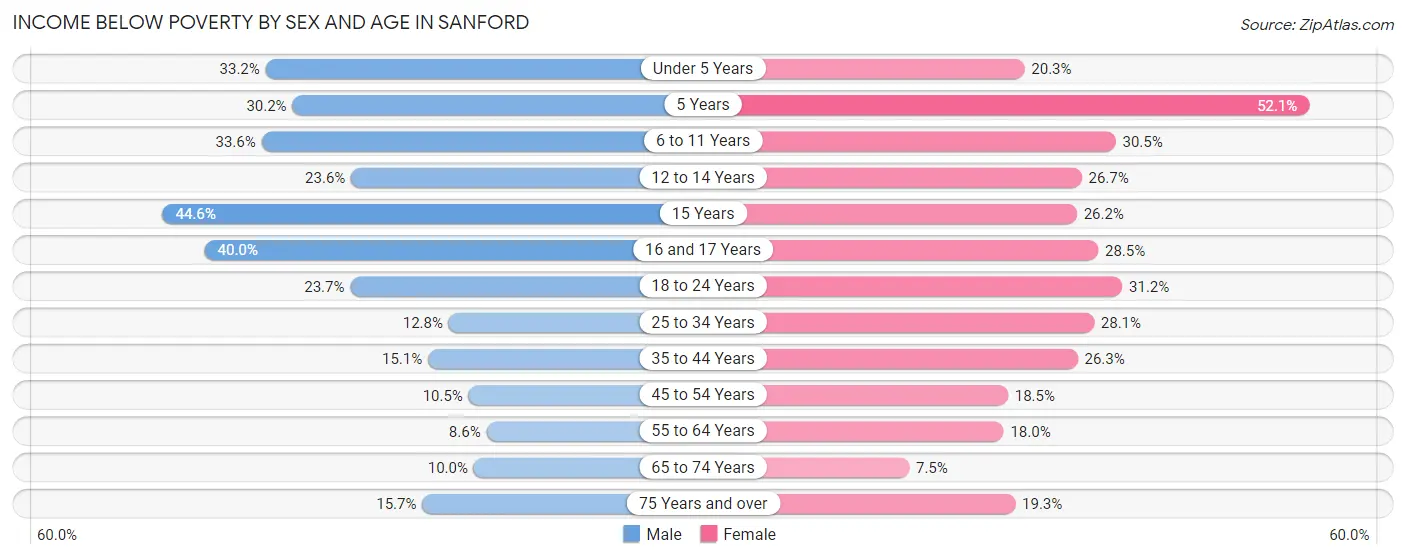
| Age Bracket | Male | Female |
| Under 5 Years | 379 (33.2%) | 187 (20.3%) |
| 5 Years | 35 (30.2%) | 127 (52.0%) |
| 6 to 11 Years | 440 (33.6%) | 475 (30.5%) |
| 12 to 14 Years | 224 (23.6%) | 145 (26.7%) |
| 15 Years | 108 (44.6%) | 62 (26.2%) |
| 16 and 17 Years | 153 (40.0%) | 129 (28.5%) |
| 18 to 24 Years | 370 (23.7%) | 365 (31.2%) |
| 25 to 34 Years | 247 (12.8%) | 637 (28.1%) |
| 35 to 44 Years | 326 (15.1%) | 511 (26.3%) |
| 45 to 54 Years | 155 (10.5%) | 357 (18.5%) |
| 55 to 64 Years | 119 (8.6%) | 282 (18.0%) |
| 65 to 74 Years | 102 (10.0%) | 91 (7.5%) |
| 75 Years and over | 93 (15.7%) | 220 (19.3%) |
| Total | 2,751 (19.3%) | 3,588 (23.6%) |
Income Above Poverty by Sex and Age in Sanford
According to the poverty statistics in Sanford, males aged 55 to 64 years and females aged 65 to 74 years are the age groups that are most secure financially, with 91.4% of males and 92.5% of females in these age groups living above the poverty line.
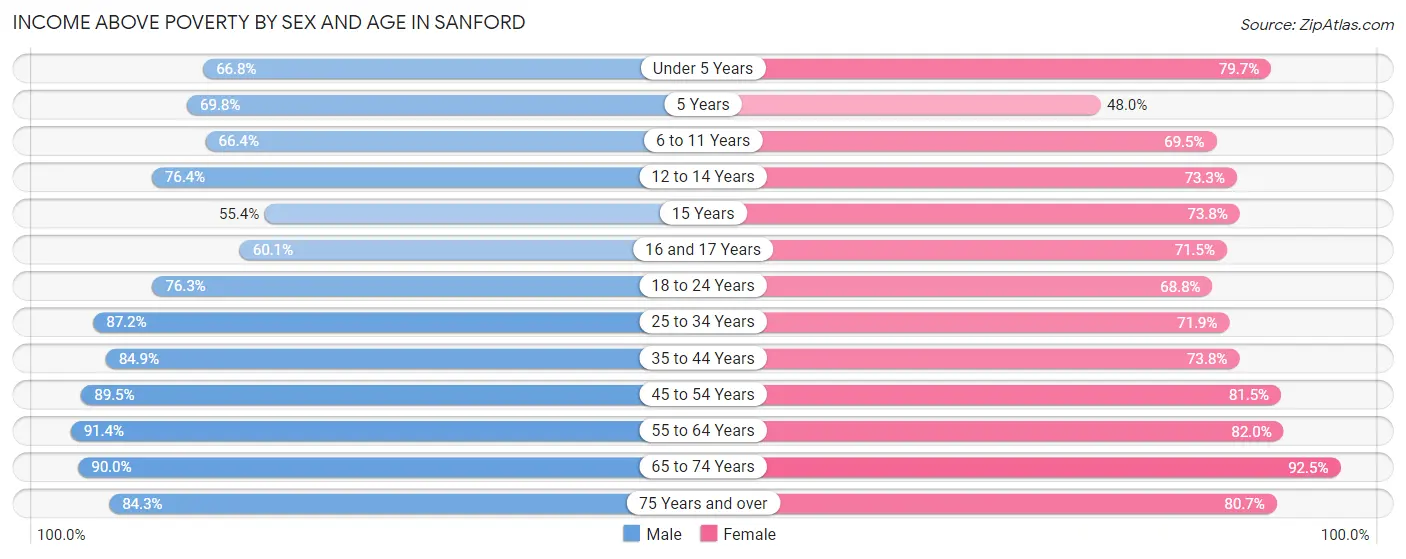
| Age Bracket | Male | Female |
| Under 5 Years | 764 (66.8%) | 733 (79.7%) |
| 5 Years | 81 (69.8%) | 117 (47.9%) |
| 6 to 11 Years | 869 (66.4%) | 1,083 (69.5%) |
| 12 to 14 Years | 724 (76.4%) | 398 (73.3%) |
| 15 Years | 134 (55.4%) | 175 (73.8%) |
| 16 and 17 Years | 230 (60.1%) | 323 (71.5%) |
| 18 to 24 Years | 1,189 (76.3%) | 804 (68.8%) |
| 25 to 34 Years | 1,689 (87.2%) | 1,632 (71.9%) |
| 35 to 44 Years | 1,837 (84.9%) | 1,436 (73.8%) |
| 45 to 54 Years | 1,315 (89.5%) | 1,574 (81.5%) |
| 55 to 64 Years | 1,271 (91.4%) | 1,284 (82.0%) |
| 65 to 74 Years | 921 (90.0%) | 1,124 (92.5%) |
| 75 Years and over | 499 (84.3%) | 920 (80.7%) |
| Total | 11,523 (80.7%) | 11,603 (76.4%) |
Income Below Poverty Among Married-Couple Families in Sanford
The poverty statistics for married-couple families in Sanford show that 8.1% or 359 of the total 4,435 families live below the poverty line. Families with 3 or 4 children have the highest poverty rate of 27.6%, comprising of 223 families. On the other hand, families with no children have the lowest poverty rate of 1.5%, which includes 33 families.
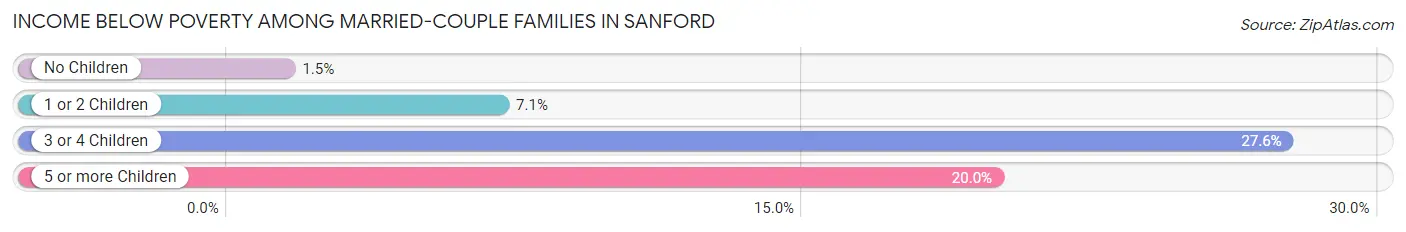
| Children | Above Poverty | Below Poverty |
| No Children | 2,166 (98.5%) | 33 (1.5%) |
| 1 or 2 Children | 1,312 (92.9%) | 100 (7.1%) |
| 3 or 4 Children | 586 (72.4%) | 223 (27.6%) |
| 5 or more Children | 12 (80.0%) | 3 (20.0%) |
| Total | 4,076 (91.9%) | 359 (8.1%) |
Income Below Poverty Among Single-Parent Households in Sanford
According to the poverty data in Sanford, 14.2% or 89 single-father households and 40.1% or 892 single-mother households are living below the poverty line. Among single-father households, those with 3 or 4 children have the highest poverty rate, with 10 households (20.0%) experiencing poverty. Likewise, among single-mother households, those with 5 or more children have the highest poverty rate, with 19 households (100.0%) falling below the poverty line.
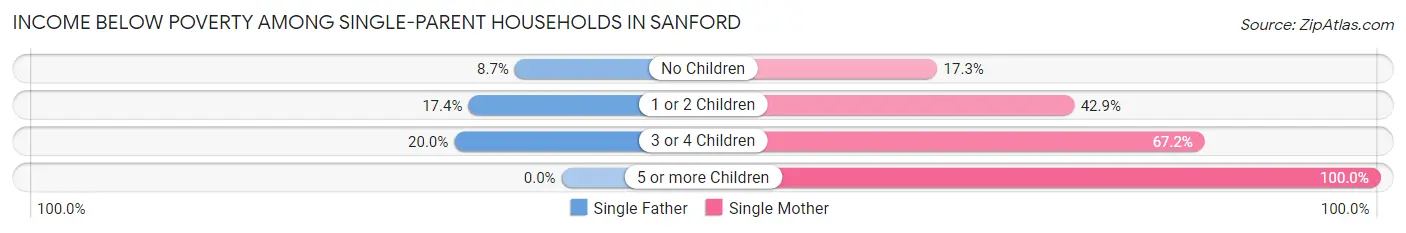
| Children | Single Father | Single Mother |
| No Children | 21 (8.7%) | 106 (17.3%) |
| 1 or 2 Children | 58 (17.4%) | 533 (42.8%) |
| 3 or 4 Children | 10 (20.0%) | 234 (67.2%) |
| 5 or more Children | 0 (0.0%) | 19 (100.0%) |
| Total | 89 (14.2%) | 892 (40.1%) |
Income Below Poverty Among Married-Couple vs Single-Parent Households in Sanford
The poverty data for Sanford shows that 359 of the married-couple family households (8.1%) and 981 of the single-parent households (34.4%) are living below the poverty level. Within the married-couple family households, those with 3 or 4 children have the highest poverty rate, with 223 households (27.6%) falling below the poverty line. Among the single-parent households, those with 5 or more children have the highest poverty rate, with 19 household (100.0%) living below poverty.
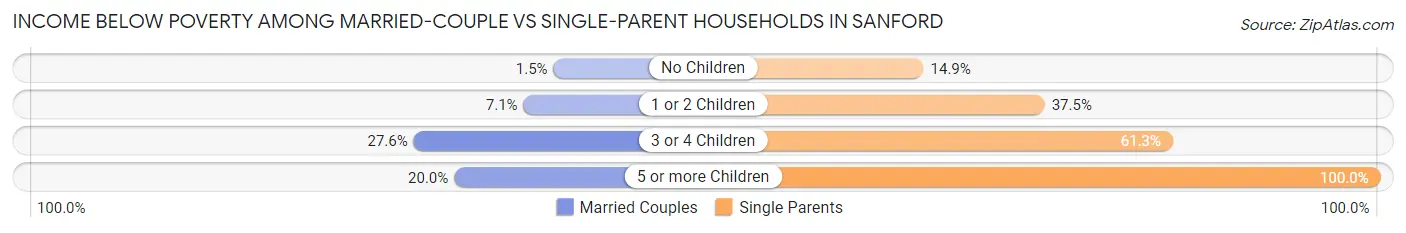
| Children | Married-Couple Families | Single-Parent Households |
| No Children | 33 (1.5%) | 127 (14.9%) |
| 1 or 2 Children | 100 (7.1%) | 591 (37.4%) |
| 3 or 4 Children | 223 (27.6%) | 244 (61.3%) |
| 5 or more Children | 3 (20.0%) | 19 (100.0%) |
| Total | 359 (8.1%) | 981 (34.4%) |
Race in Sanford
The most populous races in Sanford are White / Caucasian (16,821 | 55.4%), Hispanic or Latino (9,141 | 30.1%), and Black / African American (7,901 | 26.0%).
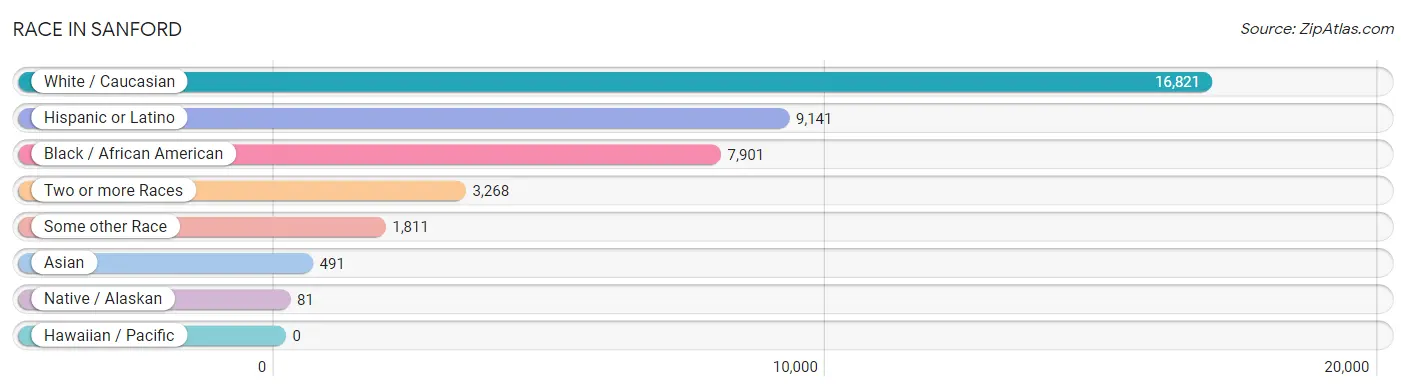
| Race | # Population | % Population |
| Asian | 491 | 1.6% |
| Black / African American | 7,901 | 26.0% |
| Hawaiian / Pacific | 0 | 0.0% |
| Hispanic or Latino | 9,141 | 30.1% |
| Native / Alaskan | 81 | 0.3% |
| White / Caucasian | 16,821 | 55.4% |
| Two or more Races | 3,268 | 10.8% |
| Some other Race | 1,811 | 6.0% |
| Total | 30,373 | 100.0% |
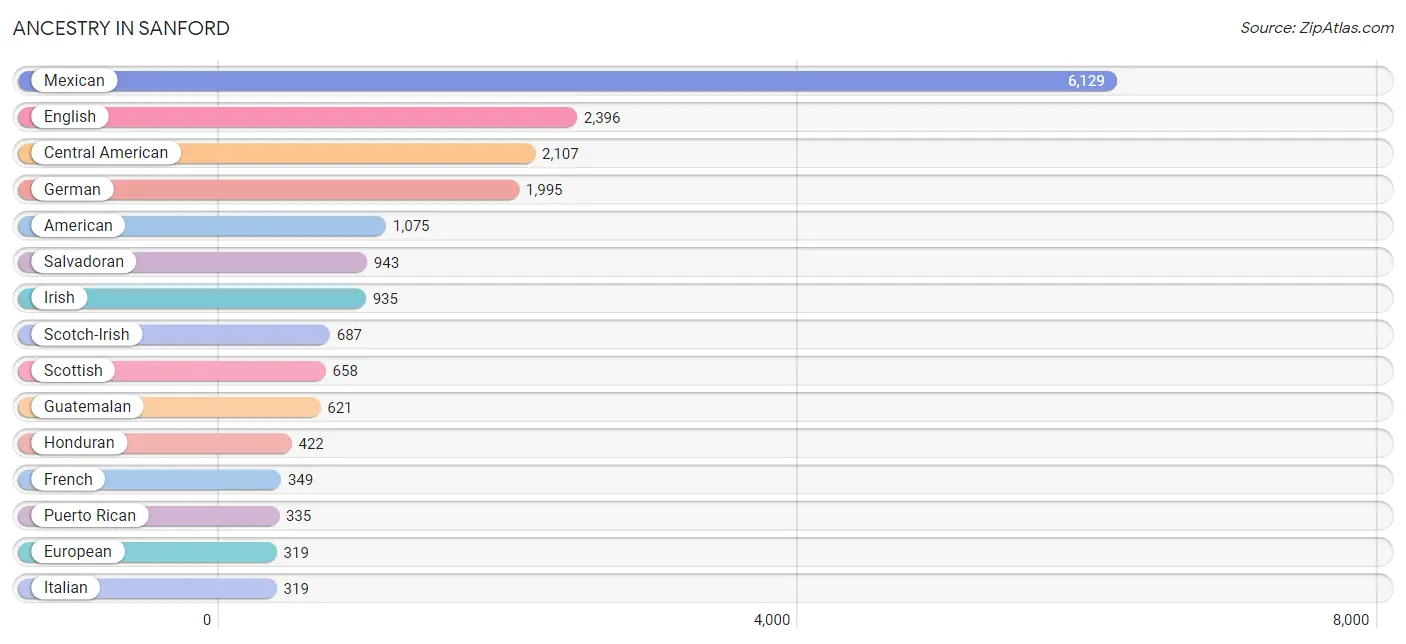
Ancestry in Sanford
The most populous ancestries reported in Sanford are Mexican (6,129 | 20.2%), English (2,396 | 7.9%), Central American (2,107 | 6.9%), German (1,995 | 6.6%), and American (1,075 | 3.5%), together accounting for 45.1% of all Sanford residents.
| Ancestry | # Population | % Population |
| African | 149 | 0.5% |
| American | 1,075 | 3.5% |
| Arab | 32 | 0.1% |
| Argentinean | 4 | 0.0% |
| Australian | 7 | 0.0% |
| Austrian | 20 | 0.1% |
| Bhutanese | 46 | 0.2% |
| Blackfeet | 39 | 0.1% |
| Brazilian | 12 | 0.0% |
| British | 33 | 0.1% |
| Burmese | 5 | 0.0% |
| Canadian | 7 | 0.0% |
| Central American | 2,107 | 6.9% |
| Cherokee | 304 | 1.0% |
| Colombian | 24 | 0.1% |
| Creek | 12 | 0.0% |
| Cuban | 117 | 0.4% |
| Czech | 8 | 0.0% |
| Danish | 46 | 0.2% |
| Dominican | 33 | 0.1% |
| Dutch | 142 | 0.5% |
| Eastern European | 17 | 0.1% |
| Ecuadorian | 69 | 0.2% |
| English | 2,396 | 7.9% |
| European | 319 | 1.1% |
| Filipino | 16 | 0.1% |
| Finnish | 7 | 0.0% |
| French | 349 | 1.1% |
| French Canadian | 64 | 0.2% |
| German | 1,995 | 6.6% |
| Greek | 60 | 0.2% |
| Guatemalan | 621 | 2.0% |
| Guyanese | 15 | 0.1% |
| Haitian | 8 | 0.0% |
| Honduran | 422 | 1.4% |
| Hungarian | 42 | 0.1% |
| Indian (Asian) | 37 | 0.1% |
| Irish | 935 | 3.1% |
| Iroquois | 6 | 0.0% |
| Italian | 319 | 1.1% |
| Jamaican | 22 | 0.1% |
| Korean | 138 | 0.4% |
| Latvian | 5 | 0.0% |
| Lithuanian | 52 | 0.2% |
| Lumbee | 174 | 0.6% |
| Mexican | 6,129 | 20.2% |
| Moroccan | 27 | 0.1% |
| Navajo | 18 | 0.1% |
| New Zealander | 12 | 0.0% |
| Nigerian | 164 | 0.5% |
| Norwegian | 172 | 0.6% |
| Panamanian | 121 | 0.4% |
| Peruvian | 38 | 0.1% |
| Polish | 65 | 0.2% |
| Portuguese | 62 | 0.2% |
| Puerto Rican | 335 | 1.1% |
| Russian | 155 | 0.5% |
| Salvadoran | 943 | 3.1% |
| Scandinavian | 25 | 0.1% |
| Scotch-Irish | 687 | 2.3% |
| Scottish | 658 | 2.2% |
| South American | 222 | 0.7% |
| Spaniard | 102 | 0.3% |
| Sri Lankan | 315 | 1.0% |
| Subsaharan African | 313 | 1.0% |
| Swedish | 85 | 0.3% |
| Swiss | 44 | 0.1% |
| Syrian | 5 | 0.0% |
| Thai | 17 | 0.1% |
| Ukrainian | 14 | 0.1% |
| Venezuelan | 87 | 0.3% |
| Welsh | 68 | 0.2% | View All 72 Rows |
Immigrants in Sanford
The most numerous immigrant groups reported in Sanford came from Latin America (3,890 | 12.8%), Central America (3,681 | 12.1%), Mexico (2,348 | 7.7%), Guatemala (511 | 1.7%), and Honduras (435 | 1.4%), together accounting for 35.8% of all Sanford residents.
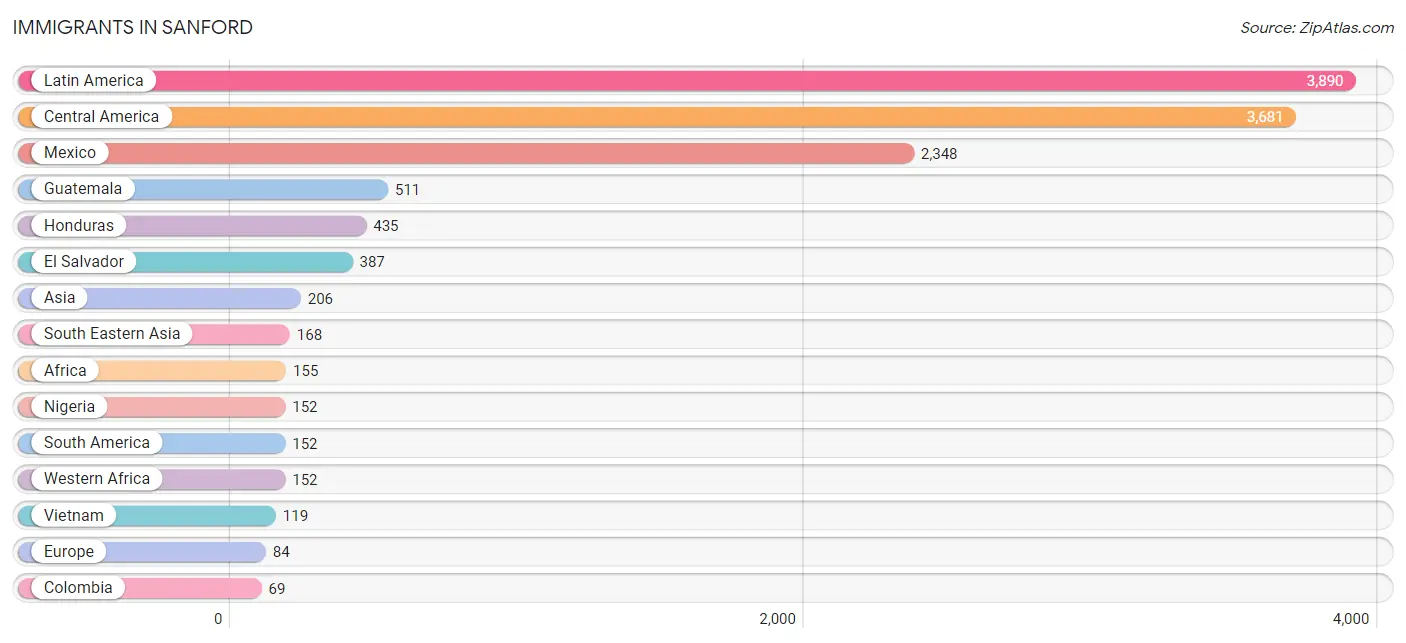
| Immigration Origin | # Population | % Population |
| Africa | 155 | 0.5% |
| Argentina | 4 | 0.0% |
| Asia | 206 | 0.7% |
| Caribbean | 57 | 0.2% |
| Central America | 3,681 | 12.1% |
| Chile | 7 | 0.0% |
| China | 21 | 0.1% |
| Colombia | 69 | 0.2% |
| Cuba | 45 | 0.2% |
| Dominican Republic | 12 | 0.0% |
| Eastern Asia | 21 | 0.1% |
| Ecuador | 32 | 0.1% |
| El Salvador | 387 | 1.3% |
| Europe | 84 | 0.3% |
| Germany | 44 | 0.1% |
| Guatemala | 511 | 1.7% |
| Honduras | 435 | 1.4% |
| India | 17 | 0.1% |
| Latin America | 3,890 | 12.8% |
| Mexico | 2,348 | 7.7% |
| Nigeria | 152 | 0.5% |
| Peru | 28 | 0.1% |
| Philippines | 49 | 0.2% |
| South Africa | 3 | 0.0% |
| South America | 152 | 0.5% |
| South Central Asia | 17 | 0.1% |
| South Eastern Asia | 168 | 0.5% |
| Southern Europe | 40 | 0.1% |
| Spain | 40 | 0.1% |
| Taiwan | 16 | 0.1% |
| Venezuela | 12 | 0.0% |
| Vietnam | 119 | 0.4% |
| Western Africa | 152 | 0.5% |
| Western Europe | 44 | 0.1% | View All 34 Rows |
Sex and Age in Sanford
Sex and Age in Sanford
The most populous age groups in Sanford are 10 to 14 Years (1,508 | 10.1%) for men and 5 to 9 Years (1,363 | 8.8%) for women.
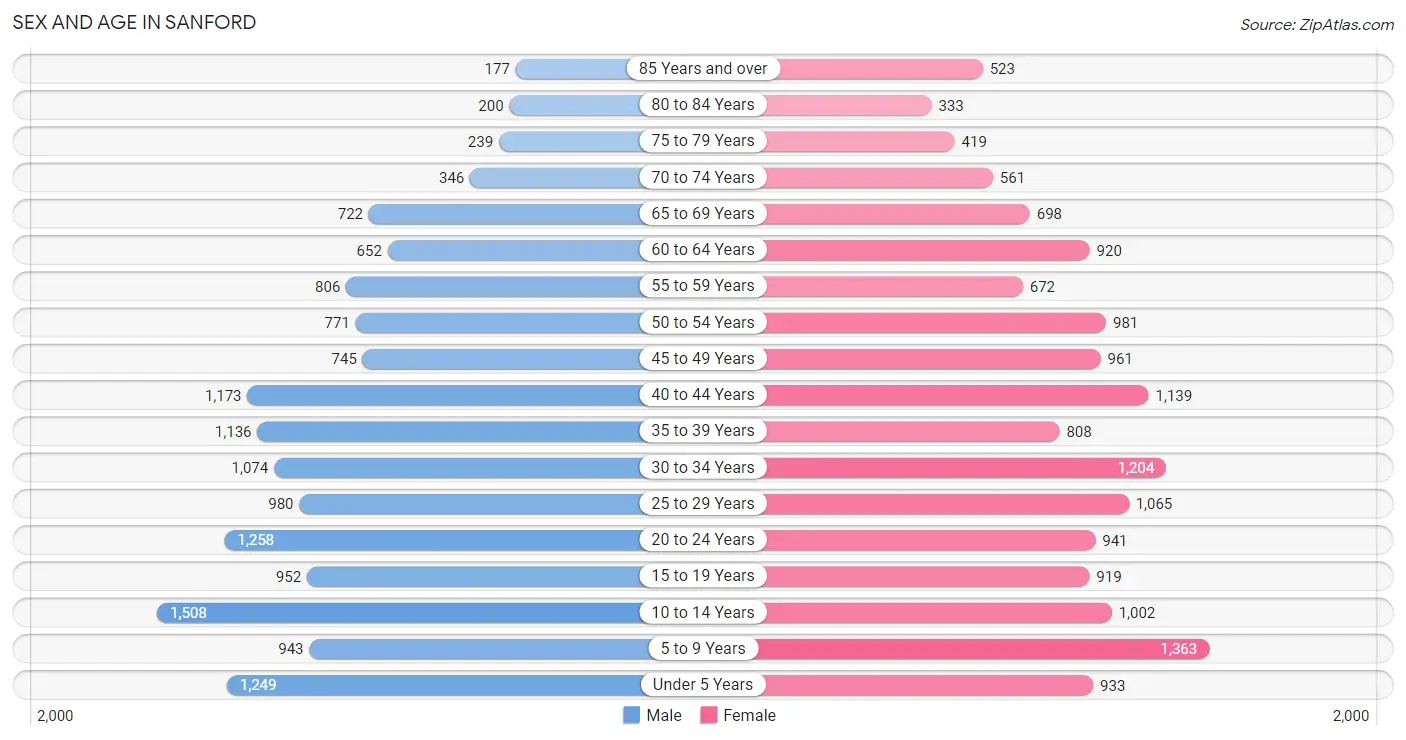
| Age Bracket | Male | Female |
| Under 5 Years | 1,249 (8.4%) | 933 (6.0%) |
| 5 to 9 Years | 943 (6.3%) | 1,363 (8.8%) |
| 10 to 14 Years | 1,508 (10.1%) | 1,002 (6.5%) |
| 15 to 19 Years | 952 (6.4%) | 919 (5.9%) |
| 20 to 24 Years | 1,258 (8.4%) | 941 (6.1%) |
| 25 to 29 Years | 980 (6.6%) | 1,065 (6.9%) |
| 30 to 34 Years | 1,074 (7.2%) | 1,204 (7.8%) |
| 35 to 39 Years | 1,136 (7.6%) | 808 (5.2%) |
| 40 to 44 Years | 1,173 (7.9%) | 1,139 (7.4%) |
| 45 to 49 Years | 745 (5.0%) | 961 (6.2%) |
| 50 to 54 Years | 771 (5.2%) | 981 (6.4%) |
| 55 to 59 Years | 806 (5.4%) | 672 (4.3%) |
| 60 to 64 Years | 652 (4.4%) | 920 (6.0%) |
| 65 to 69 Years | 722 (4.8%) | 698 (4.5%) |
| 70 to 74 Years | 346 (2.3%) | 561 (3.6%) |
| 75 to 79 Years | 239 (1.6%) | 419 (2.7%) |
| 80 to 84 Years | 200 (1.3%) | 333 (2.2%) |
| 85 Years and over | 177 (1.2%) | 523 (3.4%) |
| Total | 14,931 (100.0%) | 15,442 (100.0%) |
Families and Households in Sanford
Median Family Size in Sanford
The median family size in Sanford is 3.28 persons per family, with married-couple families (4,435 | 60.9%) accounting for the largest median family size of 3.32 persons per family. On the other hand, single male/father families (625 | 8.6%) represent the smallest median family size with 3.13 persons per family.
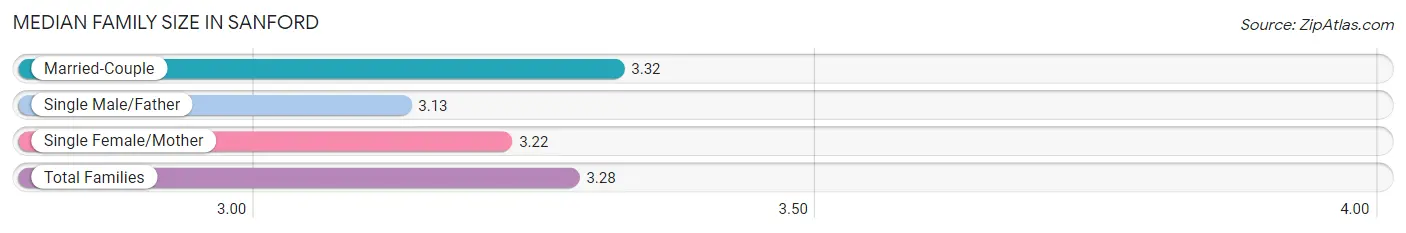
| Family Type | # Families | Family Size |
| Married-Couple | 4,435 (60.9%) | 3.32 |
| Single Male/Father | 625 (8.6%) | 3.13 |
| Single Female/Mother | 2,223 (30.5%) | 3.22 |
| Total Families | 7,283 (100.0%) | 3.28 |
Median Household Size in Sanford
The median household size in Sanford is 2.72 persons per household, with single male/father households (625 | 5.8%) accounting for the largest median household size of 3.76 persons per household. non-family households (3,580 | 33.0%) represent the smallest median household size with 1.24 persons per household.
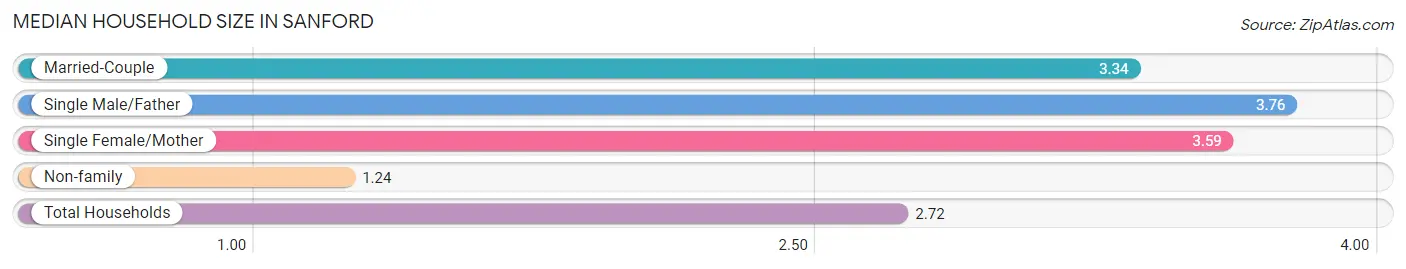
| Household Type | # Households | Household Size |
| Married-Couple | 4,435 (40.8%) | 3.34 |
| Single Male/Father | 625 (5.8%) | 3.76 |
| Single Female/Mother | 2,223 (20.5%) | 3.59 |
| Non-family | 3,580 (33.0%) | 1.24 |
| Total Households | 10,863 (100.0%) | 2.72 |
Household Size by Marriage Status in Sanford
Out of a total of 10,863 households in Sanford, 7,283 (67.0%) are family households, while 3,580 (33.0%) are nonfamily households. The most numerous type of family households are 2-person households, comprising 2,549, and the most common type of nonfamily households are 1-person households, comprising 3,010.
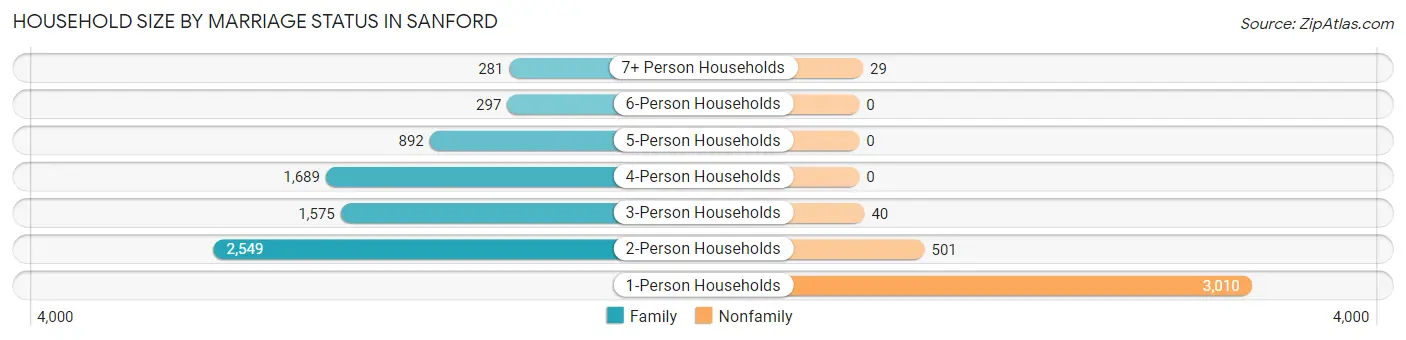
| Household Size | Family Households | Nonfamily Households |
| 1-Person Households | - | 3,010 (27.7%) |
| 2-Person Households | 2,549 (23.5%) | 501 (4.6%) |
| 3-Person Households | 1,575 (14.5%) | 40 (0.4%) |
| 4-Person Households | 1,689 (15.5%) | 0 (0.0%) |
| 5-Person Households | 892 (8.2%) | 0 (0.0%) |
| 6-Person Households | 297 (2.7%) | 0 (0.0%) |
| 7+ Person Households | 281 (2.6%) | 29 (0.3%) |
| Total | 7,283 (67.0%) | 3,580 (33.0%) |
Female Fertility in Sanford
Fertility by Age in Sanford
Average fertility rate in Sanford is 65.0 births per 1,000 women. Women in the age bracket of 20 to 34 years have the highest fertility rate with 101.0 births per 1,000 women. Women in the age bracket of 20 to 34 years acount for 68.6% of all women with births.
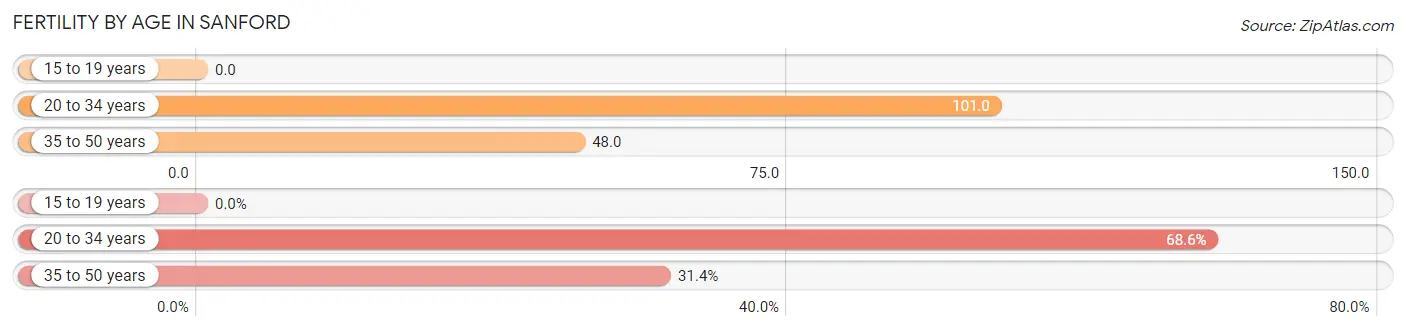
| Age Bracket | Women with Births | Births / 1,000 Women |
| 15 to 19 years | 0 (0.0%) | 0.0 |
| 20 to 34 years | 325 (68.6%) | 101.0 |
| 35 to 50 years | 149 (31.4%) | 48.0 |
| Total | 474 (100.0%) | 65.0 |
Fertility by Age by Marriage Status in Sanford
41.1% of women with births (474) in Sanford are married. The highest percentage of unmarried women with births falls into 20 to 34 years age bracket with 63.4% of them unmarried at the time of birth, while the lowest percentage of unmarried women with births belong to 35 to 50 years age bracket with 49.0% of them unmarried.
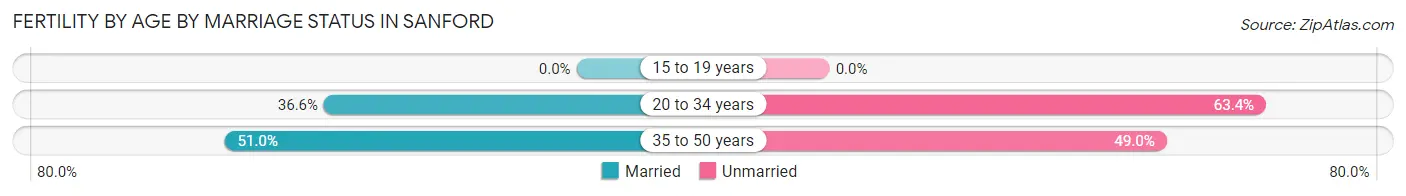
| Age Bracket | Married | Unmarried |
| 15 to 19 years | 0 (0.0%) | 0 (0.0%) |
| 20 to 34 years | 119 (36.6%) | 206 (63.4%) |
| 35 to 50 years | 76 (51.0%) | 73 (49.0%) |
| Total | 195 (41.1%) | 279 (58.9%) |
Fertility by Education in Sanford
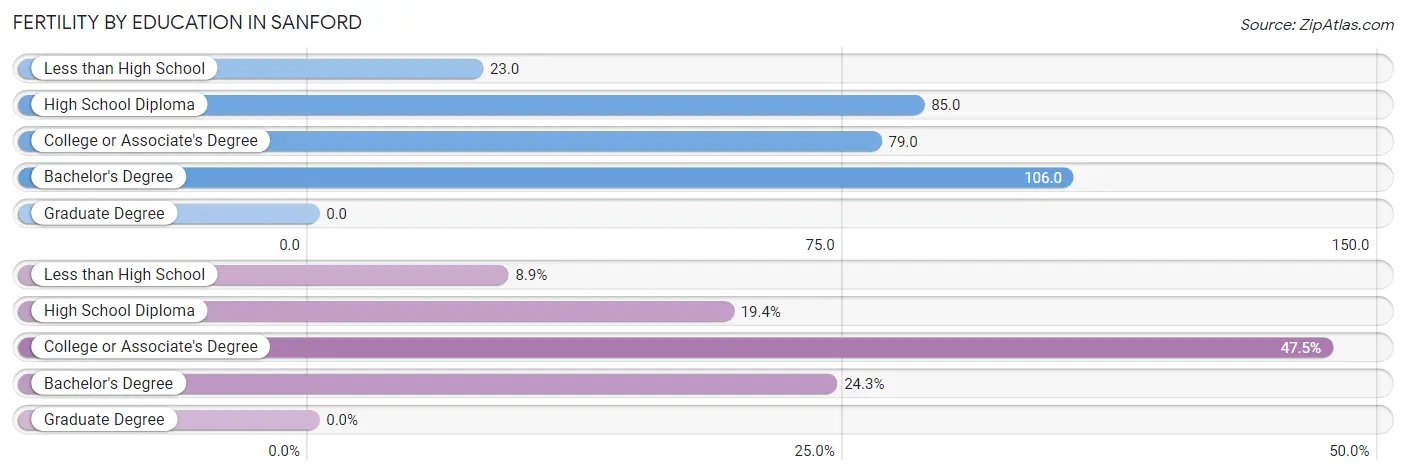
| Educational Attainment | Women with Births | Births / 1,000 Women |
| Less than High School | 42 (8.9%) | 23.0 |
| High School Diploma | 92 (19.4%) | 85.0 |
| College or Associate's Degree | 225 (47.5%) | 79.0 |
| Bachelor's Degree | 115 (24.3%) | 106.0 |
| Graduate Degree | 0 (0.0%) | 0.0 |
| Total | 474 (100.0%) | 65.0 |
Fertility by Education by Marriage Status in Sanford
58.9% of women with births in Sanford are unmarried. Women with the educational attainment of bachelor's degree are most likely to be married with 60.0% of them married at childbirth, while women with the educational attainment of less than high school are least likely to be married with 80.9% of them unmarried at childbirth.
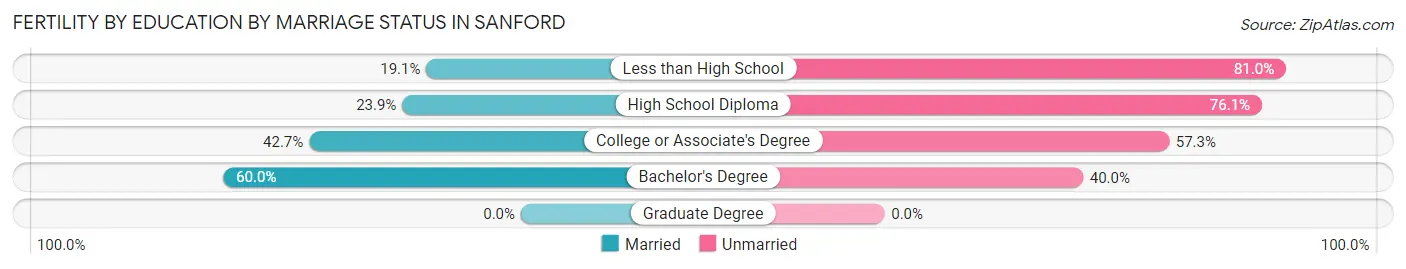
| Educational Attainment | Married | Unmarried |
| Less than High School | 8 (19.1%) | 34 (80.9%) |
| High School Diploma | 22 (23.9%) | 70 (76.1%) |
| College or Associate's Degree | 96 (42.7%) | 129 (57.3%) |
| Bachelor's Degree | 69 (60.0%) | 46 (40.0%) |
| Graduate Degree | 0 (0.0%) | 0 (0.0%) |
| Total | 195 (41.1%) | 279 (58.9%) |
Employment Characteristics in Sanford
Employment by Class of Employer in Sanford
Among the 13,430 employed individuals in Sanford, private company employees (10,088 | 75.1%), not-for-profit organizations (765 | 5.7%), and local government employees (721 | 5.4%) make up the most common classes of employment.
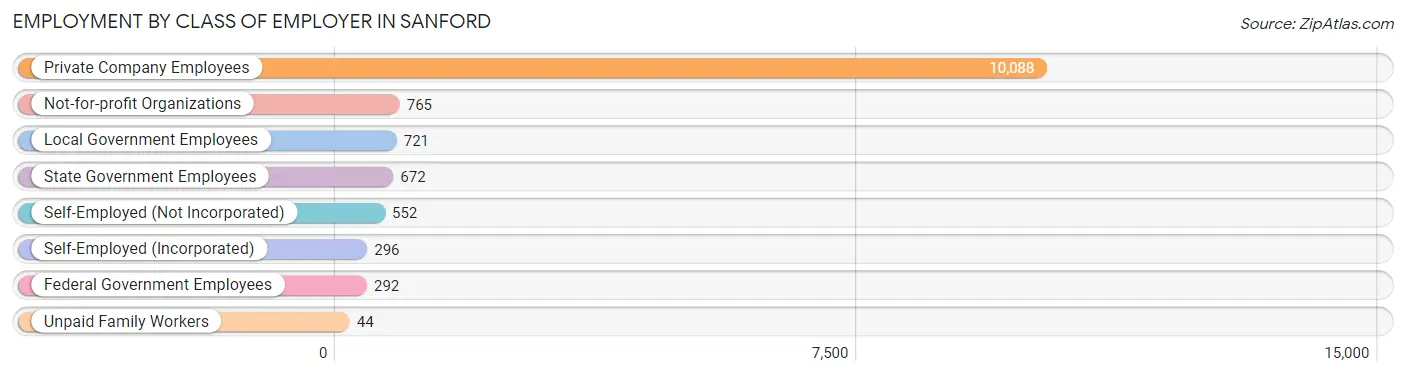
| Employer Class | # Employees | % Employees |
| Private Company Employees | 10,088 | 75.1% |
| Self-Employed (Incorporated) | 296 | 2.2% |
| Self-Employed (Not Incorporated) | 552 | 4.1% |
| Not-for-profit Organizations | 765 | 5.7% |
| Local Government Employees | 721 | 5.4% |
| State Government Employees | 672 | 5.0% |
| Federal Government Employees | 292 | 2.2% |
| Unpaid Family Workers | 44 | 0.3% |
| Total | 13,430 | 100.0% |
Employment Status by Age in Sanford
According to the labor force statistics for Sanford, out of the total population over 16 years of age (22,894), 63.2% or 14,469 individuals are in the labor force, with 5.7% or 825 of them unemployed. The age group with the highest labor force participation rate is 30 to 34 years, with 86.4% or 1,968 individuals in the labor force. Within the labor force, the 60 to 64 years age range has the highest percentage of unemployed individuals, with 11.0% or 105 of them being unemployed.
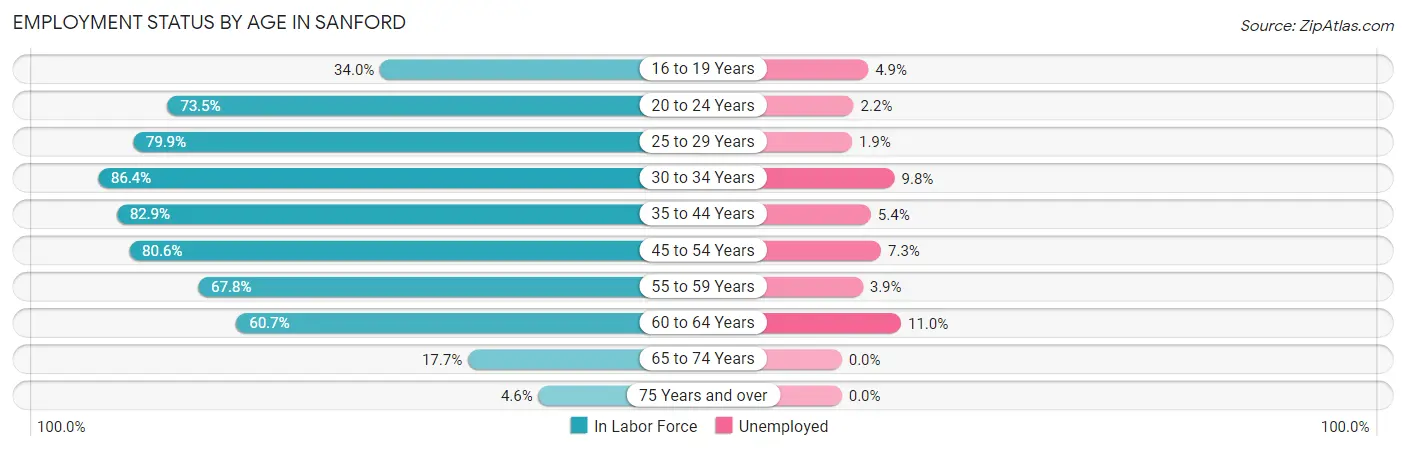
| Age Bracket | In Labor Force | Unemployed |
| 16 to 19 Years | 473 (34.0%) | 23 (4.9%) |
| 20 to 24 Years | 1,616 (73.5%) | 36 (2.2%) |
| 25 to 29 Years | 1,634 (79.9%) | 31 (1.9%) |
| 30 to 34 Years | 1,968 (86.4%) | 193 (9.8%) |
| 35 to 44 Years | 3,528 (82.9%) | 191 (5.4%) |
| 45 to 54 Years | 2,787 (80.6%) | 203 (7.3%) |
| 55 to 59 Years | 1,002 (67.8%) | 39 (3.9%) |
| 60 to 64 Years | 954 (60.7%) | 105 (11.0%) |
| 65 to 74 Years | 412 (17.7%) | 0 (0.0%) |
| 75 Years and over | 87 (4.6%) | 0 (0.0%) |
| Total | 14,469 (63.2%) | 825 (5.7%) |
Employment Status by Educational Attainment in Sanford
According to labor force statistics for Sanford, 78.7% of individuals (11,873) out of the total population between 25 and 64 years of age (15,087) are in the labor force, with 6.4% or 760 of them being unemployed. The group with the highest labor force participation rate are those with the educational attainment of bachelor's degree or higher, with 85.6% or 2,829 individuals in the labor force. Within the labor force, individuals with high school diploma education have the highest percentage of unemployment, with 9.9% or 245 of them being unemployed.
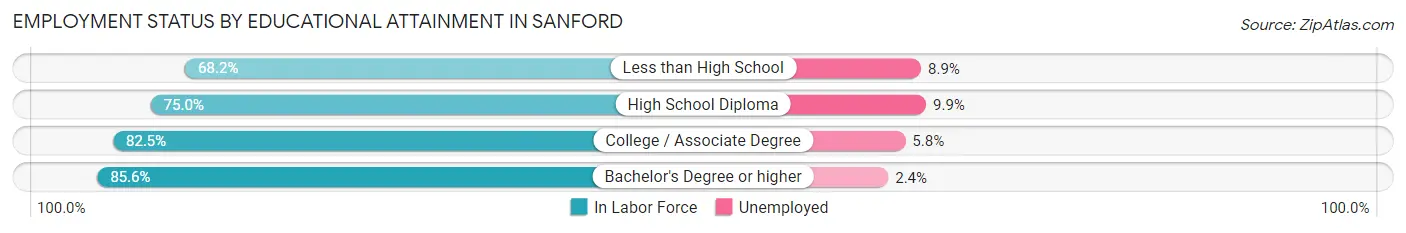
| Educational Attainment | In Labor Force | Unemployed |
| Less than High School | 2,062 (68.2%) | 269 (8.9%) |
| High School Diploma | 2,474 (75.0%) | 327 (9.9%) |
| College / Associate Degree | 4,504 (82.5%) | 317 (5.8%) |
| Bachelor's Degree or higher | 2,829 (85.6%) | 79 (2.4%) |
| Total | 11,873 (78.7%) | 966 (6.4%) |
Employment Occupations by Sex in Sanford
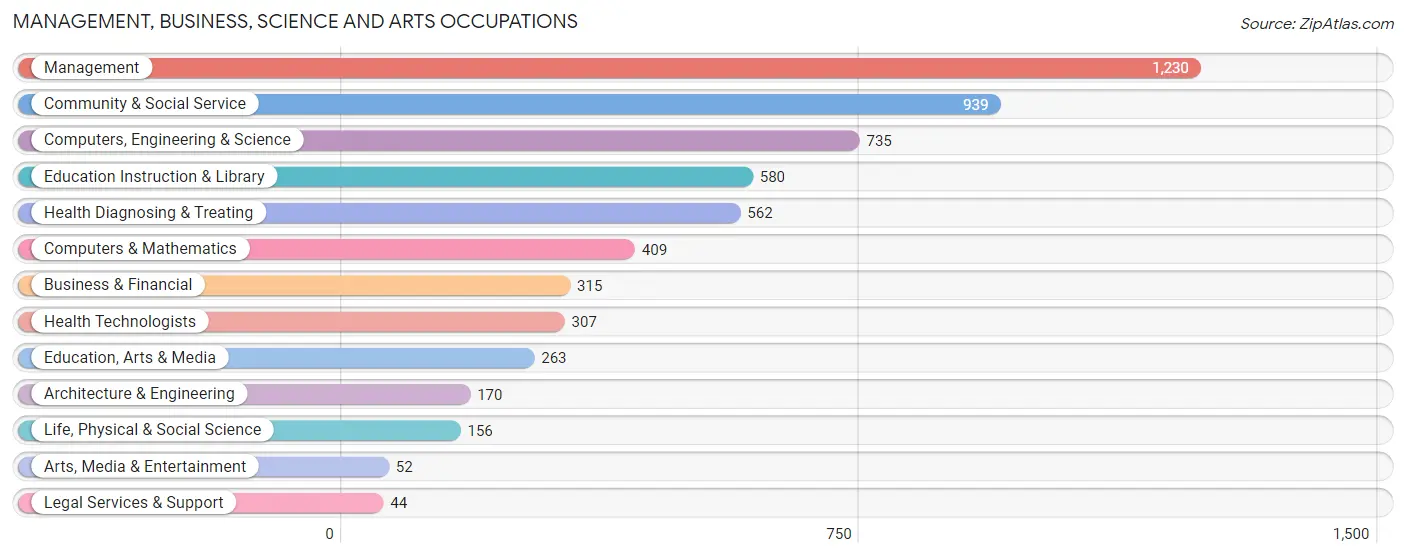
Management, Business, Science and Arts Occupations
The most common Management, Business, Science and Arts occupations in Sanford are Management (1,230 | 9.0%), Community & Social Service (939 | 6.9%), Computers, Engineering & Science (735 | 5.4%), Education Instruction & Library (580 | 4.3%), and Health Diagnosing & Treating (562 | 4.1%).
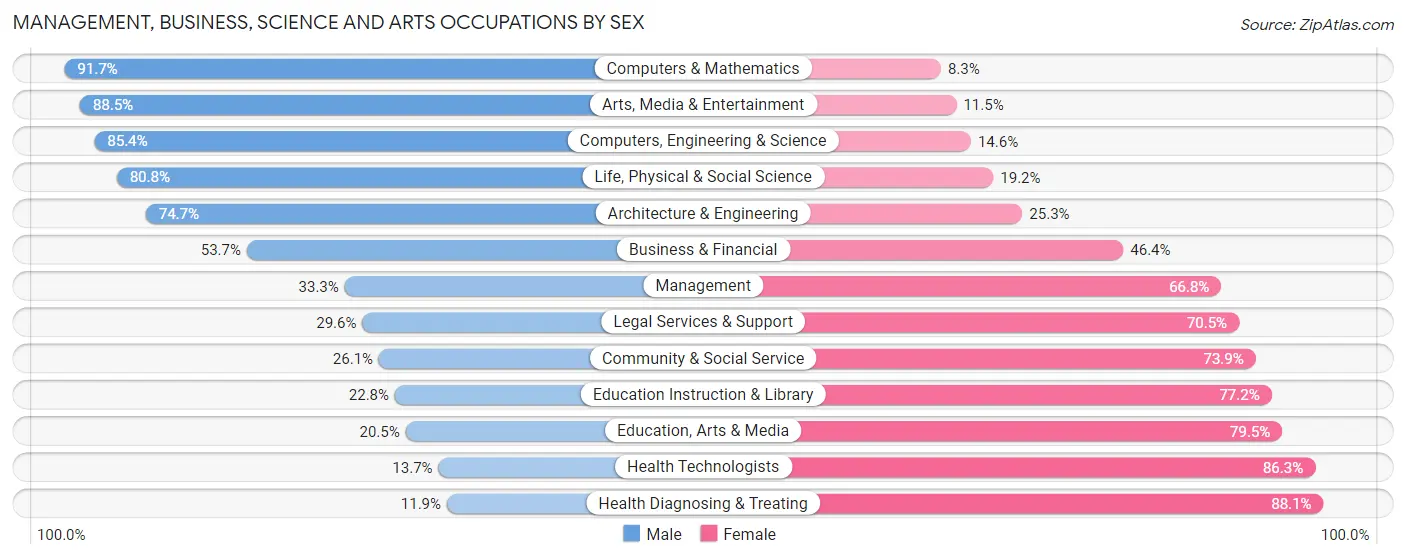
Management, Business, Science and Arts Occupations by Sex
Within the Management, Business, Science and Arts occupations in Sanford, the most male-oriented occupations are Computers & Mathematics (91.7%), Arts, Media & Entertainment (88.5%), and Computers, Engineering & Science (85.4%), while the most female-oriented occupations are Health Diagnosing & Treating (88.1%), Health Technologists (86.3%), and Education, Arts & Media (79.5%).
| Occupation | Male | Female |
| Management | 409 (33.3%) | 821 (66.7%) |
| Business & Financial | 169 (53.6%) | 146 (46.4%) |
| Computers, Engineering & Science | 628 (85.4%) | 107 (14.6%) |
| Computers & Mathematics | 375 (91.7%) | 34 (8.3%) |
| Architecture & Engineering | 127 (74.7%) | 43 (25.3%) |
| Life, Physical & Social Science | 126 (80.8%) | 30 (19.2%) |
| Community & Social Service | 245 (26.1%) | 694 (73.9%) |
| Education, Arts & Media | 54 (20.5%) | 209 (79.5%) |
| Legal Services & Support | 13 (29.5%) | 31 (70.5%) |
| Education Instruction & Library | 132 (22.8%) | 448 (77.2%) |
| Arts, Media & Entertainment | 46 (88.5%) | 6 (11.5%) |
| Health Diagnosing & Treating | 67 (11.9%) | 495 (88.1%) |
| Health Technologists | 42 (13.7%) | 265 (86.3%) |
| Total (Category) | 1,518 (40.2%) | 2,263 (59.9%) |
| Total (Overall) | 7,403 (54.5%) | 6,186 (45.5%) |
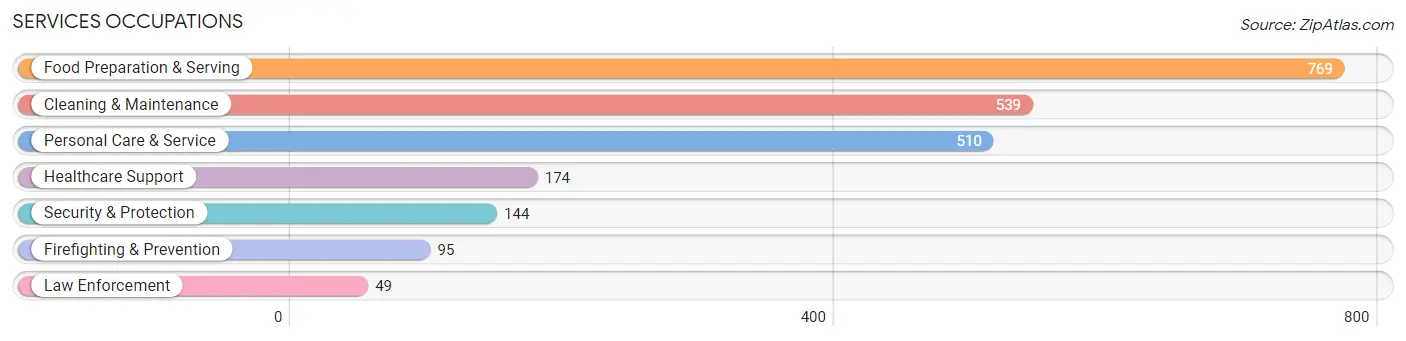
Services Occupations
The most common Services occupations in Sanford are Food Preparation & Serving (769 | 5.7%), Cleaning & Maintenance (539 | 4.0%), Personal Care & Service (510 | 3.7%), Healthcare Support (174 | 1.3%), and Security & Protection (144 | 1.1%).
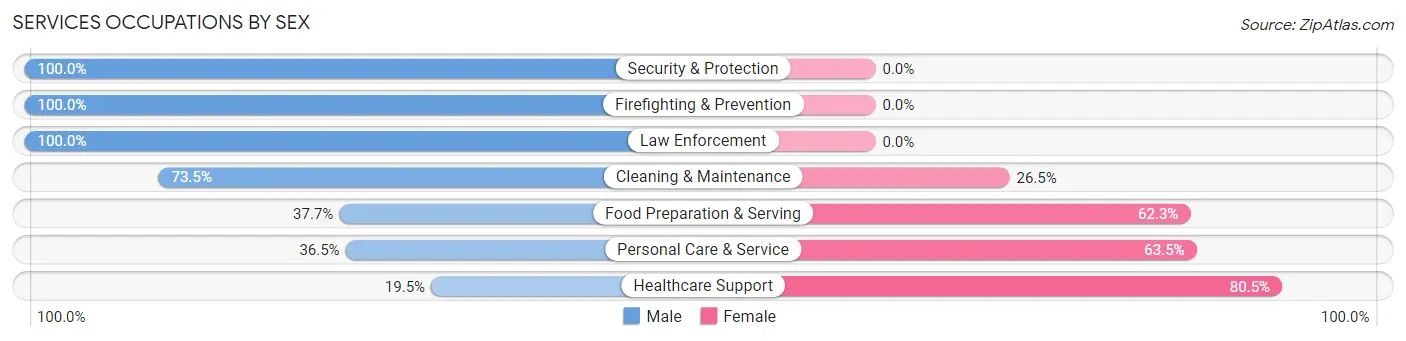
Services Occupations by Sex
Within the Services occupations in Sanford, the most male-oriented occupations are Security & Protection (100.0%), Firefighting & Prevention (100.0%), and Law Enforcement (100.0%), while the most female-oriented occupations are Healthcare Support (80.5%), Personal Care & Service (63.5%), and Food Preparation & Serving (62.3%).
| Occupation | Male | Female |
| Healthcare Support | 34 (19.5%) | 140 (80.5%) |
| Security & Protection | 144 (100.0%) | 0 (0.0%) |
| Firefighting & Prevention | 95 (100.0%) | 0 (0.0%) |
| Law Enforcement | 49 (100.0%) | 0 (0.0%) |
| Food Preparation & Serving | 290 (37.7%) | 479 (62.3%) |
| Cleaning & Maintenance | 396 (73.5%) | 143 (26.5%) |
| Personal Care & Service | 186 (36.5%) | 324 (63.5%) |
| Total (Category) | 1,050 (49.2%) | 1,086 (50.8%) |
| Total (Overall) | 7,403 (54.5%) | 6,186 (45.5%) |
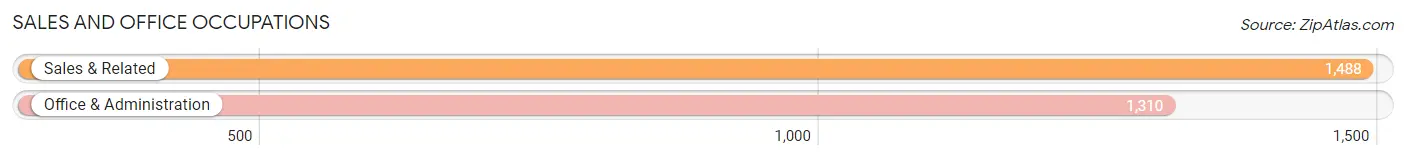
Sales and Office Occupations
The most common Sales and Office occupations in Sanford are Sales & Related (1,488 | 11.0%), and Office & Administration (1,310 | 9.6%).
Sales and Office Occupations by Sex
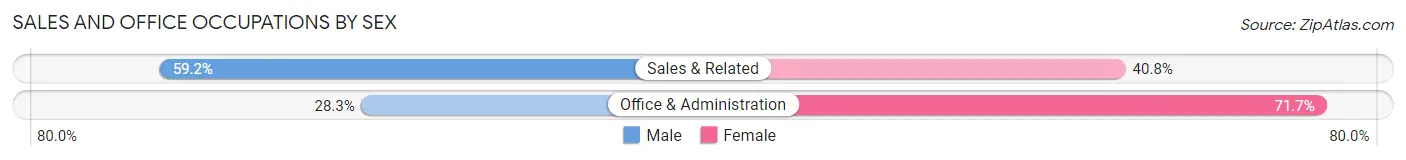
| Occupation | Male | Female |
| Sales & Related | 881 (59.2%) | 607 (40.8%) |
| Office & Administration | 371 (28.3%) | 939 (71.7%) |
| Total (Category) | 1,252 (44.8%) | 1,546 (55.2%) |
| Total (Overall) | 7,403 (54.5%) | 6,186 (45.5%) |
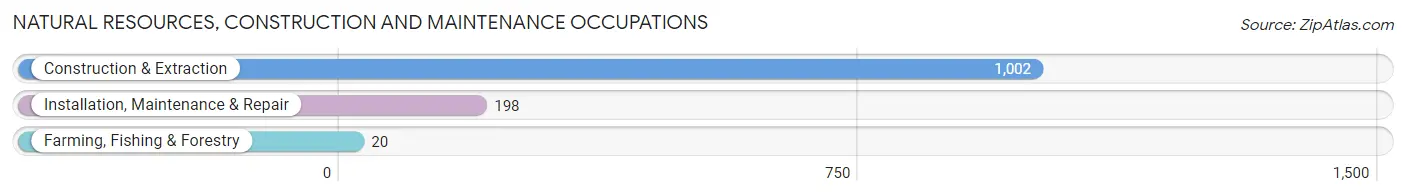
Natural Resources, Construction and Maintenance Occupations
The most common Natural Resources, Construction and Maintenance occupations in Sanford are Construction & Extraction (1,002 | 7.4%), Installation, Maintenance & Repair (198 | 1.5%), and Farming, Fishing & Forestry (20 | 0.2%).
Natural Resources, Construction and Maintenance Occupations by Sex
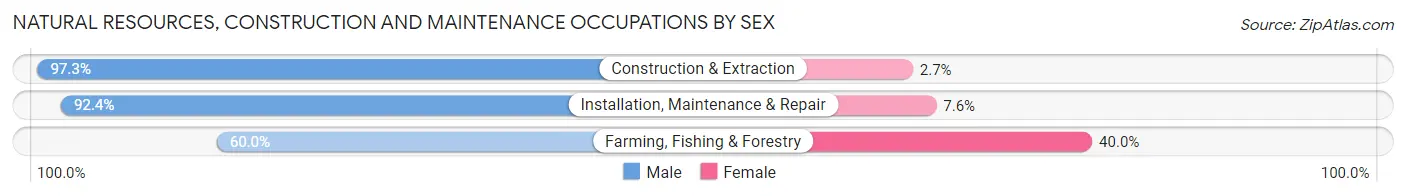
| Occupation | Male | Female |
| Farming, Fishing & Forestry | 12 (60.0%) | 8 (40.0%) |
| Construction & Extraction | 975 (97.3%) | 27 (2.7%) |
| Installation, Maintenance & Repair | 183 (92.4%) | 15 (7.6%) |
| Total (Category) | 1,170 (95.9%) | 50 (4.1%) |
| Total (Overall) | 7,403 (54.5%) | 6,186 (45.5%) |
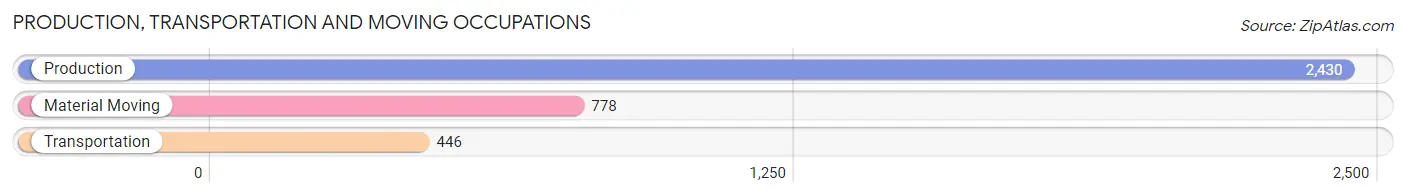
Production, Transportation and Moving Occupations
The most common Production, Transportation and Moving occupations in Sanford are Production (2,430 | 17.9%), Material Moving (778 | 5.7%), and Transportation (446 | 3.3%).
Production, Transportation and Moving Occupations by Sex
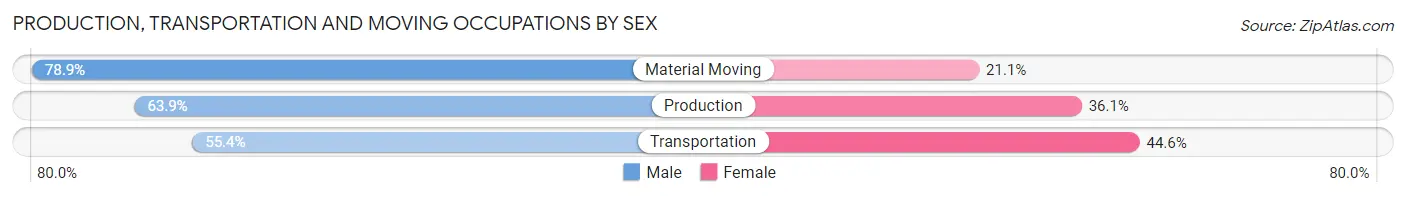
| Occupation | Male | Female |
| Production | 1,552 (63.9%) | 878 (36.1%) |
| Transportation | 247 (55.4%) | 199 (44.6%) |
| Material Moving | 614 (78.9%) | 164 (21.1%) |
| Total (Category) | 2,413 (66.0%) | 1,241 (34.0%) |
| Total (Overall) | 7,403 (54.5%) | 6,186 (45.5%) |
Employment Industries by Sex in Sanford
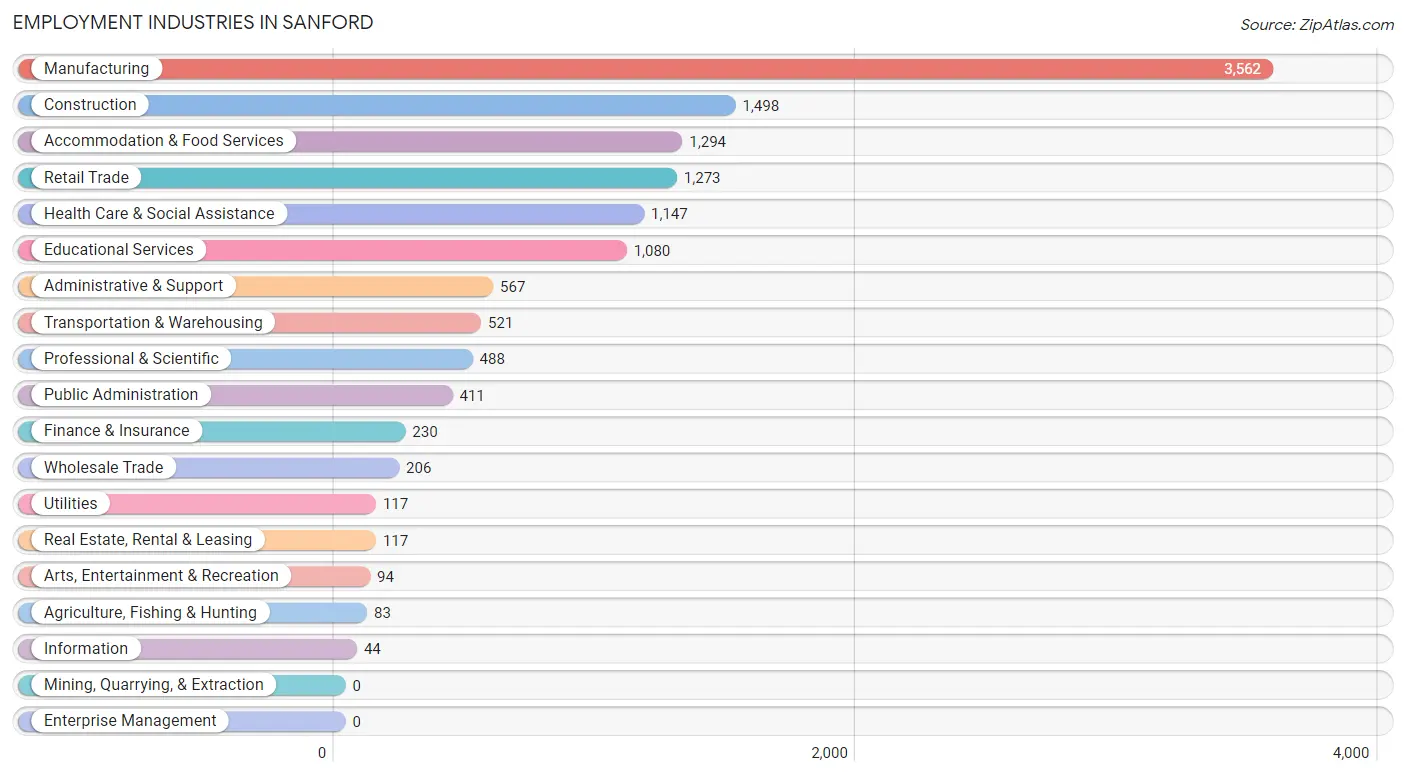
Employment Industries in Sanford
The major employment industries in Sanford include Manufacturing (3,562 | 26.2%), Construction (1,498 | 11.0%), Accommodation & Food Services (1,294 | 9.5%), Retail Trade (1,273 | 9.4%), and Health Care & Social Assistance (1,147 | 8.4%).
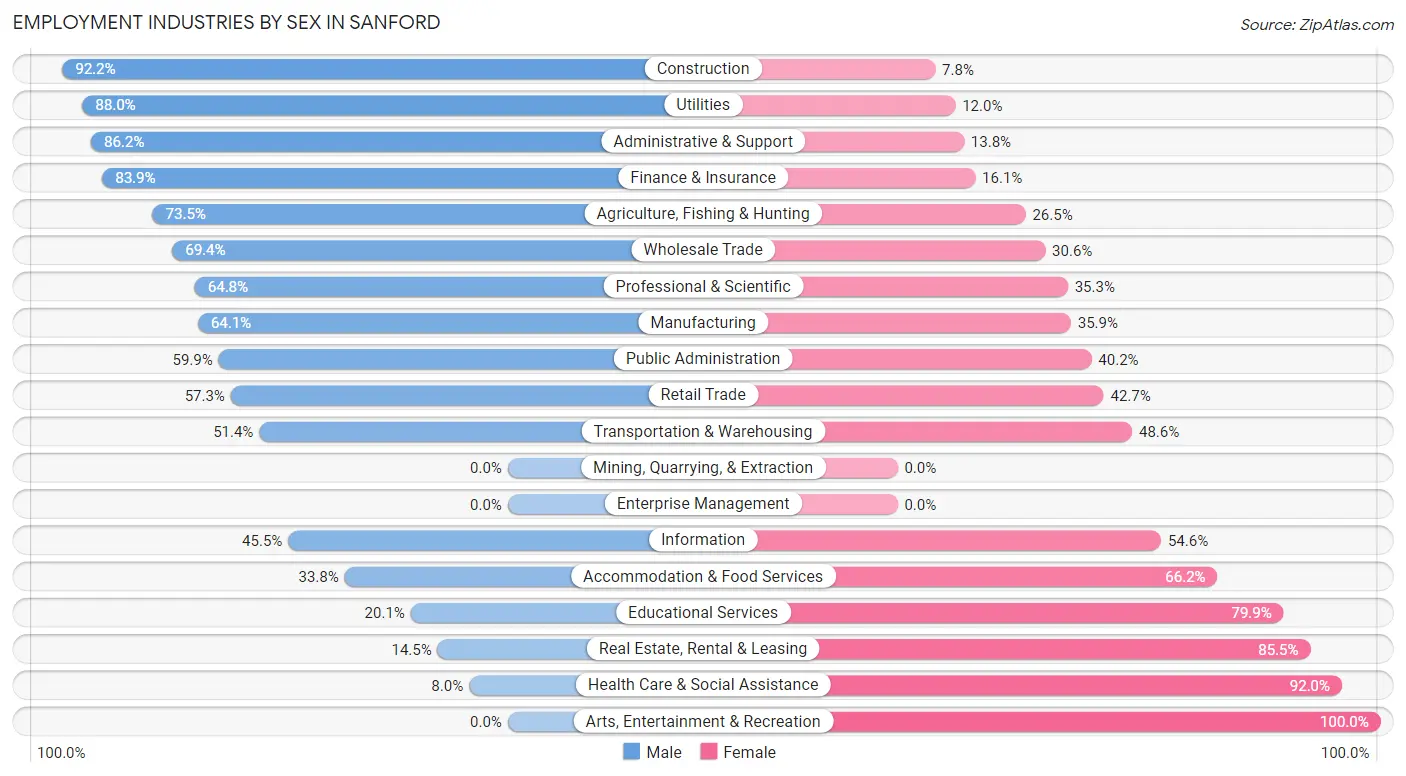
Employment Industries by Sex in Sanford
The Sanford industries that see more men than women are Construction (92.2%), Utilities (88.0%), and Administrative & Support (86.2%), whereas the industries that tend to have a higher number of women are Arts, Entertainment & Recreation (100.0%), Health Care & Social Assistance (92.0%), and Real Estate, Rental & Leasing (85.5%).
| Industry | Male | Female |
| Agriculture, Fishing & Hunting | 61 (73.5%) | 22 (26.5%) |
| Mining, Quarrying, & Extraction | 0 (0.0%) | 0 (0.0%) |
| Construction | 1,381 (92.2%) | 117 (7.8%) |
| Manufacturing | 2,284 (64.1%) | 1,278 (35.9%) |
| Wholesale Trade | 143 (69.4%) | 63 (30.6%) |
| Retail Trade | 730 (57.3%) | 543 (42.7%) |
| Transportation & Warehousing | 268 (51.4%) | 253 (48.6%) |
| Utilities | 103 (88.0%) | 14 (12.0%) |
| Information | 20 (45.5%) | 24 (54.5%) |
| Finance & Insurance | 193 (83.9%) | 37 (16.1%) |
| Real Estate, Rental & Leasing | 17 (14.5%) | 100 (85.5%) |
| Professional & Scientific | 316 (64.7%) | 172 (35.2%) |
| Enterprise Management | 0 (0.0%) | 0 (0.0%) |
| Administrative & Support | 489 (86.2%) | 78 (13.8%) |
| Educational Services | 217 (20.1%) | 863 (79.9%) |
| Health Care & Social Assistance | 92 (8.0%) | 1,055 (92.0%) |
| Arts, Entertainment & Recreation | 0 (0.0%) | 94 (100.0%) |
| Accommodation & Food Services | 437 (33.8%) | 857 (66.2%) |
| Public Administration | 246 (59.9%) | 165 (40.2%) |
| Total | 7,403 (54.5%) | 6,186 (45.5%) |
Education in Sanford
School Enrollment in Sanford
The most common levels of schooling among the 7,823 students in Sanford are middle school (2,222 | 28.4%), elementary school (1,791 | 22.9%), and high school (1,579 | 20.2%).
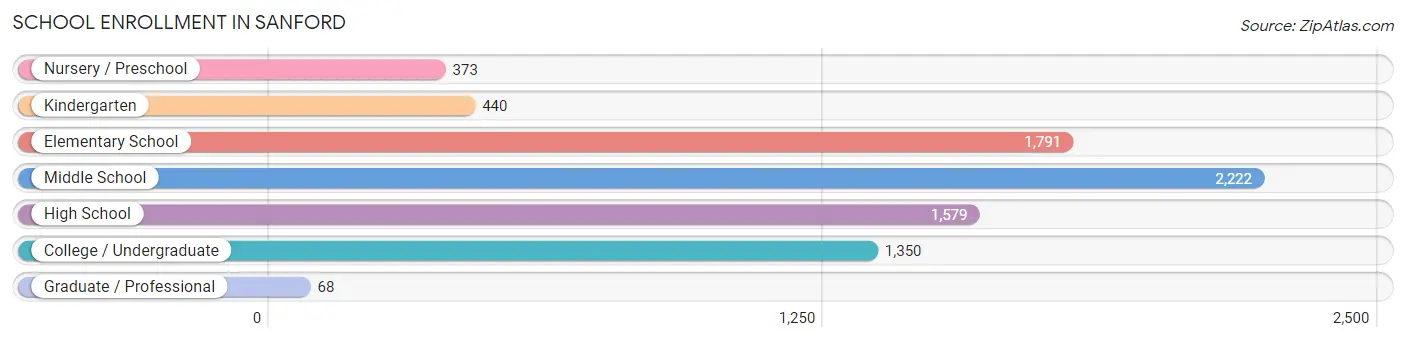
| School Level | # Students | % Students |
| Nursery / Preschool | 373 | 4.8% |
| Kindergarten | 440 | 5.6% |
| Elementary School | 1,791 | 22.9% |
| Middle School | 2,222 | 28.4% |
| High School | 1,579 | 20.2% |
| College / Undergraduate | 1,350 | 17.3% |
| Graduate / Professional | 68 | 0.9% |
| Total | 7,823 | 100.0% |
School Enrollment by Age by Funding Source in Sanford
Out of a total of 7,823 students who are enrolled in schools in Sanford, 1,119 (14.3%) attend a private institution, while the remaining 6,704 (85.7%) are enrolled in public schools. The age group of 20 to 24 year olds has the highest likelihood of being enrolled in private schools, with 268 (53.0% in the age bracket) enrolled. Conversely, the age group of 25 to 34 year olds has the lowest likelihood of being enrolled in a private school, with 358 (100.0% in the age bracket) attending a public institution.
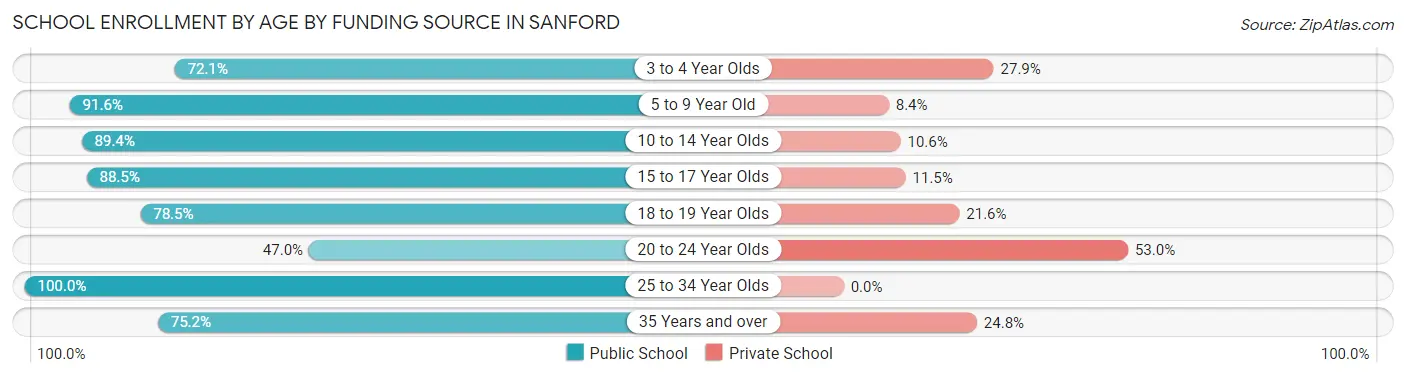
| Age Bracket | Public School | Private School |
| 3 to 4 Year Olds | 209 (72.1%) | 81 (27.9%) |
| 5 to 9 Year Old | 1,973 (91.6%) | 181 (8.4%) |
| 10 to 14 Year Olds | 2,243 (89.4%) | 266 (10.6%) |
| 15 to 17 Year Olds | 1,096 (88.5%) | 143 (11.5%) |
| 18 to 19 Year Olds | 273 (78.4%) | 75 (21.5%) |
| 20 to 24 Year Olds | 238 (47.0%) | 268 (53.0%) |
| 25 to 34 Year Olds | 358 (100.0%) | 0 (0.0%) |
| 35 Years and over | 315 (75.2%) | 104 (24.8%) |
| Total | 6,704 (85.7%) | 1,119 (14.3%) |
Educational Attainment by Field of Study in Sanford
Business (1,033 | 24.8%), education (777 | 18.7%), arts & humanities (397 | 9.5%), social sciences (384 | 9.2%), and science & technology (275 | 6.6%) are the most common fields of study among 4,160 individuals in Sanford who have obtained a bachelor's degree or higher.
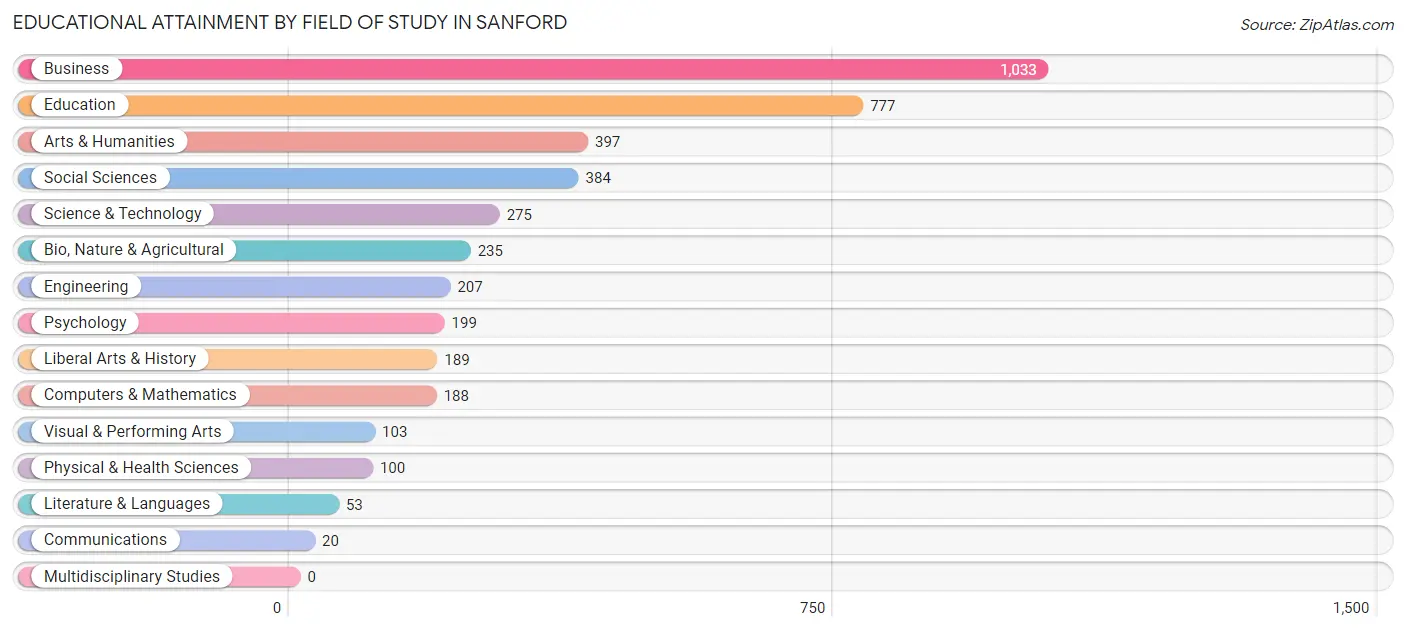
| Field of Study | # Graduates | % Graduates |
| Computers & Mathematics | 188 | 4.5% |
| Bio, Nature & Agricultural | 235 | 5.7% |
| Physical & Health Sciences | 100 | 2.4% |
| Psychology | 199 | 4.8% |
| Social Sciences | 384 | 9.2% |
| Engineering | 207 | 5.0% |
| Multidisciplinary Studies | 0 | 0.0% |
| Science & Technology | 275 | 6.6% |
| Business | 1,033 | 24.8% |
| Education | 777 | 18.7% |
| Literature & Languages | 53 | 1.3% |
| Liberal Arts & History | 189 | 4.5% |
| Visual & Performing Arts | 103 | 2.5% |
| Communications | 20 | 0.5% |
| Arts & Humanities | 397 | 9.5% |
| Total | 4,160 | 100.0% |
Transportation & Commute in Sanford
Vehicle Availability by Sex in Sanford
The most prevalent vehicle ownership categories in Sanford are males with 2 vehicles (2,992, accounting for 40.6%) and females with 2 vehicles (2,327, making up 49.4%).
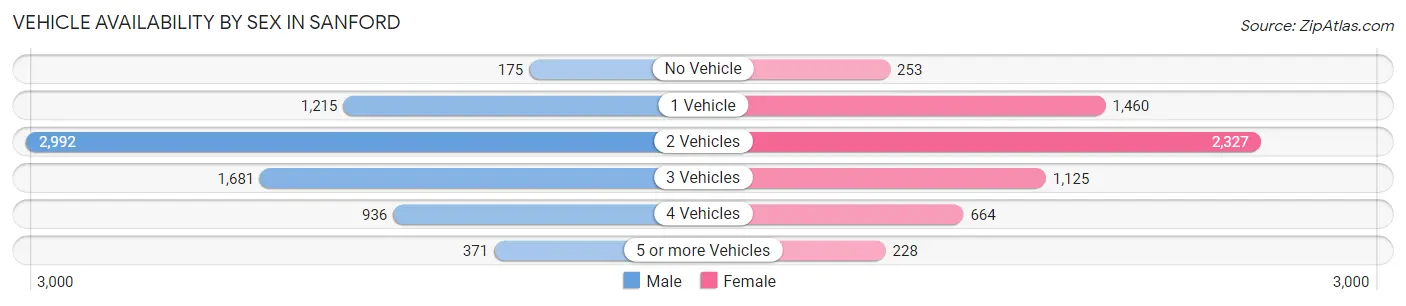
| Vehicles Available | Male | Female |
| No Vehicle | 175 (2.4%) | 253 (4.2%) |
| 1 Vehicle | 1,215 (16.5%) | 1,460 (24.1%) |
| 2 Vehicles | 2,992 (40.6%) | 2,327 (38.4%) |
| 3 Vehicles | 1,681 (22.8%) | 1,125 (18.6%) |
| 4 Vehicles | 936 (12.7%) | 664 (11.0%) |
| 5 or more Vehicles | 371 (5.0%) | 228 (3.8%) |
| Total | 7,370 (100.0%) | 6,057 (100.0%) |
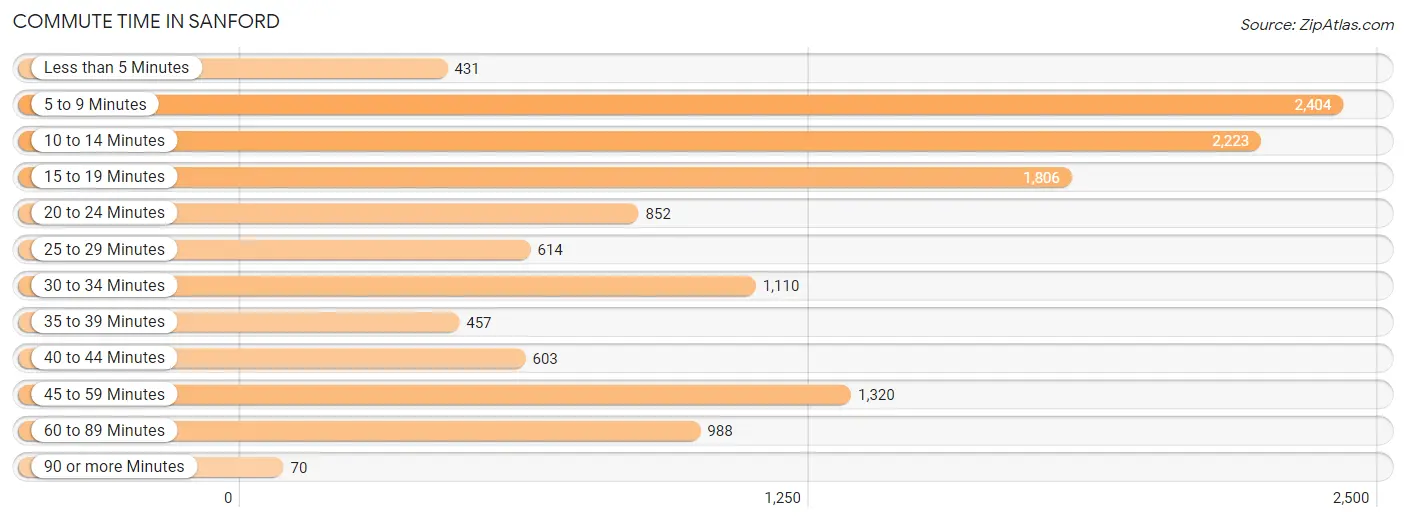
Commute Time in Sanford
The most frequently occuring commute durations in Sanford are 5 to 9 minutes (2,404 commuters, 18.7%), 10 to 14 minutes (2,223 commuters, 17.3%), and 15 to 19 minutes (1,806 commuters, 14.0%).
| Commute Time | # Commuters | % Commuters |
| Less than 5 Minutes | 431 | 3.4% |
| 5 to 9 Minutes | 2,404 | 18.7% |
| 10 to 14 Minutes | 2,223 | 17.3% |
| 15 to 19 Minutes | 1,806 | 14.0% |
| 20 to 24 Minutes | 852 | 6.6% |
| 25 to 29 Minutes | 614 | 4.8% |
| 30 to 34 Minutes | 1,110 | 8.6% |
| 35 to 39 Minutes | 457 | 3.5% |
| 40 to 44 Minutes | 603 | 4.7% |
| 45 to 59 Minutes | 1,320 | 10.2% |
| 60 to 89 Minutes | 988 | 7.7% |
| 90 or more Minutes | 70 | 0.5% |
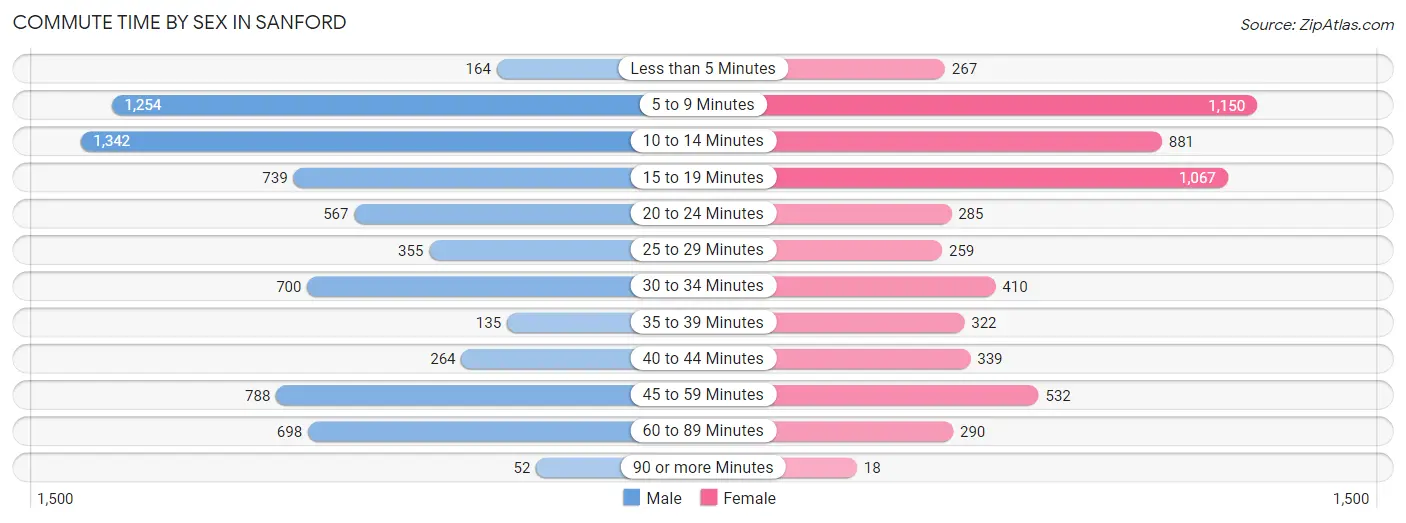
Commute Time by Sex in Sanford
The most common commute times in Sanford are 10 to 14 minutes (1,342 commuters, 19.0%) for males and 5 to 9 minutes (1,150 commuters, 19.8%) for females.
| Commute Time | Male | Female |
| Less than 5 Minutes | 164 (2.3%) | 267 (4.6%) |
| 5 to 9 Minutes | 1,254 (17.8%) | 1,150 (19.8%) |
| 10 to 14 Minutes | 1,342 (19.0%) | 881 (15.1%) |
| 15 to 19 Minutes | 739 (10.5%) | 1,067 (18.3%) |
| 20 to 24 Minutes | 567 (8.0%) | 285 (4.9%) |
| 25 to 29 Minutes | 355 (5.0%) | 259 (4.4%) |
| 30 to 34 Minutes | 700 (9.9%) | 410 (7.0%) |
| 35 to 39 Minutes | 135 (1.9%) | 322 (5.5%) |
| 40 to 44 Minutes | 264 (3.7%) | 339 (5.8%) |
| 45 to 59 Minutes | 788 (11.2%) | 532 (9.1%) |
| 60 to 89 Minutes | 698 (9.9%) | 290 (5.0%) |
| 90 or more Minutes | 52 (0.7%) | 18 (0.3%) |
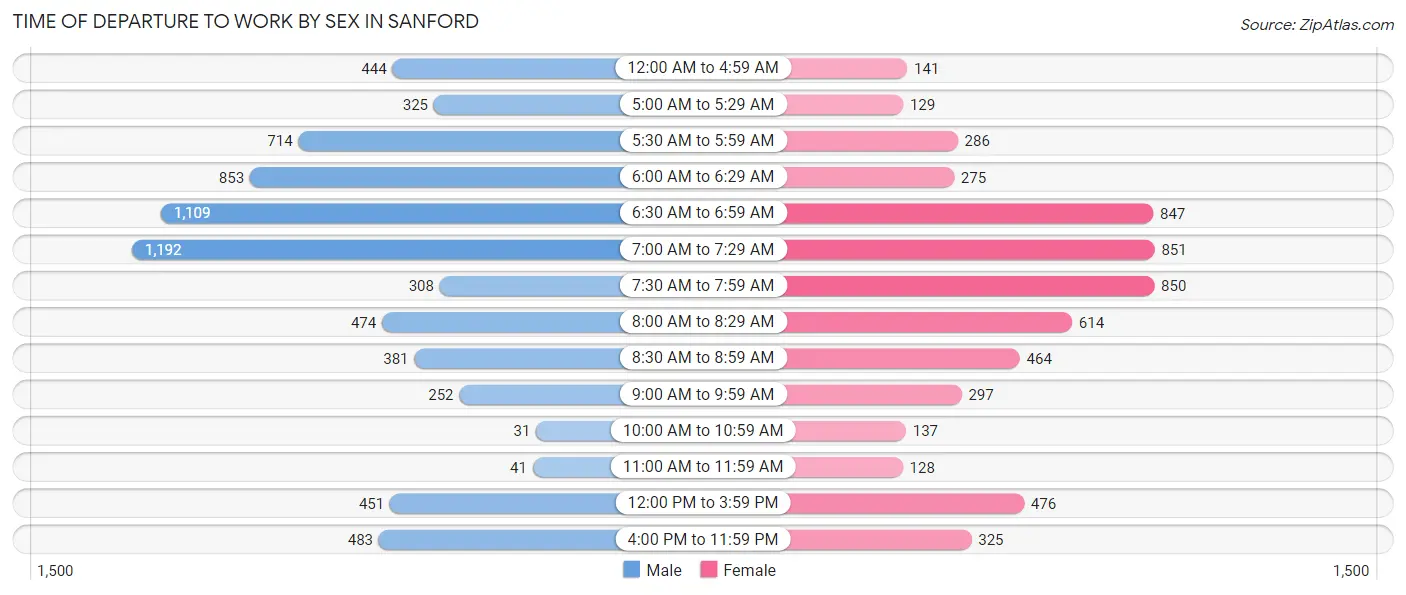
Time of Departure to Work by Sex in Sanford
The most frequent times of departure to work in Sanford are 7:00 AM to 7:29 AM (1,192, 16.9%) for males and 7:00 AM to 7:29 AM (851, 14.6%) for females.
| Time of Departure | Male | Female |
| 12:00 AM to 4:59 AM | 444 (6.3%) | 141 (2.4%) |
| 5:00 AM to 5:29 AM | 325 (4.6%) | 129 (2.2%) |
| 5:30 AM to 5:59 AM | 714 (10.1%) | 286 (4.9%) |
| 6:00 AM to 6:29 AM | 853 (12.1%) | 275 (4.7%) |
| 6:30 AM to 6:59 AM | 1,109 (15.7%) | 847 (14.5%) |
| 7:00 AM to 7:29 AM | 1,192 (16.9%) | 851 (14.6%) |
| 7:30 AM to 7:59 AM | 308 (4.4%) | 850 (14.6%) |
| 8:00 AM to 8:29 AM | 474 (6.7%) | 614 (10.5%) |
| 8:30 AM to 8:59 AM | 381 (5.4%) | 464 (8.0%) |
| 9:00 AM to 9:59 AM | 252 (3.6%) | 297 (5.1%) |
| 10:00 AM to 10:59 AM | 31 (0.4%) | 137 (2.4%) |
| 11:00 AM to 11:59 AM | 41 (0.6%) | 128 (2.2%) |
| 12:00 PM to 3:59 PM | 451 (6.4%) | 476 (8.2%) |
| 4:00 PM to 11:59 PM | 483 (6.8%) | 325 (5.6%) |
| Total | 7,058 (100.0%) | 5,820 (100.0%) |
Housing Occupancy in Sanford
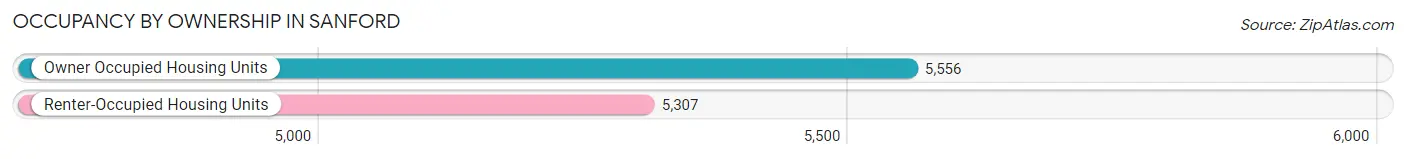
Occupancy by Ownership in Sanford
Of the total 10,863 dwellings in Sanford, owner-occupied units account for 5,556 (51.1%), while renter-occupied units make up 5,307 (48.8%).
| Occupancy | # Housing Units | % Housing Units |
| Owner Occupied Housing Units | 5,556 | 51.1% |
| Renter-Occupied Housing Units | 5,307 | 48.8% |
| Total Occupied Housing Units | 10,863 | 100.0% |
Occupancy by Household Size in Sanford
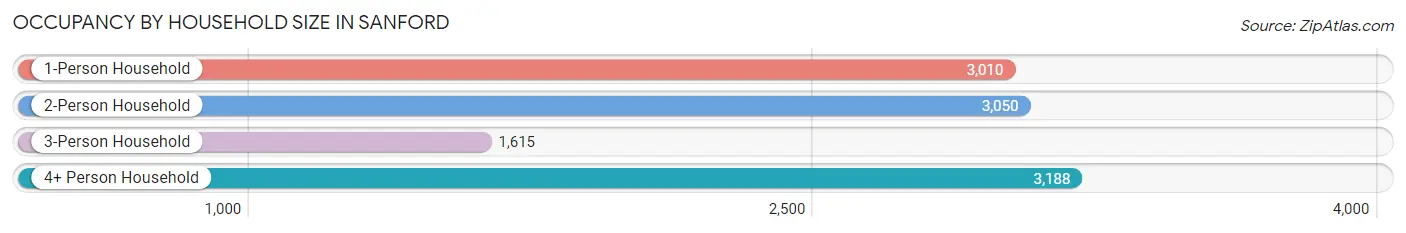
| Household Size | # Housing Units | % Housing Units |
| 1-Person Household | 3,010 | 27.7% |
| 2-Person Household | 3,050 | 28.1% |
| 3-Person Household | 1,615 | 14.9% |
| 4+ Person Household | 3,188 | 29.3% |
| Total Housing Units | 10,863 | 100.0% |
Occupancy by Ownership by Household Size in Sanford
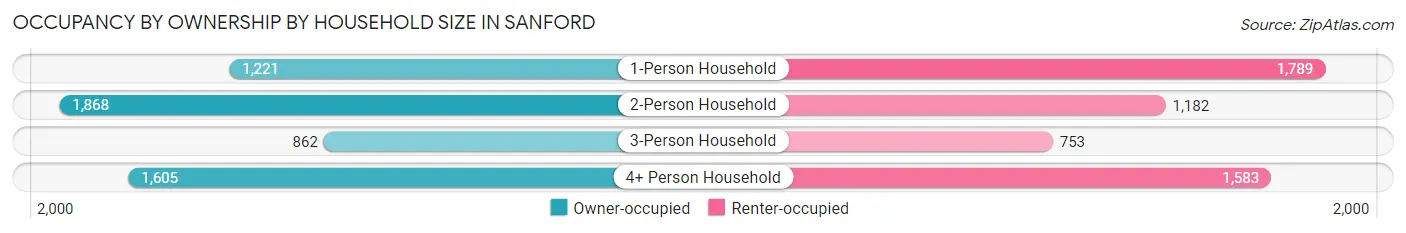
| Household Size | Owner-occupied | Renter-occupied |
| 1-Person Household | 1,221 (40.6%) | 1,789 (59.4%) |
| 2-Person Household | 1,868 (61.3%) | 1,182 (38.8%) |
| 3-Person Household | 862 (53.4%) | 753 (46.6%) |
| 4+ Person Household | 1,605 (50.3%) | 1,583 (49.6%) |
| Total Housing Units | 5,556 (51.1%) | 5,307 (48.8%) |
Occupancy by Educational Attainment in Sanford
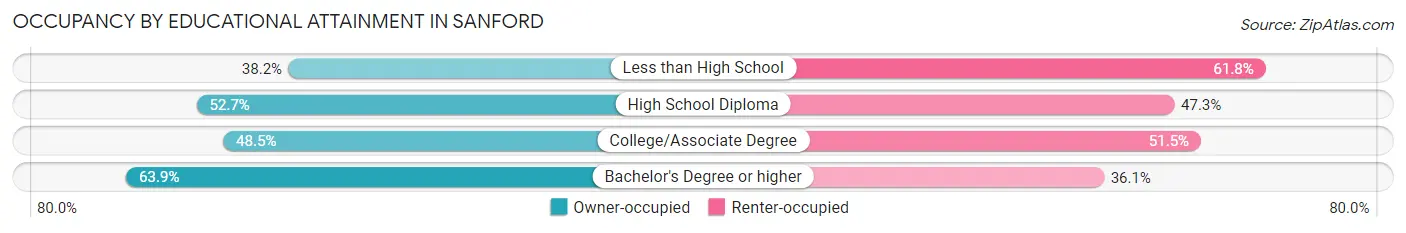
| Household Size | Owner-occupied | Renter-occupied |
| Less than High School | 720 (38.2%) | 1,163 (61.8%) |
| High School Diploma | 1,377 (52.7%) | 1,234 (47.3%) |
| College/Associate Degree | 1,924 (48.5%) | 2,043 (51.5%) |
| Bachelor's Degree or higher | 1,535 (63.9%) | 867 (36.1%) |
Occupancy by Age of Householder in Sanford
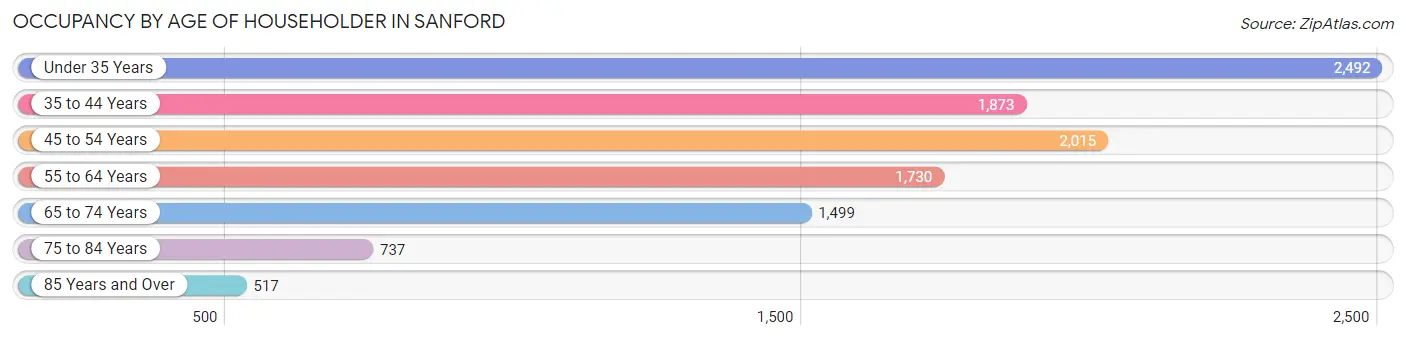
| Age Bracket | # Households | % Households |
| Under 35 Years | 2,492 | 22.9% |
| 35 to 44 Years | 1,873 | 17.2% |
| 45 to 54 Years | 2,015 | 18.5% |
| 55 to 64 Years | 1,730 | 15.9% |
| 65 to 74 Years | 1,499 | 13.8% |
| 75 to 84 Years | 737 | 6.8% |
| 85 Years and Over | 517 | 4.8% |
| Total | 10,863 | 100.0% |
Housing Finances in Sanford
Median Income by Occupancy in Sanford
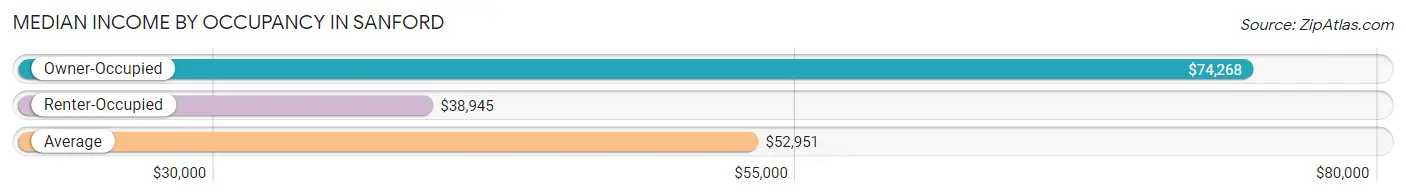
| Occupancy Type | # Households | Median Income |
| Owner-Occupied | 5,556 (51.1%) | $74,268 |
| Renter-Occupied | 5,307 (48.8%) | $38,945 |
| Average | 10,863 (100.0%) | $52,951 |
Occupancy by Householder Income Bracket in Sanford
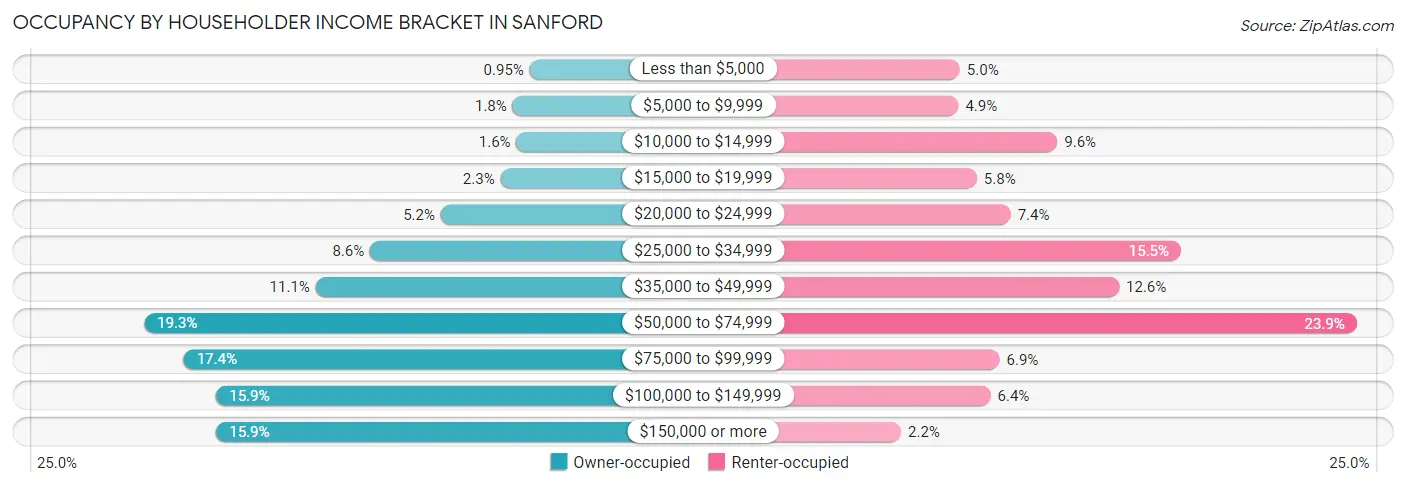
| Income Bracket | Owner-occupied | Renter-occupied |
| Less than $5,000 | 53 (0.9%) | 264 (5.0%) |
| $5,000 to $9,999 | 98 (1.8%) | 260 (4.9%) |
| $10,000 to $14,999 | 88 (1.6%) | 510 (9.6%) |
| $15,000 to $19,999 | 130 (2.3%) | 307 (5.8%) |
| $20,000 to $24,999 | 288 (5.2%) | 392 (7.4%) |
| $25,000 to $34,999 | 475 (8.6%) | 822 (15.5%) |
| $35,000 to $49,999 | 619 (11.1%) | 666 (12.6%) |
| $50,000 to $74,999 | 1,073 (19.3%) | 1,266 (23.9%) |
| $75,000 to $99,999 | 968 (17.4%) | 364 (6.9%) |
| $100,000 to $149,999 | 882 (15.9%) | 341 (6.4%) |
| $150,000 or more | 882 (15.9%) | 115 (2.2%) |
| Total | 5,556 (100.0%) | 5,307 (100.0%) |
Monthly Housing Cost Tiers in Sanford
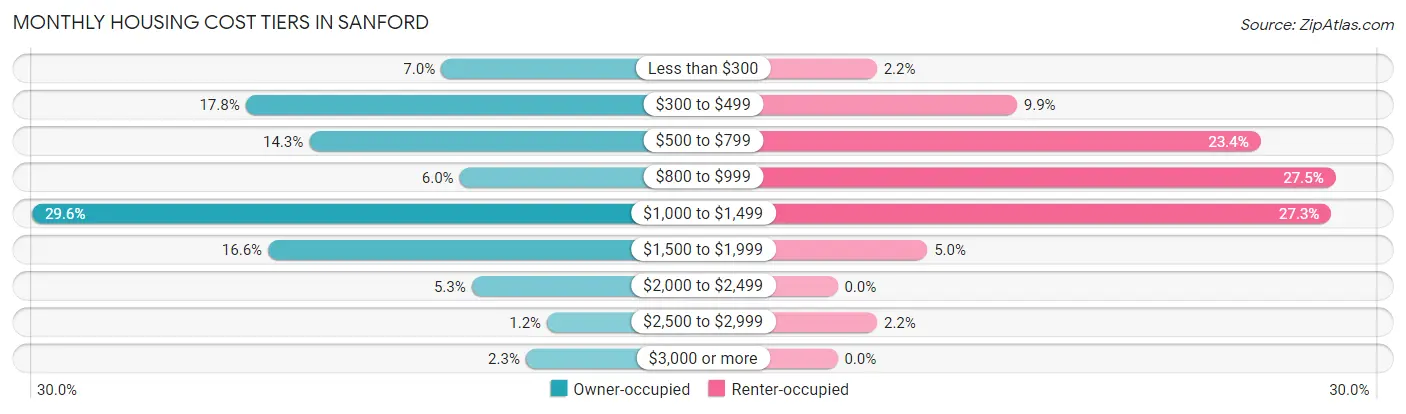
| Monthly Cost | Owner-occupied | Renter-occupied |
| Less than $300 | 389 (7.0%) | 115 (2.2%) |
| $300 to $499 | 989 (17.8%) | 526 (9.9%) |
| $500 to $799 | 794 (14.3%) | 1,240 (23.4%) |
| $800 to $999 | 332 (6.0%) | 1,460 (27.5%) |
| $1,000 to $1,499 | 1,644 (29.6%) | 1,447 (27.3%) |
| $1,500 to $1,999 | 920 (16.6%) | 263 (5.0%) |
| $2,000 to $2,499 | 295 (5.3%) | 0 (0.0%) |
| $2,500 to $2,999 | 64 (1.1%) | 116 (2.2%) |
| $3,000 or more | 129 (2.3%) | 0 (0.0%) |
| Total | 5,556 (100.0%) | 5,307 (100.0%) |
Physical Housing Characteristics in Sanford
Housing Structures in Sanford
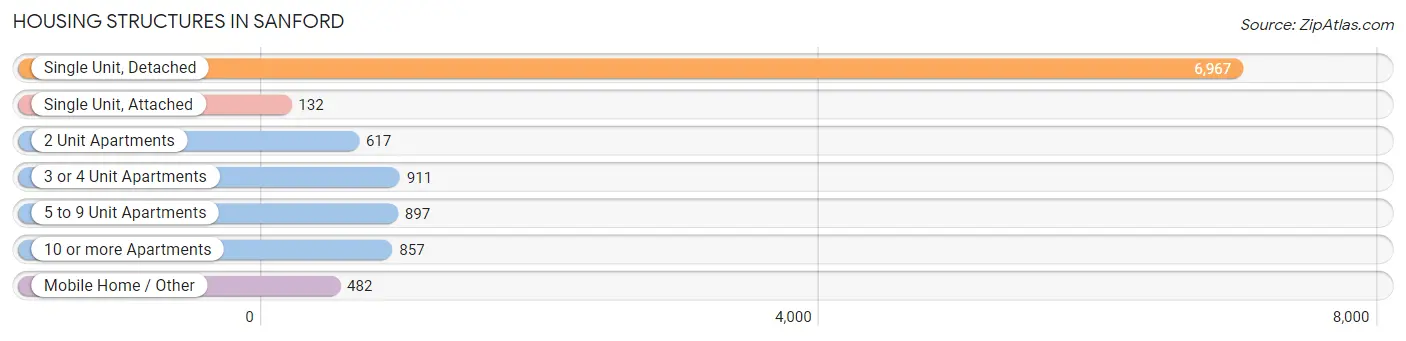
| Structure Type | # Housing Units | % Housing Units |
| Single Unit, Detached | 6,967 | 64.1% |
| Single Unit, Attached | 132 | 1.2% |
| 2 Unit Apartments | 617 | 5.7% |
| 3 or 4 Unit Apartments | 911 | 8.4% |
| 5 to 9 Unit Apartments | 897 | 8.3% |
| 10 or more Apartments | 857 | 7.9% |
| Mobile Home / Other | 482 | 4.4% |
| Total | 10,863 | 100.0% |
Housing Structures by Occupancy in Sanford
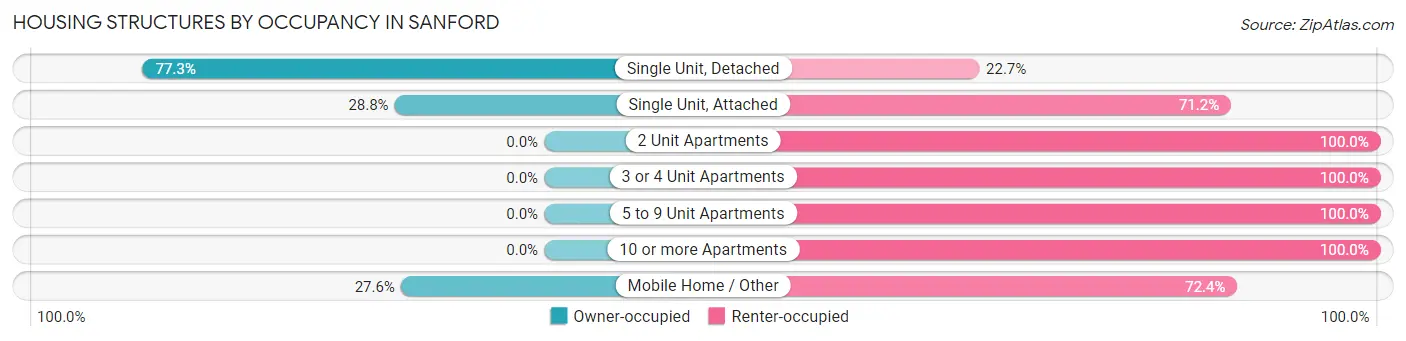
| Structure Type | Owner-occupied | Renter-occupied |
| Single Unit, Detached | 5,385 (77.3%) | 1,582 (22.7%) |
| Single Unit, Attached | 38 (28.8%) | 94 (71.2%) |
| 2 Unit Apartments | 0 (0.0%) | 617 (100.0%) |
| 3 or 4 Unit Apartments | 0 (0.0%) | 911 (100.0%) |
| 5 to 9 Unit Apartments | 0 (0.0%) | 897 (100.0%) |
| 10 or more Apartments | 0 (0.0%) | 857 (100.0%) |
| Mobile Home / Other | 133 (27.6%) | 349 (72.4%) |
| Total | 5,556 (51.1%) | 5,307 (48.8%) |
Housing Structures by Number of Rooms in Sanford
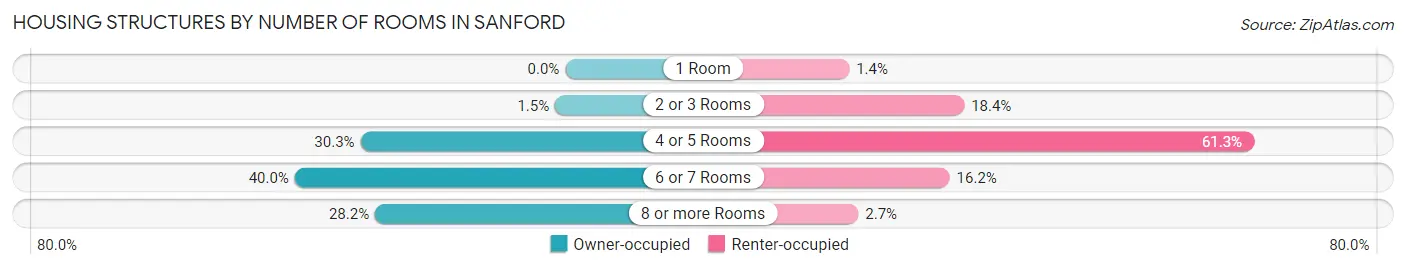
| Number of Rooms | Owner-occupied | Renter-occupied |
| 1 Room | 0 (0.0%) | 73 (1.4%) |
| 2 or 3 Rooms | 84 (1.5%) | 976 (18.4%) |
| 4 or 5 Rooms | 1,684 (30.3%) | 3,251 (61.3%) |
| 6 or 7 Rooms | 2,224 (40.0%) | 862 (16.2%) |
| 8 or more Rooms | 1,564 (28.1%) | 145 (2.7%) |
| Total | 5,556 (100.0%) | 5,307 (100.0%) |
Housing Structure by Heating Type in Sanford
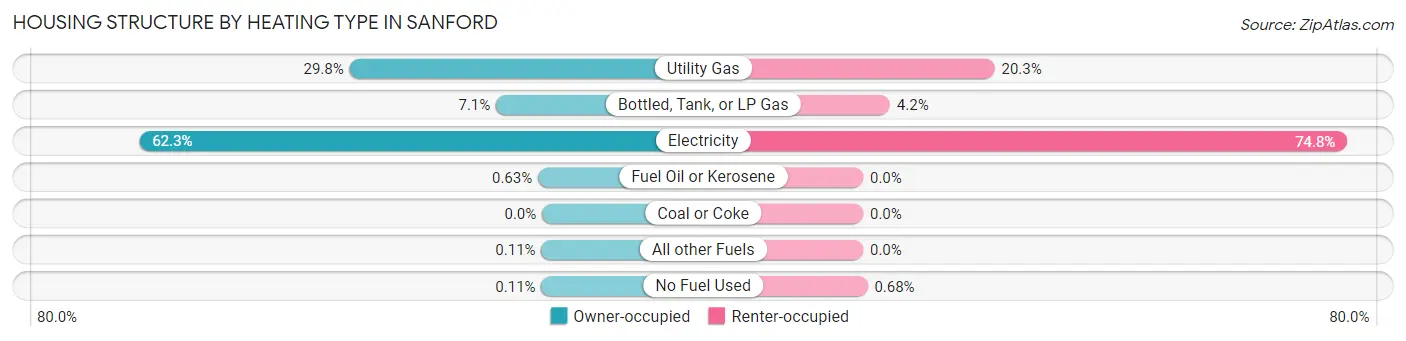
| Heating Type | Owner-occupied | Renter-occupied |
| Utility Gas | 1,654 (29.8%) | 1,079 (20.3%) |
| Bottled, Tank, or LP Gas | 395 (7.1%) | 220 (4.2%) |
| Electricity | 3,460 (62.3%) | 3,972 (74.8%) |
| Fuel Oil or Kerosene | 35 (0.6%) | 0 (0.0%) |
| Coal or Coke | 0 (0.0%) | 0 (0.0%) |
| All other Fuels | 6 (0.1%) | 0 (0.0%) |
| No Fuel Used | 6 (0.1%) | 36 (0.7%) |
| Total | 5,556 (100.0%) | 5,307 (100.0%) |
Household Vehicle Usage in Sanford
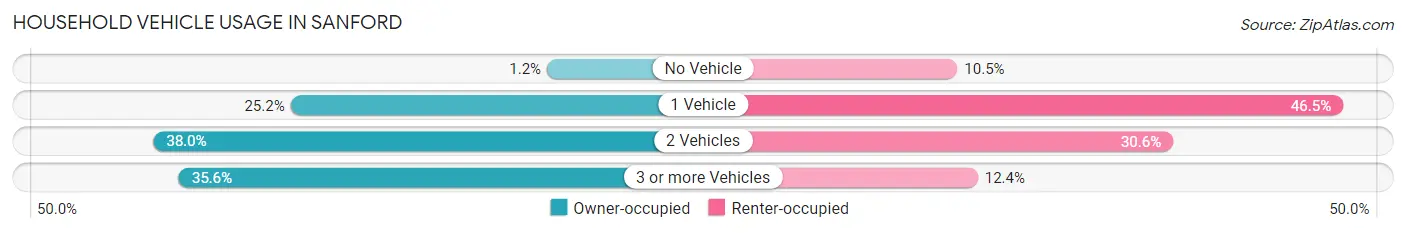
| Vehicles per Household | Owner-occupied | Renter-occupied |
| No Vehicle | 69 (1.2%) | 557 (10.5%) |
| 1 Vehicle | 1,399 (25.2%) | 2,467 (46.5%) |
| 2 Vehicles | 2,110 (38.0%) | 1,625 (30.6%) |
| 3 or more Vehicles | 1,978 (35.6%) | 658 (12.4%) |
| Total | 5,556 (100.0%) | 5,307 (100.0%) |
Real Estate & Mortgages in Sanford
Real Estate and Mortgage Overview in Sanford
| Characteristic | Without Mortgage | With Mortgage |
| Housing Units | 2,080 | 3,476 |
| Median Property Value | $118,700 | $206,400 |
| Median Household Income | $53,656 | $716 |
| Monthly Housing Costs | $446 | $129 |
| Real Estate Taxes | $1,470 | $7 |
Property Value by Mortgage Status in Sanford
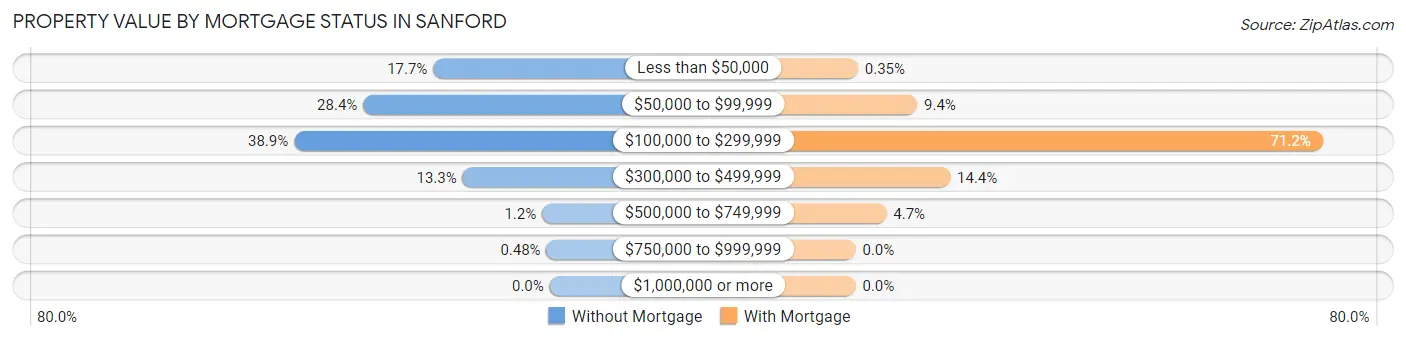
| Property Value | Without Mortgage | With Mortgage |
| Less than $50,000 | 369 (17.7%) | 12 (0.4%) |
| $50,000 to $99,999 | 591 (28.4%) | 326 (9.4%) |
| $100,000 to $299,999 | 810 (38.9%) | 2,474 (71.2%) |
| $300,000 to $499,999 | 276 (13.3%) | 501 (14.4%) |
| $500,000 to $749,999 | 24 (1.1%) | 163 (4.7%) |
| $750,000 to $999,999 | 10 (0.5%) | 0 (0.0%) |
| $1,000,000 or more | 0 (0.0%) | 0 (0.0%) |
| Total | 2,080 (100.0%) | 3,476 (100.0%) |
Household Income by Mortgage Status in Sanford
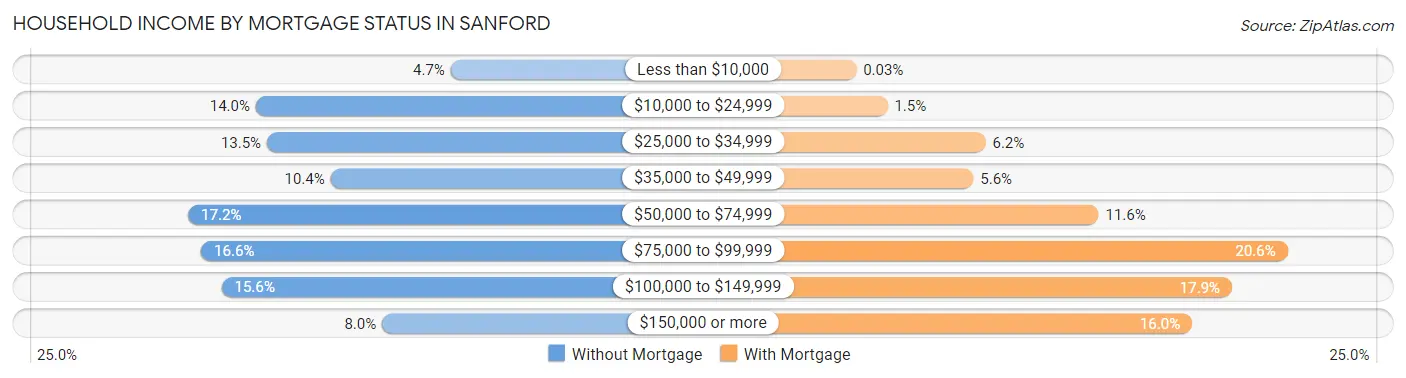
| Household Income | Without Mortgage | With Mortgage |
| Less than $10,000 | 98 (4.7%) | 1 (0.0%) |
| $10,000 to $24,999 | 291 (14.0%) | 53 (1.5%) |
| $25,000 to $34,999 | 280 (13.5%) | 215 (6.2%) |
| $35,000 to $49,999 | 217 (10.4%) | 195 (5.6%) |
| $50,000 to $74,999 | 358 (17.2%) | 402 (11.6%) |
| $75,000 to $99,999 | 345 (16.6%) | 715 (20.6%) |
| $100,000 to $149,999 | 325 (15.6%) | 623 (17.9%) |
| $150,000 or more | 166 (8.0%) | 557 (16.0%) |
| Total | 2,080 (100.0%) | 3,476 (100.0%) |
Property Value to Household Income Ratio in Sanford
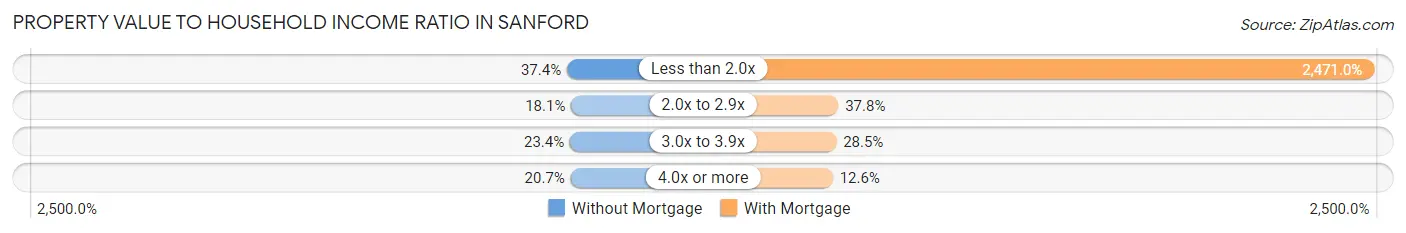
| Value-to-Income Ratio | Without Mortgage | With Mortgage |
| Less than 2.0x | 777 (37.4%) | 85,893 (2,471.0%) |
| 2.0x to 2.9x | 377 (18.1%) | 1,314 (37.8%) |
| 3.0x to 3.9x | 487 (23.4%) | 989 (28.4%) |
| 4.0x or more | 430 (20.7%) | 437 (12.6%) |
| Total | 2,080 (100.0%) | 3,476 (100.0%) |
Real Estate Taxes by Mortgage Status in Sanford
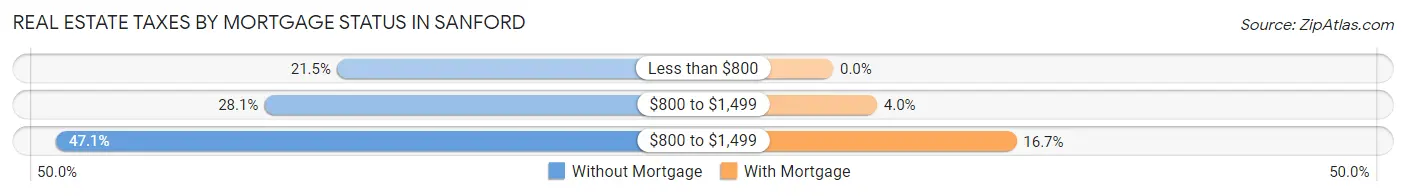
| Property Taxes | Without Mortgage | With Mortgage |
| Less than $800 | 447 (21.5%) | 0 (0.0%) |
| $800 to $1,499 | 585 (28.1%) | 139 (4.0%) |
| $800 to $1,499 | 980 (47.1%) | 582 (16.7%) |
| Total | 2,080 (100.0%) | 3,476 (100.0%) |
Health & Disability in Sanford
Health Insurance Coverage by Age in Sanford
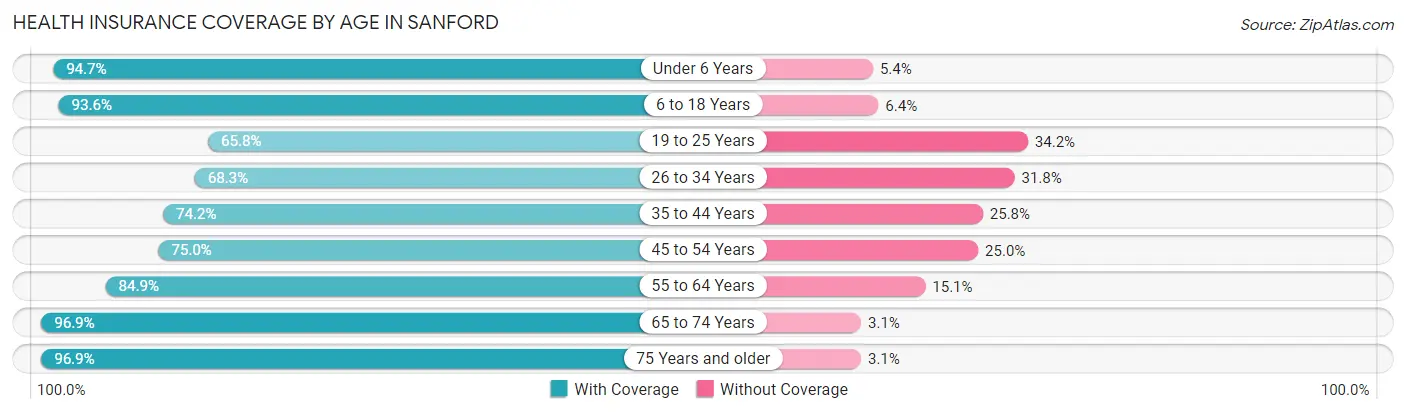
| Age Bracket | With Coverage | Without Coverage |
| Under 6 Years | 2,406 (94.7%) | 136 (5.3%) |
| 6 to 18 Years | 5,716 (93.6%) | 388 (6.4%) |
| 19 to 25 Years | 1,903 (65.8%) | 991 (34.2%) |
| 26 to 34 Years | 2,506 (68.2%) | 1,166 (31.8%) |
| 35 to 44 Years | 3,031 (74.2%) | 1,056 (25.8%) |
| 45 to 54 Years | 2,552 (75.0%) | 849 (25.0%) |
| 55 to 64 Years | 2,509 (84.9%) | 447 (15.1%) |
| 65 to 74 Years | 2,168 (96.9%) | 70 (3.1%) |
| 75 Years and older | 1,678 (96.9%) | 54 (3.1%) |
| Total | 24,469 (82.6%) | 5,157 (17.4%) |
Health Insurance Coverage by Citizenship Status in Sanford
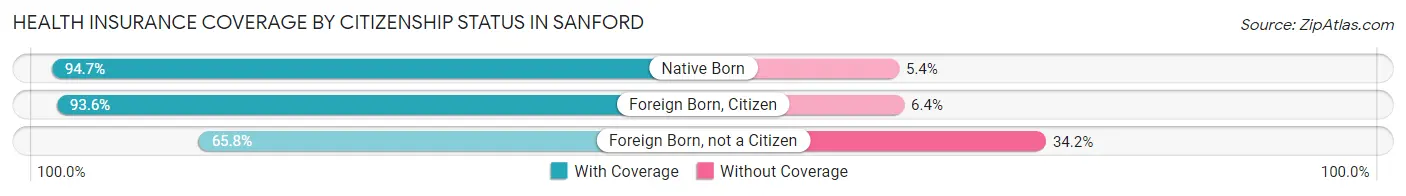
| Citizenship Status | With Coverage | Without Coverage |
| Native Born | 2,406 (94.7%) | 136 (5.3%) |
| Foreign Born, Citizen | 5,716 (93.6%) | 388 (6.4%) |
| Foreign Born, not a Citizen | 1,903 (65.8%) | 991 (34.2%) |
Health Insurance Coverage by Household Income in Sanford
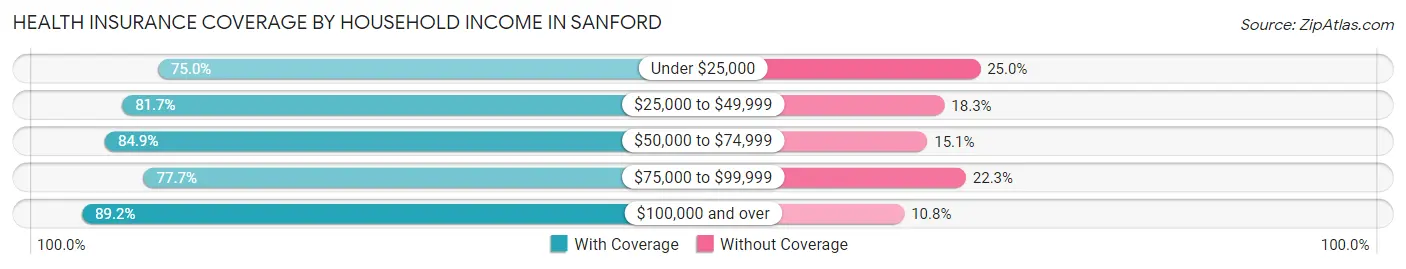
| Household Income | With Coverage | Without Coverage |
| Under $25,000 | 4,151 (75.0%) | 1,383 (25.0%) |
| $25,000 to $49,999 | 5,074 (81.7%) | 1,136 (18.3%) |
| $50,000 to $74,999 | 5,491 (84.9%) | 975 (15.1%) |
| $75,000 to $99,999 | 2,949 (77.7%) | 847 (22.3%) |
| $100,000 and over | 6,708 (89.2%) | 809 (10.8%) |
Public vs Private Health Insurance Coverage by Age in Sanford
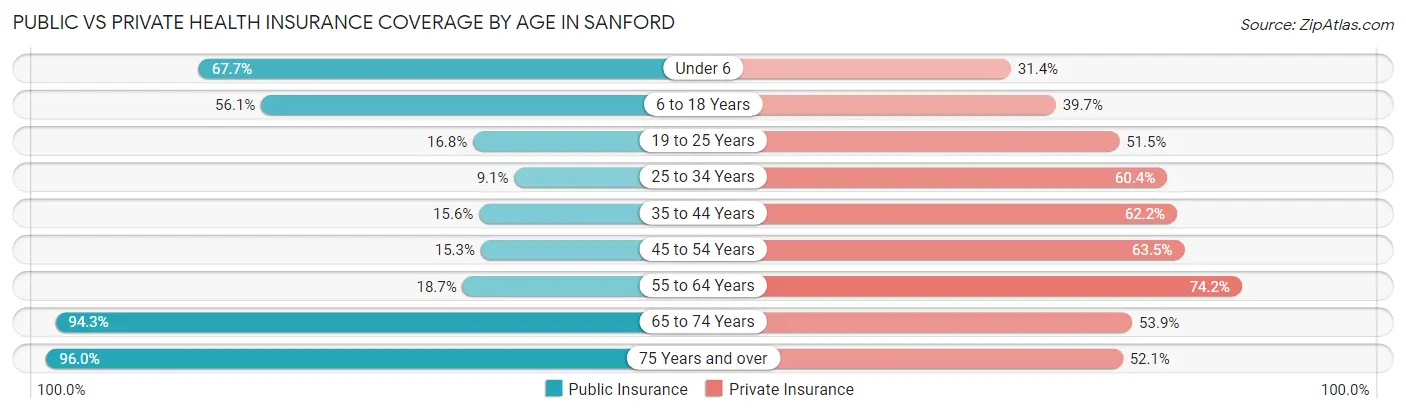
| Age Bracket | Public Insurance | Private Insurance |
| Under 6 | 1,720 (67.7%) | 798 (31.4%) |
| 6 to 18 Years | 3,424 (56.1%) | 2,424 (39.7%) |
| 19 to 25 Years | 485 (16.8%) | 1,490 (51.5%) |
| 25 to 34 Years | 334 (9.1%) | 2,217 (60.4%) |
| 35 to 44 Years | 639 (15.6%) | 2,542 (62.2%) |
| 45 to 54 Years | 521 (15.3%) | 2,161 (63.5%) |
| 55 to 64 Years | 553 (18.7%) | 2,194 (74.2%) |
| 65 to 74 Years | 2,110 (94.3%) | 1,206 (53.9%) |
| 75 Years and over | 1,662 (96.0%) | 903 (52.1%) |
| Total | 11,448 (38.6%) | 15,935 (53.8%) |
Disability Status by Sex by Age in Sanford
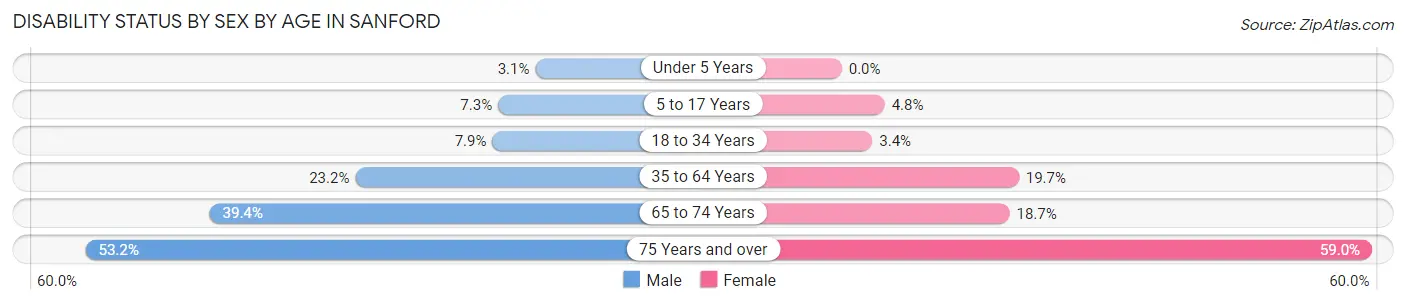
| Age Bracket | Male | Female |
| Under 5 Years | 39 (3.1%) | 0 (0.0%) |
| 5 to 17 Years | 224 (7.3%) | 146 (4.8%) |
| 18 to 34 Years | 274 (7.9%) | 117 (3.4%) |
| 35 to 64 Years | 1,159 (23.2%) | 1,073 (19.7%) |
| 65 to 74 Years | 403 (39.4%) | 227 (18.7%) |
| 75 Years and over | 315 (53.2%) | 673 (59.0%) |
Disability Class by Sex by Age in Sanford
Disability Class: Hearing Difficulty
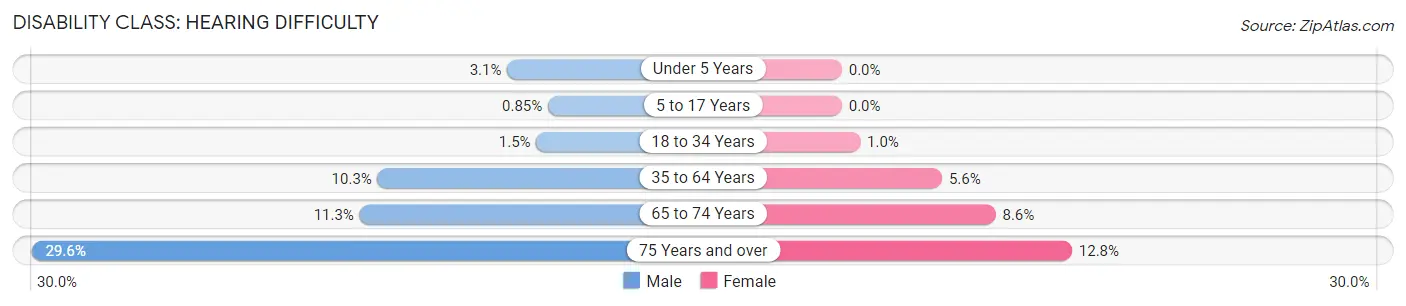
| Age Bracket | Male | Female |
| Under 5 Years | 39 (3.1%) | 0 (0.0%) |
| 5 to 17 Years | 26 (0.9%) | 0 (0.0%) |
| 18 to 34 Years | 52 (1.5%) | 35 (1.0%) |
| 35 to 64 Years | 517 (10.3%) | 304 (5.6%) |
| 65 to 74 Years | 116 (11.3%) | 104 (8.6%) |
| 75 Years and over | 175 (29.6%) | 146 (12.8%) |
Disability Class: Vision Difficulty
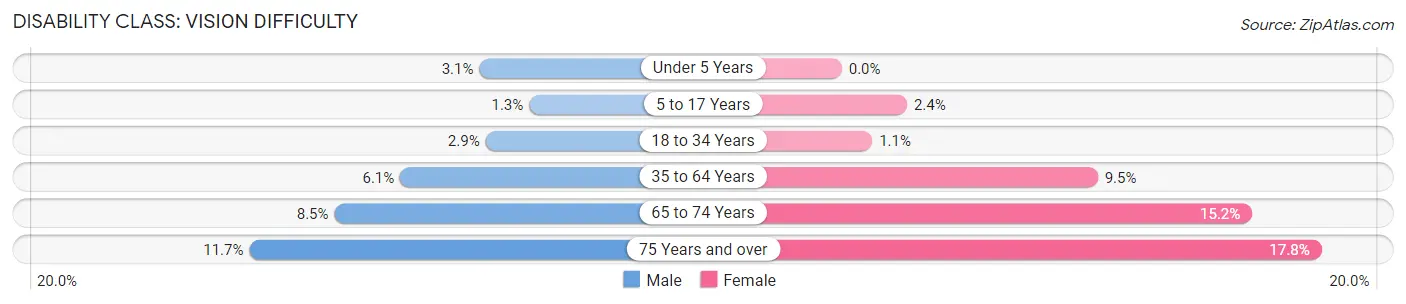
| Age Bracket | Male | Female |
| Under 5 Years | 39 (3.1%) | 0 (0.0%) |
| 5 to 17 Years | 39 (1.3%) | 74 (2.4%) |
| 18 to 34 Years | 100 (2.9%) | 39 (1.1%) |
| 35 to 64 Years | 303 (6.1%) | 517 (9.5%) |
| 65 to 74 Years | 87 (8.5%) | 185 (15.2%) |
| 75 Years and over | 69 (11.7%) | 203 (17.8%) |
Disability Class: Cognitive Difficulty
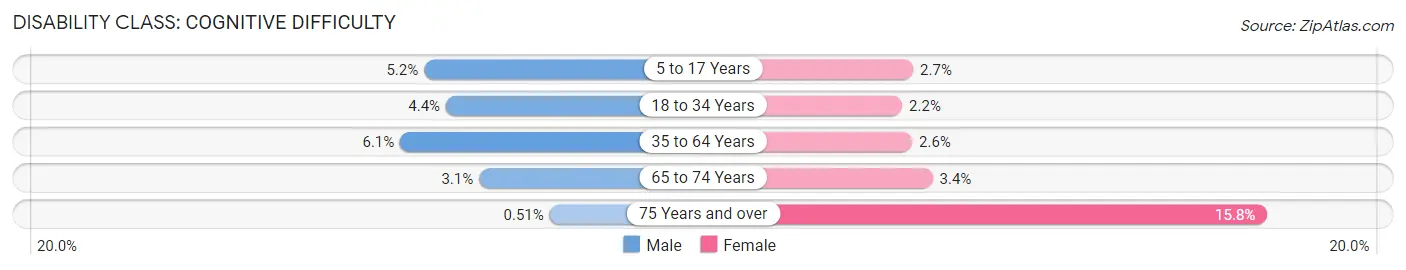
| Age Bracket | Male | Female |
| 5 to 17 Years | 159 (5.2%) | 81 (2.6%) |
| 18 to 34 Years | 151 (4.4%) | 77 (2.2%) |
| 35 to 64 Years | 303 (6.1%) | 142 (2.6%) |
| 65 to 74 Years | 32 (3.1%) | 41 (3.4%) |
| 75 Years and over | 3 (0.5%) | 180 (15.8%) |
Disability Class: Ambulatory Difficulty
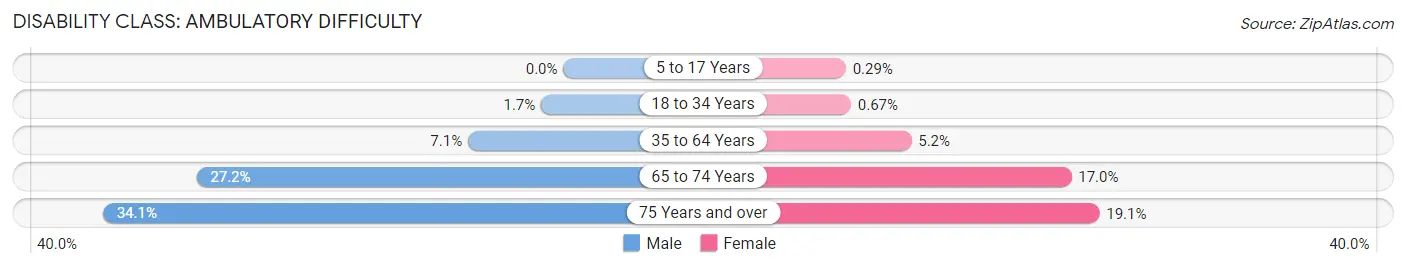
| Age Bracket | Male | Female |
| 5 to 17 Years | 0 (0.0%) | 9 (0.3%) |
| 18 to 34 Years | 57 (1.7%) | 23 (0.7%) |
| 35 to 64 Years | 354 (7.1%) | 281 (5.2%) |
| 65 to 74 Years | 278 (27.2%) | 207 (17.0%) |
| 75 Years and over | 202 (34.1%) | 218 (19.1%) |
Disability Class: Self-Care Difficulty
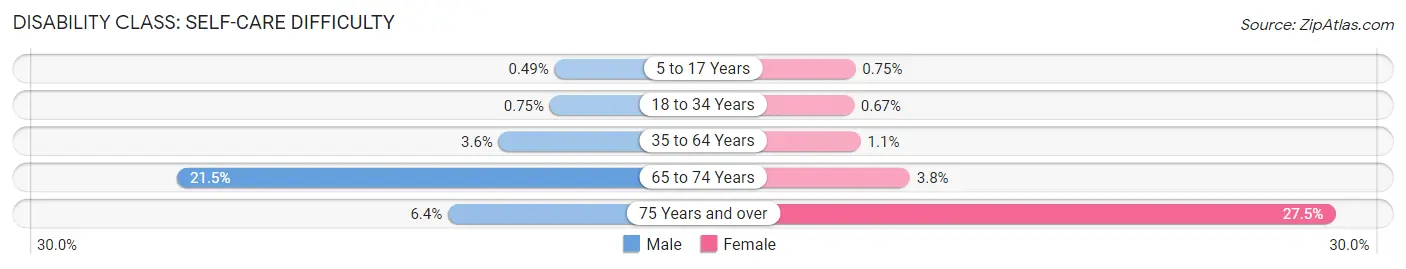
| Age Bracket | Male | Female |
| 5 to 17 Years | 15 (0.5%) | 23 (0.7%) |
| 18 to 34 Years | 26 (0.7%) | 23 (0.7%) |
| 35 to 64 Years | 180 (3.6%) | 57 (1.1%) |
| 65 to 74 Years | 220 (21.5%) | 46 (3.8%) |
| 75 Years and over | 38 (6.4%) | 313 (27.5%) |
Technology Access in Sanford
Computing Device Access in Sanford
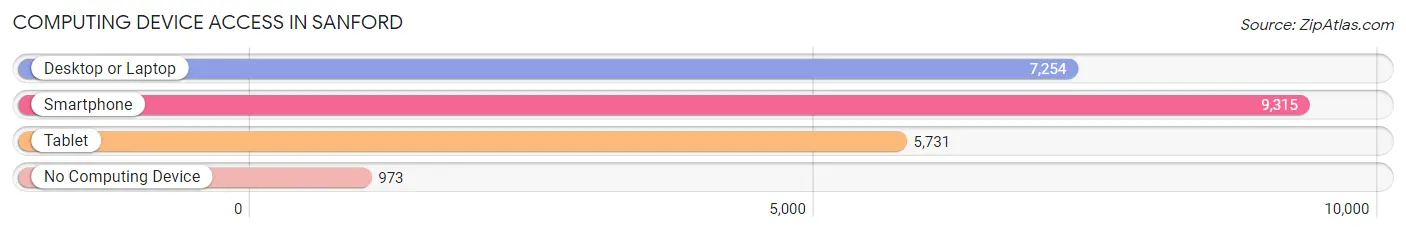
| Device Type | # Households | % Households |
| Desktop or Laptop | 7,254 | 66.8% |
| Smartphone | 9,315 | 85.8% |
| Tablet | 5,731 | 52.8% |
| No Computing Device | 973 | 9.0% |
| Total | 10,863 | 100.0% |
Internet Access in Sanford
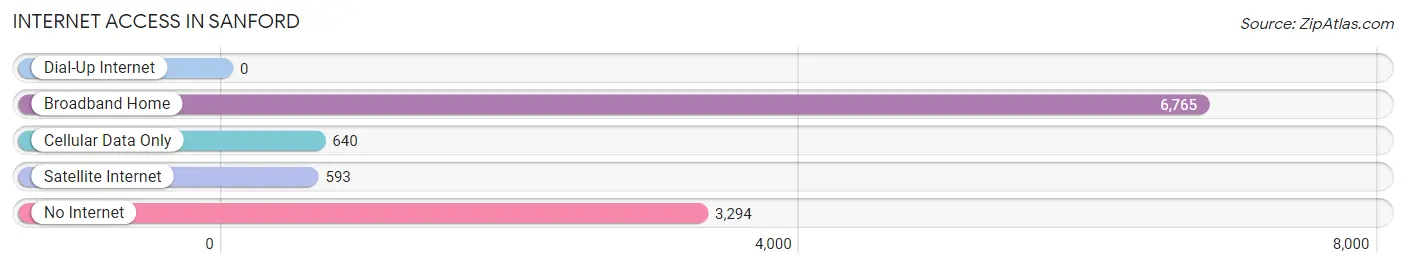
| Internet Type | # Households | % Households |
| Dial-Up Internet | 0 | 0.0% |
| Broadband Home | 6,765 | 62.3% |
| Cellular Data Only | 640 | 5.9% |
| Satellite Internet | 593 | 5.5% |
| No Internet | 3,294 | 30.3% |
| Total | 10,863 | 100.0% |
Sanford Summary
Sanford, North Carolina is a city located in Lee County, North Carolina. It is the county seat of Lee County and is located in the heart of the North Carolina Sandhills. The city is situated along the banks of the Deep River and is home to a population of 28,094 people as of the 2010 census.
Geography
Sanford is located in the heart of the North Carolina Sandhills, a region of gently rolling hills and sandy soils. The city is situated along the banks of the Deep River, which flows through the city and is a major tributary of the Cape Fear River. The city is located at an elevation of approximately 300 feet above sea level. The city is located approximately 40 miles south of Raleigh, the state capital, and approximately 60 miles northwest of Fayetteville.
History
Sanford was founded in 1771 by William C. Sanford, a Revolutionary War veteran. The city was originally known as Sanfordville and was incorporated in 1874. The city was named after William C. Sanford, who was a major landowner in the area. The city was a major center for the production of cotton and tobacco during the 19th century. The city was also a major railroad hub, with the Atlantic Coast Line Railroad and the Seaboard Air Line Railroad both having major depots in the city.
Economy
Sanford is a major economic center for the region. The city is home to a number of major employers, including the Lee County Government, Central Carolina Community College, and the Central Carolina Hospital. The city is also home to a number of manufacturing and distribution centers, including the Caterpillar plant, which produces heavy equipment, and the Pepsi bottling plant. The city is also home to a number of retail stores, restaurants, and other businesses.
Demographics
As of the 2010 census, the population of Sanford was 28,094. The racial makeup of the city was 68.3% White, 24.2% African American, 0.5% Native American, 1.3% Asian, 0.1% Pacific Islander, 3.2% from other races, and 2.4% from two or more races. Hispanic or Latino of any race were 6.7% of the population.
The median income for a household in the city was $37,845, and the median income for a family was $45,945. The per capita income for the city was $20,845. About 17.2% of families and 20.7% of the population were below the poverty line, including 28.2% of those under age 18 and 14.2% of those age 65 or over.
Conclusion
Sanford, North Carolina is a city located in Lee County, North Carolina. It is the county seat of Lee County and is located in the heart of the North Carolina Sandhills. The city is situated along the banks of the Deep River and is home to a population of 28,094 people as of the 2010 census. The city was founded in 1771 by William C. Sanford and was originally known as Sanfordville. The city is a major economic center for the region, with a number of major employers, manufacturing and distribution centers, and retail stores. The population of Sanford is 68.3% White, 24.2% African American, 0.5% Native American, 1.3% Asian, 0.1% Pacific Islander, 3.2% from other races, and 2.4% from two or more races. The median income for a household in the city was $37,845, and the median income for a family was $45,945. Sanford is a vibrant city with a rich history and a bright future.
Common Questions
What is Per Capita Income in Sanford?
Per Capita income in Sanford is $26,884.
What is the Median Family Income in Sanford?
Median Family Income in Sanford is $61,487.
What is the Median Household income in Sanford?
Median Household Income in Sanford is $52,951.
What is Income or Wage Gap in Sanford?
Income or Wage Gap in Sanford is 25.8%.
Women in Sanford earn 74.2 cents for every dollar earned by a man.
What is Family Income Deficit in Sanford?
Family Income Deficit in Sanford is $11,397.
Families that are below poverty line in Sanford earn $11,397 less on average than the poverty threshold level.
What is Inequality or Gini Index in Sanford?
Inequality or Gini Index in Sanford is 0.46.
What is the Total Population of Sanford?
Total Population of Sanford is 30,373.
What is the Total Male Population of Sanford?
Total Male Population of Sanford is 14,931.
What is the Total Female Population of Sanford?
Total Female Population of Sanford is 15,442.
What is the Ratio of Males per 100 Females in Sanford?
There are 96.69 Males per 100 Females in Sanford.
What is the Ratio of Females per 100 Males in Sanford?
There are 103.42 Females per 100 Males in Sanford.
What is the Median Population Age in Sanford?
Median Population Age in Sanford is 34.6 Years.
What is the Average Family Size in Sanford
Average Family Size in Sanford is 3.3 People.
What is the Average Household Size in Sanford
Average Household Size in Sanford is 2.7 People.
How Large is the Labor Force in Sanford?
There are 14,469 People in the Labor Forcein in Sanford.
What is the Percentage of People in the Labor Force in Sanford?
63.2% of People are in the Labor Force in Sanford.
What is the Unemployment Rate in Sanford?
Unemployment Rate in Sanford is 5.7%.