Davidson, NC Map & Demographics
Davidson Map
Davidson Overview
$72,914
PER CAPITA INCOME
$182,474
AVG FAMILY INCOME
$140,938
AVG HOUSEHOLD INCOME
65.1%
WAGE / INCOME GAP [ % ]
34.9¢/ $1
WAGE / INCOME GAP [ $ ]
0.45
INEQUALITY / GINI INDEX
15,199
TOTAL POPULATION
7,057
MALE POPULATION
8,142
FEMALE POPULATION
86.67
MALES / 100 FEMALES
115.37
FEMALES / 100 MALES
39.6
MEDIAN AGE
3.0
AVG FAMILY SIZE
2.5
AVG HOUSEHOLD SIZE
7,607
LABOR FORCE [ PEOPLE ]
61.5%
PERCENT IN LABOR FORCE
2.4%
UNEMPLOYMENT RATE
Davidson Zip Codes
Income in Davidson
Income Overview in Davidson
Per Capita Income in Davidson is $72,914, while median incomes of families and households are $182,474 and $140,938 respectively.
| Characteristic | Number | Measure |
| Per Capita Income | 15,199 | $72,914 |
| Median Family Income | 3,825 | $182,474 |
| Mean Family Income | 3,825 | $225,074 |
| Median Household Income | 5,510 | $140,938 |
| Mean Household Income | 5,510 | $193,815 |
| Income Deficit | 3,825 | $0 |
| Wage / Income Gap (%) | 15,199 | 65.14% |
| Wage / Income Gap ($) | 15,199 | 34.86¢ per $1 |
| Gini / Inequality Index | 15,199 | 0.45 |
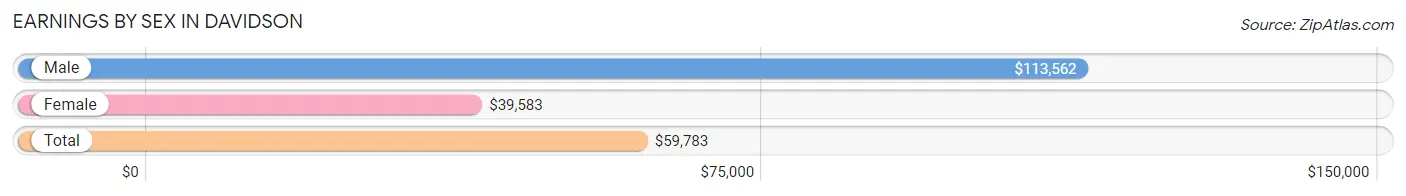
Earnings by Sex in Davidson
Average Earnings in Davidson are $59,783, $113,562 for men and $39,583 for women, a difference of 65.1%.
| Sex | Number | Average Earnings |
| Male | 4,322 (51.5%) | $113,562 |
| Female | 4,072 (48.5%) | $39,583 |
| Total | 8,394 (100.0%) | $59,783 |
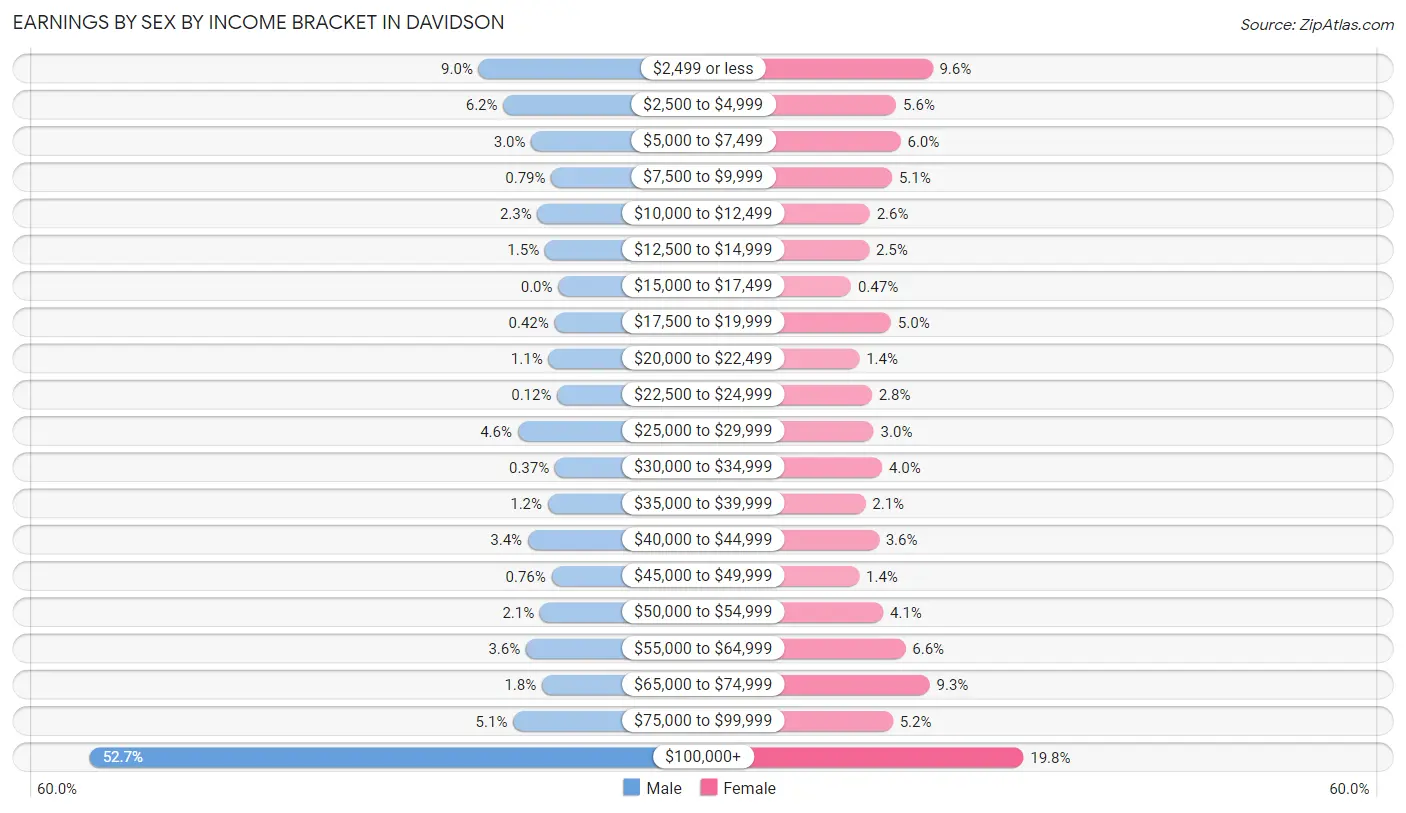
Earnings by Sex by Income Bracket in Davidson
The most common earnings brackets in Davidson are $100,000+ for men (2,277 | 52.7%) and $100,000+ for women (808 | 19.8%).
| Income | Male | Female |
| $2,499 or less | 387 (8.9%) | 392 (9.6%) |
| $2,500 to $4,999 | 267 (6.2%) | 226 (5.6%) |
| $5,000 to $7,499 | 131 (3.0%) | 246 (6.0%) |
| $7,500 to $9,999 | 34 (0.8%) | 207 (5.1%) |
| $10,000 to $12,499 | 101 (2.3%) | 105 (2.6%) |
| $12,500 to $14,999 | 65 (1.5%) | 102 (2.5%) |
| $15,000 to $17,499 | 0 (0.0%) | 19 (0.5%) |
| $17,500 to $19,999 | 18 (0.4%) | 202 (5.0%) |
| $20,000 to $22,499 | 48 (1.1%) | 57 (1.4%) |
| $22,500 to $24,999 | 5 (0.1%) | 114 (2.8%) |
| $25,000 to $29,999 | 197 (4.6%) | 123 (3.0%) |
| $30,000 to $34,999 | 16 (0.4%) | 161 (4.0%) |
| $35,000 to $39,999 | 51 (1.2%) | 85 (2.1%) |
| $40,000 to $44,999 | 148 (3.4%) | 146 (3.6%) |
| $45,000 to $49,999 | 33 (0.8%) | 56 (1.4%) |
| $50,000 to $54,999 | 89 (2.1%) | 166 (4.1%) |
| $55,000 to $64,999 | 157 (3.6%) | 268 (6.6%) |
| $65,000 to $74,999 | 79 (1.8%) | 379 (9.3%) |
| $75,000 to $99,999 | 219 (5.1%) | 210 (5.2%) |
| $100,000+ | 2,277 (52.7%) | 808 (19.8%) |
| Total | 4,322 (100.0%) | 4,072 (100.0%) |
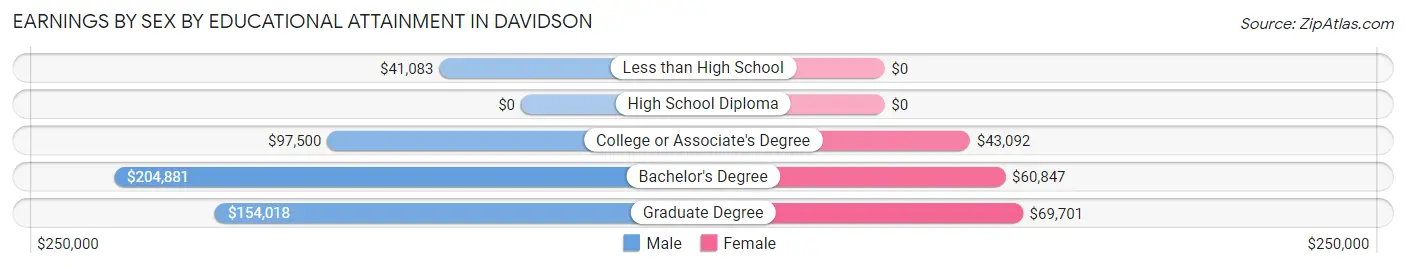
Earnings by Sex by Educational Attainment in Davidson
Average earnings in Davidson are $152,891 for men and $61,397 for women, a difference of 59.8%. Men with an educational attainment of bachelor's degree enjoy the highest average annual earnings of $204,881, while those with less than high school education earn the least with $41,083. Women with an educational attainment of graduate degree earn the most with the average annual earnings of $69,701, while those with college or associate's degree education have the smallest earnings of $43,092.
| Educational Attainment | Male Income | Female Income |
| Less than High School | $41,083 | $0 |
| High School Diploma | - | - |
| College or Associate's Degree | $97,500 | $43,092 |
| Bachelor's Degree | $204,881 | $60,847 |
| Graduate Degree | $154,018 | $69,701 |
| Total | $152,891 | $61,397 |
Family Income in Davidson
Family Income Brackets in Davidson
According to the Davidson family income data, there are 1,874 families falling into the $200,000+ income range, which is the most common income bracket and makes up 49.0% of all families.
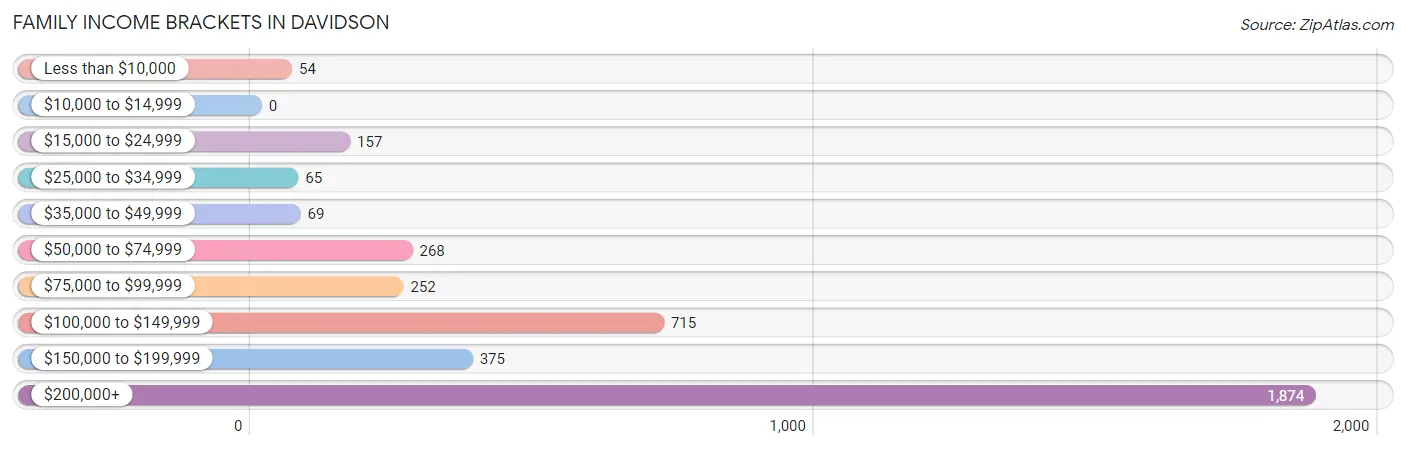
| Income Bracket | # Families | % Families |
| Less than $10,000 | 54 | 1.4% |
| $10,000 to $14,999 | 0 | 0.0% |
| $15,000 to $24,999 | 157 | 4.1% |
| $25,000 to $34,999 | 65 | 1.7% |
| $35,000 to $49,999 | 69 | 1.8% |
| $50,000 to $74,999 | 268 | 7.0% |
| $75,000 to $99,999 | 252 | 6.6% |
| $100,000 to $149,999 | 715 | 18.7% |
| $150,000 to $199,999 | 375 | 9.8% |
| $200,000+ | 1,874 | 49.0% |
Family Income by Famaliy Size in Davidson
4-person families (940 | 24.6%) account for the highest median family income in Davidson with $250,001 per family, while 2-person families (1,854 | 48.5%) have the highest median income of $86,500 per family member.
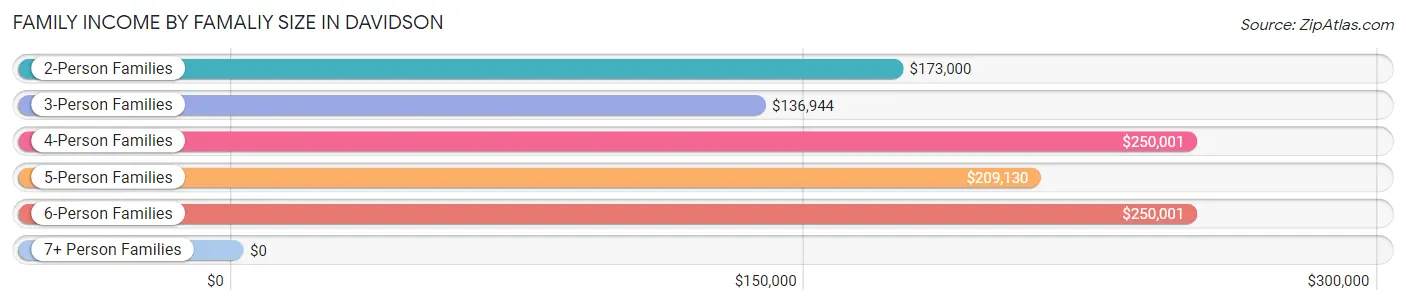
| Income Bracket | # Families | Median Income |
| 2-Person Families | 1,854 (48.5%) | $173,000 |
| 3-Person Families | 712 (18.6%) | $136,944 |
| 4-Person Families | 940 (24.6%) | $250,001 |
| 5-Person Families | 216 (5.7%) | $209,130 |
| 6-Person Families | 80 (2.1%) | $250,001 |
| 7+ Person Families | 23 (0.6%) | $0 |
| Total | 3,825 (100.0%) | $182,474 |
Family Income by Number of Earners in Davidson
The median family income in Davidson is $182,474, with families comprising 3+ earners (154) having the highest median family income of $250,001, while families with no earners (518) have the lowest median family income of $116,318, accounting for 4.0% and 13.5% of families, respectively.
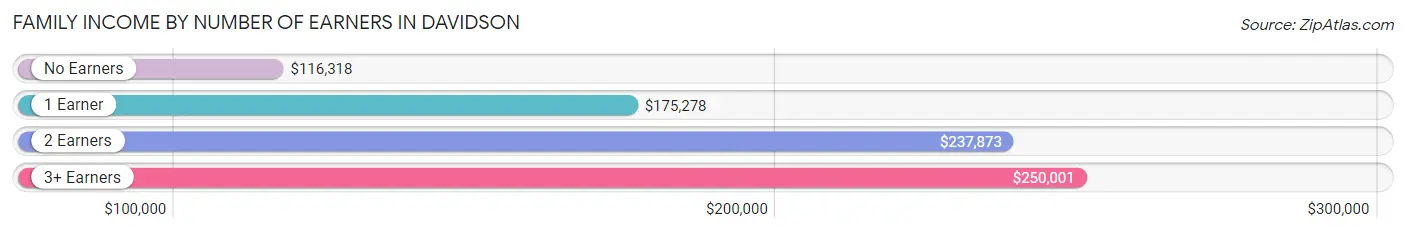
| Number of Earners | # Families | Median Income |
| No Earners | 518 (13.5%) | $116,318 |
| 1 Earner | 1,320 (34.5%) | $175,278 |
| 2 Earners | 1,833 (47.9%) | $237,873 |
| 3+ Earners | 154 (4.0%) | $250,001 |
| Total | 3,825 (100.0%) | $182,474 |
Household Income in Davidson
Household Income Brackets in Davidson
With 2,105 households falling in the category, the $200,000+ income range is the most frequent in Davidson, accounting for 38.2% of all households. In contrast, only 50 households (0.9%) fall into the $10,000 to $14,999 income bracket, making it the least populous group.
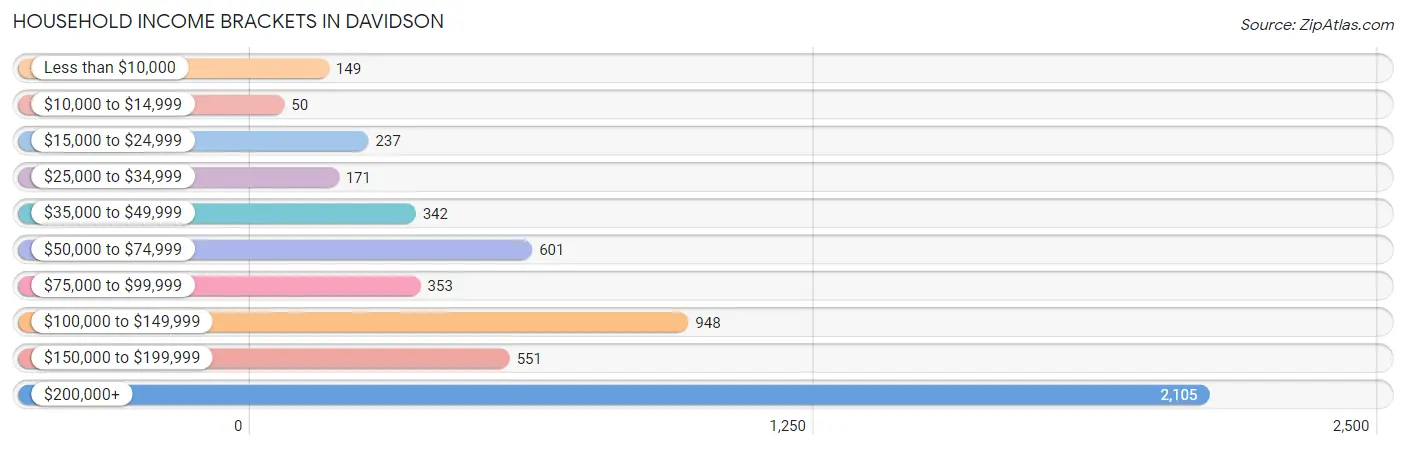
| Income Bracket | # Households | % Households |
| Less than $10,000 | 149 | 2.7% |
| $10,000 to $14,999 | 50 | 0.9% |
| $15,000 to $24,999 | 237 | 4.3% |
| $25,000 to $34,999 | 171 | 3.1% |
| $35,000 to $49,999 | 342 | 6.2% |
| $50,000 to $74,999 | 601 | 10.9% |
| $75,000 to $99,999 | 353 | 6.4% |
| $100,000 to $149,999 | 948 | 17.2% |
| $150,000 to $199,999 | 551 | 10.0% |
| $200,000+ | 2,105 | 38.2% |
Household Income by Householder Age in Davidson
The median household income in Davidson is $140,938, with the highest median household income of $213,125 found in the 45 to 64 years age bracket for the primary householder. A total of 2,635 households (47.8%) fall into this category. Meanwhile, the 15 to 24 years age bracket for the primary householder has the lowest median household income of $2,499, with 139 households (2.5%) in this group.
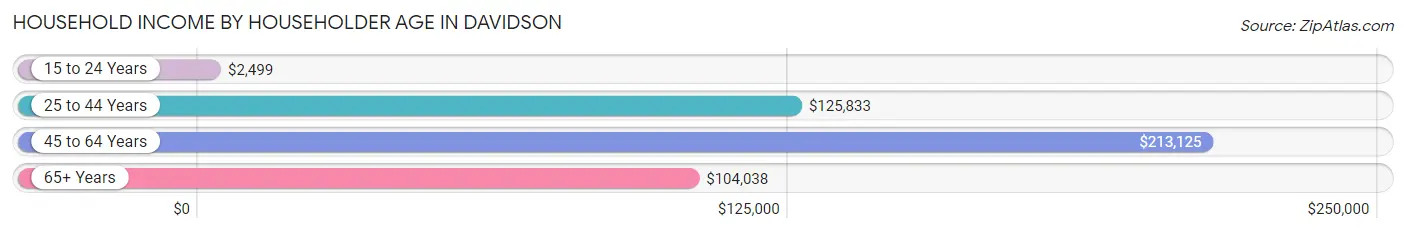
| Income Bracket | # Households | Median Income |
| 15 to 24 Years | 139 (2.5%) | $2,499 |
| 25 to 44 Years | 1,464 (26.6%) | $125,833 |
| 45 to 64 Years | 2,635 (47.8%) | $213,125 |
| 65+ Years | 1,272 (23.1%) | $104,038 |
| Total | 5,510 (100.0%) | $140,938 |
Poverty in Davidson
Income Below Poverty by Sex and Age in Davidson
With 8.9% poverty level for males and 3.2% for females among the residents of Davidson, 18 to 24 year old males and 35 to 44 year old females are the most vulnerable to poverty, with 282 males (46.0%) and 142 females (13.2%) in their respective age groups living below the poverty level.
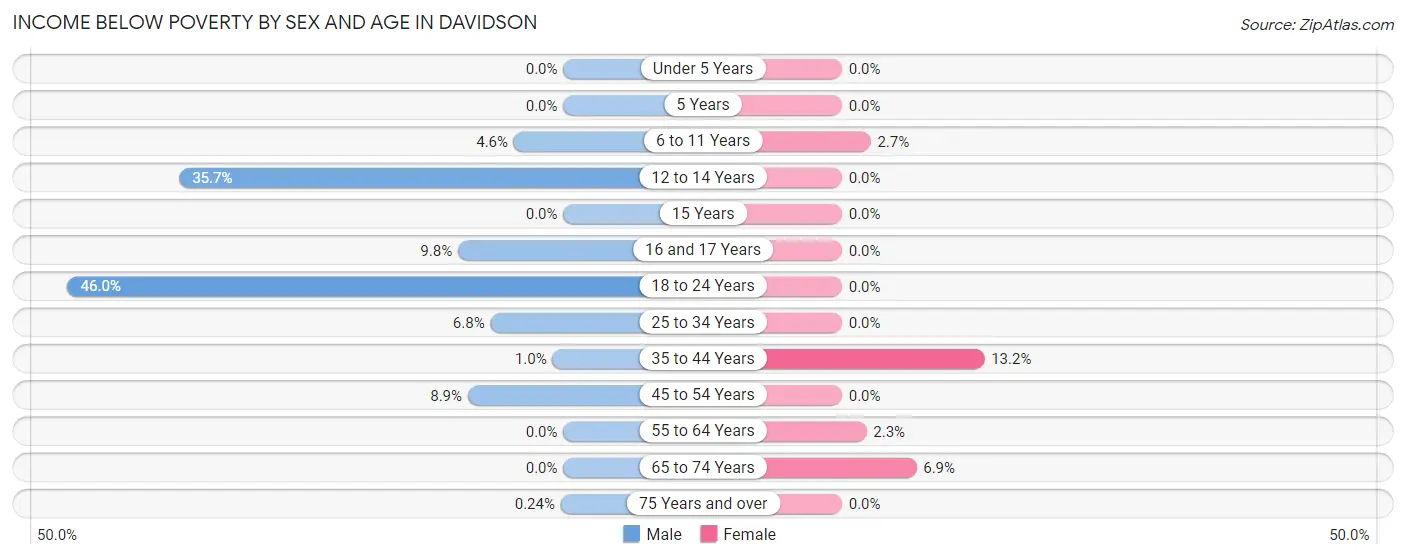
| Age Bracket | Male | Female |
| Under 5 Years | 0 (0.0%) | 0 (0.0%) |
| 5 Years | 0 (0.0%) | 0 (0.0%) |
| 6 to 11 Years | 20 (4.6%) | 20 (2.7%) |
| 12 to 14 Years | 118 (35.6%) | 0 (0.0%) |
| 15 Years | 0 (0.0%) | 0 (0.0%) |
| 16 and 17 Years | 9 (9.8%) | 0 (0.0%) |
| 18 to 24 Years | 282 (46.0%) | 0 (0.0%) |
| 25 to 34 Years | 25 (6.8%) | 0 (0.0%) |
| 35 to 44 Years | 8 (1.0%) | 142 (13.2%) |
| 45 to 54 Years | 103 (8.9%) | 0 (0.0%) |
| 55 to 64 Years | 0 (0.0%) | 25 (2.3%) |
| 65 to 74 Years | 0 (0.0%) | 47 (6.9%) |
| 75 Years and over | 1 (0.2%) | 0 (0.0%) |
| Total | 566 (8.9%) | 234 (3.2%) |
Income Above Poverty by Sex and Age in Davidson
According to the poverty statistics in Davidson, males aged under 5 years and females aged under 5 years are the age groups that are most secure financially, with 100.0% of males and 100.0% of females in these age groups living above the poverty line.
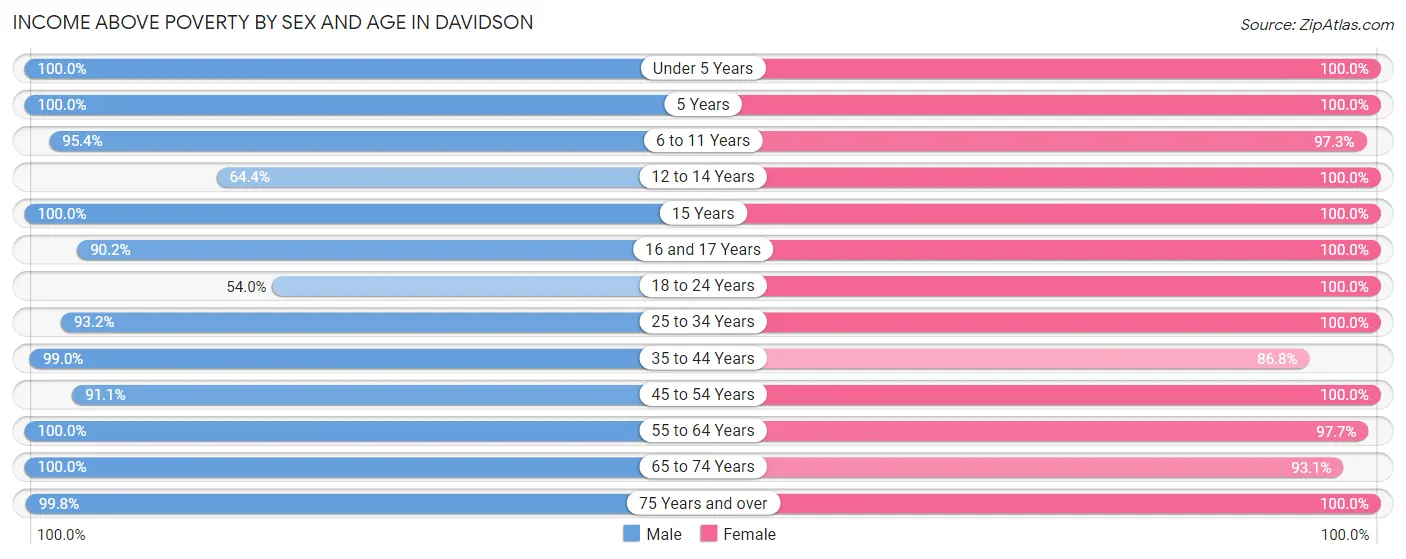
| Age Bracket | Male | Female |
| Under 5 Years | 248 (100.0%) | 203 (100.0%) |
| 5 Years | 137 (100.0%) | 139 (100.0%) |
| 6 to 11 Years | 416 (95.4%) | 733 (97.3%) |
| 12 to 14 Years | 213 (64.3%) | 298 (100.0%) |
| 15 Years | 118 (100.0%) | 167 (100.0%) |
| 16 and 17 Years | 83 (90.2%) | 261 (100.0%) |
| 18 to 24 Years | 331 (54.0%) | 360 (100.0%) |
| 25 to 34 Years | 345 (93.2%) | 469 (100.0%) |
| 35 to 44 Years | 794 (99.0%) | 932 (86.8%) |
| 45 to 54 Years | 1,059 (91.1%) | 1,176 (100.0%) |
| 55 to 64 Years | 1,004 (100.0%) | 1,071 (97.7%) |
| 65 to 74 Years | 630 (100.0%) | 633 (93.1%) |
| 75 Years and over | 408 (99.8%) | 573 (100.0%) |
| Total | 5,786 (91.1%) | 7,015 (96.8%) |
Income Below Poverty Among Married-Couple Families in Davidson
The poverty statistics for married-couple families in Davidson show that 0.8% or 26 of the total 3,308 families live below the poverty line. Families with no children have the highest poverty rate of 1.4%, comprising of 26 families. On the other hand, families with 1 or 2 children have the lowest poverty rate of 0.0%, which includes 0 families.
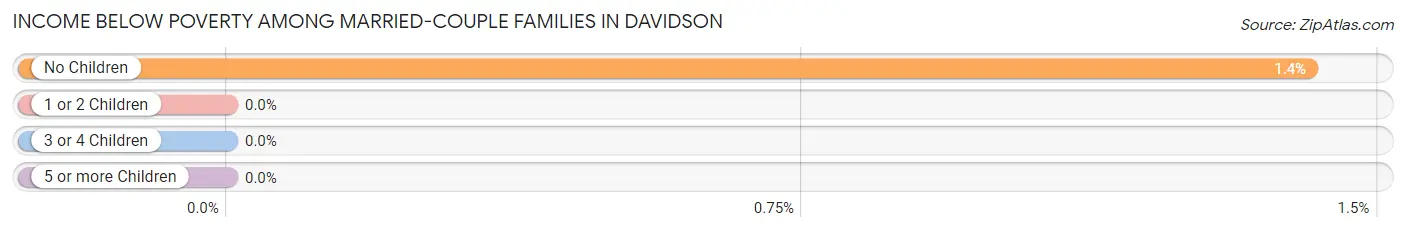
| Children | Above Poverty | Below Poverty |
| No Children | 1,812 (98.6%) | 26 (1.4%) |
| 1 or 2 Children | 1,192 (100.0%) | 0 (0.0%) |
| 3 or 4 Children | 278 (100.0%) | 0 (0.0%) |
| 5 or more Children | 0 (0.0%) | 0 (0.0%) |
| Total | 3,282 (99.2%) | 26 (0.8%) |
Income Below Poverty Among Single-Parent Households in Davidson
According to the poverty data in Davidson, 6.6% or 8 single-father households and 41.5% or 164 single-mother households are living below the poverty line. Among single-father households, those with 1 or 2 children have the highest poverty rate, with 8 households (47.1%) experiencing poverty. Likewise, among single-mother households, those with 1 or 2 children have the highest poverty rate, with 135 households (64.9%) falling below the poverty line.
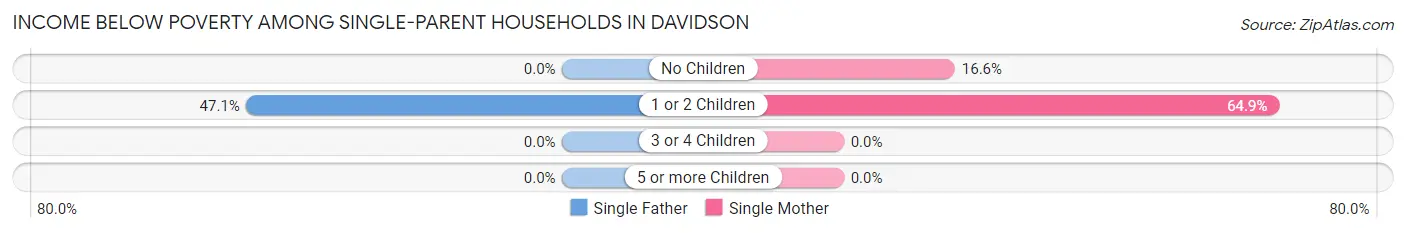
| Children | Single Father | Single Mother |
| No Children | 0 (0.0%) | 29 (16.6%) |
| 1 or 2 Children | 8 (47.1%) | 135 (64.9%) |
| 3 or 4 Children | 0 (0.0%) | 0 (0.0%) |
| 5 or more Children | 0 (0.0%) | 0 (0.0%) |
| Total | 8 (6.6%) | 164 (41.5%) |
Income Below Poverty Among Married-Couple vs Single-Parent Households in Davidson
The poverty data for Davidson shows that 26 of the married-couple family households (0.8%) and 172 of the single-parent households (33.3%) are living below the poverty level. Within the married-couple family households, those with no children have the highest poverty rate, with 26 households (1.4%) falling below the poverty line. Among the single-parent households, those with 1 or 2 children have the highest poverty rate, with 143 household (63.6%) living below poverty.
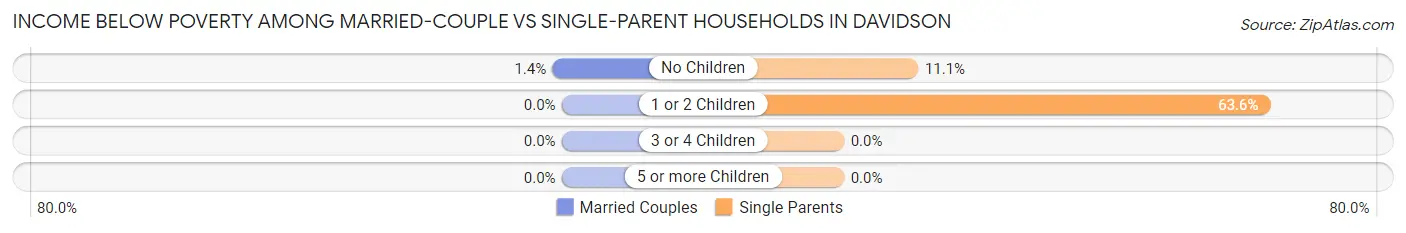
| Children | Married-Couple Families | Single-Parent Households |
| No Children | 26 (1.4%) | 29 (11.1%) |
| 1 or 2 Children | 0 (0.0%) | 143 (63.6%) |
| 3 or 4 Children | 0 (0.0%) | 0 (0.0%) |
| 5 or more Children | 0 (0.0%) | 0 (0.0%) |
| Total | 26 (0.8%) | 172 (33.3%) |
Race in Davidson
The most populous races in Davidson are White / Caucasian (12,618 | 83.0%), Black / African American (1,259 | 8.3%), and Two or more Races (870 | 5.7%).
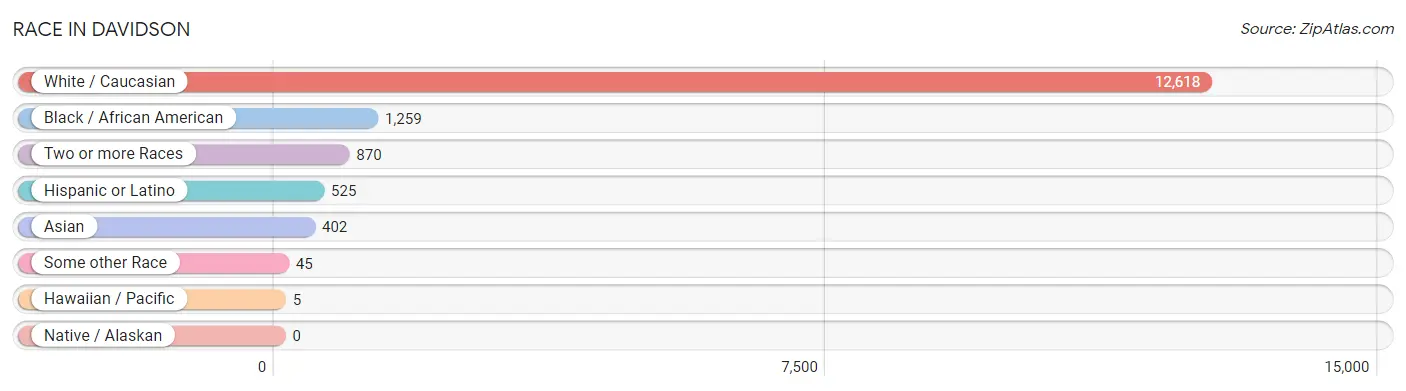
| Race | # Population | % Population |
| Asian | 402 | 2.6% |
| Black / African American | 1,259 | 8.3% |
| Hawaiian / Pacific | 5 | 0.0% |
| Hispanic or Latino | 525 | 3.5% |
| Native / Alaskan | 0 | 0.0% |
| White / Caucasian | 12,618 | 83.0% |
| Two or more Races | 870 | 5.7% |
| Some other Race | 45 | 0.3% |
| Total | 15,199 | 100.0% |
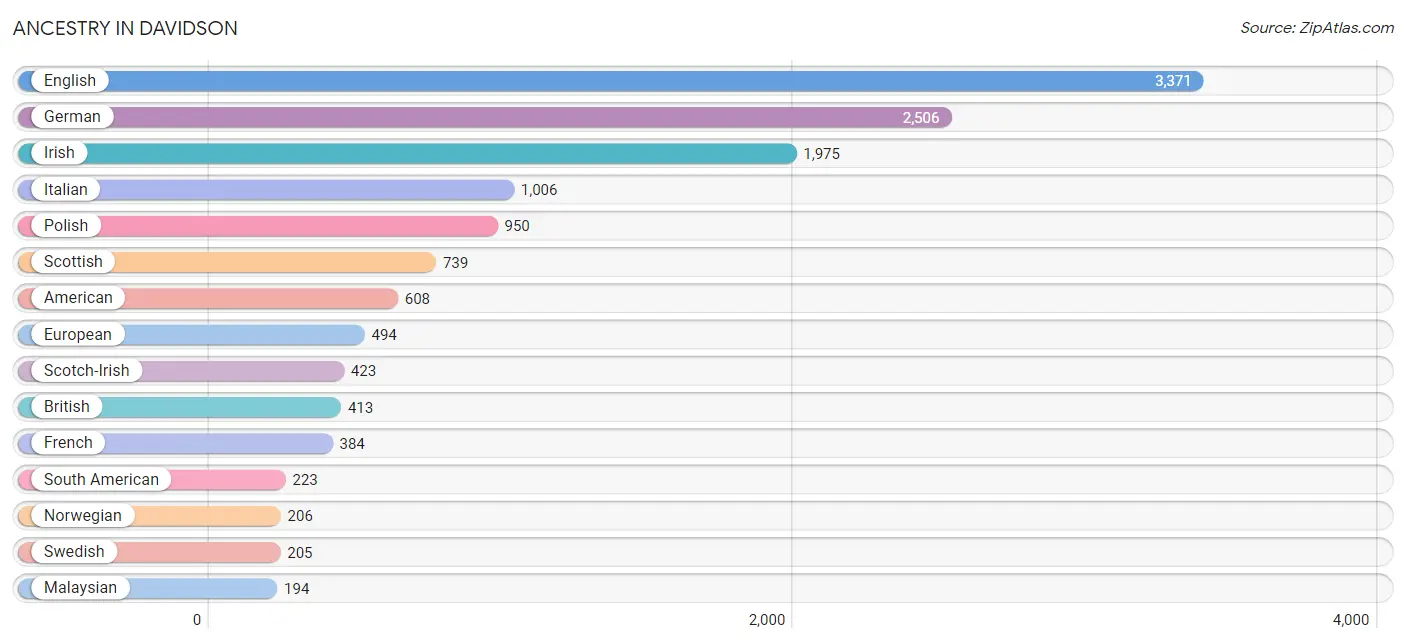
Ancestry in Davidson
The most populous ancestries reported in Davidson are English (3,371 | 22.2%), German (2,506 | 16.5%), Irish (1,975 | 13.0%), Italian (1,006 | 6.6%), and Polish (950 | 6.2%), together accounting for 64.5% of all Davidson residents.
| Ancestry | # Population | % Population |
| African | 11 | 0.1% |
| Albanian | 50 | 0.3% |
| Alsatian | 20 | 0.1% |
| American | 608 | 4.0% |
| Apache | 119 | 0.8% |
| Arab | 80 | 0.5% |
| Argentinean | 14 | 0.1% |
| Austrian | 36 | 0.2% |
| Barbadian | 11 | 0.1% |
| Belgian | 5 | 0.0% |
| Bhutanese | 8 | 0.1% |
| Brazilian | 53 | 0.4% |
| British | 413 | 2.7% |
| Burmese | 146 | 1.0% |
| Canadian | 18 | 0.1% |
| Cape Verdean | 3 | 0.0% |
| Central American | 37 | 0.2% |
| Cherokee | 17 | 0.1% |
| Chilean | 88 | 0.6% |
| Colombian | 121 | 0.8% |
| Croatian | 22 | 0.1% |
| Cuban | 57 | 0.4% |
| Czech | 125 | 0.8% |
| Czechoslovakian | 20 | 0.1% |
| Danish | 5 | 0.0% |
| Dutch | 143 | 0.9% |
| Eastern European | 52 | 0.3% |
| English | 3,371 | 22.2% |
| Ethiopian | 6 | 0.0% |
| European | 494 | 3.3% |
| Finnish | 25 | 0.2% |
| French | 384 | 2.5% |
| French Canadian | 174 | 1.1% |
| German | 2,506 | 16.5% |
| Ghanaian | 6 | 0.0% |
| Greek | 71 | 0.5% |
| Guatemalan | 37 | 0.2% |
| Haitian | 9 | 0.1% |
| Hungarian | 57 | 0.4% |
| Indian (Asian) | 154 | 1.0% |
| Irish | 1,975 | 13.0% |
| Iroquois | 5 | 0.0% |
| Israeli | 6 | 0.0% |
| Italian | 1,006 | 6.6% |
| Jamaican | 11 | 0.1% |
| Korean | 28 | 0.2% |
| Lithuanian | 24 | 0.2% |
| Lumbee | 18 | 0.1% |
| Malaysian | 194 | 1.3% |
| Mexican | 162 | 1.1% |
| Mongolian | 6 | 0.0% |
| Native Hawaiian | 9 | 0.1% |
| Nigerian | 5 | 0.0% |
| Northern European | 48 | 0.3% |
| Norwegian | 206 | 1.4% |
| Palestinian | 6 | 0.0% |
| Polish | 950 | 6.2% |
| Portuguese | 71 | 0.5% |
| Puerto Rican | 37 | 0.2% |
| Romanian | 91 | 0.6% |
| Russian | 124 | 0.8% |
| Scandinavian | 15 | 0.1% |
| Scotch-Irish | 423 | 2.8% |
| Scottish | 739 | 4.9% |
| Serbian | 5 | 0.0% |
| Slavic | 5 | 0.0% |
| Slovak | 19 | 0.1% |
| South African | 2 | 0.0% |
| South American | 223 | 1.5% |
| Spaniard | 9 | 0.1% |
| Sri Lankan | 29 | 0.2% |
| Subsaharan African | 47 | 0.3% |
| Swedish | 205 | 1.3% |
| Swiss | 6 | 0.0% |
| Syrian | 22 | 0.1% |
| Thai | 55 | 0.4% |
| Tongan | 5 | 0.0% |
| Trinidadian and Tobagonian | 8 | 0.1% |
| Turkish | 11 | 0.1% |
| Ugandan | 12 | 0.1% |
| Ukrainian | 103 | 0.7% |
| Welsh | 94 | 0.6% | View All 82 Rows |
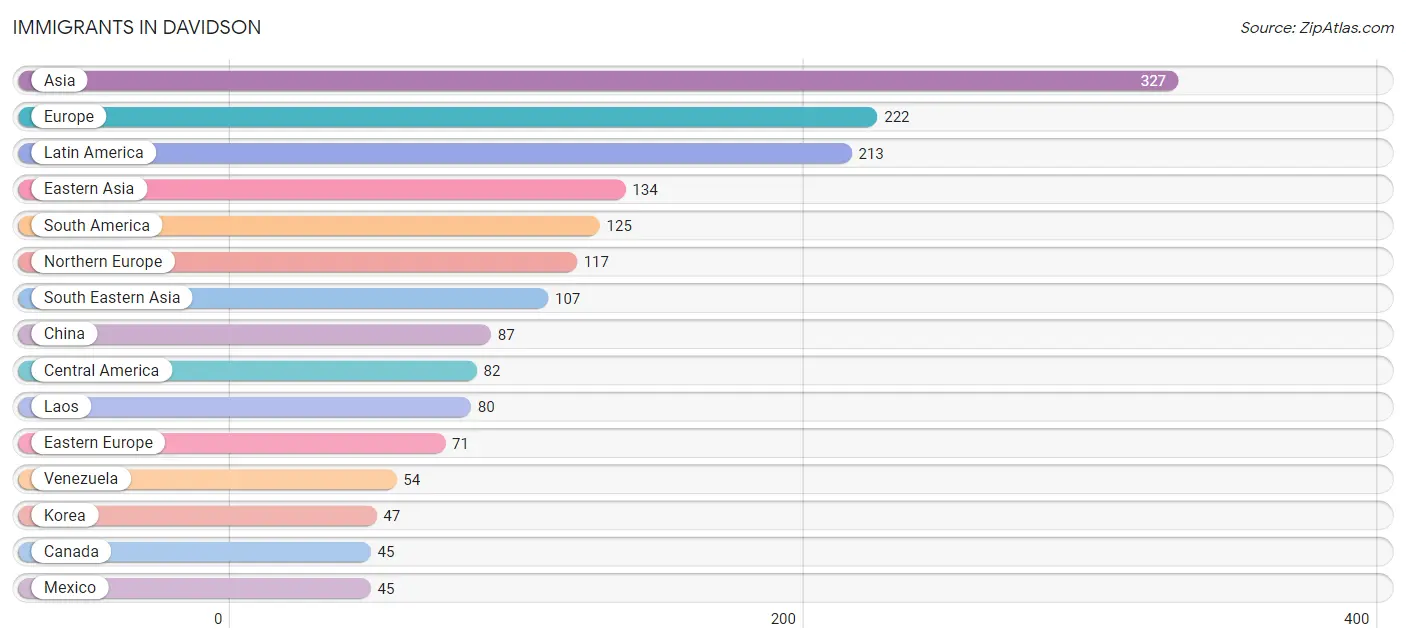
Immigrants in Davidson
The most numerous immigrant groups reported in Davidson came from Asia (327 | 2.1%), Europe (222 | 1.5%), Latin America (213 | 1.4%), Eastern Asia (134 | 0.9%), and South America (125 | 0.8%), together accounting for 6.7% of all Davidson residents.
| Immigration Origin | # Population | % Population |
| Africa | 38 | 0.3% |
| Asia | 327 | 2.1% |
| Australia | 34 | 0.2% |
| Belarus | 1 | 0.0% |
| Brazil | 33 | 0.2% |
| Canada | 45 | 0.3% |
| Caribbean | 6 | 0.0% |
| Central America | 82 | 0.5% |
| Chile | 34 | 0.2% |
| China | 87 | 0.6% |
| Colombia | 4 | 0.0% |
| Eastern Africa | 23 | 0.2% |
| Eastern Asia | 134 | 0.9% |
| Eastern Europe | 71 | 0.5% |
| England | 40 | 0.3% |
| Ethiopia | 6 | 0.0% |
| Europe | 222 | 1.5% |
| Germany | 10 | 0.1% |
| Ghana | 6 | 0.0% |
| Greece | 5 | 0.0% |
| Guatemala | 37 | 0.2% |
| India | 39 | 0.3% |
| Italy | 19 | 0.1% |
| Jamaica | 6 | 0.0% |
| Jordan | 12 | 0.1% |
| Kazakhstan | 2 | 0.0% |
| Korea | 47 | 0.3% |
| Laos | 80 | 0.5% |
| Latin America | 213 | 1.4% |
| Mexico | 45 | 0.3% |
| North Macedonia | 13 | 0.1% |
| Northern Europe | 117 | 0.8% |
| Oceania | 34 | 0.2% |
| Romania | 45 | 0.3% |
| South Africa | 9 | 0.1% |
| South America | 125 | 0.8% |
| South Central Asia | 41 | 0.3% |
| South Eastern Asia | 107 | 0.7% |
| Southern Europe | 24 | 0.2% |
| Syria | 22 | 0.1% |
| Turkey | 11 | 0.1% |
| Uganda | 12 | 0.1% |
| Venezuela | 54 | 0.4% |
| Vietnam | 10 | 0.1% |
| Western Africa | 6 | 0.0% |
| Western Asia | 45 | 0.3% |
| Western Europe | 10 | 0.1% | View All 47 Rows |
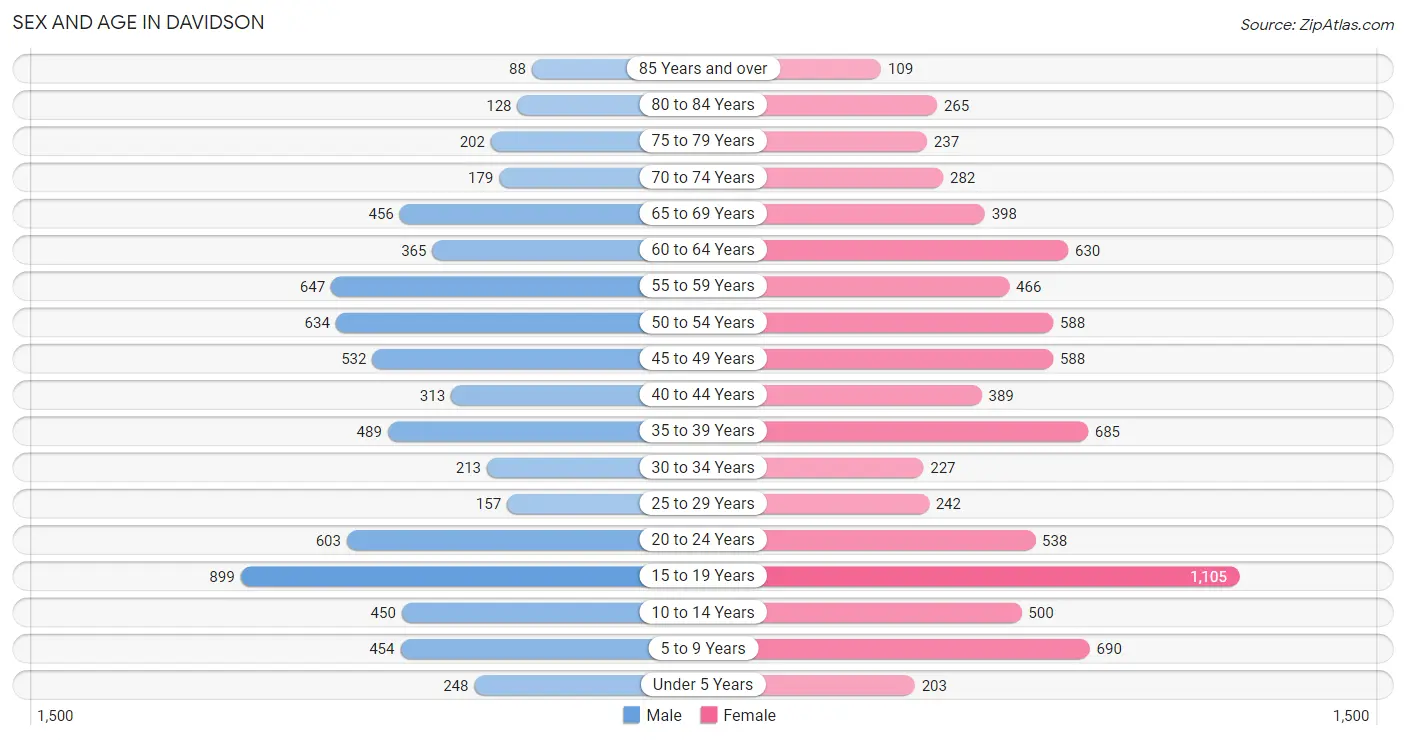
Sex and Age in Davidson
Sex and Age in Davidson
The most populous age groups in Davidson are 15 to 19 Years (899 | 12.7%) for men and 15 to 19 Years (1,105 | 13.6%) for women.
| Age Bracket | Male | Female |
| Under 5 Years | 248 (3.5%) | 203 (2.5%) |
| 5 to 9 Years | 454 (6.4%) | 690 (8.5%) |
| 10 to 14 Years | 450 (6.4%) | 500 (6.1%) |
| 15 to 19 Years | 899 (12.7%) | 1,105 (13.6%) |
| 20 to 24 Years | 603 (8.5%) | 538 (6.6%) |
| 25 to 29 Years | 157 (2.2%) | 242 (3.0%) |
| 30 to 34 Years | 213 (3.0%) | 227 (2.8%) |
| 35 to 39 Years | 489 (6.9%) | 685 (8.4%) |
| 40 to 44 Years | 313 (4.4%) | 389 (4.8%) |
| 45 to 49 Years | 532 (7.5%) | 588 (7.2%) |
| 50 to 54 Years | 634 (9.0%) | 588 (7.2%) |
| 55 to 59 Years | 647 (9.2%) | 466 (5.7%) |
| 60 to 64 Years | 365 (5.2%) | 630 (7.7%) |
| 65 to 69 Years | 456 (6.5%) | 398 (4.9%) |
| 70 to 74 Years | 179 (2.5%) | 282 (3.5%) |
| 75 to 79 Years | 202 (2.9%) | 237 (2.9%) |
| 80 to 84 Years | 128 (1.8%) | 265 (3.3%) |
| 85 Years and over | 88 (1.3%) | 109 (1.3%) |
| Total | 7,057 (100.0%) | 8,142 (100.0%) |
Families and Households in Davidson
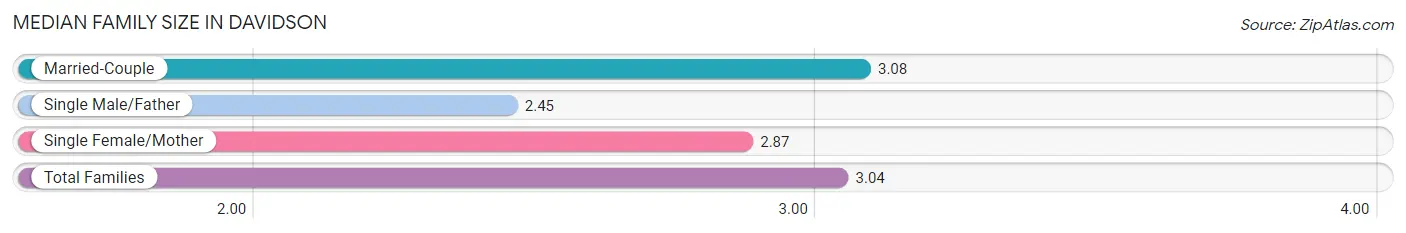
Median Family Size in Davidson
The median family size in Davidson is 3.04 persons per family, with married-couple families (3,308 | 86.5%) accounting for the largest median family size of 3.08 persons per family. On the other hand, single male/father families (122 | 3.2%) represent the smallest median family size with 2.45 persons per family.
| Family Type | # Families | Family Size |
| Married-Couple | 3,308 (86.5%) | 3.08 |
| Single Male/Father | 122 (3.2%) | 2.45 |
| Single Female/Mother | 395 (10.3%) | 2.87 |
| Total Families | 3,825 (100.0%) | 3.04 |
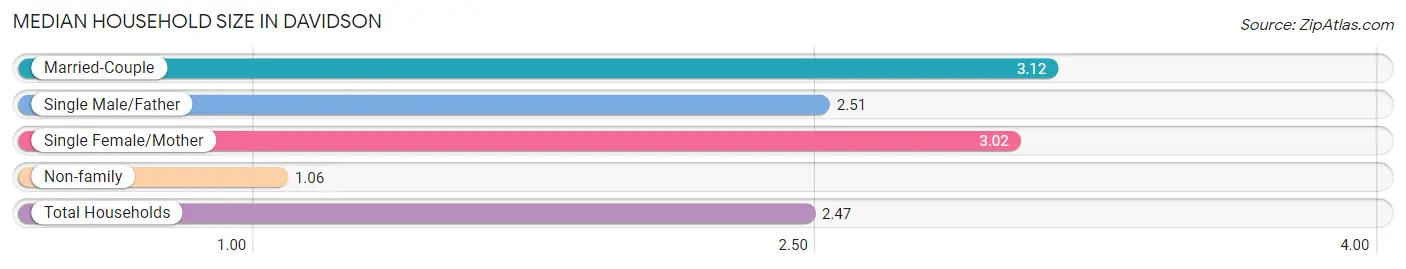
Median Household Size in Davidson
The median household size in Davidson is 2.47 persons per household, with married-couple households (3,308 | 60.0%) accounting for the largest median household size of 3.12 persons per household. non-family households (1,685 | 30.6%) represent the smallest median household size with 1.06 persons per household.
| Household Type | # Households | Household Size |
| Married-Couple | 3,308 (60.0%) | 3.12 |
| Single Male/Father | 122 (2.2%) | 2.51 |
| Single Female/Mother | 395 (7.2%) | 3.02 |
| Non-family | 1,685 (30.6%) | 1.06 |
| Total Households | 5,510 (100.0%) | 2.47 |
Household Size by Marriage Status in Davidson
Out of a total of 5,510 households in Davidson, 3,825 (69.4%) are family households, while 1,685 (30.6%) are nonfamily households. The most numerous type of family households are 2-person households, comprising 1,805, and the most common type of nonfamily households are 1-person households, comprising 1,589.
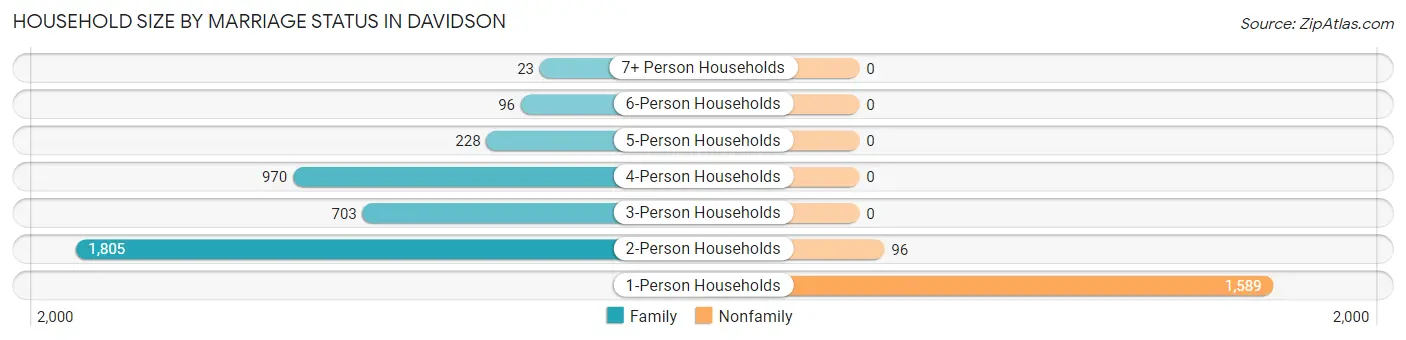
| Household Size | Family Households | Nonfamily Households |
| 1-Person Households | - | 1,589 (28.8%) |
| 2-Person Households | 1,805 (32.8%) | 96 (1.7%) |
| 3-Person Households | 703 (12.8%) | 0 (0.0%) |
| 4-Person Households | 970 (17.6%) | 0 (0.0%) |
| 5-Person Households | 228 (4.1%) | 0 (0.0%) |
| 6-Person Households | 96 (1.7%) | 0 (0.0%) |
| 7+ Person Households | 23 (0.4%) | 0 (0.0%) |
| Total | 3,825 (69.4%) | 1,685 (30.6%) |
Female Fertility in Davidson
Fertility by Age in Davidson
Average fertility rate in Davidson is 11.0 births per 1,000 women. Women in the age bracket of 20 to 34 years have the highest fertility rate with 25.0 births per 1,000 women. Women in the age bracket of 20 to 34 years acount for 56.8% of all women with births.
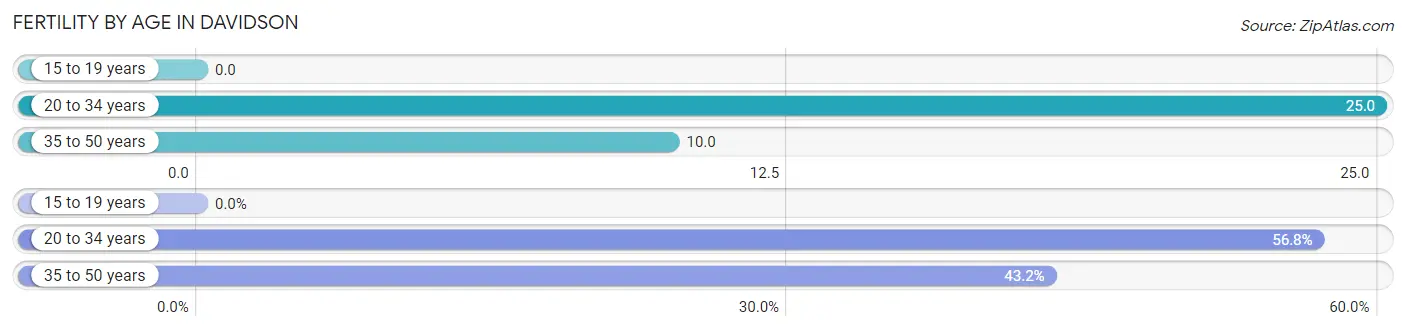
| Age Bracket | Women with Births | Births / 1,000 Women |
| 15 to 19 years | 0 (0.0%) | 0.0 |
| 20 to 34 years | 25 (56.8%) | 25.0 |
| 35 to 50 years | 19 (43.2%) | 10.0 |
| Total | 44 (100.0%) | 11.0 |
Fertility by Age by Marriage Status in Davidson
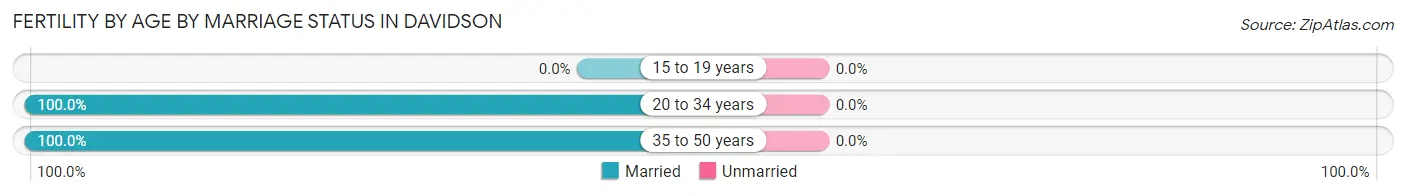
| Age Bracket | Married | Unmarried |
| 15 to 19 years | 0 (0.0%) | 0 (0.0%) |
| 20 to 34 years | 25 (100.0%) | 0 (0.0%) |
| 35 to 50 years | 19 (100.0%) | 0 (0.0%) |
| Total | 44 (100.0%) | 0 (0.0%) |
Fertility by Education in Davidson
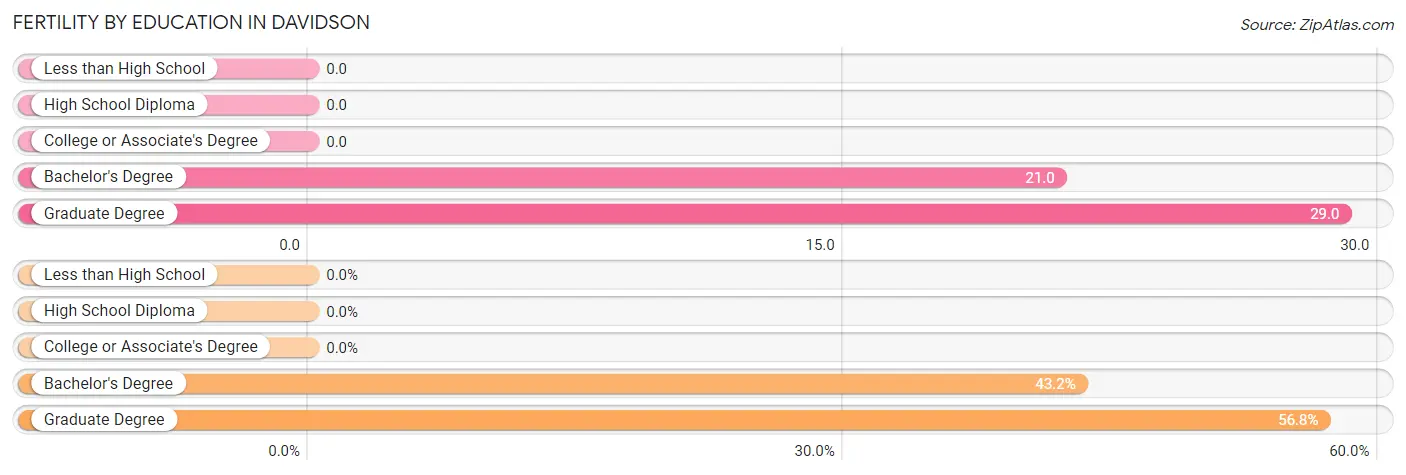
| Educational Attainment | Women with Births | Births / 1,000 Women |
| Less than High School | 0 (0.0%) | 0.0 |
| High School Diploma | 0 (0.0%) | 0.0 |
| College or Associate's Degree | 0 (0.0%) | 0.0 |
| Bachelor's Degree | 19 (43.2%) | 21.0 |
| Graduate Degree | 25 (56.8%) | 29.0 |
| Total | 44 (100.0%) | 11.0 |
Fertility by Education by Marriage Status in Davidson
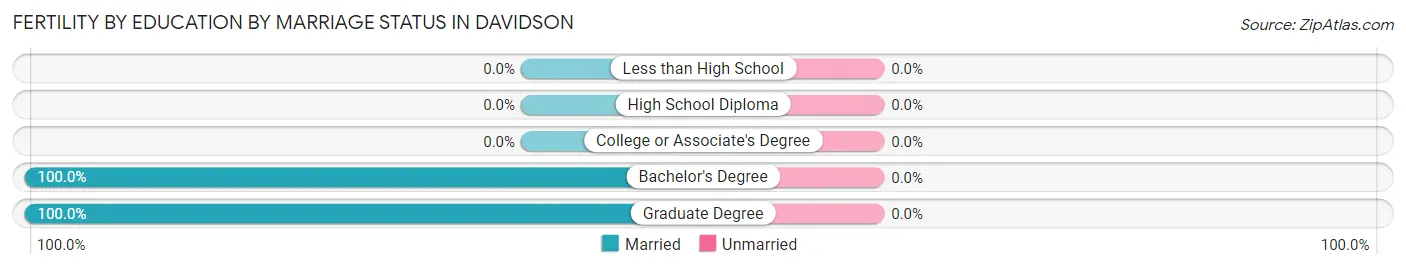
| Educational Attainment | Married | Unmarried |
| Less than High School | 0 (0.0%) | 0 (0.0%) |
| High School Diploma | 0 (0.0%) | 0 (0.0%) |
| College or Associate's Degree | 0 (0.0%) | 0 (0.0%) |
| Bachelor's Degree | 19 (100.0%) | 0 (0.0%) |
| Graduate Degree | 25 (100.0%) | 0 (0.0%) |
| Total | 44 (100.0%) | 0 (0.0%) |
Employment Characteristics in Davidson
Employment by Class of Employer in Davidson
Among the 7,223 employed individuals in Davidson, private company employees (4,708 | 65.2%), not-for-profit organizations (1,277 | 17.7%), and self-employed (incorporated) (567 | 7.9%) make up the most common classes of employment.
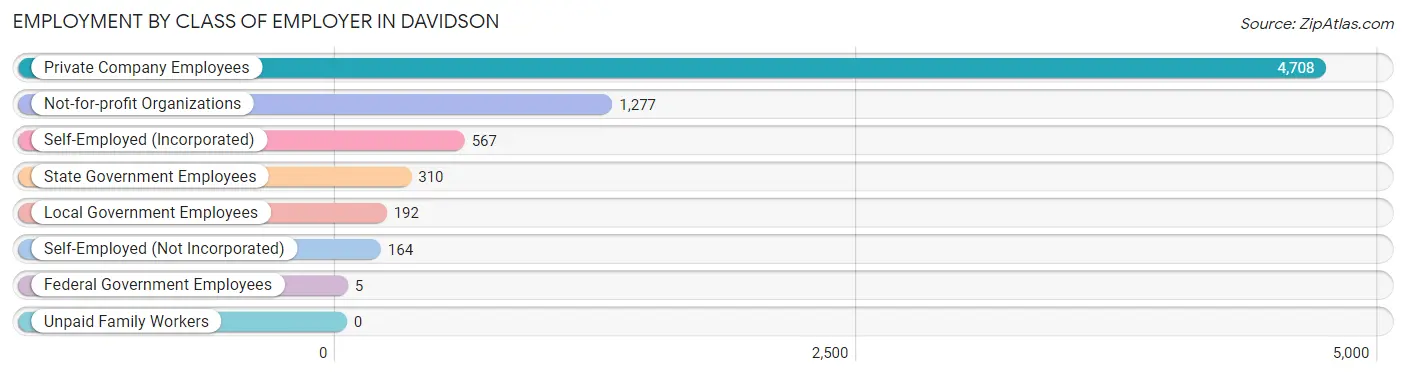
| Employer Class | # Employees | % Employees |
| Private Company Employees | 4,708 | 65.2% |
| Self-Employed (Incorporated) | 567 | 7.9% |
| Self-Employed (Not Incorporated) | 164 | 2.3% |
| Not-for-profit Organizations | 1,277 | 17.7% |
| Local Government Employees | 192 | 2.7% |
| State Government Employees | 310 | 4.3% |
| Federal Government Employees | 5 | 0.1% |
| Unpaid Family Workers | 0 | 0.0% |
| Total | 7,223 | 100.0% |
Employment Status by Age in Davidson
According to the labor force statistics for Davidson, out of the total population over 16 years of age (12,369), 61.5% or 7,607 individuals are in the labor force, with 2.4% or 183 of them unemployed. The age group with the highest labor force participation rate is 25 to 29 years, with 100.0% or 399 individuals in the labor force. Within the labor force, the 20 to 24 years age range has the highest percentage of unemployed individuals, with 8.9% or 60 of them being unemployed.
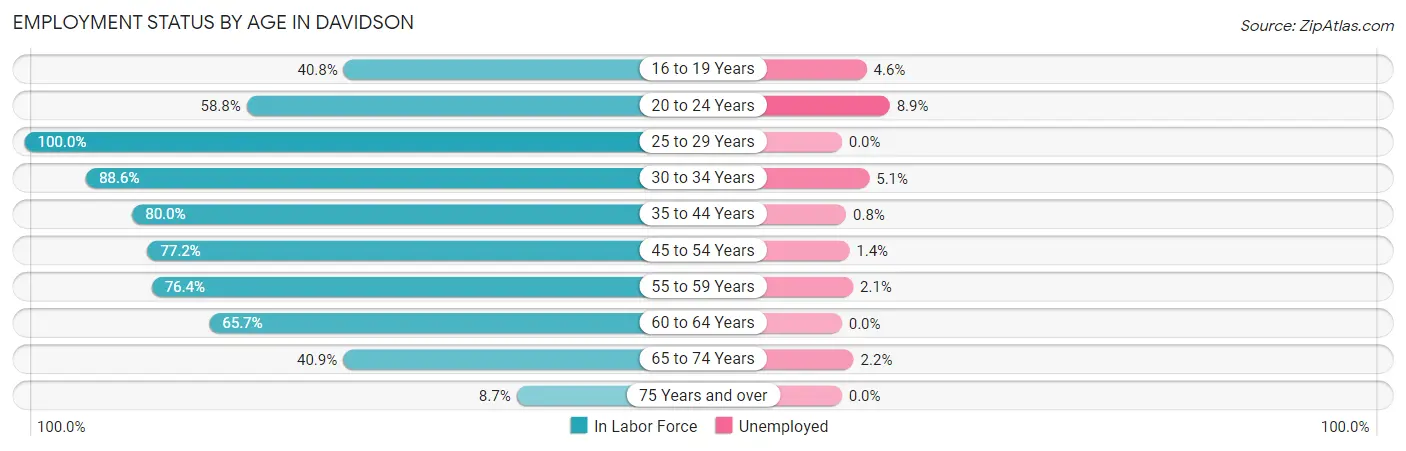
| Age Bracket | In Labor Force | Unemployed |
| 16 to 19 Years | 701 (40.8%) | 32 (4.6%) |
| 20 to 24 Years | 671 (58.8%) | 60 (8.9%) |
| 25 to 29 Years | 399 (100.0%) | 0 (0.0%) |
| 30 to 34 Years | 390 (88.6%) | 20 (5.1%) |
| 35 to 44 Years | 1,501 (80.0%) | 12 (0.8%) |
| 45 to 54 Years | 1,808 (77.2%) | 25 (1.4%) |
| 55 to 59 Years | 850 (76.4%) | 18 (2.1%) |
| 60 to 64 Years | 654 (65.7%) | 0 (0.0%) |
| 65 to 74 Years | 538 (40.9%) | 12 (2.2%) |
| 75 Years and over | 90 (8.7%) | 0 (0.0%) |
| Total | 7,607 (61.5%) | 183 (2.4%) |
Employment Status by Educational Attainment in Davidson
According to labor force statistics for Davidson, 78.2% of individuals (5,603) out of the total population between 25 and 64 years of age (7,165) are in the labor force, with 1.4% or 78 of them being unemployed. The group with the highest labor force participation rate are those with the educational attainment of college / associate degree, with 81.1% or 913 individuals in the labor force. Within the labor force, individuals with college / associate degree education have the highest percentage of unemployment, with 2.2% or 20 of them being unemployed.
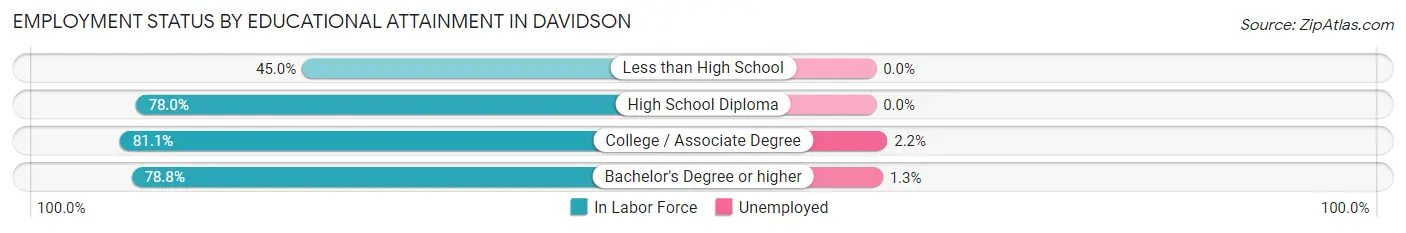
| Educational Attainment | In Labor Force | Unemployed |
| Less than High School | 91 (45.0%) | 0 (0.0%) |
| High School Diploma | 327 (78.0%) | 0 (0.0%) |
| College / Associate Degree | 913 (81.1%) | 25 (2.2%) |
| Bachelor's Degree or higher | 4,269 (78.8%) | 70 (1.3%) |
| Total | 5,603 (78.2%) | 100 (1.4%) |
Employment Occupations by Sex in Davidson
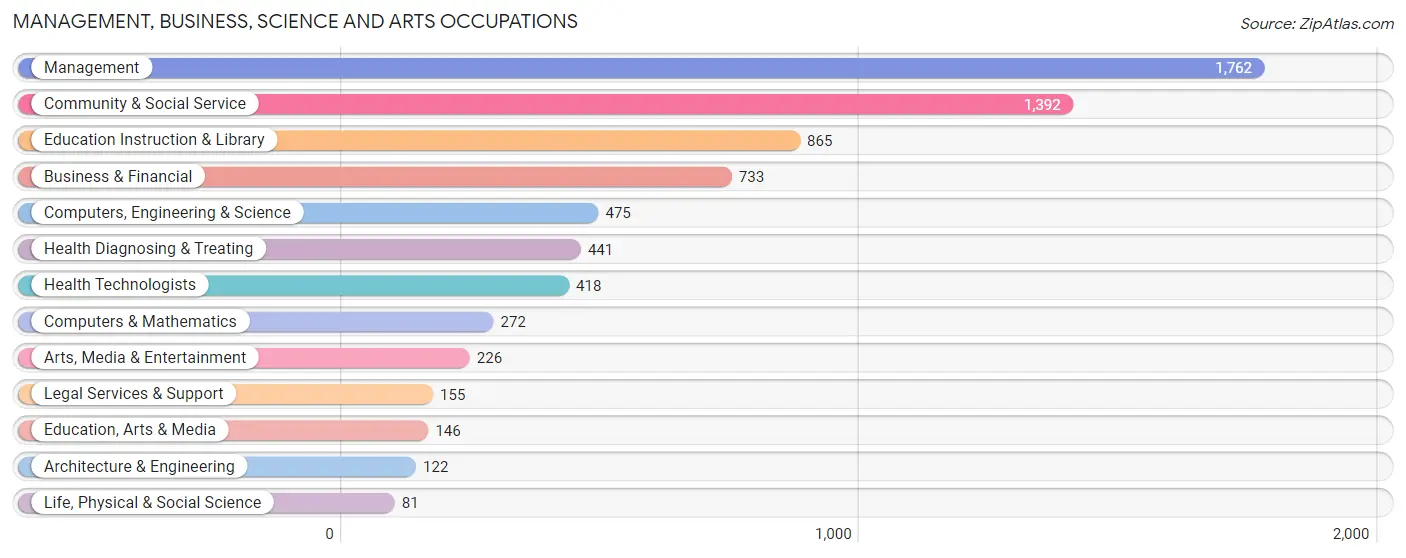
Management, Business, Science and Arts Occupations
The most common Management, Business, Science and Arts occupations in Davidson are Management (1,762 | 23.7%), Community & Social Service (1,392 | 18.8%), Education Instruction & Library (865 | 11.7%), Business & Financial (733 | 9.9%), and Computers, Engineering & Science (475 | 6.4%).
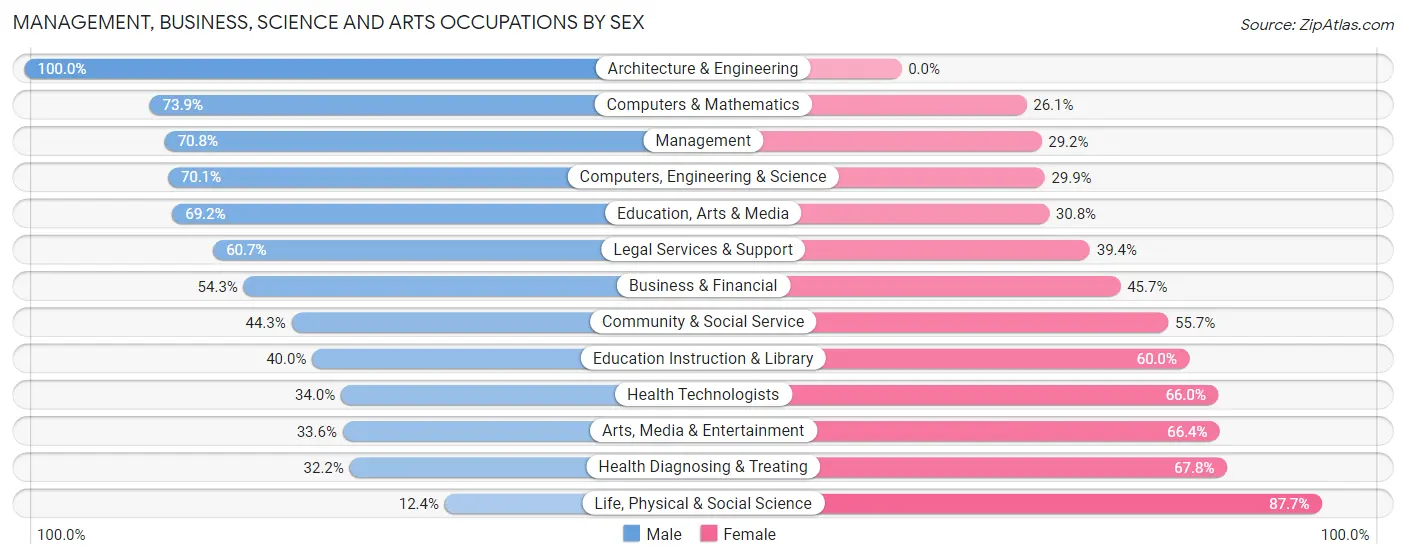
Management, Business, Science and Arts Occupations by Sex
Within the Management, Business, Science and Arts occupations in Davidson, the most male-oriented occupations are Architecture & Engineering (100.0%), Computers & Mathematics (73.9%), and Management (70.8%), while the most female-oriented occupations are Life, Physical & Social Science (87.6%), Health Diagnosing & Treating (67.8%), and Arts, Media & Entertainment (66.4%).
| Occupation | Male | Female |
| Management | 1,247 (70.8%) | 515 (29.2%) |
| Business & Financial | 398 (54.3%) | 335 (45.7%) |
| Computers, Engineering & Science | 333 (70.1%) | 142 (29.9%) |
| Computers & Mathematics | 201 (73.9%) | 71 (26.1%) |
| Architecture & Engineering | 122 (100.0%) | 0 (0.0%) |
| Life, Physical & Social Science | 10 (12.3%) | 71 (87.6%) |
| Community & Social Service | 617 (44.3%) | 775 (55.7%) |
| Education, Arts & Media | 101 (69.2%) | 45 (30.8%) |
| Legal Services & Support | 94 (60.7%) | 61 (39.4%) |
| Education Instruction & Library | 346 (40.0%) | 519 (60.0%) |
| Arts, Media & Entertainment | 76 (33.6%) | 150 (66.4%) |
| Health Diagnosing & Treating | 142 (32.2%) | 299 (67.8%) |
| Health Technologists | 142 (34.0%) | 276 (66.0%) |
| Total (Category) | 2,737 (57.0%) | 2,066 (43.0%) |
| Total (Overall) | 3,891 (52.4%) | 3,530 (47.6%) |
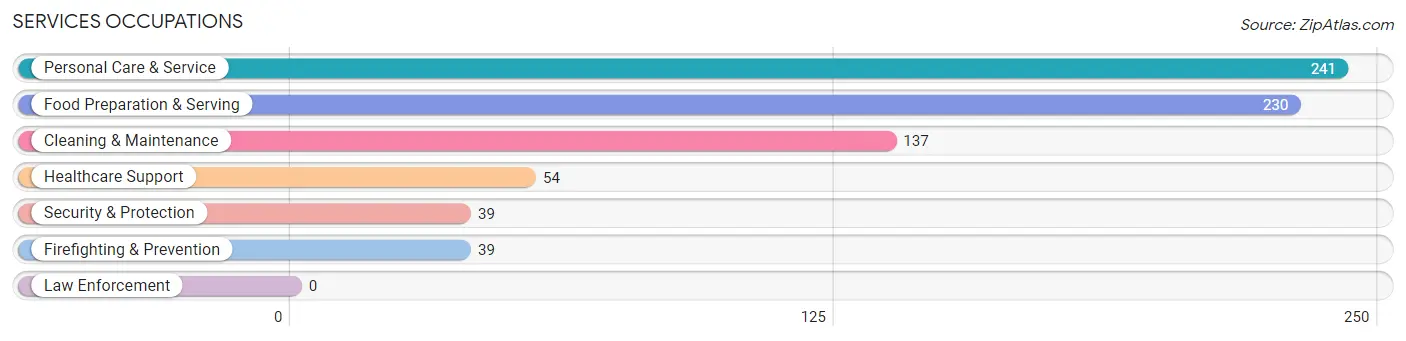
Services Occupations
The most common Services occupations in Davidson are Personal Care & Service (241 | 3.3%), Food Preparation & Serving (230 | 3.1%), Cleaning & Maintenance (137 | 1.8%), Healthcare Support (54 | 0.7%), and Security & Protection (39 | 0.5%).
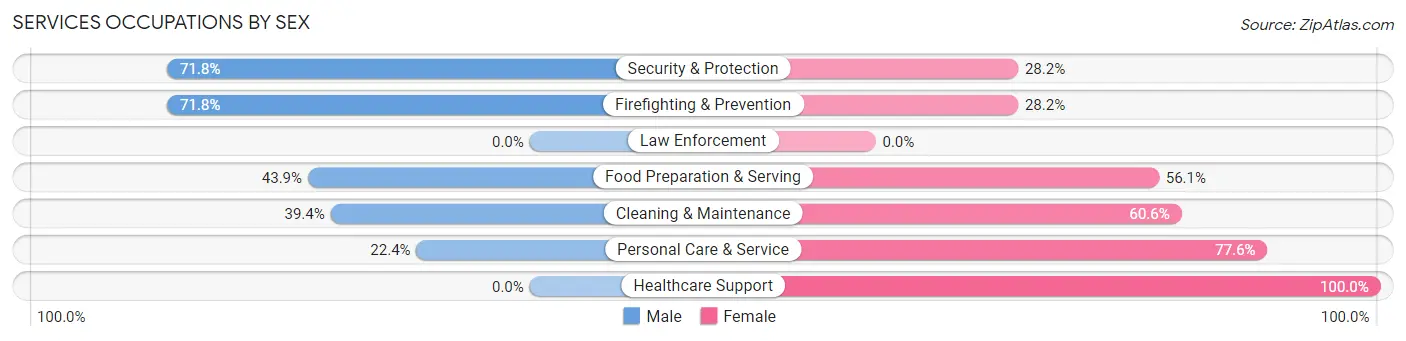
Services Occupations by Sex
Within the Services occupations in Davidson, the most male-oriented occupations are Security & Protection (71.8%), Firefighting & Prevention (71.8%), and Food Preparation & Serving (43.9%), while the most female-oriented occupations are Healthcare Support (100.0%), Personal Care & Service (77.6%), and Cleaning & Maintenance (60.6%).
| Occupation | Male | Female |
| Healthcare Support | 0 (0.0%) | 54 (100.0%) |
| Security & Protection | 28 (71.8%) | 11 (28.2%) |
| Firefighting & Prevention | 28 (71.8%) | 11 (28.2%) |
| Law Enforcement | 0 (0.0%) | 0 (0.0%) |
| Food Preparation & Serving | 101 (43.9%) | 129 (56.1%) |
| Cleaning & Maintenance | 54 (39.4%) | 83 (60.6%) |
| Personal Care & Service | 54 (22.4%) | 187 (77.6%) |
| Total (Category) | 237 (33.8%) | 464 (66.2%) |
| Total (Overall) | 3,891 (52.4%) | 3,530 (47.6%) |
Sales and Office Occupations
The most common Sales and Office occupations in Davidson are Sales & Related (778 | 10.5%), and Office & Administration (562 | 7.6%).
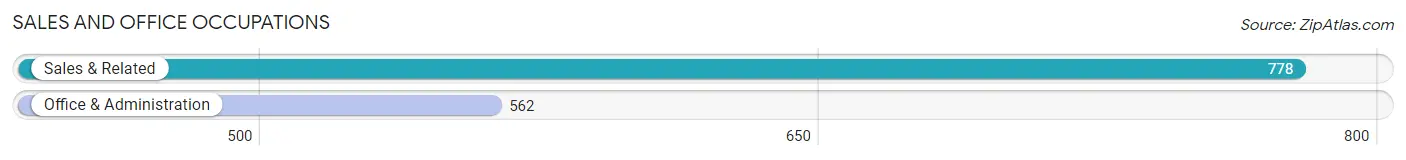
Sales and Office Occupations by Sex
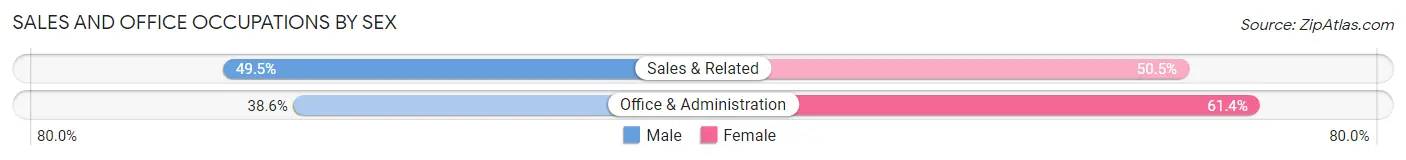
| Occupation | Male | Female |
| Sales & Related | 385 (49.5%) | 393 (50.5%) |
| Office & Administration | 217 (38.6%) | 345 (61.4%) |
| Total (Category) | 602 (44.9%) | 738 (55.1%) |
| Total (Overall) | 3,891 (52.4%) | 3,530 (47.6%) |
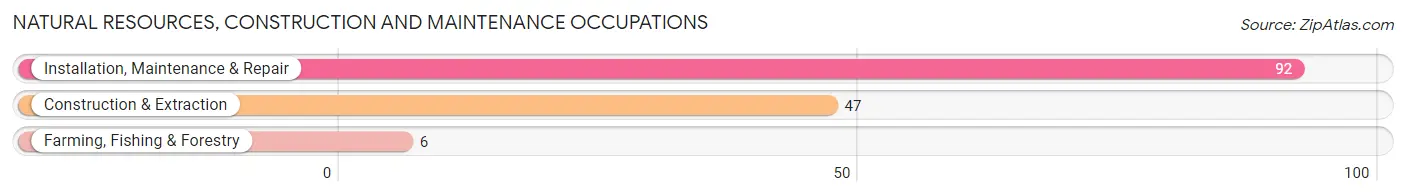
Natural Resources, Construction and Maintenance Occupations
The most common Natural Resources, Construction and Maintenance occupations in Davidson are Installation, Maintenance & Repair (92 | 1.2%), Construction & Extraction (47 | 0.6%), and Farming, Fishing & Forestry (6 | 0.1%).
Natural Resources, Construction and Maintenance Occupations by Sex
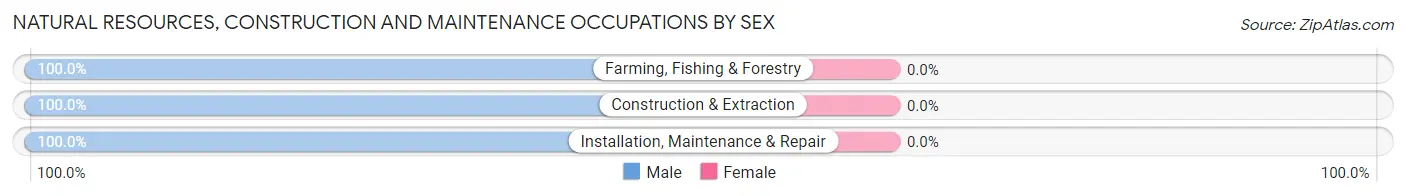
| Occupation | Male | Female |
| Farming, Fishing & Forestry | 6 (100.0%) | 0 (0.0%) |
| Construction & Extraction | 47 (100.0%) | 0 (0.0%) |
| Installation, Maintenance & Repair | 92 (100.0%) | 0 (0.0%) |
| Total (Category) | 145 (100.0%) | 0 (0.0%) |
| Total (Overall) | 3,891 (52.4%) | 3,530 (47.6%) |
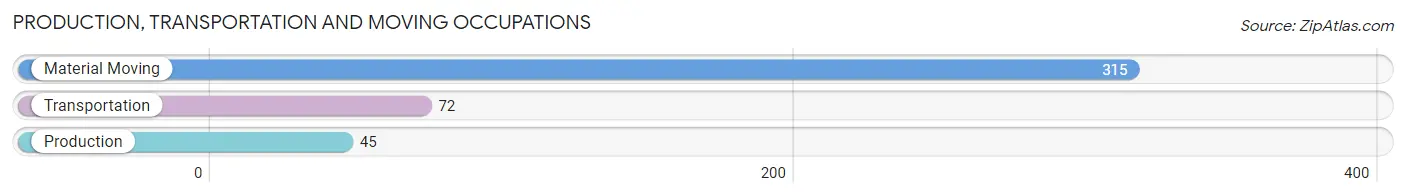
Production, Transportation and Moving Occupations
The most common Production, Transportation and Moving occupations in Davidson are Material Moving (315 | 4.2%), Transportation (72 | 1.0%), and Production (45 | 0.6%).
Production, Transportation and Moving Occupations by Sex
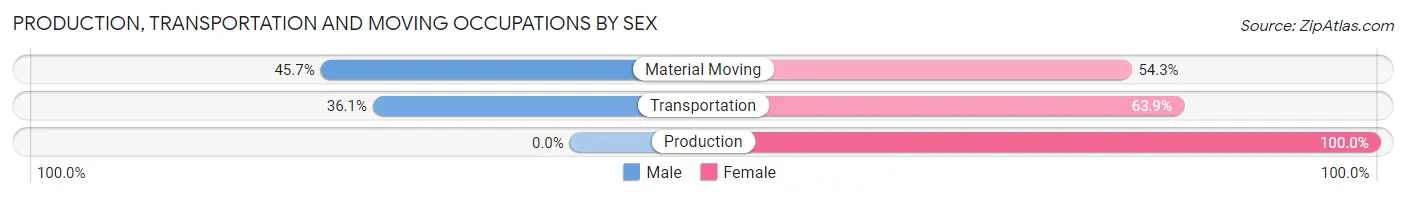
| Occupation | Male | Female |
| Production | 0 (0.0%) | 45 (100.0%) |
| Transportation | 26 (36.1%) | 46 (63.9%) |
| Material Moving | 144 (45.7%) | 171 (54.3%) |
| Total (Category) | 170 (39.4%) | 262 (60.7%) |
| Total (Overall) | 3,891 (52.4%) | 3,530 (47.6%) |
Employment Industries by Sex in Davidson
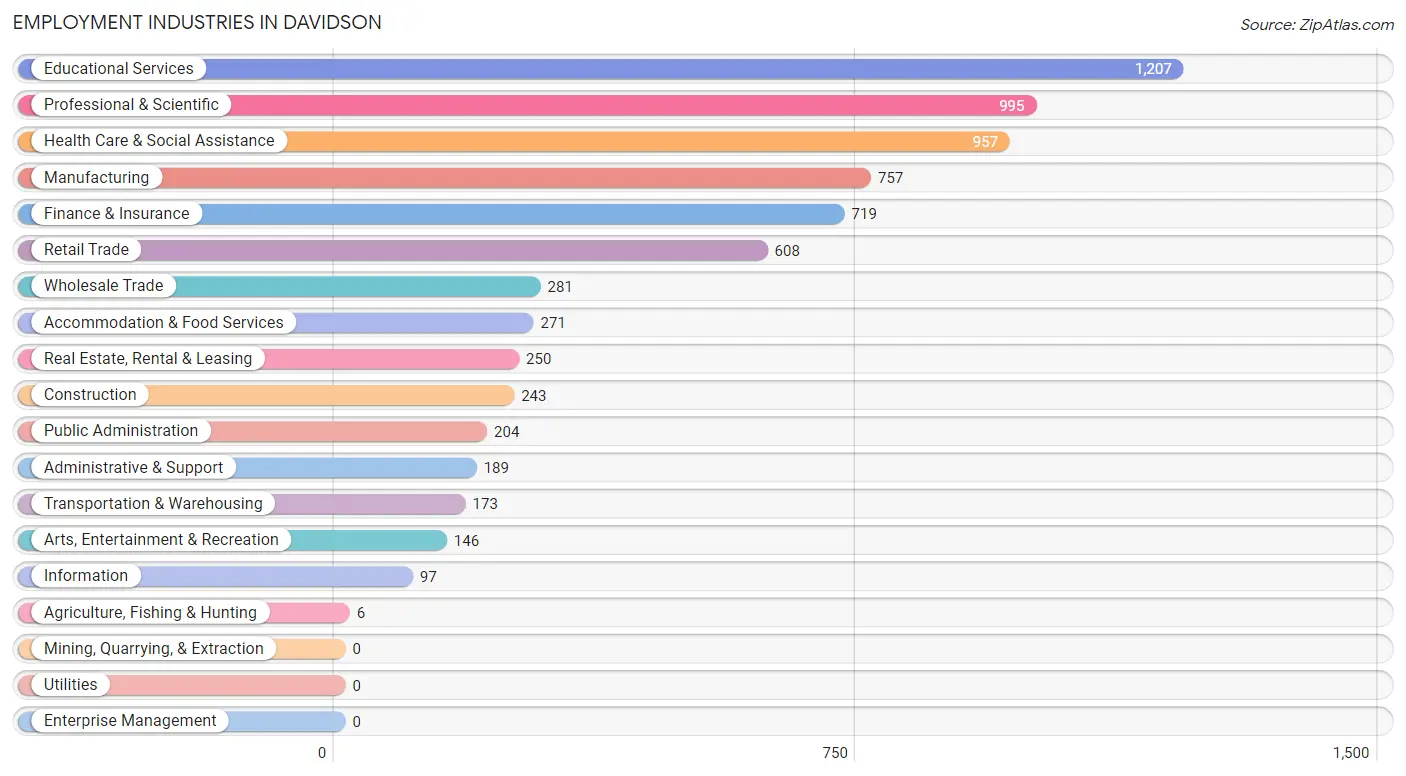
Employment Industries in Davidson
The major employment industries in Davidson include Educational Services (1,207 | 16.3%), Professional & Scientific (995 | 13.4%), Health Care & Social Assistance (957 | 12.9%), Manufacturing (757 | 10.2%), and Finance & Insurance (719 | 9.7%).
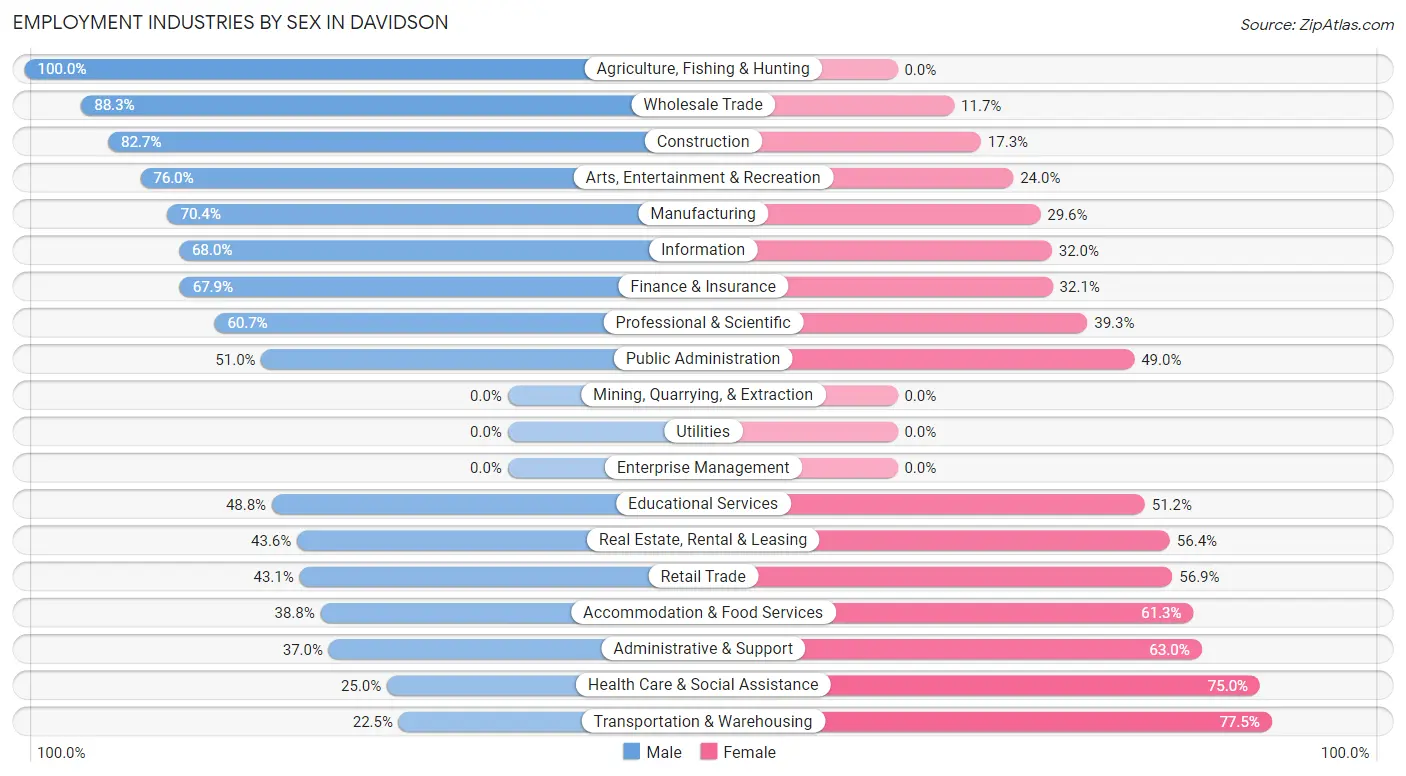
Employment Industries by Sex in Davidson
The Davidson industries that see more men than women are Agriculture, Fishing & Hunting (100.0%), Wholesale Trade (88.3%), and Construction (82.7%), whereas the industries that tend to have a higher number of women are Transportation & Warehousing (77.5%), Health Care & Social Assistance (75.0%), and Administrative & Support (63.0%).
| Industry | Male | Female |
| Agriculture, Fishing & Hunting | 6 (100.0%) | 0 (0.0%) |
| Mining, Quarrying, & Extraction | 0 (0.0%) | 0 (0.0%) |
| Construction | 201 (82.7%) | 42 (17.3%) |
| Manufacturing | 533 (70.4%) | 224 (29.6%) |
| Wholesale Trade | 248 (88.3%) | 33 (11.7%) |
| Retail Trade | 262 (43.1%) | 346 (56.9%) |
| Transportation & Warehousing | 39 (22.5%) | 134 (77.5%) |
| Utilities | 0 (0.0%) | 0 (0.0%) |
| Information | 66 (68.0%) | 31 (32.0%) |
| Finance & Insurance | 488 (67.9%) | 231 (32.1%) |
| Real Estate, Rental & Leasing | 109 (43.6%) | 141 (56.4%) |
| Professional & Scientific | 604 (60.7%) | 391 (39.3%) |
| Enterprise Management | 0 (0.0%) | 0 (0.0%) |
| Administrative & Support | 70 (37.0%) | 119 (63.0%) |
| Educational Services | 589 (48.8%) | 618 (51.2%) |
| Health Care & Social Assistance | 239 (25.0%) | 718 (75.0%) |
| Arts, Entertainment & Recreation | 111 (76.0%) | 35 (24.0%) |
| Accommodation & Food Services | 105 (38.8%) | 166 (61.3%) |
| Public Administration | 104 (51.0%) | 100 (49.0%) |
| Total | 3,891 (52.4%) | 3,530 (47.6%) |
Education in Davidson
School Enrollment in Davidson
The most common levels of schooling among the 5,137 students in Davidson are college / undergraduate (2,059 | 40.1%), middle school (847 | 16.5%), and elementary school (810 | 15.8%).
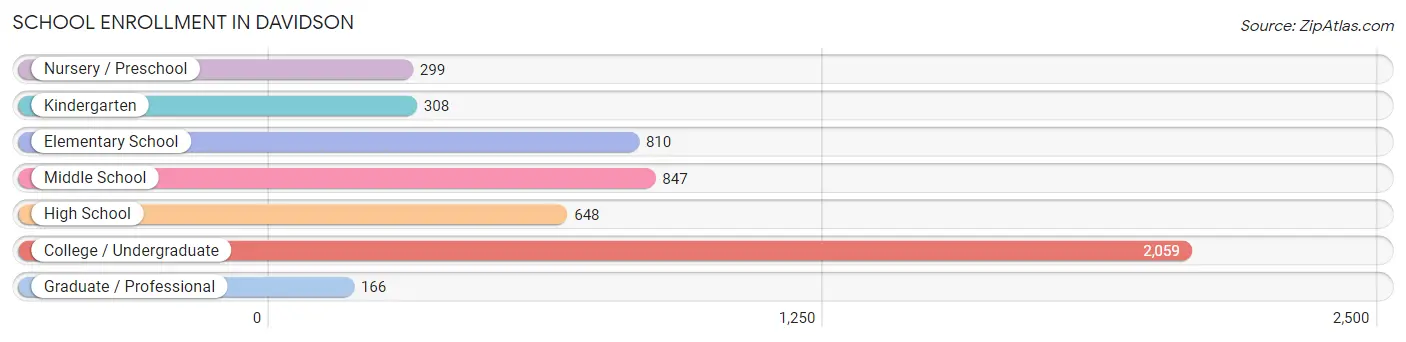
| School Level | # Students | % Students |
| Nursery / Preschool | 299 | 5.8% |
| Kindergarten | 308 | 6.0% |
| Elementary School | 810 | 15.8% |
| Middle School | 847 | 16.5% |
| High School | 648 | 12.6% |
| College / Undergraduate | 2,059 | 40.1% |
| Graduate / Professional | 166 | 3.2% |
| Total | 5,137 | 100.0% |
School Enrollment by Age by Funding Source in Davidson
Out of a total of 5,137 students who are enrolled in schools in Davidson, 2,204 (42.9%) attend a private institution, while the remaining 2,933 (57.1%) are enrolled in public schools. The age group of 20 to 24 year olds has the highest likelihood of being enrolled in private schools, with 697 (77.6% in the age bracket) enrolled. Conversely, the age group of 25 to 34 year olds has the lowest likelihood of being enrolled in a private school, with 38 (100.0% in the age bracket) attending a public institution.
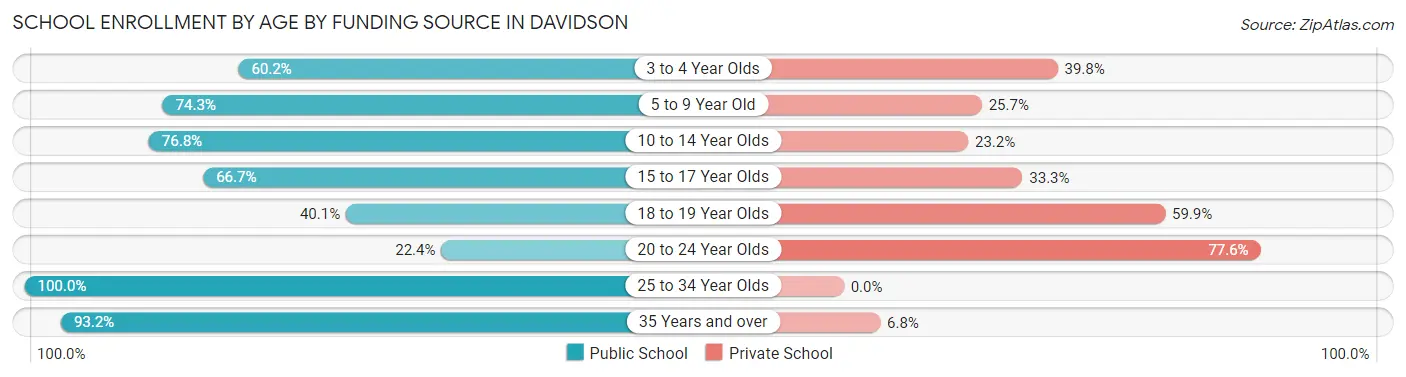
| Age Bracket | Public School | Private School |
| 3 to 4 Year Olds | 148 (60.2%) | 98 (39.8%) |
| 5 to 9 Year Old | 823 (74.3%) | 285 (25.7%) |
| 10 to 14 Year Olds | 730 (76.8%) | 220 (23.2%) |
| 15 to 17 Year Olds | 429 (66.7%) | 214 (33.3%) |
| 18 to 19 Year Olds | 456 (40.1%) | 680 (59.9%) |
| 20 to 24 Year Olds | 201 (22.4%) | 697 (77.6%) |
| 25 to 34 Year Olds | 38 (100.0%) | 0 (0.0%) |
| 35 Years and over | 110 (93.2%) | 8 (6.8%) |
| Total | 2,933 (57.1%) | 2,204 (42.9%) |
Educational Attainment by Field of Study in Davidson
Business (1,769 | 23.6%), science & technology (673 | 9.0%), social sciences (661 | 8.8%), communications (550 | 7.3%), and education (547 | 7.3%) are the most common fields of study among 7,488 individuals in Davidson who have obtained a bachelor's degree or higher.

| Field of Study | # Graduates | % Graduates |
| Computers & Mathematics | 529 | 7.1% |
| Bio, Nature & Agricultural | 523 | 7.0% |
| Physical & Health Sciences | 175 | 2.3% |
| Psychology | 365 | 4.9% |
| Social Sciences | 661 | 8.8% |
| Engineering | 520 | 6.9% |
| Multidisciplinary Studies | 40 | 0.5% |
| Science & Technology | 673 | 9.0% |
| Business | 1,769 | 23.6% |
| Education | 547 | 7.3% |
| Literature & Languages | 436 | 5.8% |
| Liberal Arts & History | 400 | 5.3% |
| Visual & Performing Arts | 119 | 1.6% |
| Communications | 550 | 7.3% |
| Arts & Humanities | 181 | 2.4% |
| Total | 7,488 | 100.0% |
Transportation & Commute in Davidson
Vehicle Availability by Sex in Davidson
The most prevalent vehicle ownership categories in Davidson are males with 2 vehicles (1,641, accounting for 45.9%) and females with 2 vehicles (1,355, making up 53.7%).
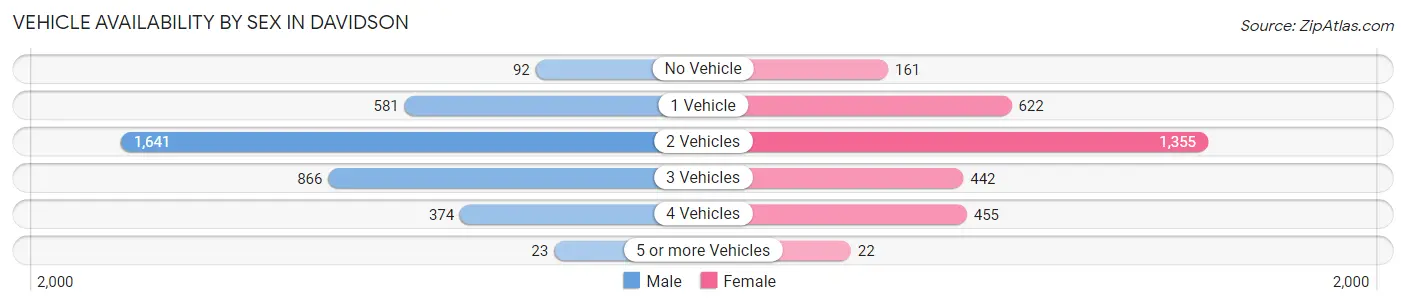
| Vehicles Available | Male | Female |
| No Vehicle | 92 (2.6%) | 161 (5.3%) |
| 1 Vehicle | 581 (16.2%) | 622 (20.3%) |
| 2 Vehicles | 1,641 (45.9%) | 1,355 (44.3%) |
| 3 Vehicles | 866 (24.2%) | 442 (14.5%) |
| 4 Vehicles | 374 (10.5%) | 455 (14.9%) |
| 5 or more Vehicles | 23 (0.6%) | 22 (0.7%) |
| Total | 3,577 (100.0%) | 3,057 (100.0%) |
Commute Time in Davidson
The most frequently occuring commute durations in Davidson are 5 to 9 minutes (1,083 commuters, 19.7%), 20 to 24 minutes (679 commuters, 12.3%), and 10 to 14 minutes (660 commuters, 12.0%).
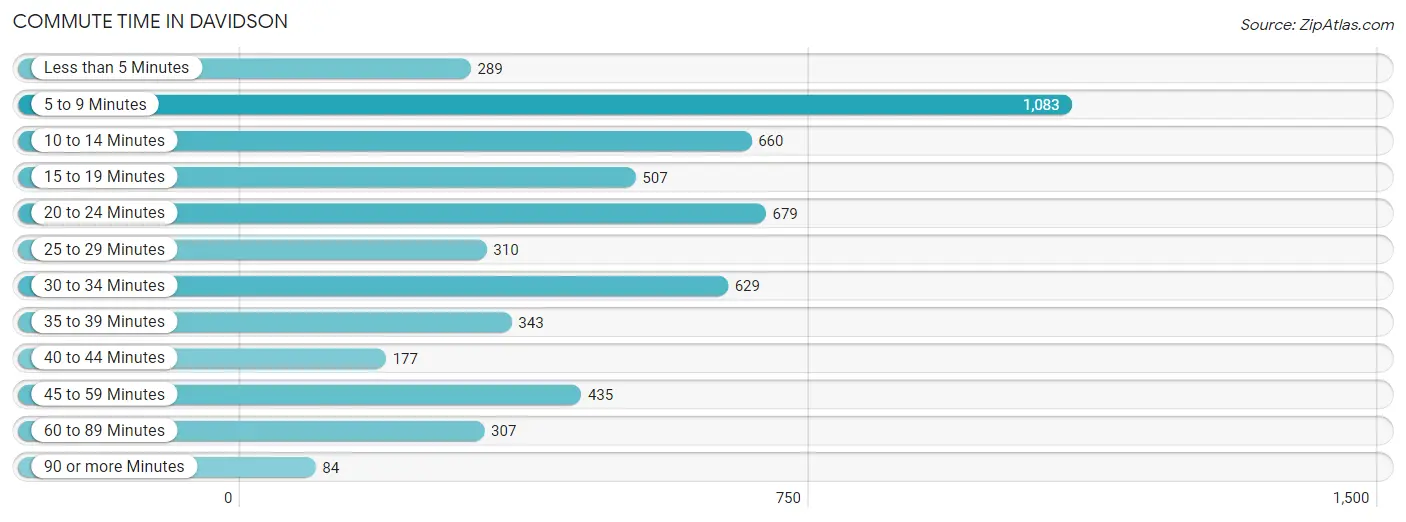
| Commute Time | # Commuters | % Commuters |
| Less than 5 Minutes | 289 | 5.2% |
| 5 to 9 Minutes | 1,083 | 19.7% |
| 10 to 14 Minutes | 660 | 12.0% |
| 15 to 19 Minutes | 507 | 9.2% |
| 20 to 24 Minutes | 679 | 12.3% |
| 25 to 29 Minutes | 310 | 5.6% |
| 30 to 34 Minutes | 629 | 11.4% |
| 35 to 39 Minutes | 343 | 6.2% |
| 40 to 44 Minutes | 177 | 3.2% |
| 45 to 59 Minutes | 435 | 7.9% |
| 60 to 89 Minutes | 307 | 5.6% |
| 90 or more Minutes | 84 | 1.5% |
Commute Time by Sex in Davidson
The most common commute times in Davidson are 5 to 9 minutes (426 commuters, 15.9%) for males and 5 to 9 minutes (657 commuters, 23.3%) for females.
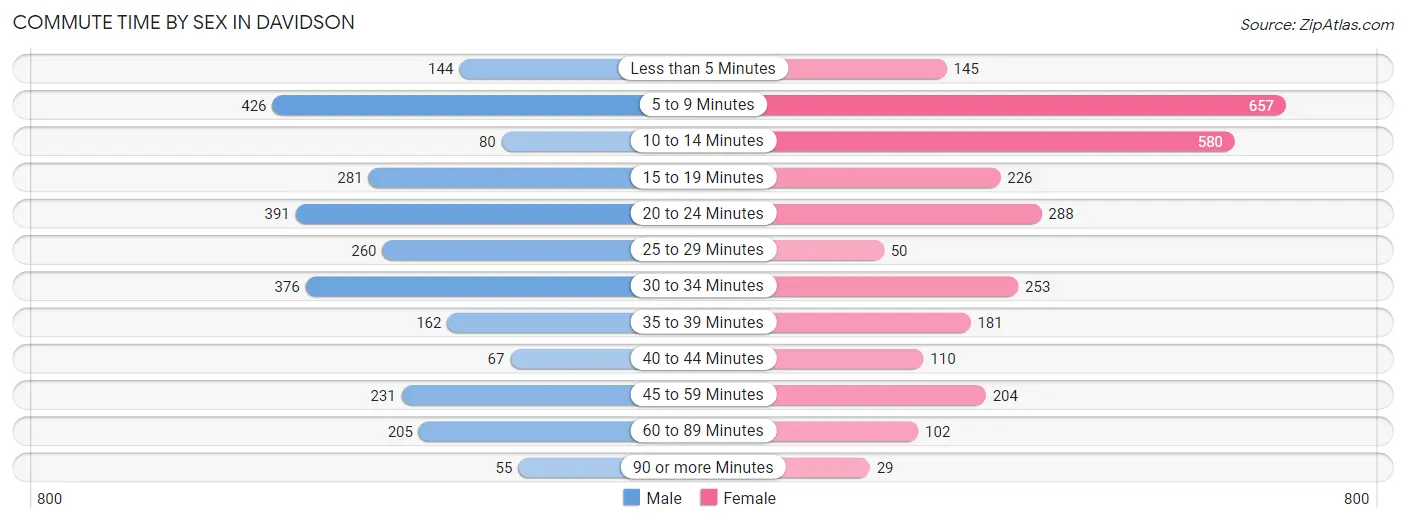
| Commute Time | Male | Female |
| Less than 5 Minutes | 144 (5.4%) | 145 (5.1%) |
| 5 to 9 Minutes | 426 (15.9%) | 657 (23.3%) |
| 10 to 14 Minutes | 80 (3.0%) | 580 (20.5%) |
| 15 to 19 Minutes | 281 (10.5%) | 226 (8.0%) |
| 20 to 24 Minutes | 391 (14.6%) | 288 (10.2%) |
| 25 to 29 Minutes | 260 (9.7%) | 50 (1.8%) |
| 30 to 34 Minutes | 376 (14.0%) | 253 (9.0%) |
| 35 to 39 Minutes | 162 (6.0%) | 181 (6.4%) |
| 40 to 44 Minutes | 67 (2.5%) | 110 (3.9%) |
| 45 to 59 Minutes | 231 (8.6%) | 204 (7.2%) |
| 60 to 89 Minutes | 205 (7.6%) | 102 (3.6%) |
| 90 or more Minutes | 55 (2.1%) | 29 (1.0%) |
Time of Departure to Work by Sex in Davidson
The most frequent times of departure to work in Davidson are 6:30 AM to 6:59 AM (397, 14.8%) for males and 8:00 AM to 8:29 AM (560, 19.8%) for females.
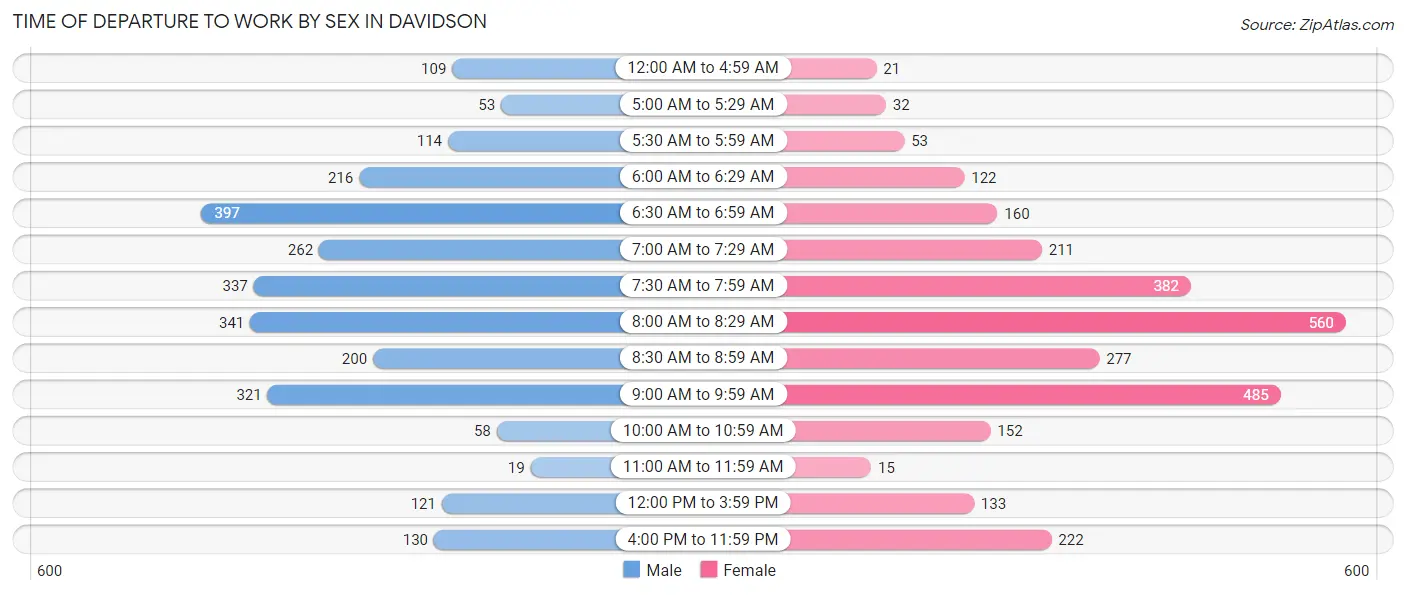
| Time of Departure | Male | Female |
| 12:00 AM to 4:59 AM | 109 (4.1%) | 21 (0.7%) |
| 5:00 AM to 5:29 AM | 53 (2.0%) | 32 (1.1%) |
| 5:30 AM to 5:59 AM | 114 (4.3%) | 53 (1.9%) |
| 6:00 AM to 6:29 AM | 216 (8.1%) | 122 (4.3%) |
| 6:30 AM to 6:59 AM | 397 (14.8%) | 160 (5.7%) |
| 7:00 AM to 7:29 AM | 262 (9.8%) | 211 (7.5%) |
| 7:30 AM to 7:59 AM | 337 (12.6%) | 382 (13.5%) |
| 8:00 AM to 8:29 AM | 341 (12.7%) | 560 (19.8%) |
| 8:30 AM to 8:59 AM | 200 (7.5%) | 277 (9.8%) |
| 9:00 AM to 9:59 AM | 321 (12.0%) | 485 (17.2%) |
| 10:00 AM to 10:59 AM | 58 (2.2%) | 152 (5.4%) |
| 11:00 AM to 11:59 AM | 19 (0.7%) | 15 (0.5%) |
| 12:00 PM to 3:59 PM | 121 (4.5%) | 133 (4.7%) |
| 4:00 PM to 11:59 PM | 130 (4.9%) | 222 (7.9%) |
| Total | 2,678 (100.0%) | 2,825 (100.0%) |
Housing Occupancy in Davidson
Occupancy by Ownership in Davidson
Of the total 5,510 dwellings in Davidson, owner-occupied units account for 4,216 (76.5%), while renter-occupied units make up 1,294 (23.5%).
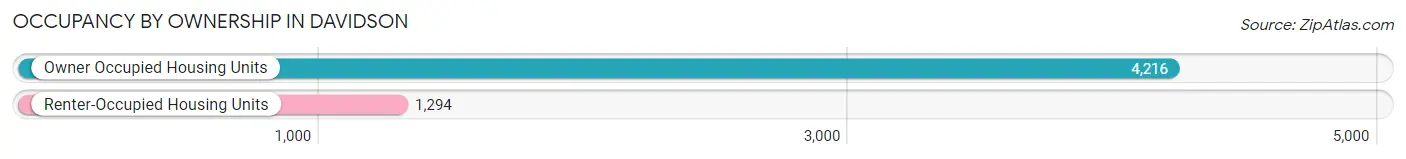
| Occupancy | # Housing Units | % Housing Units |
| Owner Occupied Housing Units | 4,216 | 76.5% |
| Renter-Occupied Housing Units | 1,294 | 23.5% |
| Total Occupied Housing Units | 5,510 | 100.0% |
Occupancy by Household Size in Davidson
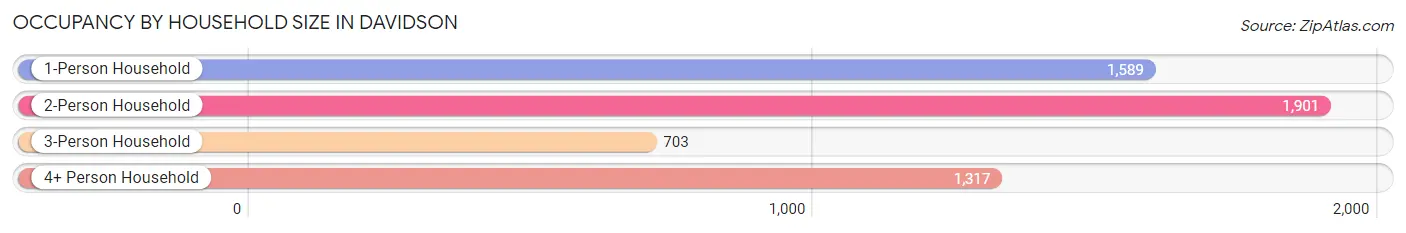
| Household Size | # Housing Units | % Housing Units |
| 1-Person Household | 1,589 | 28.8% |
| 2-Person Household | 1,901 | 34.5% |
| 3-Person Household | 703 | 12.8% |
| 4+ Person Household | 1,317 | 23.9% |
| Total Housing Units | 5,510 | 100.0% |
Occupancy by Ownership by Household Size in Davidson
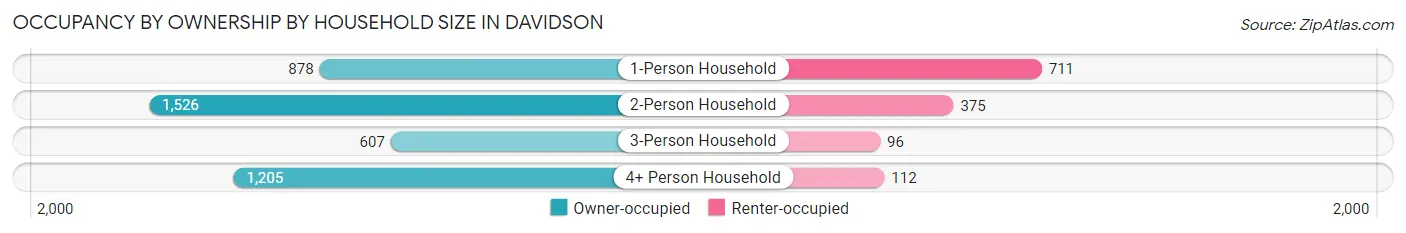
| Household Size | Owner-occupied | Renter-occupied |
| 1-Person Household | 878 (55.2%) | 711 (44.8%) |
| 2-Person Household | 1,526 (80.3%) | 375 (19.7%) |
| 3-Person Household | 607 (86.3%) | 96 (13.7%) |
| 4+ Person Household | 1,205 (91.5%) | 112 (8.5%) |
| Total Housing Units | 4,216 (76.5%) | 1,294 (23.5%) |
Occupancy by Educational Attainment in Davidson
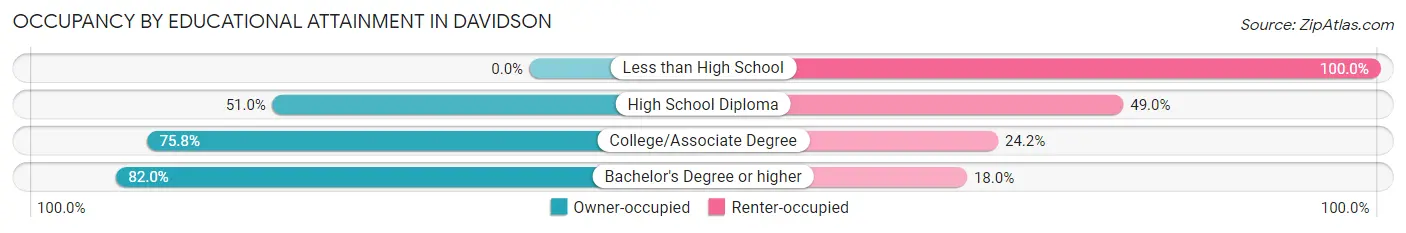
| Household Size | Owner-occupied | Renter-occupied |
| Less than High School | 0 (0.0%) | 107 (100.0%) |
| High School Diploma | 252 (51.0%) | 242 (49.0%) |
| College/Associate Degree | 750 (75.8%) | 239 (24.2%) |
| Bachelor's Degree or higher | 3,214 (82.0%) | 706 (18.0%) |
Occupancy by Age of Householder in Davidson
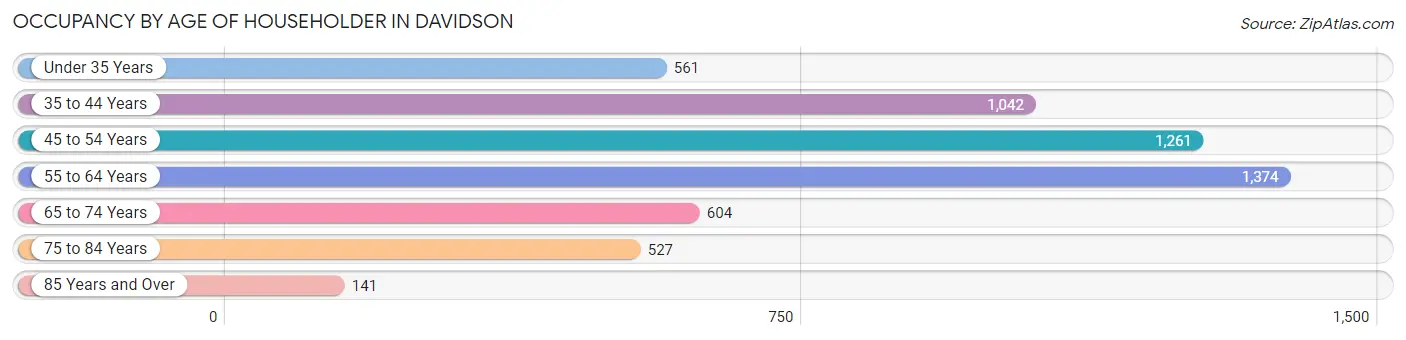
| Age Bracket | # Households | % Households |
| Under 35 Years | 561 | 10.2% |
| 35 to 44 Years | 1,042 | 18.9% |
| 45 to 54 Years | 1,261 | 22.9% |
| 55 to 64 Years | 1,374 | 24.9% |
| 65 to 74 Years | 604 | 11.0% |
| 75 to 84 Years | 527 | 9.6% |
| 85 Years and Over | 141 | 2.6% |
| Total | 5,510 | 100.0% |
Housing Finances in Davidson
Median Income by Occupancy in Davidson
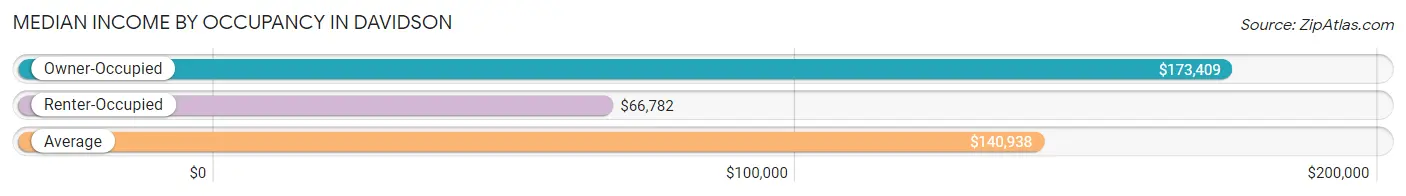
| Occupancy Type | # Households | Median Income |
| Owner-Occupied | 4,216 (76.5%) | $173,409 |
| Renter-Occupied | 1,294 (23.5%) | $66,782 |
| Average | 5,510 (100.0%) | $140,938 |
Occupancy by Householder Income Bracket in Davidson
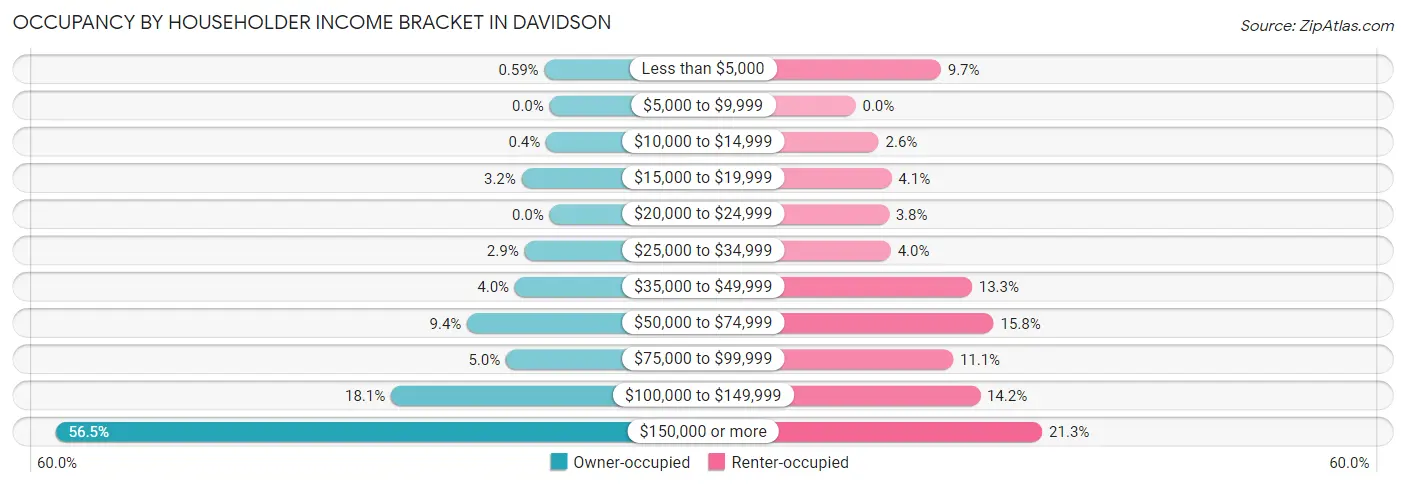
| Income Bracket | Owner-occupied | Renter-occupied |
| Less than $5,000 | 25 (0.6%) | 126 (9.7%) |
| $5,000 to $9,999 | 0 (0.0%) | 0 (0.0%) |
| $10,000 to $14,999 | 17 (0.4%) | 34 (2.6%) |
| $15,000 to $19,999 | 135 (3.2%) | 53 (4.1%) |
| $20,000 to $24,999 | 0 (0.0%) | 49 (3.8%) |
| $25,000 to $34,999 | 121 (2.9%) | 52 (4.0%) |
| $35,000 to $49,999 | 167 (4.0%) | 172 (13.3%) |
| $50,000 to $74,999 | 397 (9.4%) | 204 (15.8%) |
| $75,000 to $99,999 | 210 (5.0%) | 144 (11.1%) |
| $100,000 to $149,999 | 764 (18.1%) | 184 (14.2%) |
| $150,000 or more | 2,380 (56.5%) | 276 (21.3%) |
| Total | 4,216 (100.0%) | 1,294 (100.0%) |
Monthly Housing Cost Tiers in Davidson
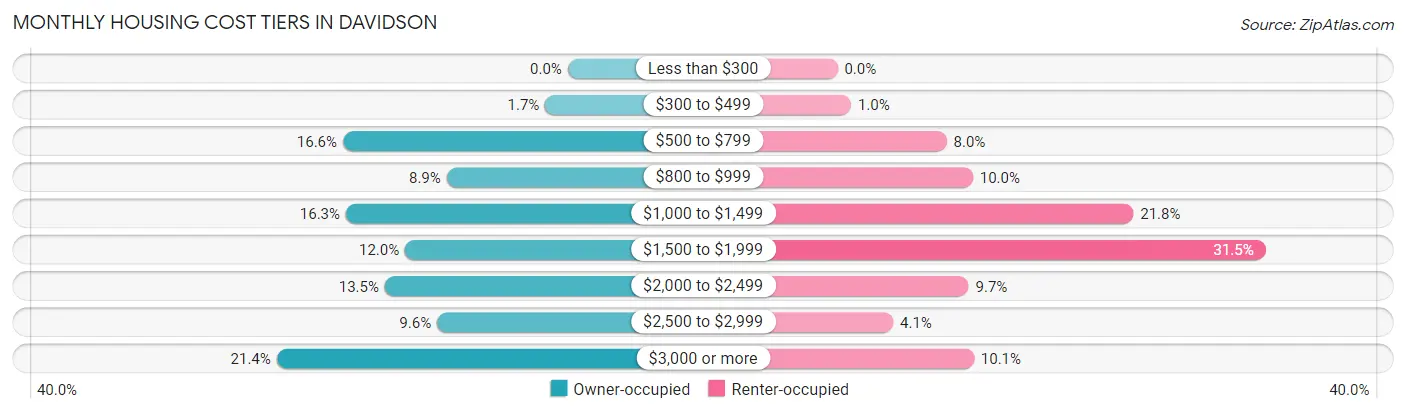
| Monthly Cost | Owner-occupied | Renter-occupied |
| Less than $300 | 0 (0.0%) | 0 (0.0%) |
| $300 to $499 | 70 (1.7%) | 13 (1.0%) |
| $500 to $799 | 698 (16.6%) | 104 (8.0%) |
| $800 to $999 | 376 (8.9%) | 129 (10.0%) |
| $1,000 to $1,499 | 689 (16.3%) | 282 (21.8%) |
| $1,500 to $1,999 | 505 (12.0%) | 408 (31.5%) |
| $2,000 to $2,499 | 568 (13.5%) | 125 (9.7%) |
| $2,500 to $2,999 | 406 (9.6%) | 53 (4.1%) |
| $3,000 or more | 904 (21.4%) | 130 (10.1%) |
| Total | 4,216 (100.0%) | 1,294 (100.0%) |
Physical Housing Characteristics in Davidson
Housing Structures in Davidson
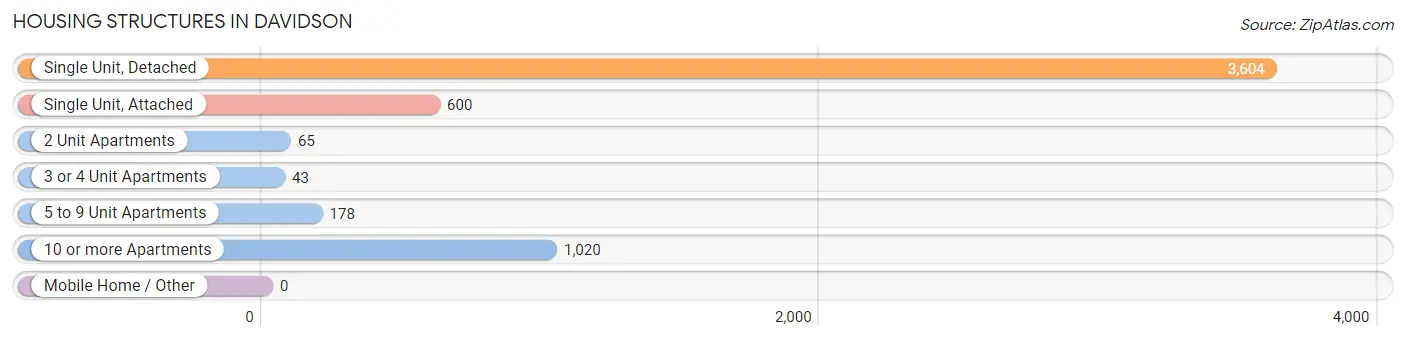
| Structure Type | # Housing Units | % Housing Units |
| Single Unit, Detached | 3,604 | 65.4% |
| Single Unit, Attached | 600 | 10.9% |
| 2 Unit Apartments | 65 | 1.2% |
| 3 or 4 Unit Apartments | 43 | 0.8% |
| 5 to 9 Unit Apartments | 178 | 3.2% |
| 10 or more Apartments | 1,020 | 18.5% |
| Mobile Home / Other | 0 | 0.0% |
| Total | 5,510 | 100.0% |
Housing Structures by Occupancy in Davidson
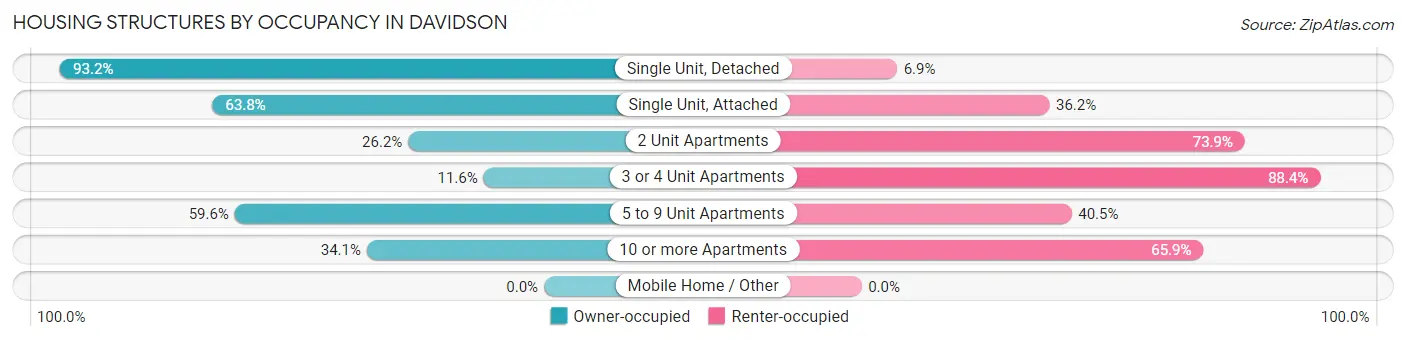
| Structure Type | Owner-occupied | Renter-occupied |
| Single Unit, Detached | 3,357 (93.1%) | 247 (6.9%) |
| Single Unit, Attached | 383 (63.8%) | 217 (36.2%) |
| 2 Unit Apartments | 17 (26.2%) | 48 (73.9%) |
| 3 or 4 Unit Apartments | 5 (11.6%) | 38 (88.4%) |
| 5 to 9 Unit Apartments | 106 (59.6%) | 72 (40.5%) |
| 10 or more Apartments | 348 (34.1%) | 672 (65.9%) |
| Mobile Home / Other | 0 (0.0%) | 0 (0.0%) |
| Total | 4,216 (76.5%) | 1,294 (23.5%) |
Housing Structures by Number of Rooms in Davidson
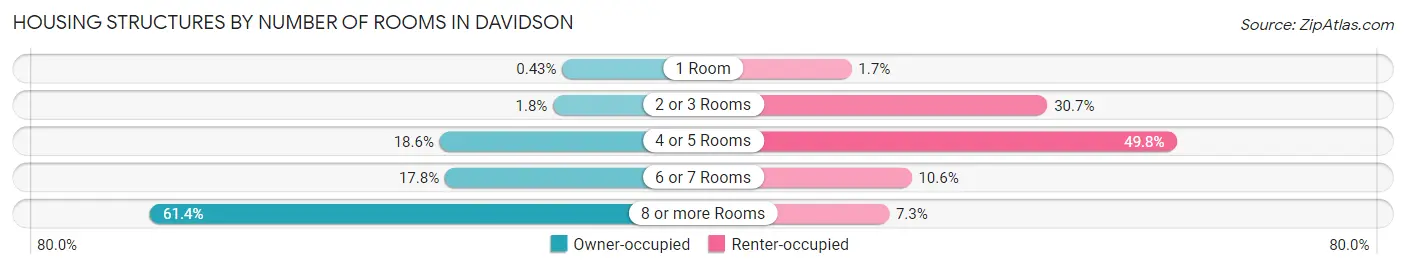
| Number of Rooms | Owner-occupied | Renter-occupied |
| 1 Room | 18 (0.4%) | 22 (1.7%) |
| 2 or 3 Rooms | 75 (1.8%) | 397 (30.7%) |
| 4 or 5 Rooms | 783 (18.6%) | 644 (49.8%) |
| 6 or 7 Rooms | 750 (17.8%) | 137 (10.6%) |
| 8 or more Rooms | 2,590 (61.4%) | 94 (7.3%) |
| Total | 4,216 (100.0%) | 1,294 (100.0%) |
Housing Structure by Heating Type in Davidson
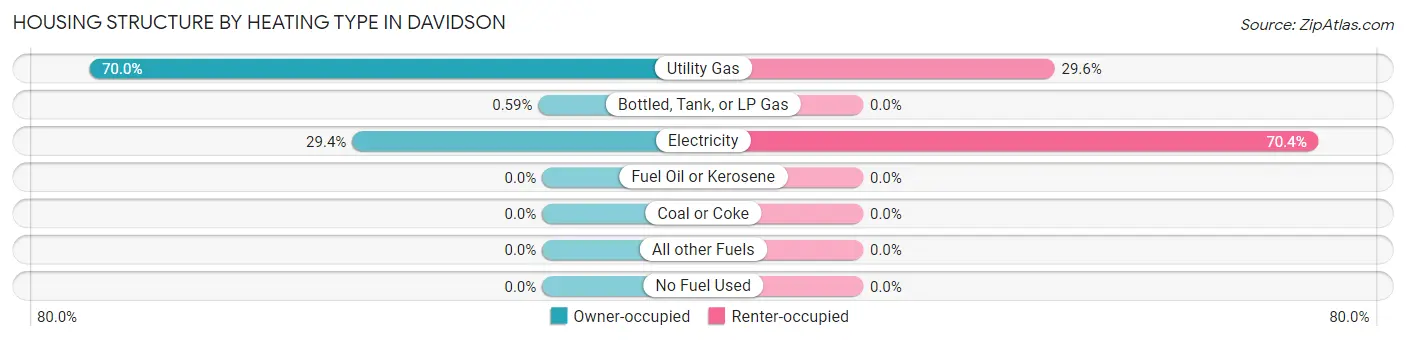
| Heating Type | Owner-occupied | Renter-occupied |
| Utility Gas | 2,953 (70.0%) | 383 (29.6%) |
| Bottled, Tank, or LP Gas | 25 (0.6%) | 0 (0.0%) |
| Electricity | 1,238 (29.4%) | 911 (70.4%) |
| Fuel Oil or Kerosene | 0 (0.0%) | 0 (0.0%) |
| Coal or Coke | 0 (0.0%) | 0 (0.0%) |
| All other Fuels | 0 (0.0%) | 0 (0.0%) |
| No Fuel Used | 0 (0.0%) | 0 (0.0%) |
| Total | 4,216 (100.0%) | 1,294 (100.0%) |
Household Vehicle Usage in Davidson
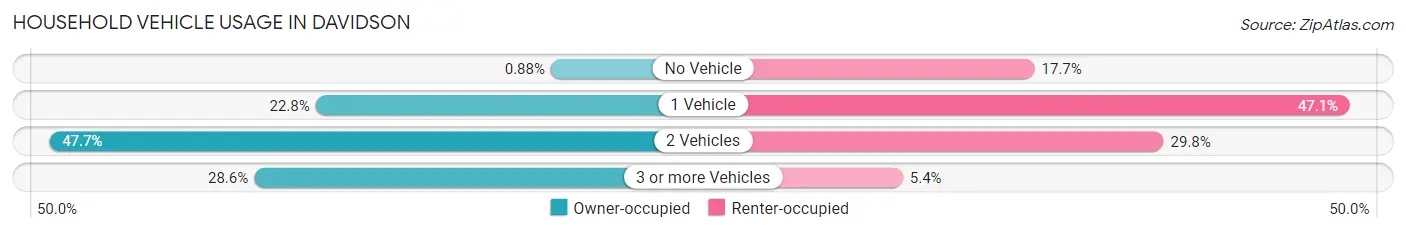
| Vehicles per Household | Owner-occupied | Renter-occupied |
| No Vehicle | 37 (0.9%) | 229 (17.7%) |
| 1 Vehicle | 963 (22.8%) | 610 (47.1%) |
| 2 Vehicles | 2,011 (47.7%) | 385 (29.7%) |
| 3 or more Vehicles | 1,205 (28.6%) | 70 (5.4%) |
| Total | 4,216 (100.0%) | 1,294 (100.0%) |
Real Estate & Mortgages in Davidson
Real Estate and Mortgage Overview in Davidson
| Characteristic | Without Mortgage | With Mortgage |
| Housing Units | 1,302 | 2,914 |
| Median Property Value | $589,200 | $562,200 |
| Median Household Income | $155,625 | $1,724 |
| Monthly Housing Costs | $813 | $884 |
| Real Estate Taxes | $4,651 | $12 |
Property Value by Mortgage Status in Davidson
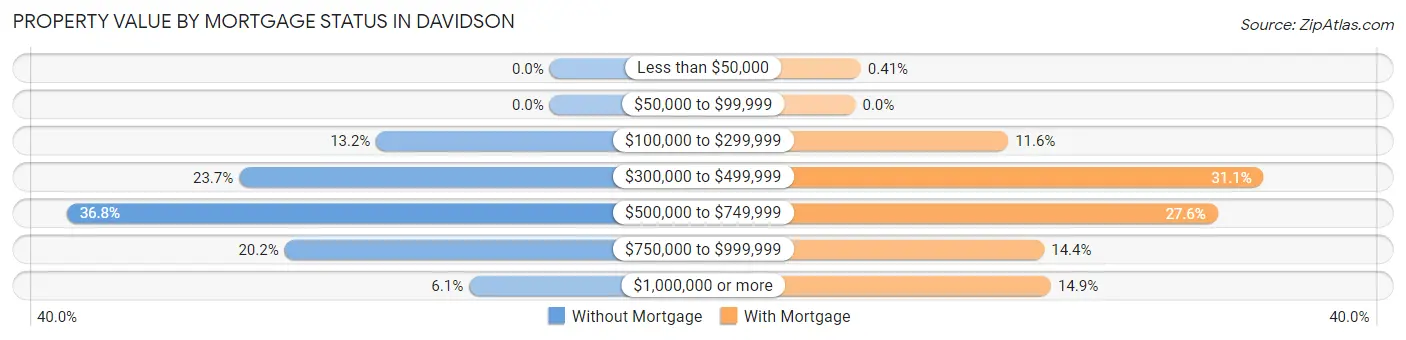
| Property Value | Without Mortgage | With Mortgage |
| Less than $50,000 | 0 (0.0%) | 12 (0.4%) |
| $50,000 to $99,999 | 0 (0.0%) | 0 (0.0%) |
| $100,000 to $299,999 | 172 (13.2%) | 339 (11.6%) |
| $300,000 to $499,999 | 308 (23.7%) | 906 (31.1%) |
| $500,000 to $749,999 | 479 (36.8%) | 804 (27.6%) |
| $750,000 to $999,999 | 263 (20.2%) | 419 (14.4%) |
| $1,000,000 or more | 80 (6.1%) | 434 (14.9%) |
| Total | 1,302 (100.0%) | 2,914 (100.0%) |
Household Income by Mortgage Status in Davidson
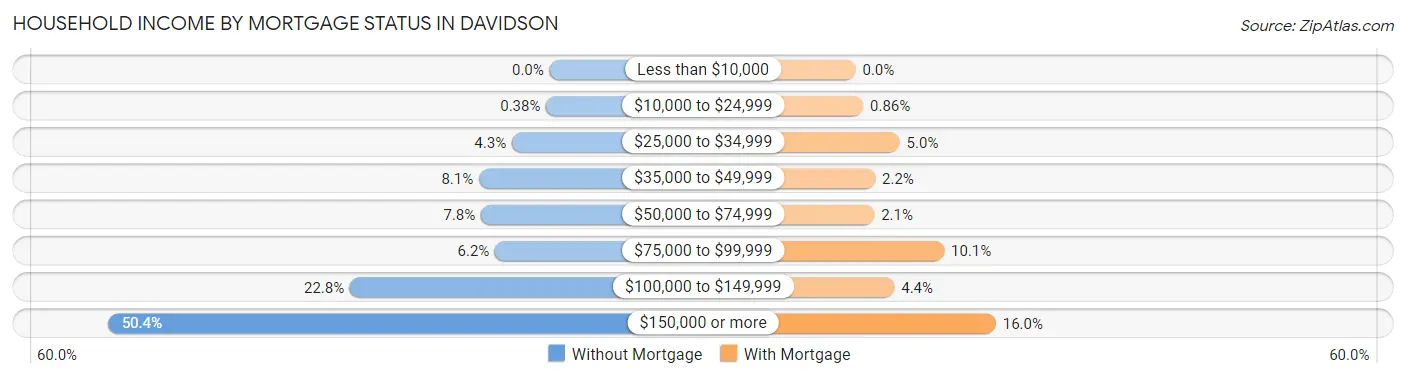
| Household Income | Without Mortgage | With Mortgage |
| Less than $10,000 | 0 (0.0%) | 0 (0.0%) |
| $10,000 to $24,999 | 5 (0.4%) | 25 (0.9%) |
| $25,000 to $34,999 | 56 (4.3%) | 147 (5.0%) |
| $35,000 to $49,999 | 105 (8.1%) | 65 (2.2%) |
| $50,000 to $74,999 | 102 (7.8%) | 62 (2.1%) |
| $75,000 to $99,999 | 81 (6.2%) | 295 (10.1%) |
| $100,000 to $149,999 | 297 (22.8%) | 129 (4.4%) |
| $150,000 or more | 656 (50.4%) | 467 (16.0%) |
| Total | 1,302 (100.0%) | 2,914 (100.0%) |
Property Value to Household Income Ratio in Davidson
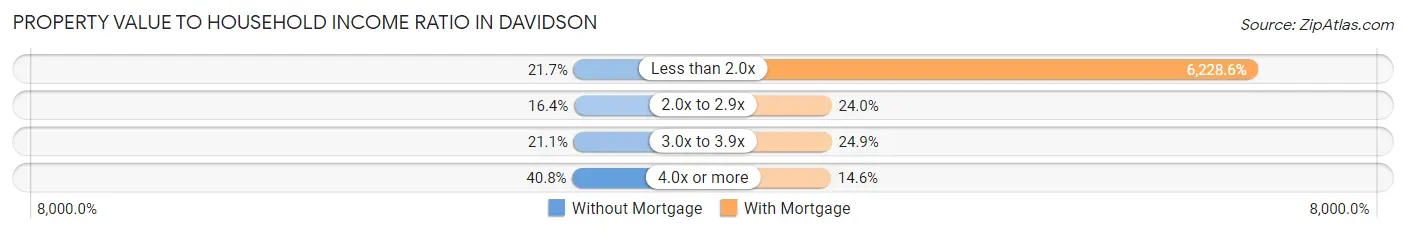
| Value-to-Income Ratio | Without Mortgage | With Mortgage |
| Less than 2.0x | 282 (21.7%) | 181,500 (6,228.5%) |
| 2.0x to 2.9x | 214 (16.4%) | 700 (24.0%) |
| 3.0x to 3.9x | 275 (21.1%) | 725 (24.9%) |
| 4.0x or more | 531 (40.8%) | 426 (14.6%) |
| Total | 1,302 (100.0%) | 2,914 (100.0%) |
Real Estate Taxes by Mortgage Status in Davidson
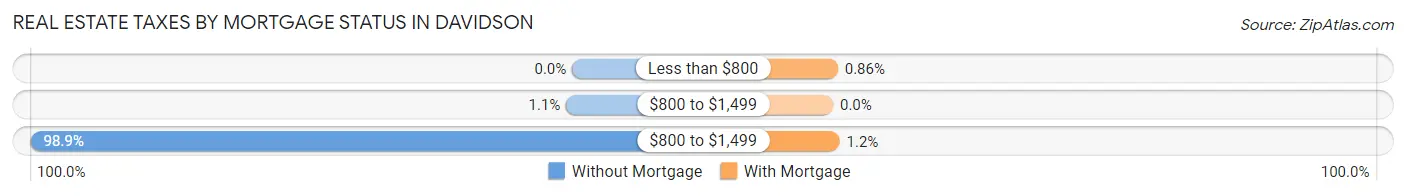
| Property Taxes | Without Mortgage | With Mortgage |
| Less than $800 | 0 (0.0%) | 25 (0.9%) |
| $800 to $1,499 | 14 (1.1%) | 0 (0.0%) |
| $800 to $1,499 | 1,288 (98.9%) | 35 (1.2%) |
| Total | 1,302 (100.0%) | 2,914 (100.0%) |
Health & Disability in Davidson
Health Insurance Coverage by Age in Davidson
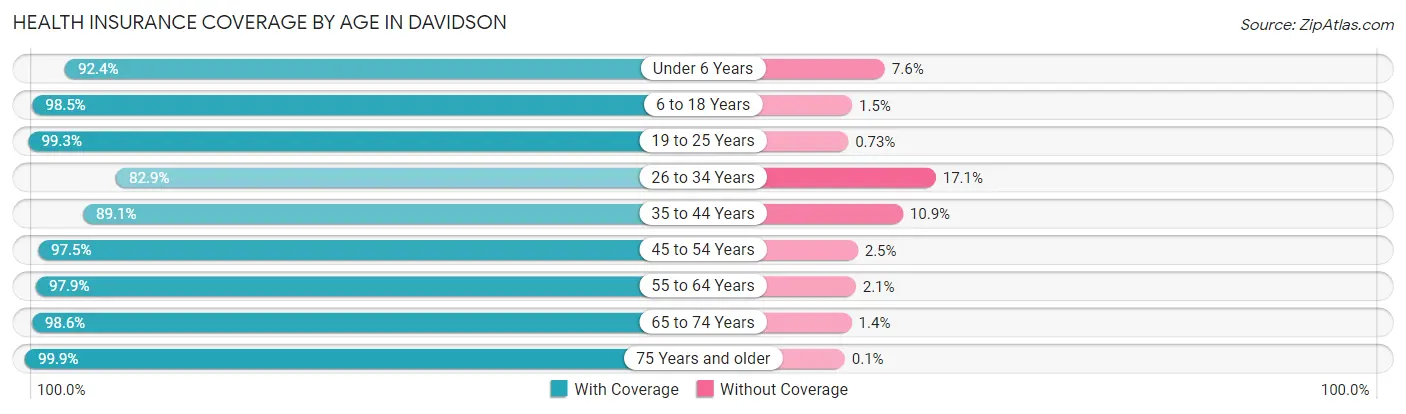
| Age Bracket | With Coverage | Without Coverage |
| Under 6 Years | 672 (92.4%) | 55 (7.6%) |
| 6 to 18 Years | 2,895 (98.5%) | 43 (1.5%) |
| 19 to 25 Years | 2,029 (99.3%) | 15 (0.7%) |
| 26 to 34 Years | 680 (82.9%) | 140 (17.1%) |
| 35 to 44 Years | 1,671 (89.1%) | 205 (10.9%) |
| 45 to 54 Years | 2,279 (97.5%) | 59 (2.5%) |
| 55 to 64 Years | 2,055 (97.9%) | 45 (2.1%) |
| 65 to 74 Years | 1,292 (98.6%) | 18 (1.4%) |
| 75 Years and older | 981 (99.9%) | 1 (0.1%) |
| Total | 14,554 (96.2%) | 581 (3.8%) |
Health Insurance Coverage by Citizenship Status in Davidson
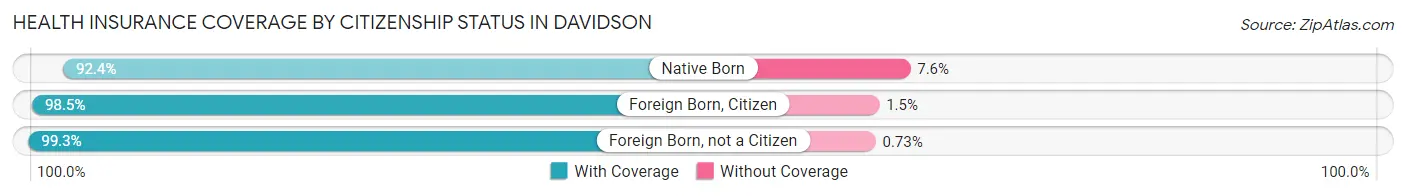
| Citizenship Status | With Coverage | Without Coverage |
| Native Born | 672 (92.4%) | 55 (7.6%) |
| Foreign Born, Citizen | 2,895 (98.5%) | 43 (1.5%) |
| Foreign Born, not a Citizen | 2,029 (99.3%) | 15 (0.7%) |
Health Insurance Coverage by Household Income in Davidson
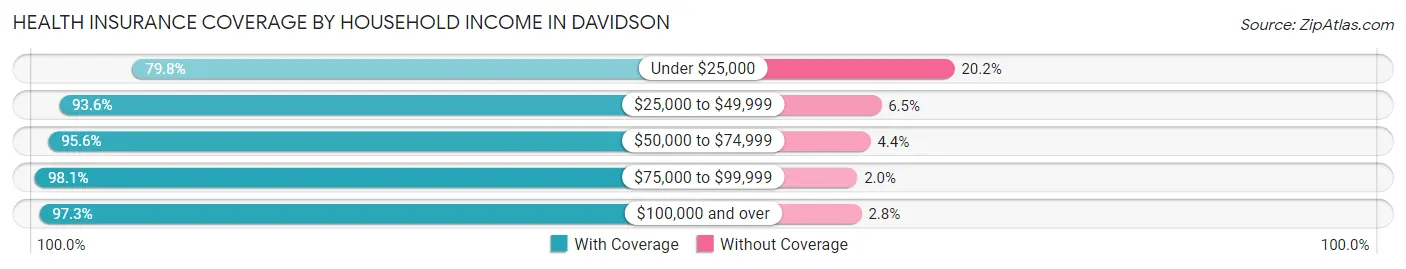
| Household Income | With Coverage | Without Coverage |
| Under $25,000 | 704 (79.8%) | 178 (20.2%) |
| $25,000 to $49,999 | 653 (93.5%) | 45 (6.5%) |
| $50,000 to $74,999 | 1,187 (95.6%) | 55 (4.4%) |
| $75,000 to $99,999 | 652 (98.1%) | 13 (1.9%) |
| $100,000 and over | 9,836 (97.3%) | 278 (2.8%) |
Public vs Private Health Insurance Coverage by Age in Davidson
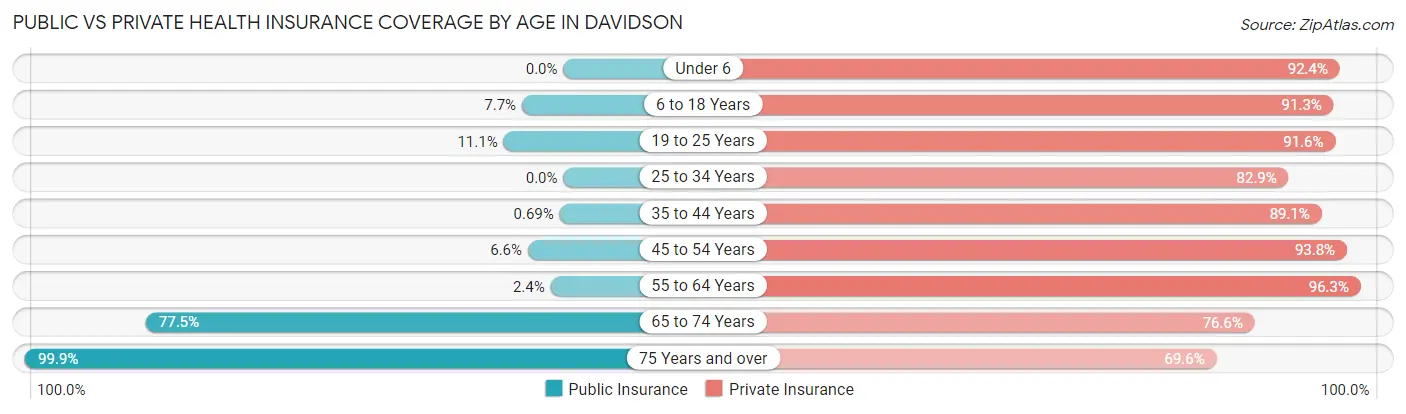
| Age Bracket | Public Insurance | Private Insurance |
| Under 6 | 0 (0.0%) | 672 (92.4%) |
| 6 to 18 Years | 226 (7.7%) | 2,682 (91.3%) |
| 19 to 25 Years | 227 (11.1%) | 1,872 (91.6%) |
| 25 to 34 Years | 0 (0.0%) | 680 (82.9%) |
| 35 to 44 Years | 13 (0.7%) | 1,671 (89.1%) |
| 45 to 54 Years | 154 (6.6%) | 2,192 (93.8%) |
| 55 to 64 Years | 50 (2.4%) | 2,023 (96.3%) |
| 65 to 74 Years | 1,015 (77.5%) | 1,004 (76.6%) |
| 75 Years and over | 981 (99.9%) | 683 (69.6%) |
| Total | 2,666 (17.6%) | 13,479 (89.1%) |
Disability Status by Sex by Age in Davidson
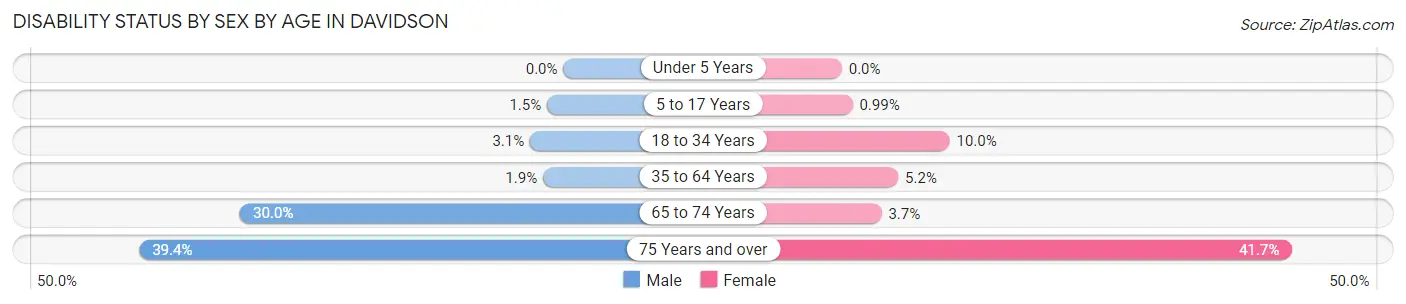
| Age Bracket | Male | Female |
| Under 5 Years | 0 (0.0%) | 0 (0.0%) |
| 5 to 17 Years | 17 (1.5%) | 16 (1.0%) |
| 18 to 34 Years | 51 (3.1%) | 168 (10.0%) |
| 35 to 64 Years | 56 (1.9%) | 175 (5.2%) |
| 65 to 74 Years | 189 (30.0%) | 25 (3.7%) |
| 75 Years and over | 161 (39.4%) | 239 (41.7%) |
Disability Class by Sex by Age in Davidson
Disability Class: Hearing Difficulty
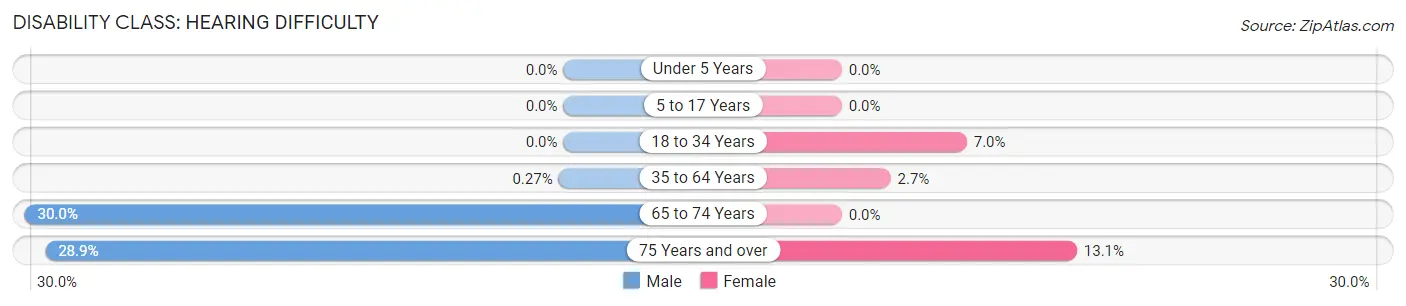
| Age Bracket | Male | Female |
| Under 5 Years | 0 (0.0%) | 0 (0.0%) |
| 5 to 17 Years | 0 (0.0%) | 0 (0.0%) |
| 18 to 34 Years | 0 (0.0%) | 117 (7.0%) |
| 35 to 64 Years | 8 (0.3%) | 91 (2.7%) |
| 65 to 74 Years | 189 (30.0%) | 0 (0.0%) |
| 75 Years and over | 118 (28.8%) | 75 (13.1%) |
Disability Class: Vision Difficulty
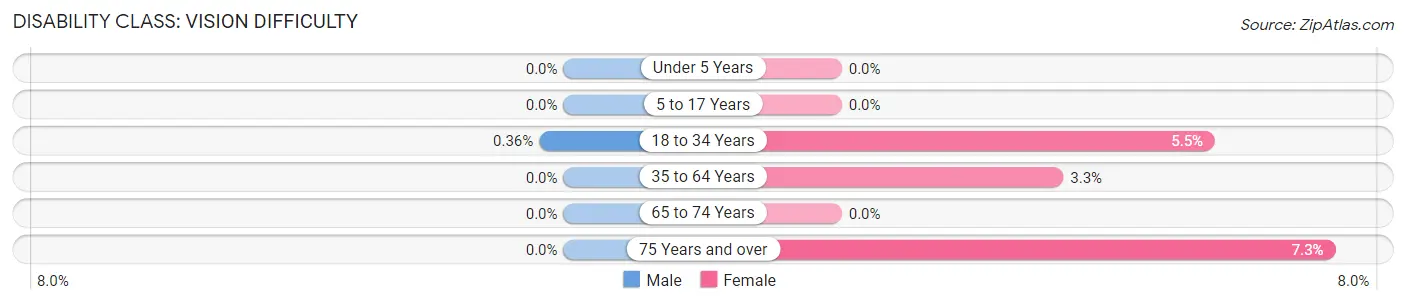
| Age Bracket | Male | Female |
| Under 5 Years | 0 (0.0%) | 0 (0.0%) |
| 5 to 17 Years | 0 (0.0%) | 0 (0.0%) |
| 18 to 34 Years | 6 (0.4%) | 93 (5.5%) |
| 35 to 64 Years | 0 (0.0%) | 110 (3.3%) |
| 65 to 74 Years | 0 (0.0%) | 0 (0.0%) |
| 75 Years and over | 0 (0.0%) | 42 (7.3%) |
Disability Class: Cognitive Difficulty
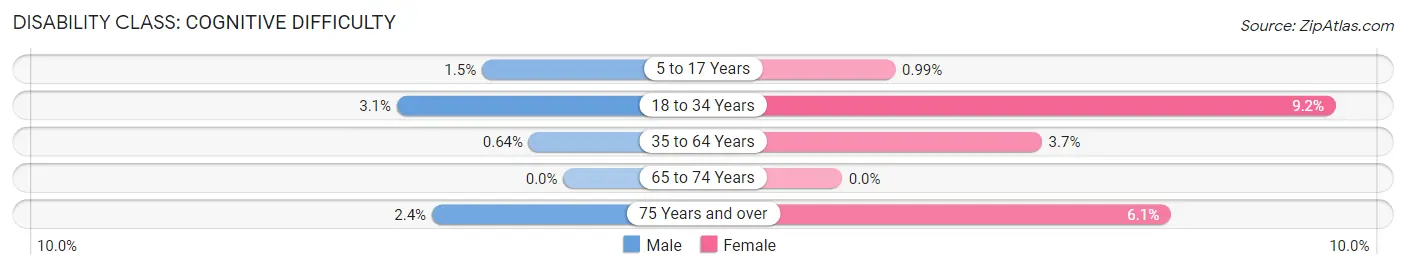
| Age Bracket | Male | Female |
| 5 to 17 Years | 17 (1.5%) | 16 (1.0%) |
| 18 to 34 Years | 51 (3.1%) | 154 (9.2%) |
| 35 to 64 Years | 19 (0.6%) | 124 (3.7%) |
| 65 to 74 Years | 0 (0.0%) | 0 (0.0%) |
| 75 Years and over | 10 (2.4%) | 35 (6.1%) |
Disability Class: Ambulatory Difficulty
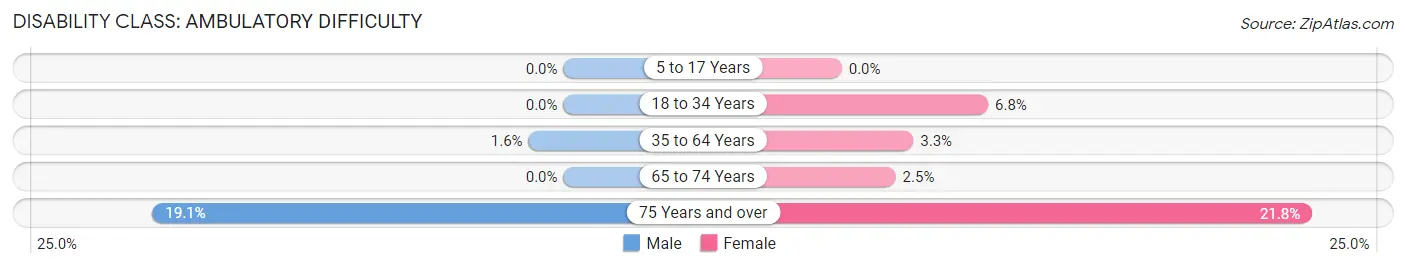
| Age Bracket | Male | Female |
| 5 to 17 Years | 0 (0.0%) | 0 (0.0%) |
| 18 to 34 Years | 0 (0.0%) | 114 (6.8%) |
| 35 to 64 Years | 48 (1.6%) | 111 (3.3%) |
| 65 to 74 Years | 0 (0.0%) | 17 (2.5%) |
| 75 Years and over | 78 (19.1%) | 125 (21.8%) |
Disability Class: Self-Care Difficulty
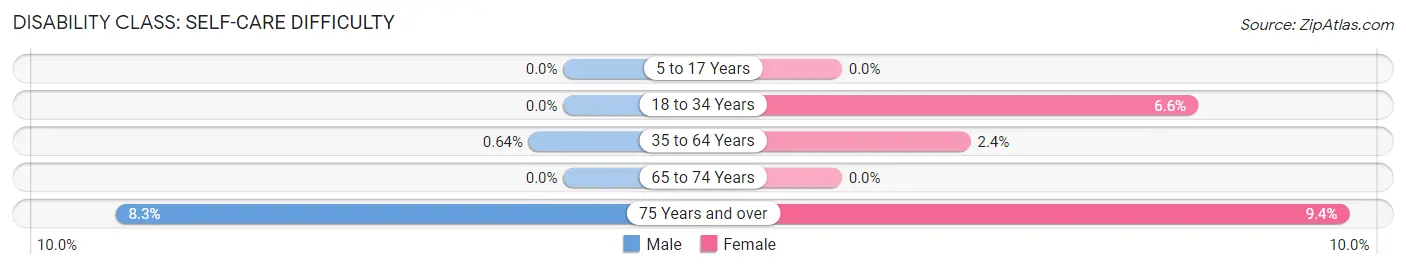
| Age Bracket | Male | Female |
| 5 to 17 Years | 0 (0.0%) | 0 (0.0%) |
| 18 to 34 Years | 0 (0.0%) | 111 (6.6%) |
| 35 to 64 Years | 19 (0.6%) | 80 (2.4%) |
| 65 to 74 Years | 0 (0.0%) | 0 (0.0%) |
| 75 Years and over | 34 (8.3%) | 54 (9.4%) |
Technology Access in Davidson
Computing Device Access in Davidson
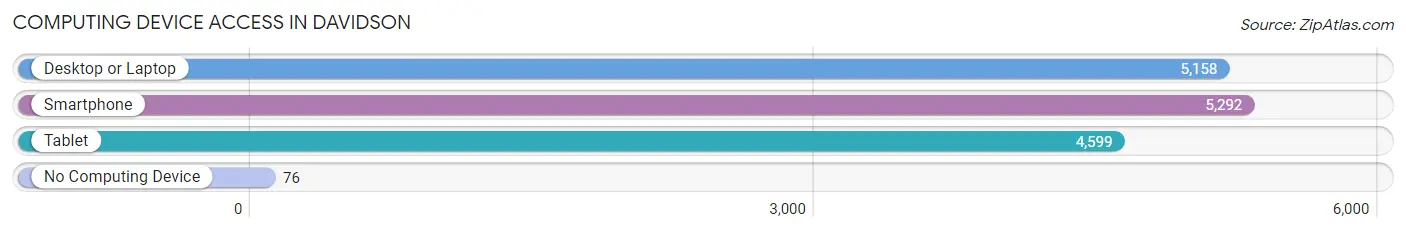
| Device Type | # Households | % Households |
| Desktop or Laptop | 5,158 | 93.6% |
| Smartphone | 5,292 | 96.0% |
| Tablet | 4,599 | 83.5% |
| No Computing Device | 76 | 1.4% |
| Total | 5,510 | 100.0% |
Internet Access in Davidson
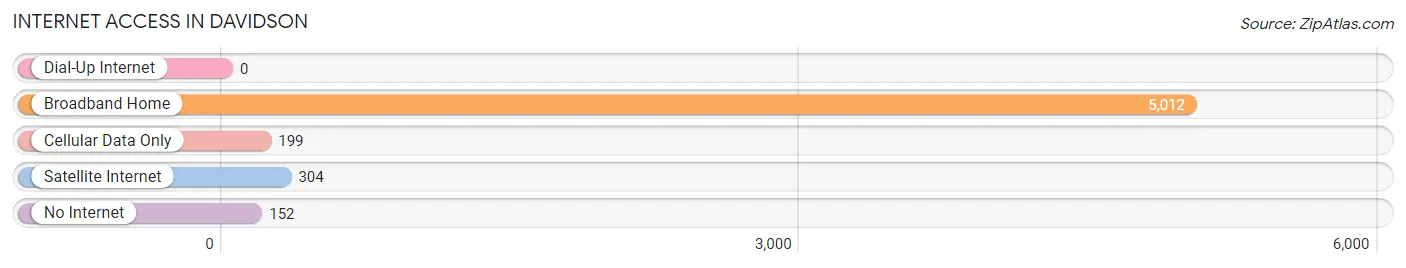
| Internet Type | # Households | % Households |
| Dial-Up Internet | 0 | 0.0% |
| Broadband Home | 5,012 | 91.0% |
| Cellular Data Only | 199 | 3.6% |
| Satellite Internet | 304 | 5.5% |
| No Internet | 152 | 2.8% |
| Total | 5,510 | 100.0% |
Davidson Summary
Davidson, North Carolina is a small town located in Mecklenburg County, just north of Charlotte. It is home to Davidson College, a private liberal arts college, and is part of the Charlotte metropolitan area. The town has a population of 11,564 as of the 2020 census, and is known for its small-town charm and close-knit community.
History
Davidson was founded in 1837 by William Lee Davidson, a Revolutionary War hero and the namesake of the town. The town was originally called Davidson College, after the college that was established in the same year. The college was founded by Presbyterians and was the first college in the state to be founded by a religious denomination.
The town was incorporated in 1879 and was named after the college. The town grew slowly but steadily, and by the early 20th century, it had become a popular summer resort destination for wealthy Charlotteans.
Geography
Davidson is located in Mecklenburg County, just north of Charlotte. It is situated on the Catawba River, and is surrounded by the towns of Cornelius, Huntersville, and Mooresville. The town covers an area of 8.3 square miles, and has a population density of 1,385 people per square mile.
The town is located in the Piedmont region of North Carolina, and is characterized by rolling hills and lush forests. The climate is humid subtropical, with hot, humid summers and mild winters.
Economy
The economy of Davidson is largely driven by the presence of Davidson College. The college is the largest employer in the town, and provides jobs for many of the town's residents. Other major employers in the town include the town government, local businesses, and the Charlotte-Mecklenburg Schools.
The town also has a vibrant tourism industry, with many visitors coming to the town to visit the college and explore the town's historic downtown.
Demographics
As of the 2020 census, the population of Davidson was 11,564. The racial makeup of the town was 79.2% White, 11.2% African American, 5.2% Asian, and 4.4% Hispanic or Latino. The median household income was $90,945, and the median home value was $521,000.
The town is home to a large number of college students, with nearly half of the population being between the ages of 18 and 24. The town also has a large number of retirees, with nearly a quarter of the population being over the age of 65.
Conclusion
Davidson, North Carolina is a small town located in Mecklenburg County, just north of Charlotte. It is home to Davidson College, a private liberal arts college, and is part of the Charlotte metropolitan area. The town has a population of 11,564 as of the 2020 census, and is known for its small-town charm and close-knit community. The economy of Davidson is largely driven by the presence of Davidson College, and the town also has a vibrant tourism industry. The town is home to a large number of college students and retirees, and the racial makeup of the town is 79.2% White, 11.2% African American, 5.2% Asian, and 4.4% Hispanic or Latino.
Common Questions
What is Per Capita Income in Davidson?
Per Capita income in Davidson is $72,914.
What is the Median Family Income in Davidson?
Median Family Income in Davidson is $182,474.
What is the Median Household income in Davidson?
Median Household Income in Davidson is $140,938.
What is Income or Wage Gap in Davidson?
Income or Wage Gap in Davidson is 65.1%.
Women in Davidson earn 34.9 cents for every dollar earned by a man.
What is Inequality or Gini Index in Davidson?
Inequality or Gini Index in Davidson is 0.45.
What is the Total Population of Davidson?
Total Population of Davidson is 15,199.
What is the Total Male Population of Davidson?
Total Male Population of Davidson is 7,057.
What is the Total Female Population of Davidson?
Total Female Population of Davidson is 8,142.
What is the Ratio of Males per 100 Females in Davidson?
There are 86.67 Males per 100 Females in Davidson.
What is the Ratio of Females per 100 Males in Davidson?
There are 115.37 Females per 100 Males in Davidson.
What is the Median Population Age in Davidson?
Median Population Age in Davidson is 39.6 Years.
What is the Average Family Size in Davidson
Average Family Size in Davidson is 3.0 People.
What is the Average Household Size in Davidson
Average Household Size in Davidson is 2.5 People.
How Large is the Labor Force in Davidson?
There are 7,607 People in the Labor Forcein in Davidson.
What is the Percentage of People in the Labor Force in Davidson?
61.5% of People are in the Labor Force in Davidson.
What is the Unemployment Rate in Davidson?
Unemployment Rate in Davidson is 2.4%.