Butner, NC Map & Demographics
Butner Map
Butner Overview
$24,658
PER CAPITA INCOME
$82,039
AVG FAMILY INCOME
$68,604
AVG HOUSEHOLD INCOME
6.8%
WAGE / INCOME GAP [ % ]
93.2¢/ $1
WAGE / INCOME GAP [ $ ]
0.37
INEQUALITY / GINI INDEX
8,374
TOTAL POPULATION
4,614
MALE POPULATION
3,760
FEMALE POPULATION
122.71
MALES / 100 FEMALES
81.49
FEMALES / 100 MALES
41.2
MEDIAN AGE
3.4
AVG FAMILY SIZE
2.9
AVG HOUSEHOLD SIZE
3,239
LABOR FORCE [ PEOPLE ]
48.0%
PERCENT IN LABOR FORCE
6.1%
UNEMPLOYMENT RATE
Butner Zip Codes
Butner Area Codes
Income in Butner
Income Overview in Butner
Per Capita Income in Butner is $24,658, while median incomes of families and households are $82,039 and $68,604 respectively.
| Characteristic | Number | Measure |
| Per Capita Income | 8,374 | $24,658 |
| Median Family Income | 1,755 | $82,039 |
| Mean Family Income | 1,755 | $89,716 |
| Median Household Income | 2,343 | $68,604 |
| Mean Household Income | 2,343 | $80,238 |
| Income Deficit | 1,755 | $0 |
| Wage / Income Gap (%) | 8,374 | 6.80% |
| Wage / Income Gap ($) | 8,374 | 93.20¢ per $1 |
| Gini / Inequality Index | 8,374 | 0.37 |
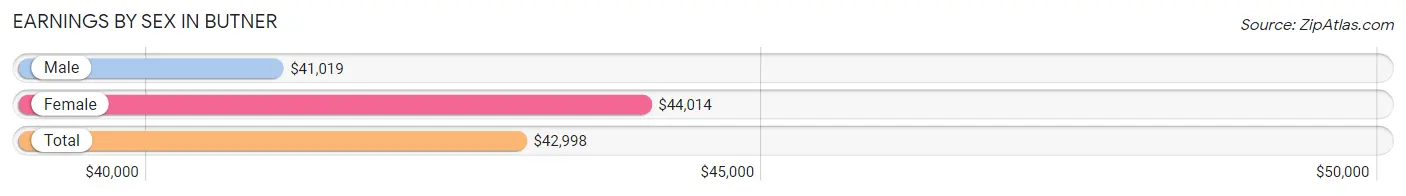
Earnings by Sex in Butner
Average Earnings in Butner are $42,998, $41,019 for men and $44,014 for women, a difference of 6.8%.
| Sex | Number | Average Earnings |
| Male | 1,914 (53.5%) | $41,019 |
| Female | 1,661 (46.5%) | $44,014 |
| Total | 3,575 (100.0%) | $42,998 |
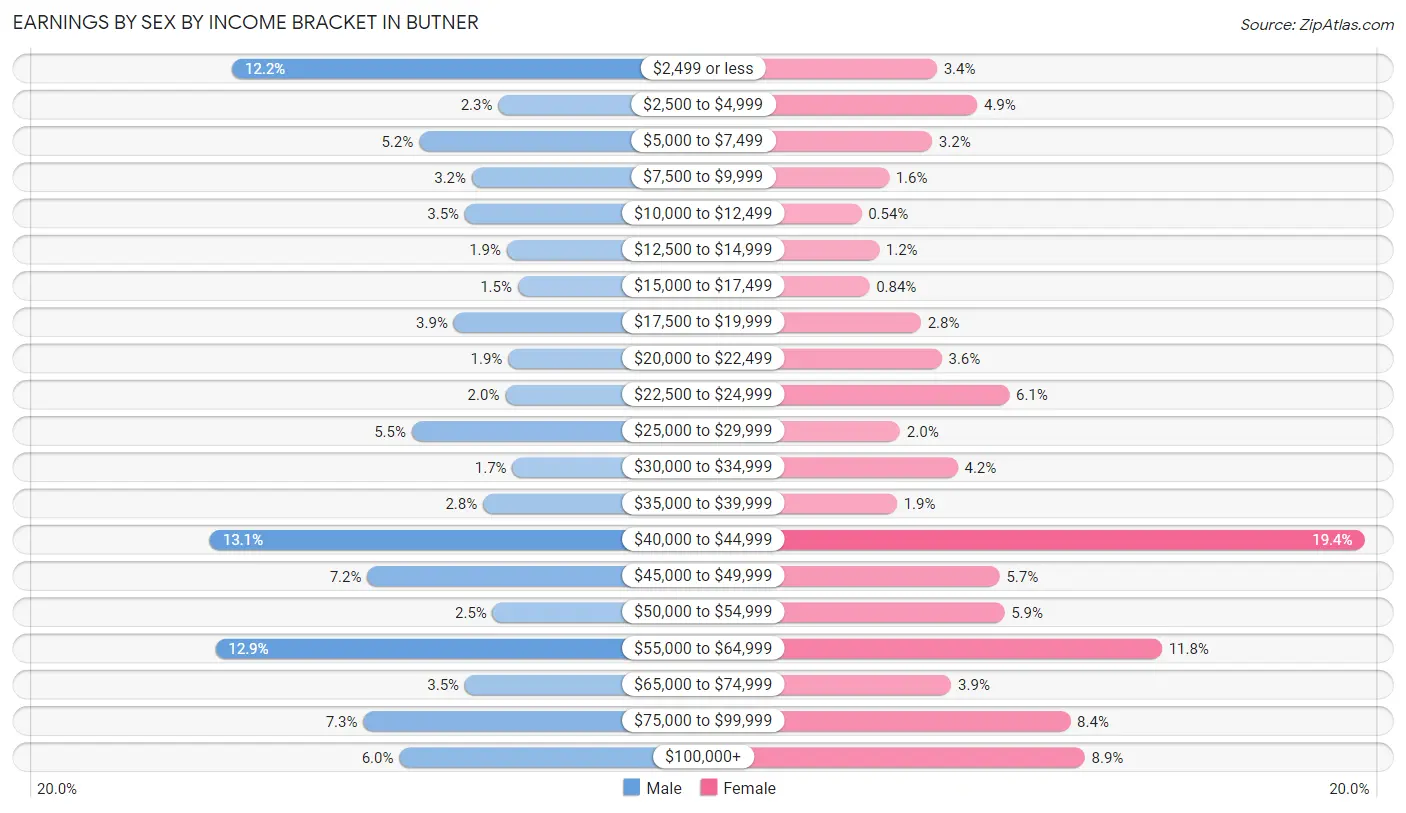
Earnings by Sex by Income Bracket in Butner
The most common earnings brackets in Butner are $40,000 to $44,999 for men (250 | 13.1%) and $40,000 to $44,999 for women (322 | 19.4%).
| Income | Male | Female |
| $2,499 or less | 234 (12.2%) | 56 (3.4%) |
| $2,500 to $4,999 | 43 (2.2%) | 81 (4.9%) |
| $5,000 to $7,499 | 100 (5.2%) | 53 (3.2%) |
| $7,500 to $9,999 | 62 (3.2%) | 26 (1.6%) |
| $10,000 to $12,499 | 67 (3.5%) | 9 (0.5%) |
| $12,500 to $14,999 | 37 (1.9%) | 20 (1.2%) |
| $15,000 to $17,499 | 29 (1.5%) | 14 (0.8%) |
| $17,500 to $19,999 | 75 (3.9%) | 46 (2.8%) |
| $20,000 to $22,499 | 36 (1.9%) | 59 (3.5%) |
| $22,500 to $24,999 | 38 (2.0%) | 101 (6.1%) |
| $25,000 to $29,999 | 105 (5.5%) | 33 (2.0%) |
| $30,000 to $34,999 | 33 (1.7%) | 69 (4.2%) |
| $35,000 to $39,999 | 54 (2.8%) | 31 (1.9%) |
| $40,000 to $44,999 | 250 (13.1%) | 322 (19.4%) |
| $45,000 to $49,999 | 137 (7.2%) | 95 (5.7%) |
| $50,000 to $54,999 | 47 (2.5%) | 98 (5.9%) |
| $55,000 to $64,999 | 246 (12.9%) | 196 (11.8%) |
| $65,000 to $74,999 | 67 (3.5%) | 65 (3.9%) |
| $75,000 to $99,999 | 140 (7.3%) | 139 (8.4%) |
| $100,000+ | 114 (6.0%) | 148 (8.9%) |
| Total | 1,914 (100.0%) | 1,661 (100.0%) |
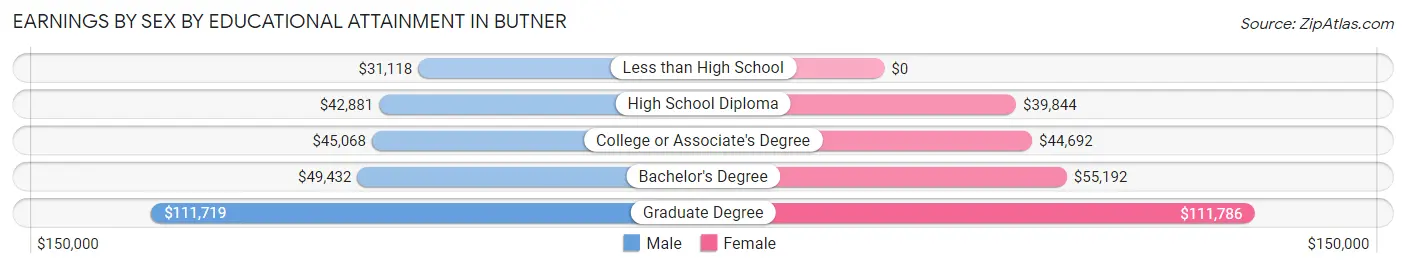
Earnings by Sex by Educational Attainment in Butner
Average earnings in Butner are $42,940 for men and $45,625 for women, a difference of 5.9%. Men with an educational attainment of graduate degree enjoy the highest average annual earnings of $111,719, while those with less than high school education earn the least with $31,118. Women with an educational attainment of graduate degree earn the most with the average annual earnings of $111,786, while those with high school diploma education have the smallest earnings of $39,844.
| Educational Attainment | Male Income | Female Income |
| Less than High School | $31,118 | $0 |
| High School Diploma | $42,881 | $39,844 |
| College or Associate's Degree | $45,068 | $44,692 |
| Bachelor's Degree | $49,432 | $55,192 |
| Graduate Degree | $111,719 | $111,786 |
| Total | $42,940 | $45,625 |
Family Income in Butner
Family Income Brackets in Butner
According to the Butner family income data, there are 377 families falling into the $75,000 to $99,999 income range, which is the most common income bracket and makes up 21.5% of all families. Conversely, the $10,000 to $14,999 income bracket is the least frequent group with only 12 families (0.7%) belonging to this category.
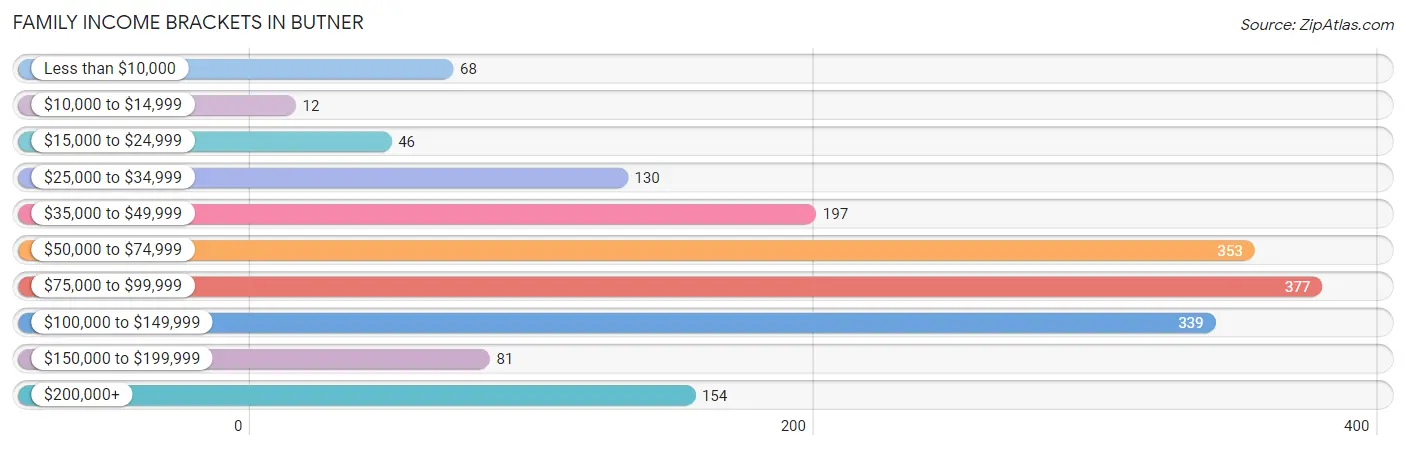
| Income Bracket | # Families | % Families |
| Less than $10,000 | 68 | 3.9% |
| $10,000 to $14,999 | 12 | 0.7% |
| $15,000 to $24,999 | 46 | 2.6% |
| $25,000 to $34,999 | 130 | 7.4% |
| $35,000 to $49,999 | 197 | 11.2% |
| $50,000 to $74,999 | 353 | 20.1% |
| $75,000 to $99,999 | 377 | 21.5% |
| $100,000 to $149,999 | 339 | 19.3% |
| $150,000 to $199,999 | 81 | 4.6% |
| $200,000+ | 154 | 8.8% |
Family Income by Famaliy Size in Butner
3-person families (480 | 27.4%) account for the highest median family income in Butner with $105,948 per family, while 3-person families (480 | 27.4%) have the highest median income of $35,316 per family member.
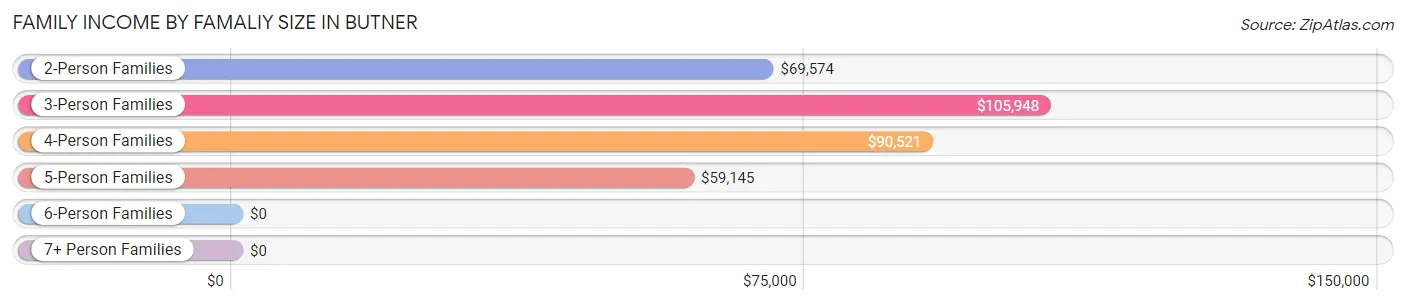
| Income Bracket | # Families | Median Income |
| 2-Person Families | 798 (45.5%) | $69,574 |
| 3-Person Families | 480 (27.4%) | $105,948 |
| 4-Person Families | 361 (20.6%) | $90,521 |
| 5-Person Families | 59 (3.4%) | $59,145 |
| 6-Person Families | 49 (2.8%) | $0 |
| 7+ Person Families | 8 (0.5%) | $0 |
| Total | 1,755 (100.0%) | $82,039 |
Family Income by Number of Earners in Butner
The median family income in Butner is $82,039, with families comprising 2 earners (949) having the highest median family income of $101,641, while families with 1 earner (403) have the lowest median family income of $48,813, accounting for 54.1% and 23.0% of families, respectively.
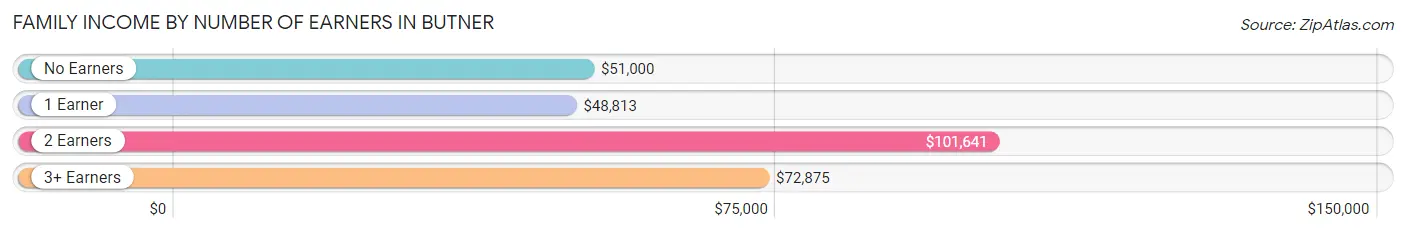
| Number of Earners | # Families | Median Income |
| No Earners | 324 (18.5%) | $51,000 |
| 1 Earner | 403 (23.0%) | $48,813 |
| 2 Earners | 949 (54.1%) | $101,641 |
| 3+ Earners | 79 (4.5%) | $72,875 |
| Total | 1,755 (100.0%) | $82,039 |
Household Income in Butner
Household Income Brackets in Butner
With 530 households falling in the category, the $50,000 to $74,999 income range is the most frequent in Butner, accounting for 22.6% of all households. In contrast, only 37 households (1.6%) fall into the $10,000 to $14,999 income bracket, making it the least populous group.
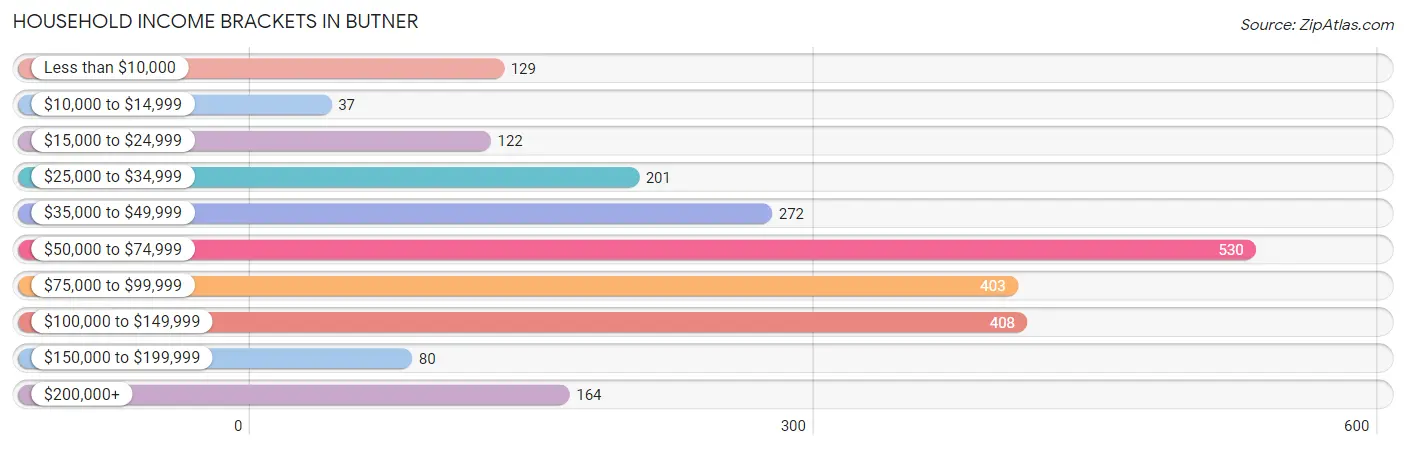
| Income Bracket | # Households | % Households |
| Less than $10,000 | 129 | 5.5% |
| $10,000 to $14,999 | 37 | 1.6% |
| $15,000 to $24,999 | 122 | 5.2% |
| $25,000 to $34,999 | 201 | 8.6% |
| $35,000 to $49,999 | 272 | 11.6% |
| $50,000 to $74,999 | 530 | 22.6% |
| $75,000 to $99,999 | 403 | 17.2% |
| $100,000 to $149,999 | 408 | 17.4% |
| $150,000 to $199,999 | 80 | 3.4% |
| $200,000+ | 164 | 7.0% |
Household Income by Householder Age in Butner
The median household income in Butner is $68,604, with the highest median household income of $85,742 found in the 25 to 44 years age bracket for the primary householder. A total of 767 households (32.7%) fall into this category. Meanwhile, the 15 to 24 years age bracket for the primary householder has the lowest median household income of $0, with 45 households (1.9%) in this group.
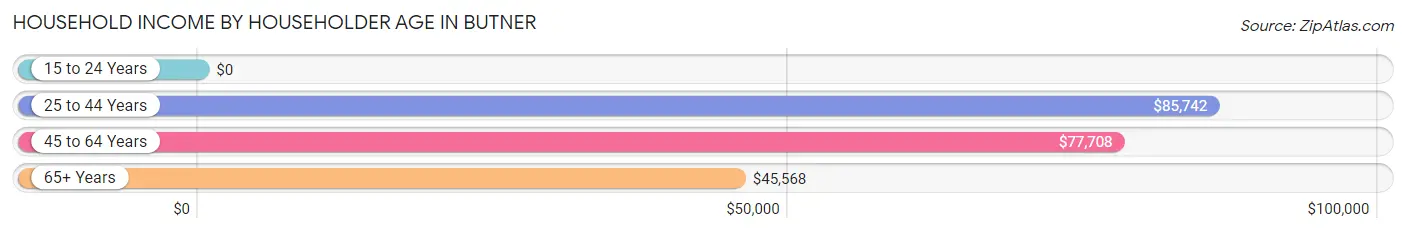
| Income Bracket | # Households | Median Income |
| 15 to 24 Years | 45 (1.9%) | $0 |
| 25 to 44 Years | 767 (32.7%) | $85,742 |
| 45 to 64 Years | 913 (39.0%) | $77,708 |
| 65+ Years | 618 (26.4%) | $45,568 |
| Total | 2,343 (100.0%) | $68,604 |
Poverty in Butner
Income Below Poverty by Sex and Age in Butner
With 13.3% poverty level for males and 17.4% for females among the residents of Butner, 5 year old males and 6 to 11 year old females are the most vulnerable to poverty, with 5 males (29.4%) and 109 females (34.1%) in their respective age groups living below the poverty level.
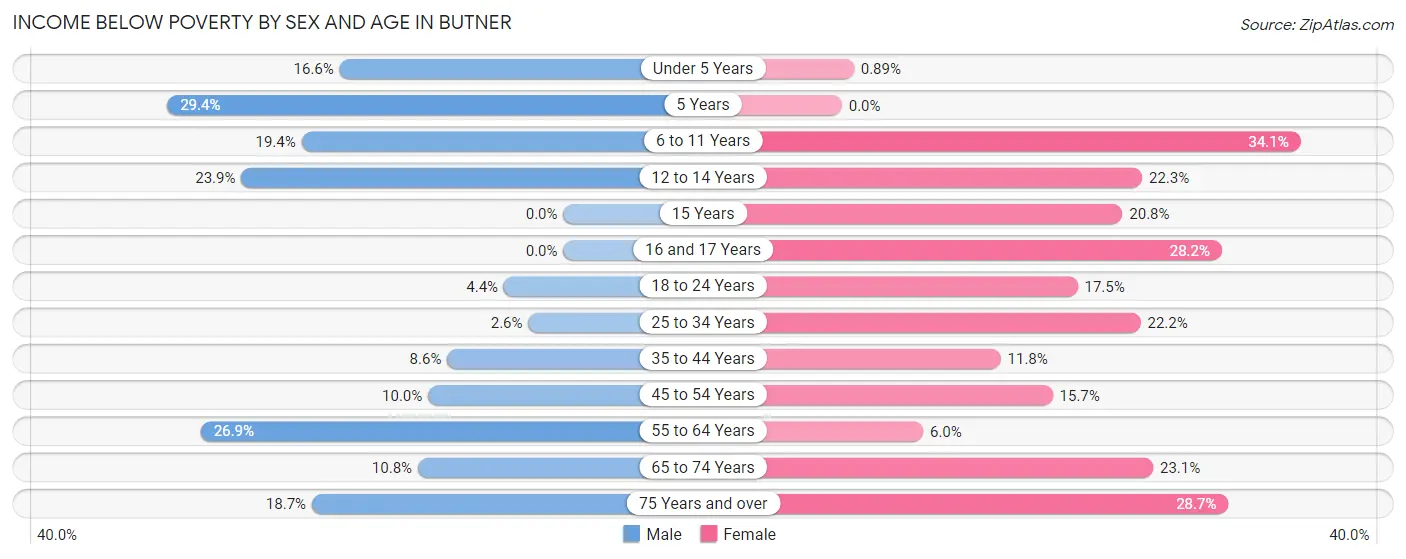
| Age Bracket | Male | Female |
| Under 5 Years | 52 (16.6%) | 2 (0.9%) |
| 5 Years | 5 (29.4%) | 0 (0.0%) |
| 6 to 11 Years | 63 (19.4%) | 109 (34.1%) |
| 12 to 14 Years | 22 (23.9%) | 37 (22.3%) |
| 15 Years | 0 (0.0%) | 5 (20.8%) |
| 16 and 17 Years | 0 (0.0%) | 11 (28.2%) |
| 18 to 24 Years | 6 (4.4%) | 42 (17.5%) |
| 25 to 34 Years | 9 (2.6%) | 114 (22.2%) |
| 35 to 44 Years | 50 (8.6%) | 58 (11.8%) |
| 45 to 54 Years | 49 (10.0%) | 67 (15.7%) |
| 55 to 64 Years | 130 (26.9%) | 34 (6.0%) |
| 65 to 74 Years | 39 (10.8%) | 101 (23.1%) |
| 75 Years and over | 31 (18.7%) | 70 (28.7%) |
| Total | 456 (13.3%) | 650 (17.4%) |
Income Above Poverty by Sex and Age in Butner
According to the poverty statistics in Butner, males aged 15 years and females aged 5 years are the age groups that are most secure financially, with 100.0% of males and 100.0% of females in these age groups living above the poverty line.
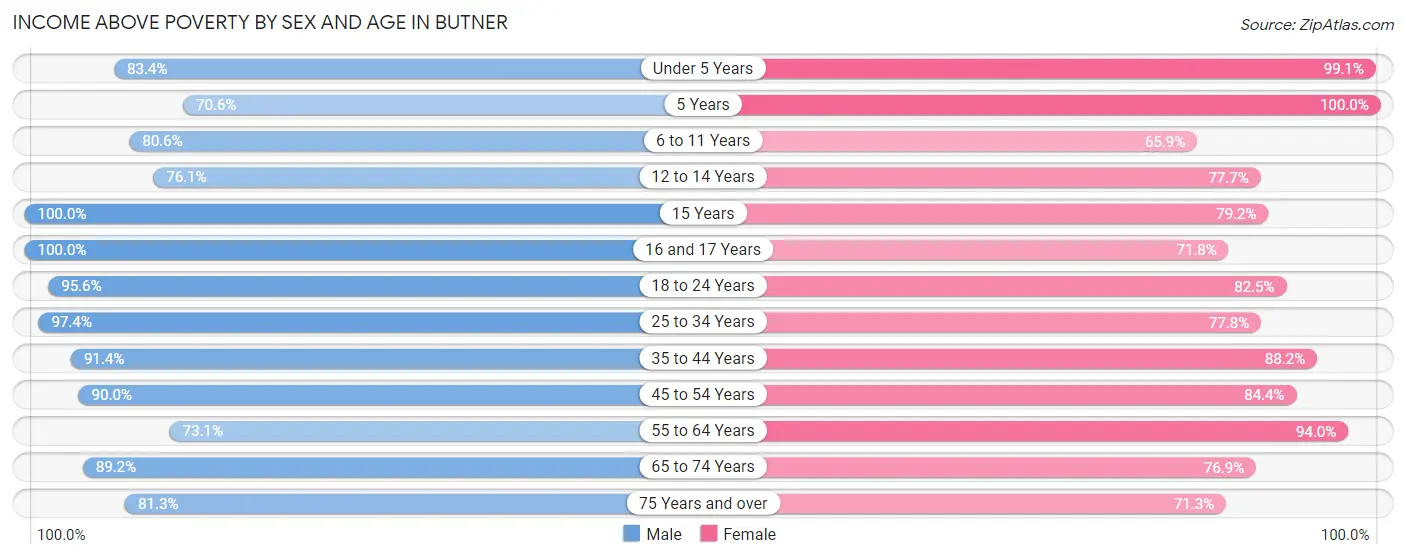
| Age Bracket | Male | Female |
| Under 5 Years | 261 (83.4%) | 222 (99.1%) |
| 5 Years | 12 (70.6%) | 36 (100.0%) |
| 6 to 11 Years | 261 (80.6%) | 211 (65.9%) |
| 12 to 14 Years | 70 (76.1%) | 129 (77.7%) |
| 15 Years | 68 (100.0%) | 19 (79.2%) |
| 16 and 17 Years | 61 (100.0%) | 28 (71.8%) |
| 18 to 24 Years | 130 (95.6%) | 198 (82.5%) |
| 25 to 34 Years | 337 (97.4%) | 400 (77.8%) |
| 35 to 44 Years | 530 (91.4%) | 434 (88.2%) |
| 45 to 54 Years | 439 (90.0%) | 361 (84.4%) |
| 55 to 64 Years | 353 (73.1%) | 530 (94.0%) |
| 65 to 74 Years | 322 (89.2%) | 336 (76.9%) |
| 75 Years and over | 135 (81.3%) | 174 (71.3%) |
| Total | 2,979 (86.7%) | 3,078 (82.6%) |
Income Below Poverty Among Married-Couple Families in Butner
The poverty statistics for married-couple families in Butner show that 2.1% or 27 of the total 1,255 families live below the poverty line. Families with 3 or 4 children have the highest poverty rate of 13.2%, comprising of 9 families. On the other hand, families with 5 or more children have the lowest poverty rate of 0.0%, which includes 0 families.
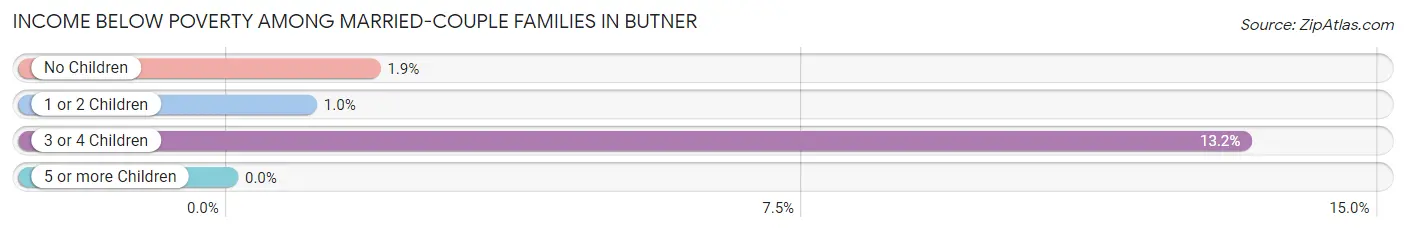
| Children | Above Poverty | Below Poverty |
| No Children | 685 (98.1%) | 13 (1.9%) |
| 1 or 2 Children | 480 (99.0%) | 5 (1.0%) |
| 3 or 4 Children | 59 (86.8%) | 9 (13.2%) |
| 5 or more Children | 4 (100.0%) | 0 (0.0%) |
| Total | 1,228 (97.9%) | 27 (2.1%) |
Income Below Poverty Among Single-Parent Households in Butner
According to the poverty data in Butner, 33.3% or 26 single-father households and 19.0% or 80 single-mother households are living below the poverty line. Among single-father households, those with 1 or 2 children have the highest poverty rate, with 20 households (83.3%) experiencing poverty. Likewise, among single-mother households, those with 5 or more children have the highest poverty rate, with 4 households (100.0%) falling below the poverty line.
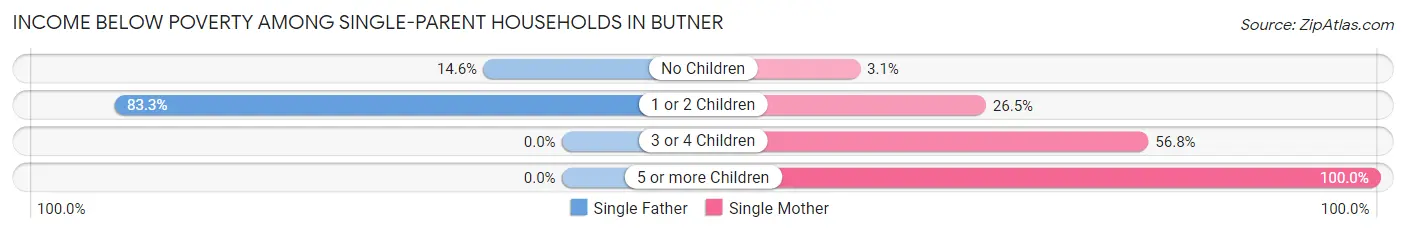
| Children | Single Father | Single Mother |
| No Children | 6 (14.6%) | 6 (3.1%) |
| 1 or 2 Children | 20 (83.3%) | 49 (26.5%) |
| 3 or 4 Children | 0 (0.0%) | 21 (56.8%) |
| 5 or more Children | 0 (0.0%) | 4 (100.0%) |
| Total | 26 (33.3%) | 80 (19.0%) |
Income Below Poverty Among Married-Couple vs Single-Parent Households in Butner
The poverty data for Butner shows that 27 of the married-couple family households (2.1%) and 106 of the single-parent households (21.2%) are living below the poverty level. Within the married-couple family households, those with 3 or 4 children have the highest poverty rate, with 9 households (13.2%) falling below the poverty line. Among the single-parent households, those with 5 or more children have the highest poverty rate, with 4 household (100.0%) living below poverty.
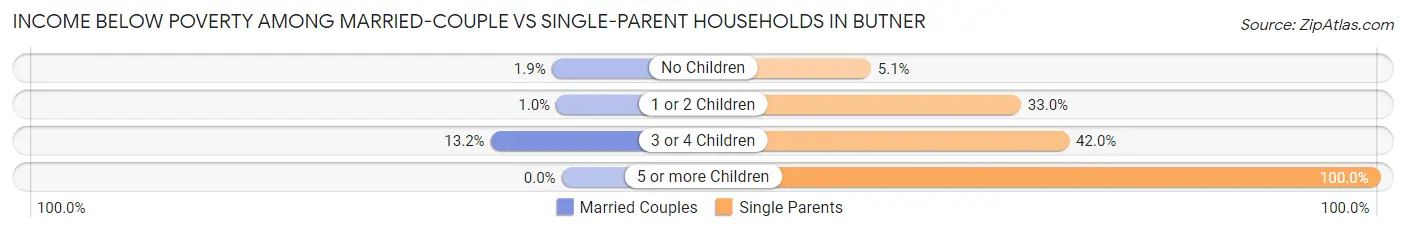
| Children | Married-Couple Families | Single-Parent Households |
| No Children | 13 (1.9%) | 12 (5.1%) |
| 1 or 2 Children | 5 (1.0%) | 69 (33.0%) |
| 3 or 4 Children | 9 (13.2%) | 21 (42.0%) |
| 5 or more Children | 0 (0.0%) | 4 (100.0%) |
| Total | 27 (2.1%) | 106 (21.2%) |
Race in Butner
The most populous races in Butner are White / Caucasian (4,002 | 47.8%), Black / African American (2,883 | 34.4%), and Hispanic or Latino (1,570 | 18.8%).
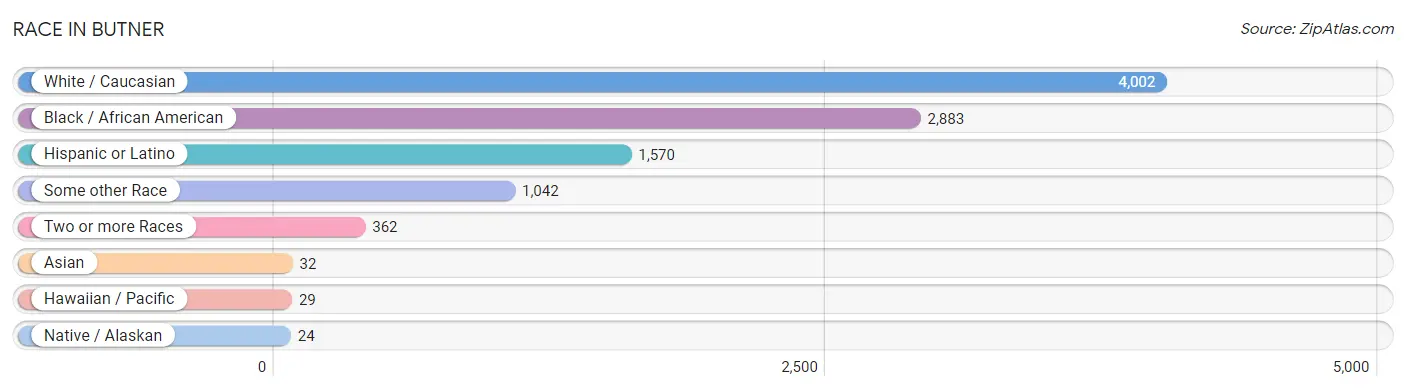
| Race | # Population | % Population |
| Asian | 32 | 0.4% |
| Black / African American | 2,883 | 34.4% |
| Hawaiian / Pacific | 29 | 0.4% |
| Hispanic or Latino | 1,570 | 18.8% |
| Native / Alaskan | 24 | 0.3% |
| White / Caucasian | 4,002 | 47.8% |
| Two or more Races | 362 | 4.3% |
| Some other Race | 1,042 | 12.4% |
| Total | 8,374 | 100.0% |
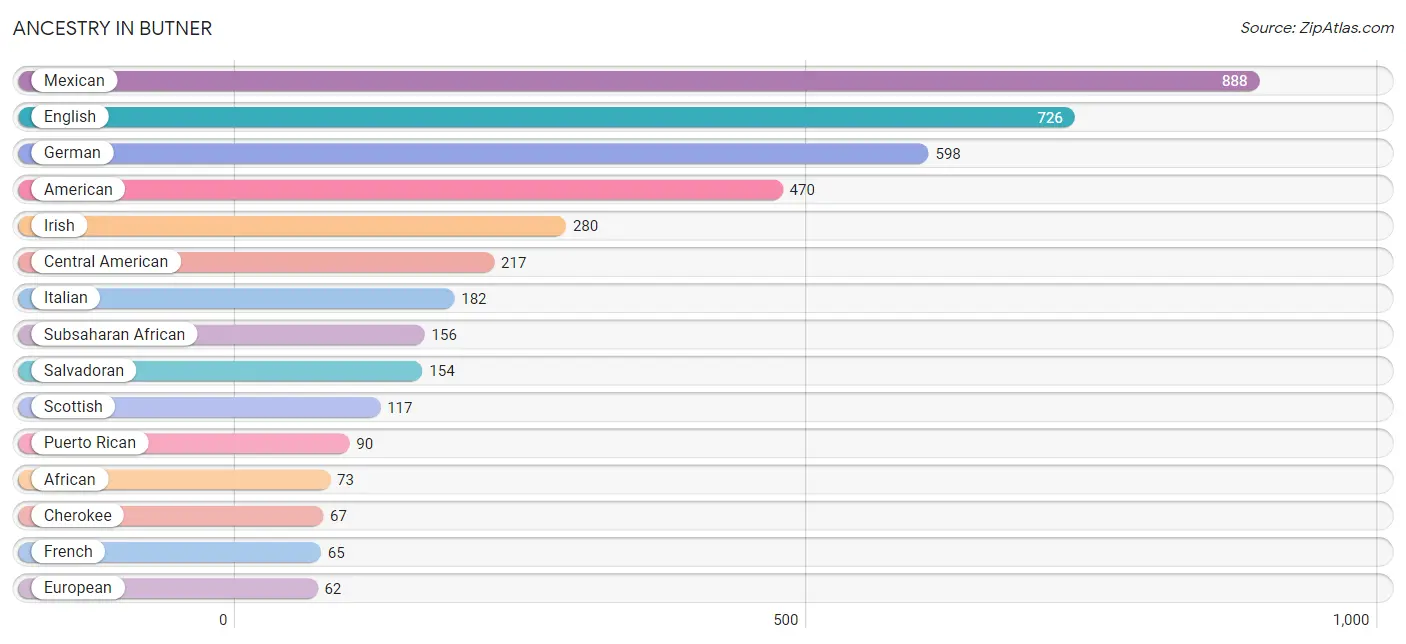
Ancestry in Butner
The most populous ancestries reported in Butner are Mexican (888 | 10.6%), English (726 | 8.7%), German (598 | 7.1%), American (470 | 5.6%), and Irish (280 | 3.3%), together accounting for 35.4% of all Butner residents.
| Ancestry | # Population | % Population |
| African | 73 | 0.9% |
| American | 470 | 5.6% |
| Arab | 8 | 0.1% |
| Blackfeet | 16 | 0.2% |
| Burmese | 9 | 0.1% |
| Central American | 217 | 2.6% |
| Central American Indian | 2 | 0.0% |
| Cherokee | 67 | 0.8% |
| Colombian | 18 | 0.2% |
| Ecuadorian | 14 | 0.2% |
| English | 726 | 8.7% |
| European | 62 | 0.7% |
| Finnish | 6 | 0.1% |
| French | 65 | 0.8% |
| French Canadian | 9 | 0.1% |
| German | 598 | 7.1% |
| Ghanaian | 11 | 0.1% |
| Guatemalan | 21 | 0.3% |
| Honduran | 42 | 0.5% |
| Indian (Asian) | 15 | 0.2% |
| Irish | 280 | 3.3% |
| Italian | 182 | 2.2% |
| Korean | 45 | 0.5% |
| Lebanese | 8 | 0.1% |
| Mexican | 888 | 10.6% |
| Native Hawaiian | 29 | 0.4% |
| Nigerian | 62 | 0.7% |
| Polish | 55 | 0.7% |
| Portuguese | 15 | 0.2% |
| Puerto Rican | 90 | 1.1% |
| Salvadoran | 154 | 1.8% |
| Scotch-Irish | 42 | 0.5% |
| Scottish | 117 | 1.4% |
| South American | 32 | 0.4% |
| Sri Lankan | 10 | 0.1% |
| Subsaharan African | 156 | 1.9% |
| Welsh | 11 | 0.1% | View All 37 Rows |
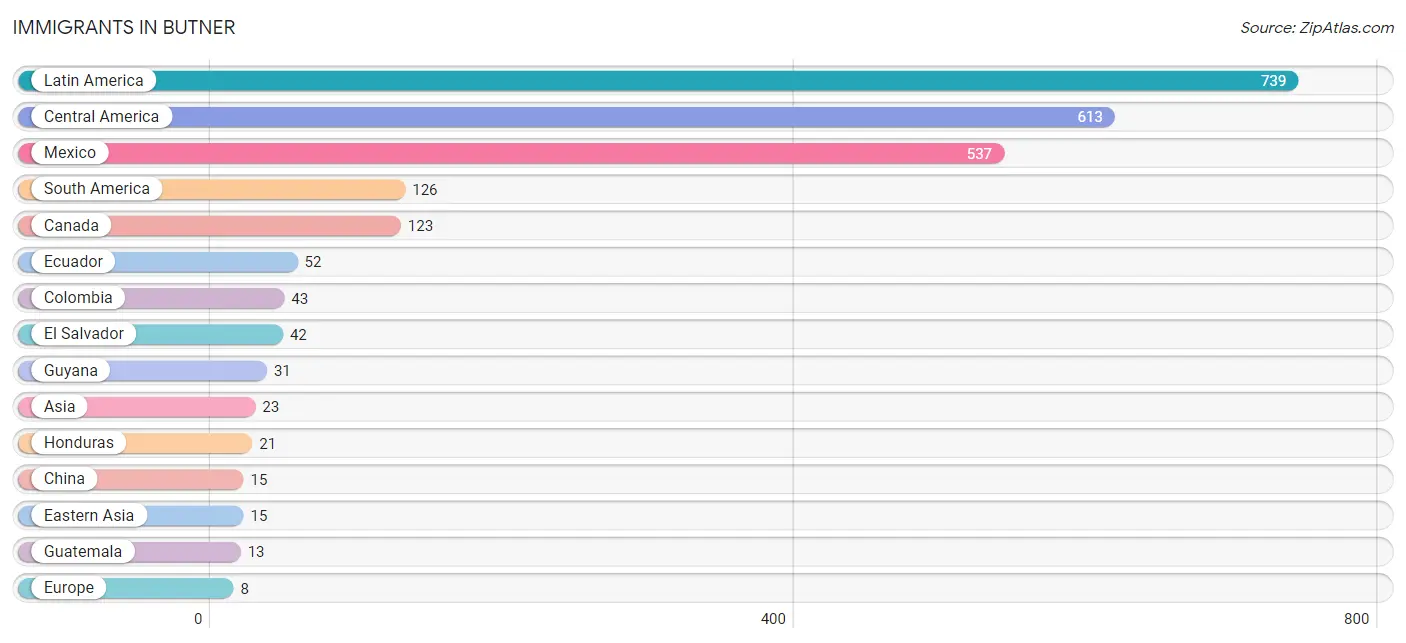
Immigrants in Butner
The most numerous immigrant groups reported in Butner came from Latin America (739 | 8.8%), Central America (613 | 7.3%), Mexico (537 | 6.4%), South America (126 | 1.5%), and Canada (123 | 1.5%), together accounting for 25.5% of all Butner residents.
| Immigration Origin | # Population | % Population |
| Asia | 23 | 0.3% |
| Canada | 123 | 1.5% |
| Central America | 613 | 7.3% |
| China | 15 | 0.2% |
| Colombia | 43 | 0.5% |
| Eastern Asia | 15 | 0.2% |
| Ecuador | 52 | 0.6% |
| El Salvador | 42 | 0.5% |
| Europe | 8 | 0.1% |
| Germany | 8 | 0.1% |
| Guatemala | 13 | 0.2% |
| Guyana | 31 | 0.4% |
| Honduras | 21 | 0.3% |
| Latin America | 739 | 8.8% |
| Mexico | 537 | 6.4% |
| Philippines | 8 | 0.1% |
| South America | 126 | 1.5% |
| South Eastern Asia | 8 | 0.1% |
| Western Europe | 8 | 0.1% | View All 19 Rows |
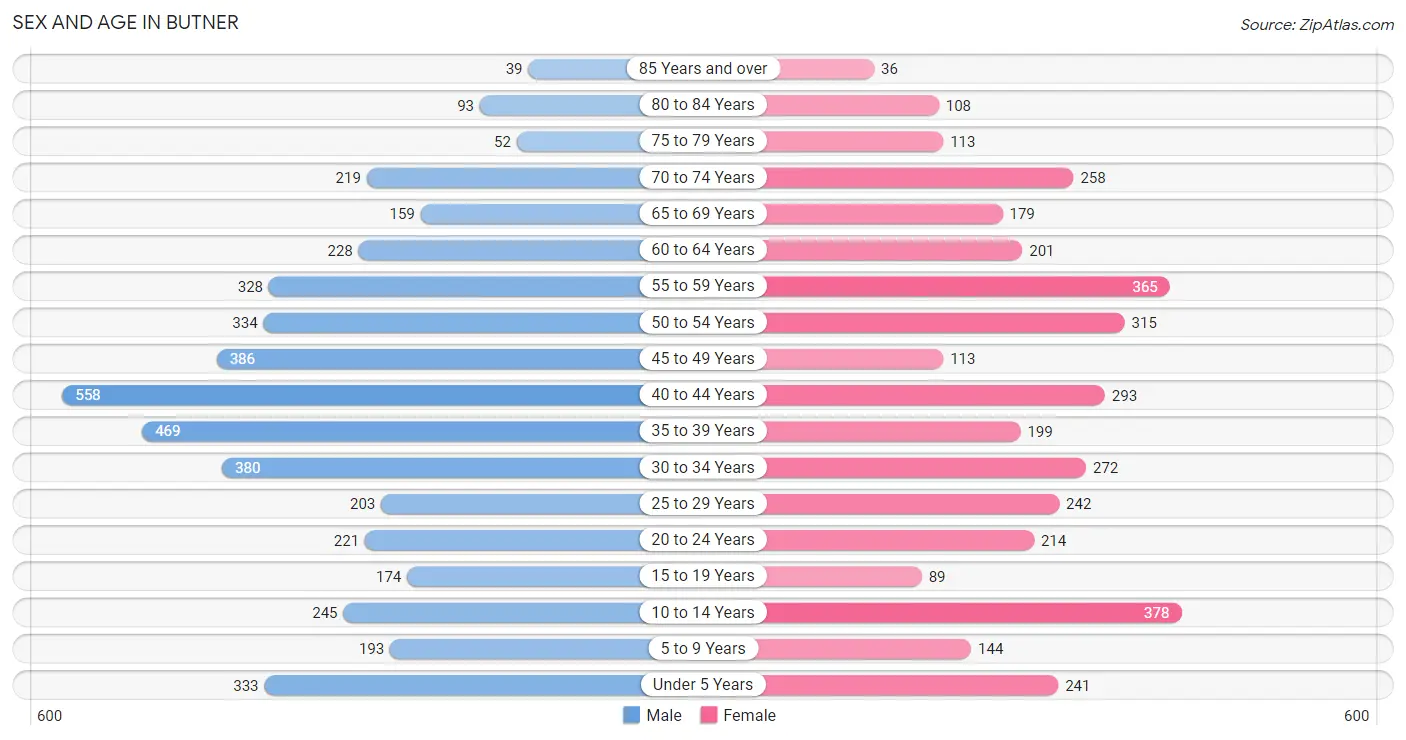
Sex and Age in Butner
Sex and Age in Butner
The most populous age groups in Butner are 40 to 44 Years (558 | 12.1%) for men and 10 to 14 Years (378 | 10.1%) for women.
| Age Bracket | Male | Female |
| Under 5 Years | 333 (7.2%) | 241 (6.4%) |
| 5 to 9 Years | 193 (4.2%) | 144 (3.8%) |
| 10 to 14 Years | 245 (5.3%) | 378 (10.1%) |
| 15 to 19 Years | 174 (3.8%) | 89 (2.4%) |
| 20 to 24 Years | 221 (4.8%) | 214 (5.7%) |
| 25 to 29 Years | 203 (4.4%) | 242 (6.4%) |
| 30 to 34 Years | 380 (8.2%) | 272 (7.2%) |
| 35 to 39 Years | 469 (10.2%) | 199 (5.3%) |
| 40 to 44 Years | 558 (12.1%) | 293 (7.8%) |
| 45 to 49 Years | 386 (8.4%) | 113 (3.0%) |
| 50 to 54 Years | 334 (7.2%) | 315 (8.4%) |
| 55 to 59 Years | 328 (7.1%) | 365 (9.7%) |
| 60 to 64 Years | 228 (4.9%) | 201 (5.3%) |
| 65 to 69 Years | 159 (3.5%) | 179 (4.8%) |
| 70 to 74 Years | 219 (4.8%) | 258 (6.9%) |
| 75 to 79 Years | 52 (1.1%) | 113 (3.0%) |
| 80 to 84 Years | 93 (2.0%) | 108 (2.9%) |
| 85 Years and over | 39 (0.9%) | 36 (1.0%) |
| Total | 4,614 (100.0%) | 3,760 (100.0%) |
Families and Households in Butner
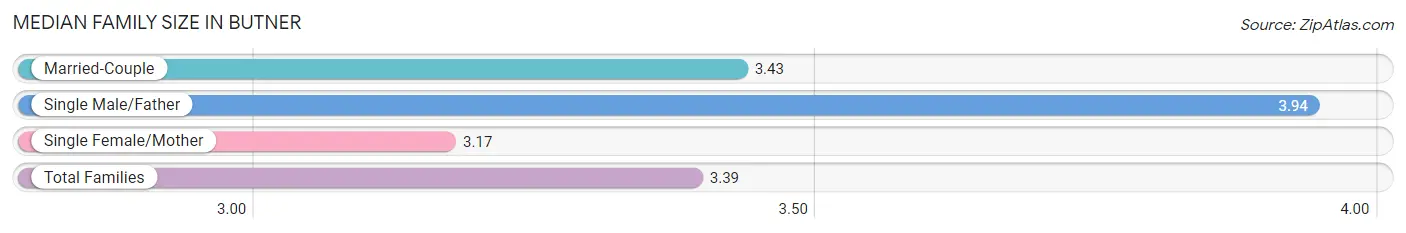
Median Family Size in Butner
The median family size in Butner is 3.39 persons per family, with single male/father families (78 | 4.4%) accounting for the largest median family size of 3.94 persons per family. On the other hand, single female/mother families (422 | 24.0%) represent the smallest median family size with 3.17 persons per family.
| Family Type | # Families | Family Size |
| Married-Couple | 1,255 (71.5%) | 3.43 |
| Single Male/Father | 78 (4.4%) | 3.94 |
| Single Female/Mother | 422 (24.0%) | 3.17 |
| Total Families | 1,755 (100.0%) | 3.39 |
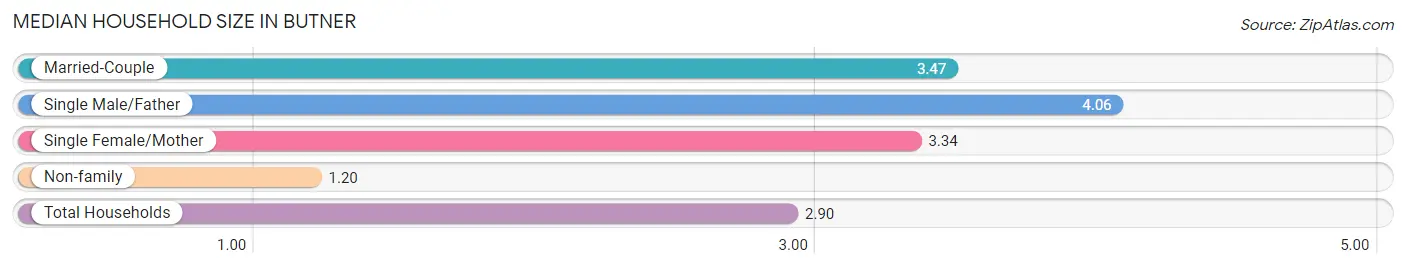
Median Household Size in Butner
The median household size in Butner is 2.90 persons per household, with single male/father households (78 | 3.3%) accounting for the largest median household size of 4.06 persons per household. non-family households (588 | 25.1%) represent the smallest median household size with 1.20 persons per household.
| Household Type | # Households | Household Size |
| Married-Couple | 1,255 (53.6%) | 3.47 |
| Single Male/Father | 78 (3.3%) | 4.06 |
| Single Female/Mother | 422 (18.0%) | 3.34 |
| Non-family | 588 (25.1%) | 1.20 |
| Total Households | 2,343 (100.0%) | 2.90 |
Household Size by Marriage Status in Butner
Out of a total of 2,343 households in Butner, 1,755 (74.9%) are family households, while 588 (25.1%) are nonfamily households. The most numerous type of family households are 2-person households, comprising 731, and the most common type of nonfamily households are 1-person households, comprising 514.
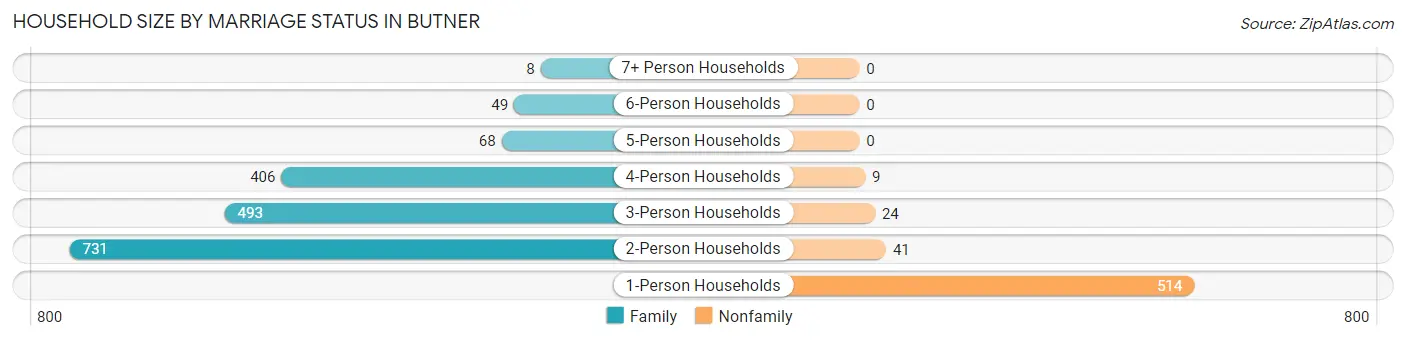
| Household Size | Family Households | Nonfamily Households |
| 1-Person Households | - | 514 (21.9%) |
| 2-Person Households | 731 (31.2%) | 41 (1.8%) |
| 3-Person Households | 493 (21.0%) | 24 (1.0%) |
| 4-Person Households | 406 (17.3%) | 9 (0.4%) |
| 5-Person Households | 68 (2.9%) | 0 (0.0%) |
| 6-Person Households | 49 (2.1%) | 0 (0.0%) |
| 7+ Person Households | 8 (0.3%) | 0 (0.0%) |
| Total | 1,755 (74.9%) | 588 (25.1%) |
Female Fertility in Butner
Fertility by Age in Butner
Average fertility rate in Butner is 34.0 births per 1,000 women. Women in the age bracket of 20 to 34 years have the highest fertility rate with 54.0 births per 1,000 women. Women in the age bracket of 20 to 34 years acount for 79.6% of all women with births.
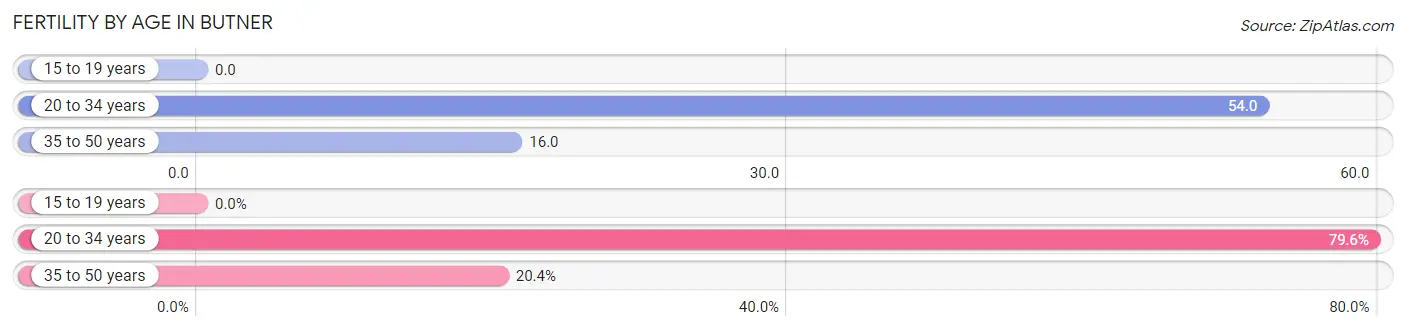
| Age Bracket | Women with Births | Births / 1,000 Women |
| 15 to 19 years | 0 (0.0%) | 0.0 |
| 20 to 34 years | 39 (79.6%) | 54.0 |
| 35 to 50 years | 10 (20.4%) | 16.0 |
| Total | 49 (100.0%) | 34.0 |
Fertility by Age by Marriage Status in Butner
95.9% of women with births (49) in Butner are married. The highest percentage of unmarried women with births falls into 20 to 34 years age bracket with 5.1% of them unmarried at the time of birth, while the lowest percentage of unmarried women with births belong to 35 to 50 years age bracket with 0.0% of them unmarried.
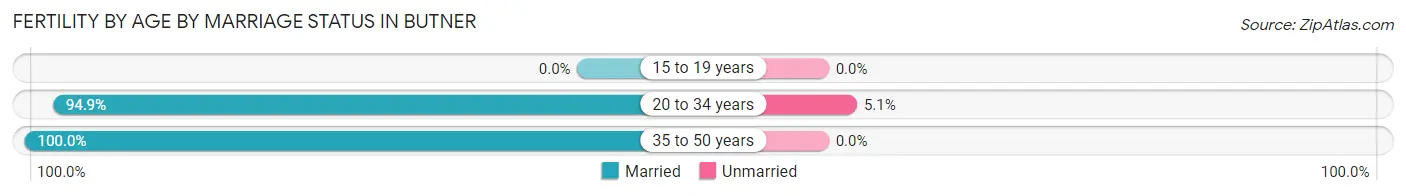
| Age Bracket | Married | Unmarried |
| 15 to 19 years | 0 (0.0%) | 0 (0.0%) |
| 20 to 34 years | 37 (94.9%) | 2 (5.1%) |
| 35 to 50 years | 10 (100.0%) | 0 (0.0%) |
| Total | 47 (95.9%) | 2 (4.1%) |
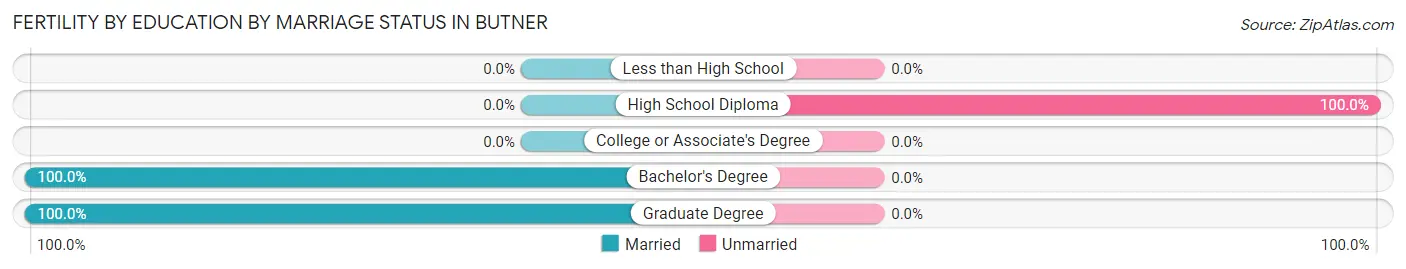
Fertility by Education in Butner
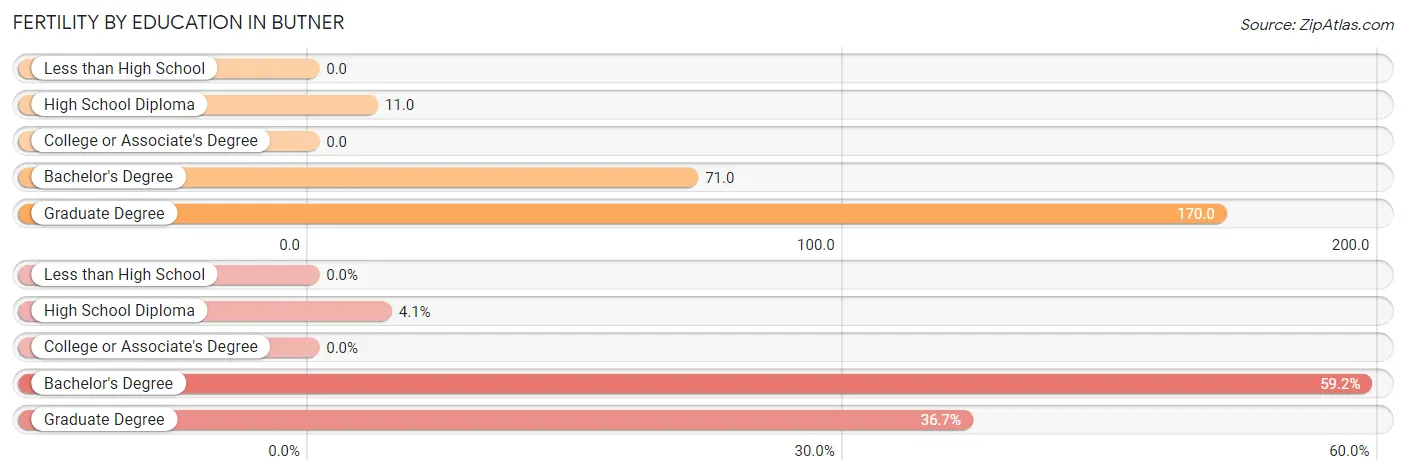
| Educational Attainment | Women with Births | Births / 1,000 Women |
| Less than High School | 0 (0.0%) | 0.0 |
| High School Diploma | 2 (4.1%) | 11.0 |
| College or Associate's Degree | 0 (0.0%) | 0.0 |
| Bachelor's Degree | 29 (59.2%) | 71.0 |
| Graduate Degree | 18 (36.7%) | 170.0 |
| Total | 49 (100.0%) | 34.0 |
Fertility by Education by Marriage Status in Butner
4.1% of women with births in Butner are unmarried. Women with the educational attainment of bachelor's degree are most likely to be married with 100.0% of them married at childbirth, while women with the educational attainment of high school diploma are least likely to be married with 100.0% of them unmarried at childbirth.
| Educational Attainment | Married | Unmarried |
| Less than High School | 0 (0.0%) | 0 (0.0%) |
| High School Diploma | 0 (0.0%) | 2 (100.0%) |
| College or Associate's Degree | 0 (0.0%) | 0 (0.0%) |
| Bachelor's Degree | 29 (100.0%) | 0 (0.0%) |
| Graduate Degree | 18 (100.0%) | 0 (0.0%) |
| Total | 47 (95.9%) | 2 (4.1%) |
Employment Characteristics in Butner
Employment by Class of Employer in Butner
Among the 2,892 employed individuals in Butner, private company employees (1,773 | 61.3%), local government employees (400 | 13.8%), and not-for-profit organizations (244 | 8.4%) make up the most common classes of employment.
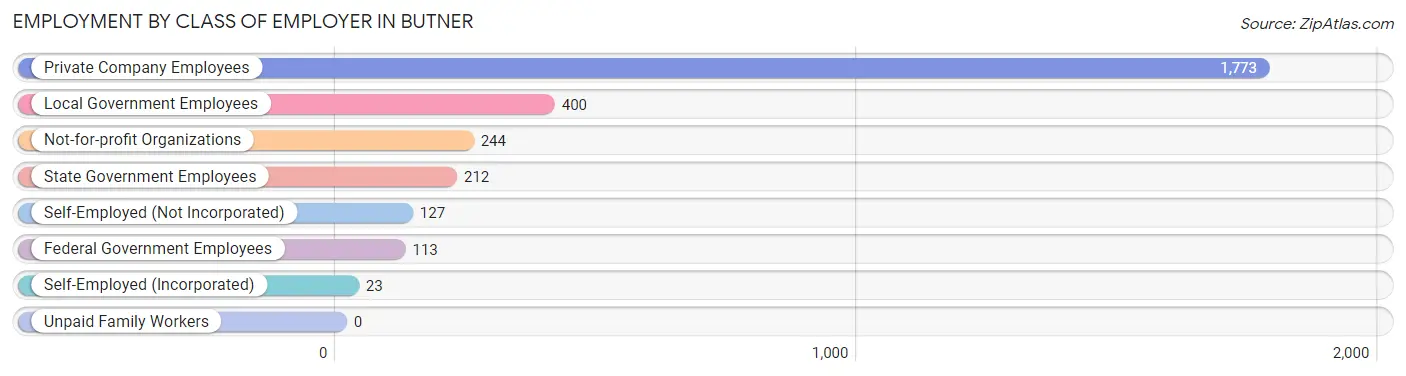
| Employer Class | # Employees | % Employees |
| Private Company Employees | 1,773 | 61.3% |
| Self-Employed (Incorporated) | 23 | 0.8% |
| Self-Employed (Not Incorporated) | 127 | 4.4% |
| Not-for-profit Organizations | 244 | 8.4% |
| Local Government Employees | 400 | 13.8% |
| State Government Employees | 212 | 7.3% |
| Federal Government Employees | 113 | 3.9% |
| Unpaid Family Workers | 0 | 0.0% |
| Total | 2,892 | 100.0% |
Employment Status by Age in Butner
According to the labor force statistics for Butner, out of the total population over 16 years of age (6,748), 48.0% or 3,239 individuals are in the labor force, with 6.1% or 198 of them unemployed. The age group with the highest labor force participation rate is 55 to 59 years, with 74.6% or 517 individuals in the labor force. Within the labor force, the 20 to 24 years age range has the highest percentage of unemployed individuals, with 13.1% or 32 of them being unemployed.
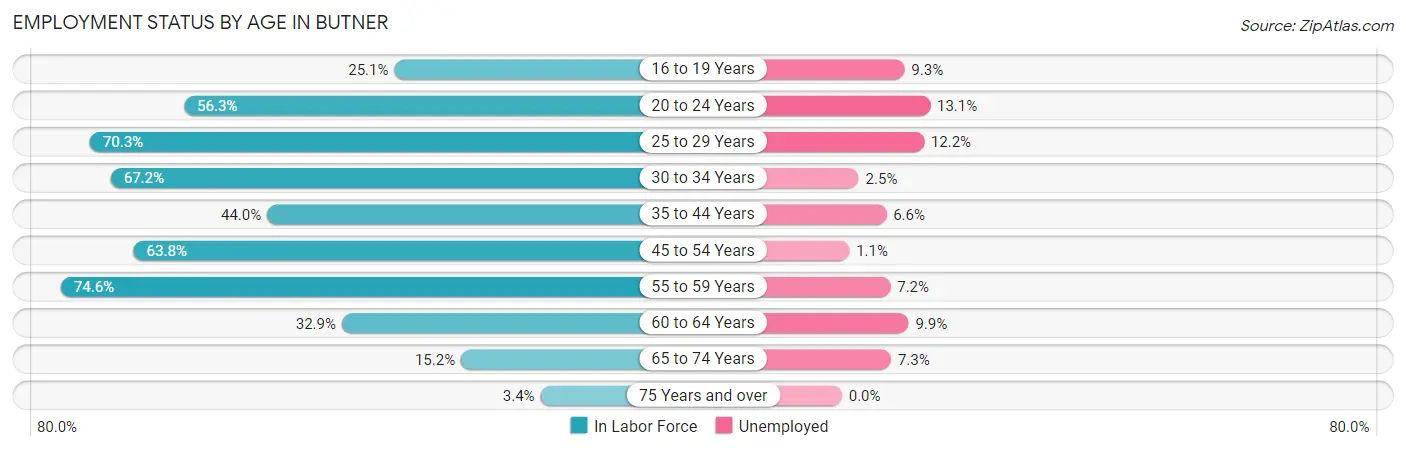
| Age Bracket | In Labor Force | Unemployed |
| 16 to 19 Years | 43 (25.1%) | 4 (9.3%) |
| 20 to 24 Years | 245 (56.3%) | 32 (13.1%) |
| 25 to 29 Years | 313 (70.3%) | 38 (12.2%) |
| 30 to 34 Years | 438 (67.2%) | 11 (2.5%) |
| 35 to 44 Years | 668 (44.0%) | 44 (6.6%) |
| 45 to 54 Years | 732 (63.8%) | 8 (1.1%) |
| 55 to 59 Years | 517 (74.6%) | 37 (7.2%) |
| 60 to 64 Years | 141 (32.9%) | 14 (9.9%) |
| 65 to 74 Years | 124 (15.2%) | 9 (7.3%) |
| 75 Years and over | 15 (3.4%) | 0 (0.0%) |
| Total | 3,239 (48.0%) | 198 (6.1%) |
Employment Status by Educational Attainment in Butner
According to labor force statistics for Butner, 57.5% of individuals (2,809) out of the total population between 25 and 64 years of age (4,886) are in the labor force, with 5.4% or 152 of them being unemployed. The group with the highest labor force participation rate are those with the educational attainment of bachelor's degree or higher, with 94.3% or 1,022 individuals in the labor force. Within the labor force, individuals with less than high school education have the highest percentage of unemployment, with 19.9% or 60 of them being unemployed.
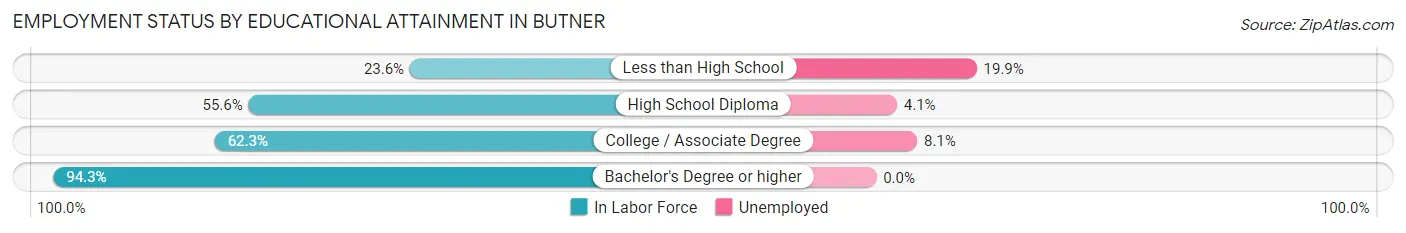
| Educational Attainment | In Labor Force | Unemployed |
| Less than High School | 302 (23.6%) | 254 (19.9%) |
| High School Diploma | 710 (55.6%) | 52 (4.1%) |
| College / Associate Degree | 777 (62.3%) | 101 (8.1%) |
| Bachelor's Degree or higher | 1,022 (94.3%) | 0 (0.0%) |
| Total | 2,809 (57.5%) | 264 (5.4%) |
Employment Occupations by Sex in Butner
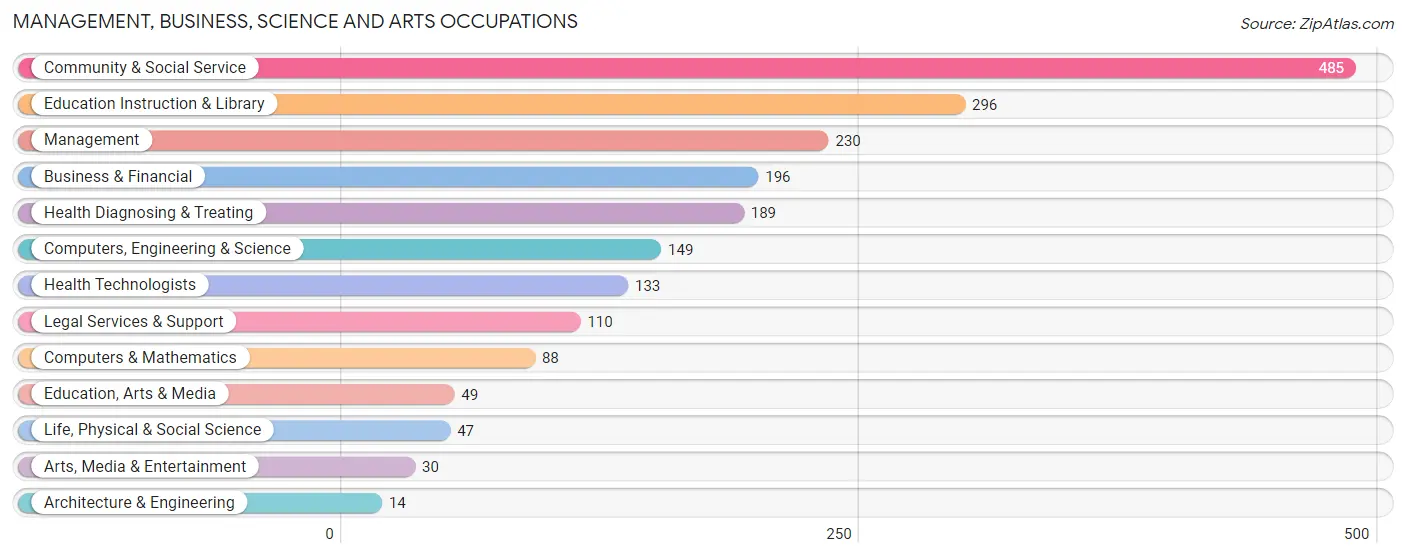
Management, Business, Science and Arts Occupations
The most common Management, Business, Science and Arts occupations in Butner are Community & Social Service (485 | 16.0%), Education Instruction & Library (296 | 9.8%), Management (230 | 7.6%), Business & Financial (196 | 6.5%), and Health Diagnosing & Treating (189 | 6.2%).
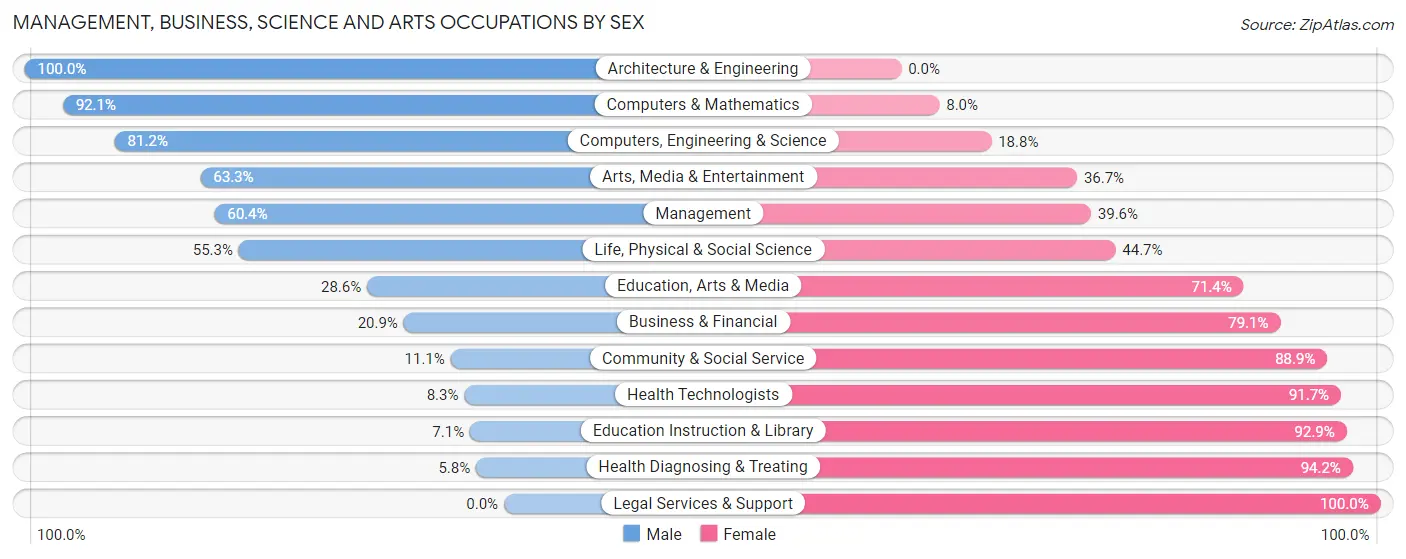
Management, Business, Science and Arts Occupations by Sex
Within the Management, Business, Science and Arts occupations in Butner, the most male-oriented occupations are Architecture & Engineering (100.0%), Computers & Mathematics (92.0%), and Computers, Engineering & Science (81.2%), while the most female-oriented occupations are Legal Services & Support (100.0%), Health Diagnosing & Treating (94.2%), and Education Instruction & Library (92.9%).
| Occupation | Male | Female |
| Management | 139 (60.4%) | 91 (39.6%) |
| Business & Financial | 41 (20.9%) | 155 (79.1%) |
| Computers, Engineering & Science | 121 (81.2%) | 28 (18.8%) |
| Computers & Mathematics | 81 (92.0%) | 7 (8.0%) |
| Architecture & Engineering | 14 (100.0%) | 0 (0.0%) |
| Life, Physical & Social Science | 26 (55.3%) | 21 (44.7%) |
| Community & Social Service | 54 (11.1%) | 431 (88.9%) |
| Education, Arts & Media | 14 (28.6%) | 35 (71.4%) |
| Legal Services & Support | 0 (0.0%) | 110 (100.0%) |
| Education Instruction & Library | 21 (7.1%) | 275 (92.9%) |
| Arts, Media & Entertainment | 19 (63.3%) | 11 (36.7%) |
| Health Diagnosing & Treating | 11 (5.8%) | 178 (94.2%) |
| Health Technologists | 11 (8.3%) | 122 (91.7%) |
| Total (Category) | 366 (29.3%) | 883 (70.7%) |
| Total (Overall) | 1,454 (48.0%) | 1,577 (52.0%) |
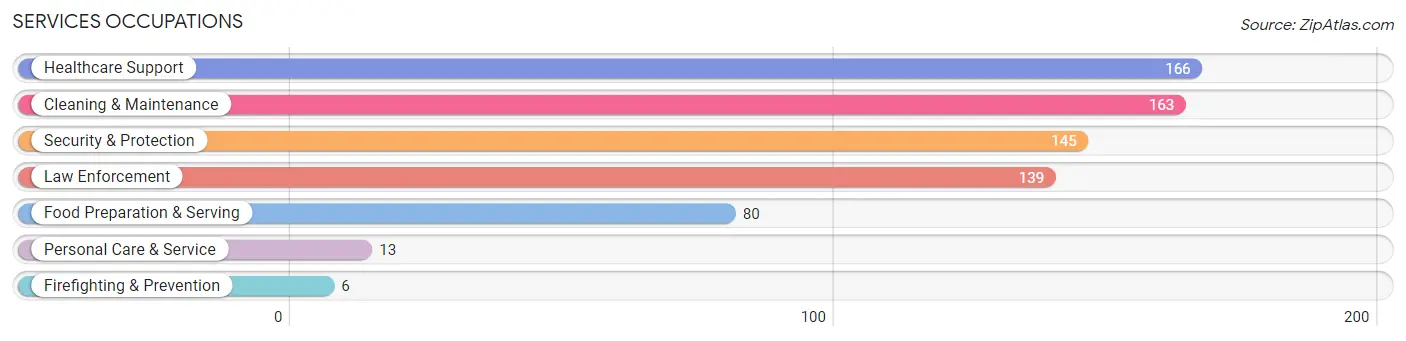
Services Occupations
The most common Services occupations in Butner are Healthcare Support (166 | 5.5%), Cleaning & Maintenance (163 | 5.4%), Security & Protection (145 | 4.8%), Law Enforcement (139 | 4.6%), and Food Preparation & Serving (80 | 2.6%).
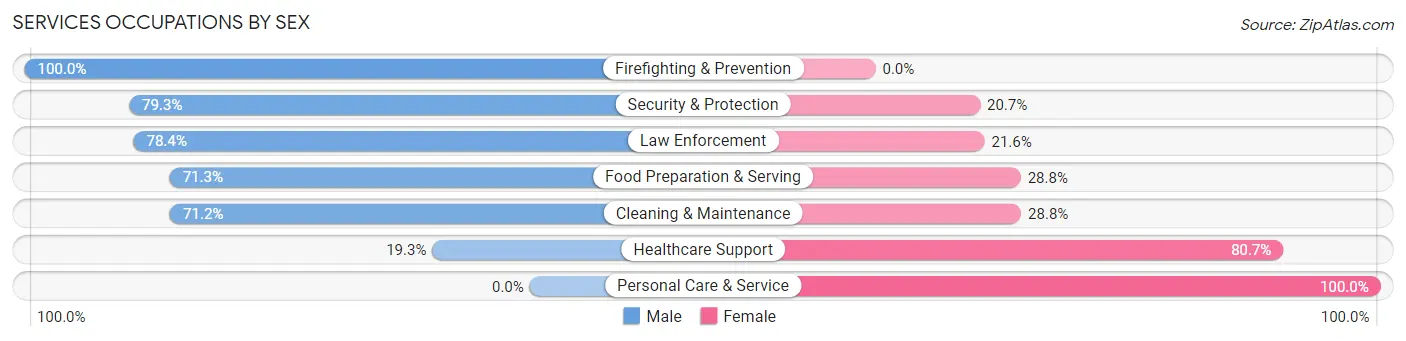
Services Occupations by Sex
Within the Services occupations in Butner, the most male-oriented occupations are Firefighting & Prevention (100.0%), Security & Protection (79.3%), and Law Enforcement (78.4%), while the most female-oriented occupations are Personal Care & Service (100.0%), Healthcare Support (80.7%), and Cleaning & Maintenance (28.8%).
| Occupation | Male | Female |
| Healthcare Support | 32 (19.3%) | 134 (80.7%) |
| Security & Protection | 115 (79.3%) | 30 (20.7%) |
| Firefighting & Prevention | 6 (100.0%) | 0 (0.0%) |
| Law Enforcement | 109 (78.4%) | 30 (21.6%) |
| Food Preparation & Serving | 57 (71.3%) | 23 (28.7%) |
| Cleaning & Maintenance | 116 (71.2%) | 47 (28.8%) |
| Personal Care & Service | 0 (0.0%) | 13 (100.0%) |
| Total (Category) | 320 (56.4%) | 247 (43.6%) |
| Total (Overall) | 1,454 (48.0%) | 1,577 (52.0%) |
Sales and Office Occupations
The most common Sales and Office occupations in Butner are Office & Administration (358 | 11.8%), and Sales & Related (124 | 4.1%).
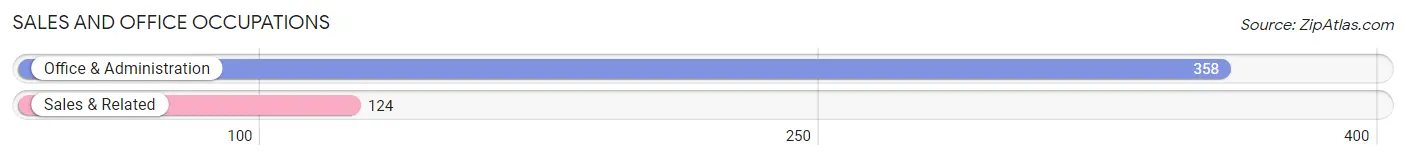
Sales and Office Occupations by Sex
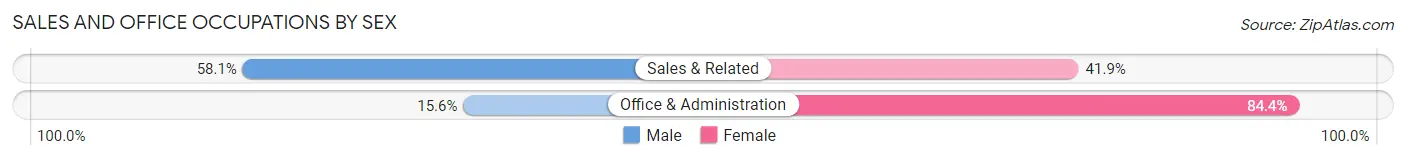
| Occupation | Male | Female |
| Sales & Related | 72 (58.1%) | 52 (41.9%) |
| Office & Administration | 56 (15.6%) | 302 (84.4%) |
| Total (Category) | 128 (26.6%) | 354 (73.4%) |
| Total (Overall) | 1,454 (48.0%) | 1,577 (52.0%) |
Natural Resources, Construction and Maintenance Occupations
The most common Natural Resources, Construction and Maintenance occupations in Butner are Construction & Extraction (145 | 4.8%), Installation, Maintenance & Repair (81 | 2.7%), and Farming, Fishing & Forestry (22 | 0.7%).
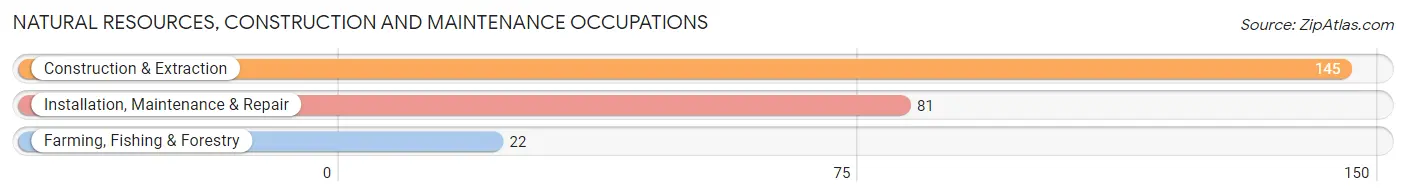
Natural Resources, Construction and Maintenance Occupations by Sex
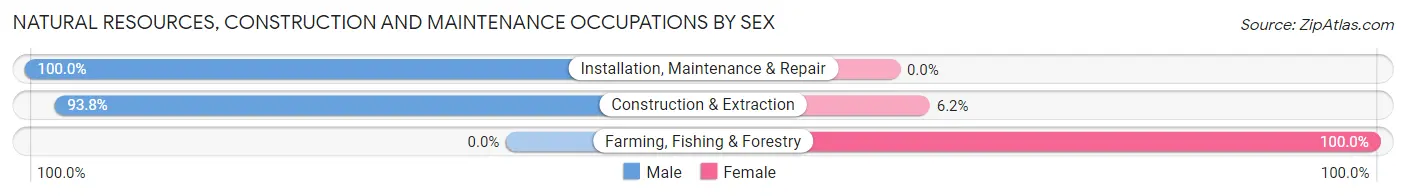
| Occupation | Male | Female |
| Farming, Fishing & Forestry | 0 (0.0%) | 22 (100.0%) |
| Construction & Extraction | 136 (93.8%) | 9 (6.2%) |
| Installation, Maintenance & Repair | 81 (100.0%) | 0 (0.0%) |
| Total (Category) | 217 (87.5%) | 31 (12.5%) |
| Total (Overall) | 1,454 (48.0%) | 1,577 (52.0%) |
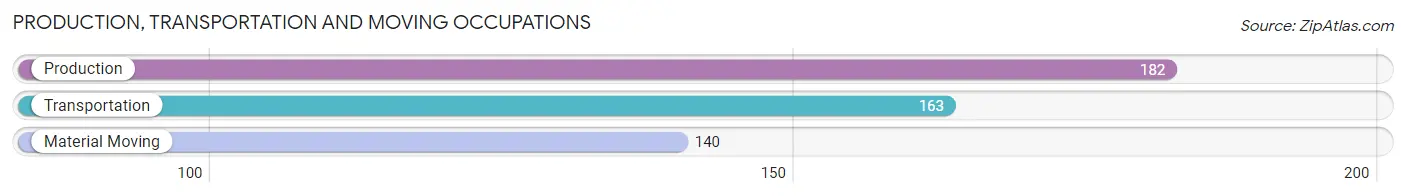
Production, Transportation and Moving Occupations
The most common Production, Transportation and Moving occupations in Butner are Production (182 | 6.0%), Transportation (163 | 5.4%), and Material Moving (140 | 4.6%).
Production, Transportation and Moving Occupations by Sex
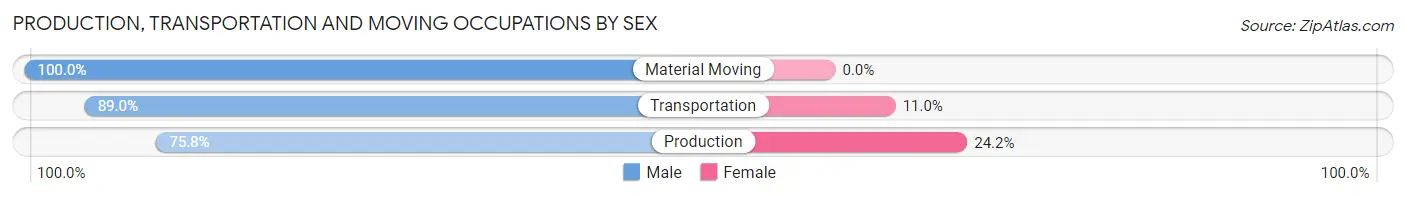
| Occupation | Male | Female |
| Production | 138 (75.8%) | 44 (24.2%) |
| Transportation | 145 (89.0%) | 18 (11.0%) |
| Material Moving | 140 (100.0%) | 0 (0.0%) |
| Total (Category) | 423 (87.2%) | 62 (12.8%) |
| Total (Overall) | 1,454 (48.0%) | 1,577 (52.0%) |
Employment Industries by Sex in Butner
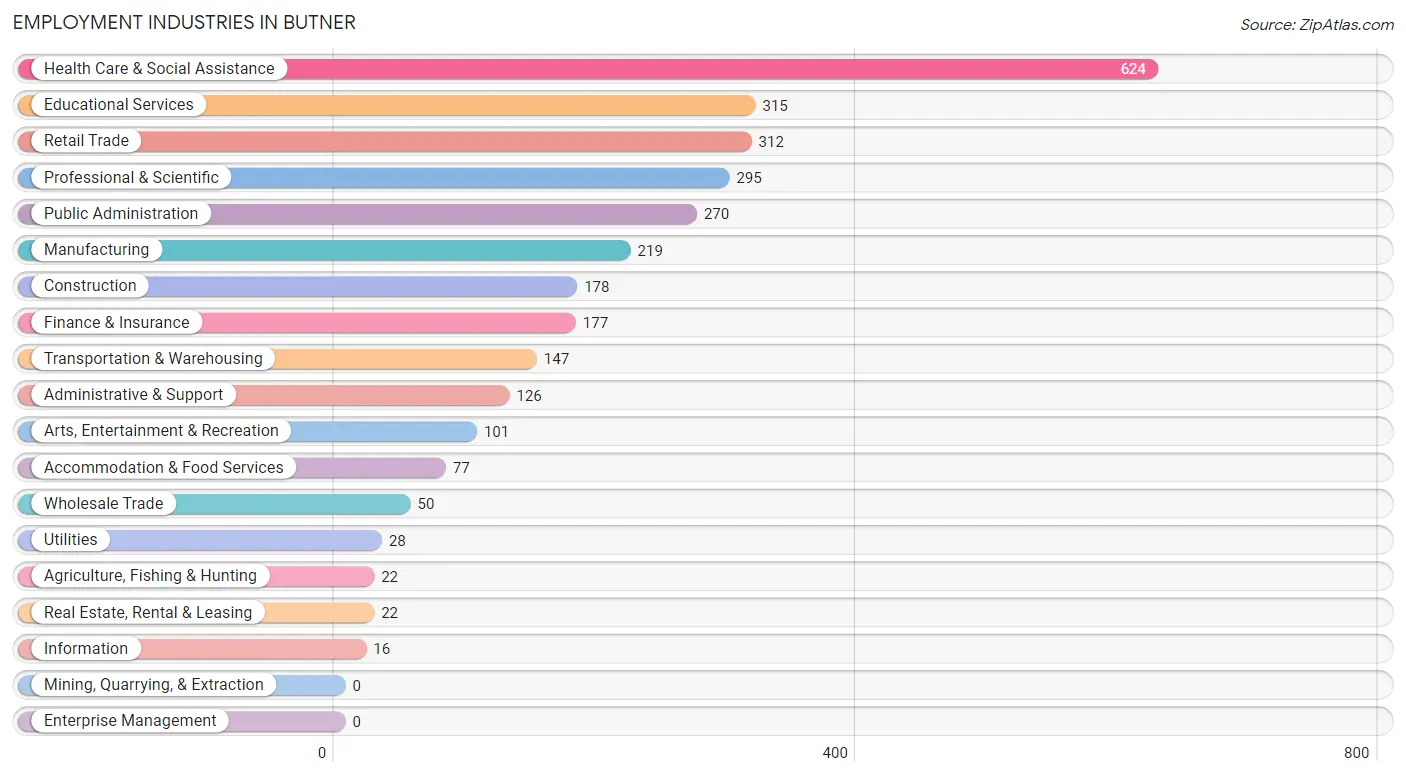
Employment Industries in Butner
The major employment industries in Butner include Health Care & Social Assistance (624 | 20.6%), Educational Services (315 | 10.4%), Retail Trade (312 | 10.3%), Professional & Scientific (295 | 9.7%), and Public Administration (270 | 8.9%).
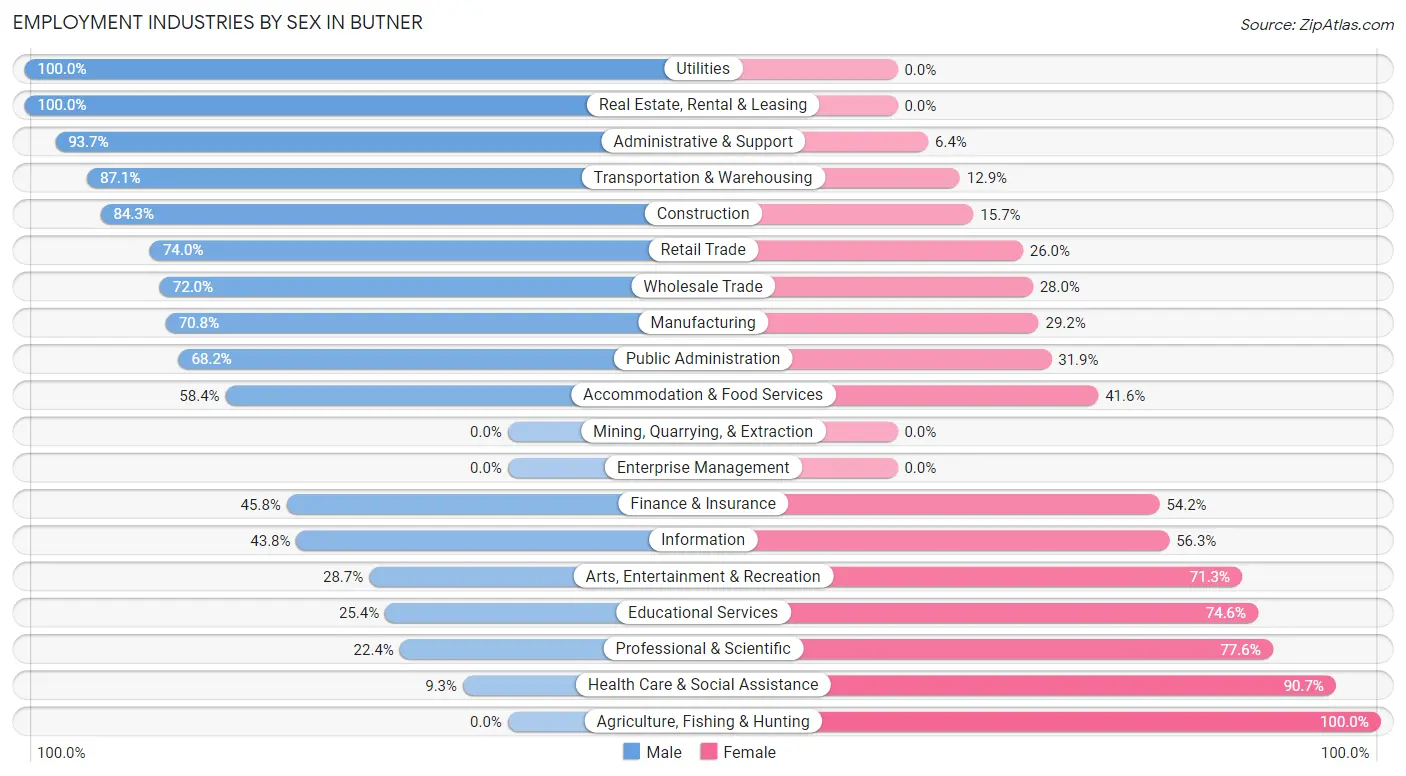
Employment Industries by Sex in Butner
The Butner industries that see more men than women are Utilities (100.0%), Real Estate, Rental & Leasing (100.0%), and Administrative & Support (93.6%), whereas the industries that tend to have a higher number of women are Agriculture, Fishing & Hunting (100.0%), Health Care & Social Assistance (90.7%), and Professional & Scientific (77.6%).
| Industry | Male | Female |
| Agriculture, Fishing & Hunting | 0 (0.0%) | 22 (100.0%) |
| Mining, Quarrying, & Extraction | 0 (0.0%) | 0 (0.0%) |
| Construction | 150 (84.3%) | 28 (15.7%) |
| Manufacturing | 155 (70.8%) | 64 (29.2%) |
| Wholesale Trade | 36 (72.0%) | 14 (28.0%) |
| Retail Trade | 231 (74.0%) | 81 (26.0%) |
| Transportation & Warehousing | 128 (87.1%) | 19 (12.9%) |
| Utilities | 28 (100.0%) | 0 (0.0%) |
| Information | 7 (43.8%) | 9 (56.2%) |
| Finance & Insurance | 81 (45.8%) | 96 (54.2%) |
| Real Estate, Rental & Leasing | 22 (100.0%) | 0 (0.0%) |
| Professional & Scientific | 66 (22.4%) | 229 (77.6%) |
| Enterprise Management | 0 (0.0%) | 0 (0.0%) |
| Administrative & Support | 118 (93.6%) | 8 (6.4%) |
| Educational Services | 80 (25.4%) | 235 (74.6%) |
| Health Care & Social Assistance | 58 (9.3%) | 566 (90.7%) |
| Arts, Entertainment & Recreation | 29 (28.7%) | 72 (71.3%) |
| Accommodation & Food Services | 45 (58.4%) | 32 (41.6%) |
| Public Administration | 184 (68.1%) | 86 (31.9%) |
| Total | 1,454 (48.0%) | 1,577 (52.0%) |
Education in Butner
School Enrollment in Butner
The most common levels of schooling among the 1,531 students in Butner are middle school (469 | 30.6%), high school (435 | 28.4%), and elementary school (356 | 23.3%).
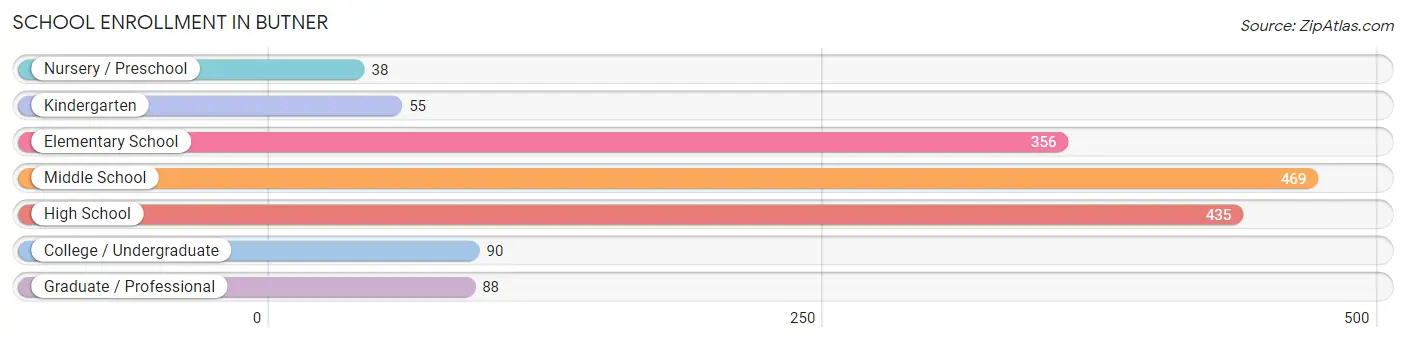
| School Level | # Students | % Students |
| Nursery / Preschool | 38 | 2.5% |
| Kindergarten | 55 | 3.6% |
| Elementary School | 356 | 23.3% |
| Middle School | 469 | 30.6% |
| High School | 435 | 28.4% |
| College / Undergraduate | 90 | 5.9% |
| Graduate / Professional | 88 | 5.8% |
| Total | 1,531 | 100.0% |
School Enrollment by Age by Funding Source in Butner
Out of a total of 1,531 students who are enrolled in schools in Butner, 54 (3.5%) attend a private institution, while the remaining 1,477 (96.5%) are enrolled in public schools. The age group of 20 to 24 year olds has the highest likelihood of being enrolled in private schools, with 9 (7.3% in the age bracket) enrolled. Conversely, the age group of 3 to 4 year olds has the lowest likelihood of being enrolled in a private school, with 38 (100.0% in the age bracket) attending a public institution.
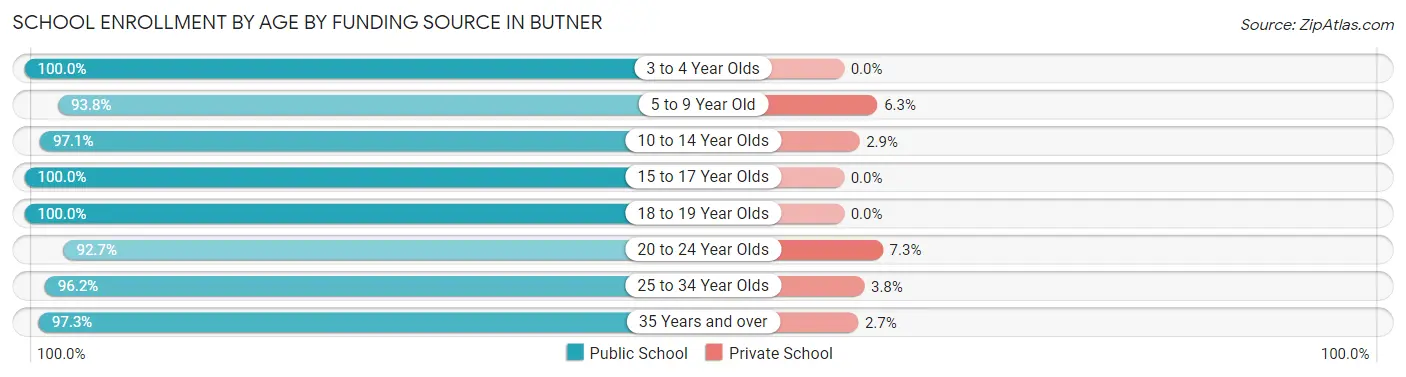
| Age Bracket | Public School | Private School |
| 3 to 4 Year Olds | 38 (100.0%) | 0 (0.0%) |
| 5 to 9 Year Old | 300 (93.8%) | 20 (6.2%) |
| 10 to 14 Year Olds | 605 (97.1%) | 18 (2.9%) |
| 15 to 17 Year Olds | 187 (100.0%) | 0 (0.0%) |
| 18 to 19 Year Olds | 32 (100.0%) | 0 (0.0%) |
| 20 to 24 Year Olds | 115 (92.7%) | 9 (7.3%) |
| 25 to 34 Year Olds | 127 (96.2%) | 5 (3.8%) |
| 35 Years and over | 73 (97.3%) | 2 (2.7%) |
| Total | 1,477 (96.5%) | 54 (3.5%) |
Educational Attainment by Field of Study in Butner
Science & technology (271 | 18.9%), bio, nature & agricultural (225 | 15.7%), business (212 | 14.8%), social sciences (175 | 12.2%), and arts & humanities (126 | 8.8%) are the most common fields of study among 1,431 individuals in Butner who have obtained a bachelor's degree or higher.
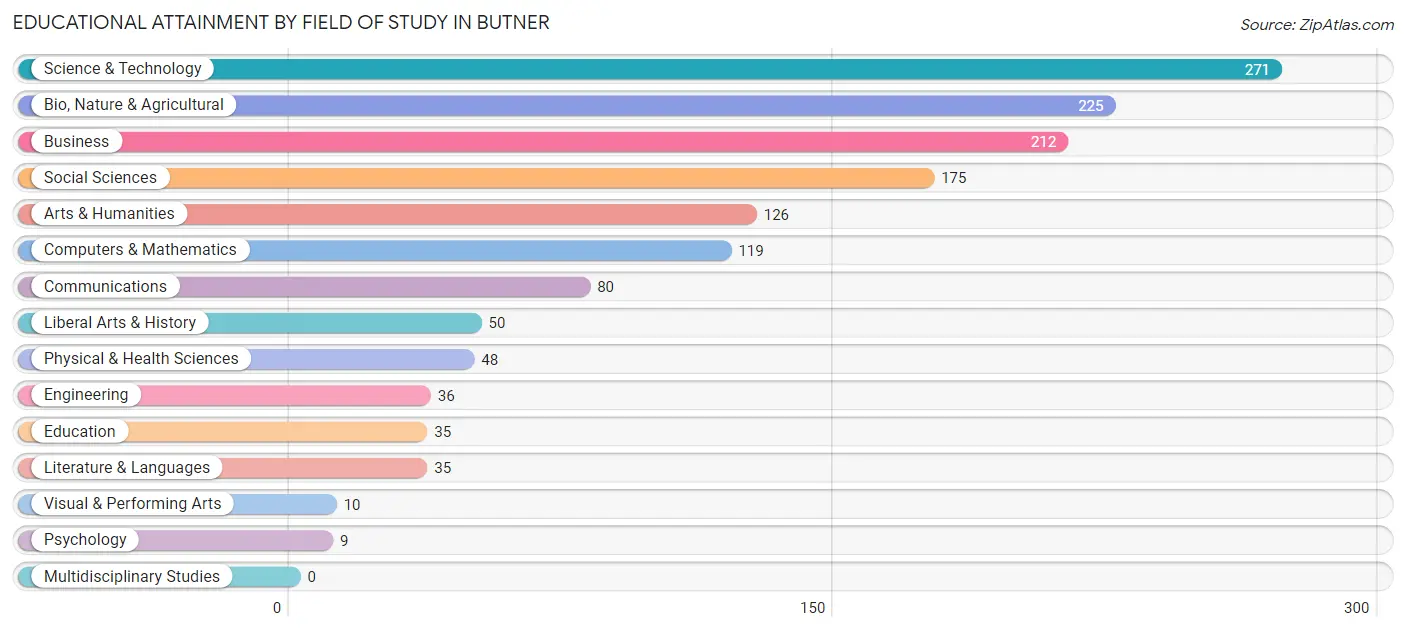
| Field of Study | # Graduates | % Graduates |
| Computers & Mathematics | 119 | 8.3% |
| Bio, Nature & Agricultural | 225 | 15.7% |
| Physical & Health Sciences | 48 | 3.4% |
| Psychology | 9 | 0.6% |
| Social Sciences | 175 | 12.2% |
| Engineering | 36 | 2.5% |
| Multidisciplinary Studies | 0 | 0.0% |
| Science & Technology | 271 | 18.9% |
| Business | 212 | 14.8% |
| Education | 35 | 2.5% |
| Literature & Languages | 35 | 2.5% |
| Liberal Arts & History | 50 | 3.5% |
| Visual & Performing Arts | 10 | 0.7% |
| Communications | 80 | 5.6% |
| Arts & Humanities | 126 | 8.8% |
| Total | 1,431 | 100.0% |
Transportation & Commute in Butner
Vehicle Availability by Sex in Butner
The most prevalent vehicle ownership categories in Butner are males with 2 vehicles (530, accounting for 38.7%) and females with 2 vehicles (745, making up 34.8%).
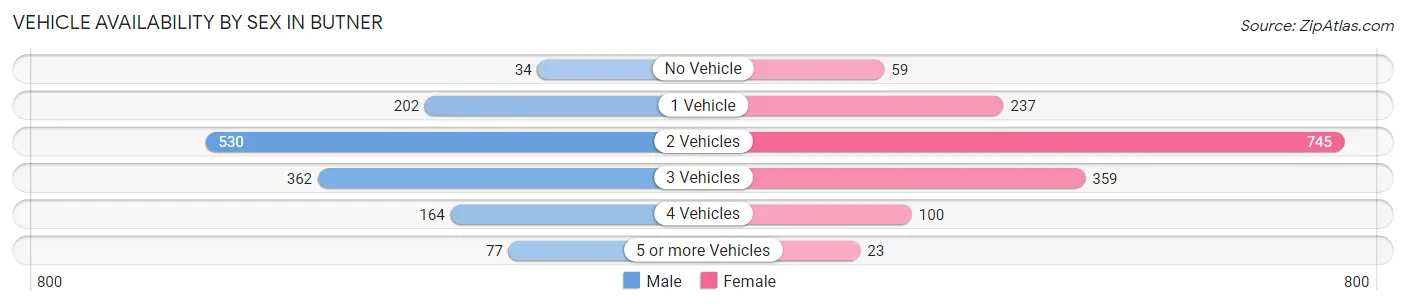
| Vehicles Available | Male | Female |
| No Vehicle | 34 (2.5%) | 59 (3.9%) |
| 1 Vehicle | 202 (14.8%) | 237 (15.6%) |
| 2 Vehicles | 530 (38.7%) | 745 (48.9%) |
| 3 Vehicles | 362 (26.4%) | 359 (23.6%) |
| 4 Vehicles | 164 (12.0%) | 100 (6.6%) |
| 5 or more Vehicles | 77 (5.6%) | 23 (1.5%) |
| Total | 1,369 (100.0%) | 1,523 (100.0%) |
Commute Time in Butner
The most frequently occuring commute durations in Butner are 20 to 24 minutes (557 commuters, 22.0%), 25 to 29 minutes (364 commuters, 14.4%), and 30 to 34 minutes (362 commuters, 14.3%).
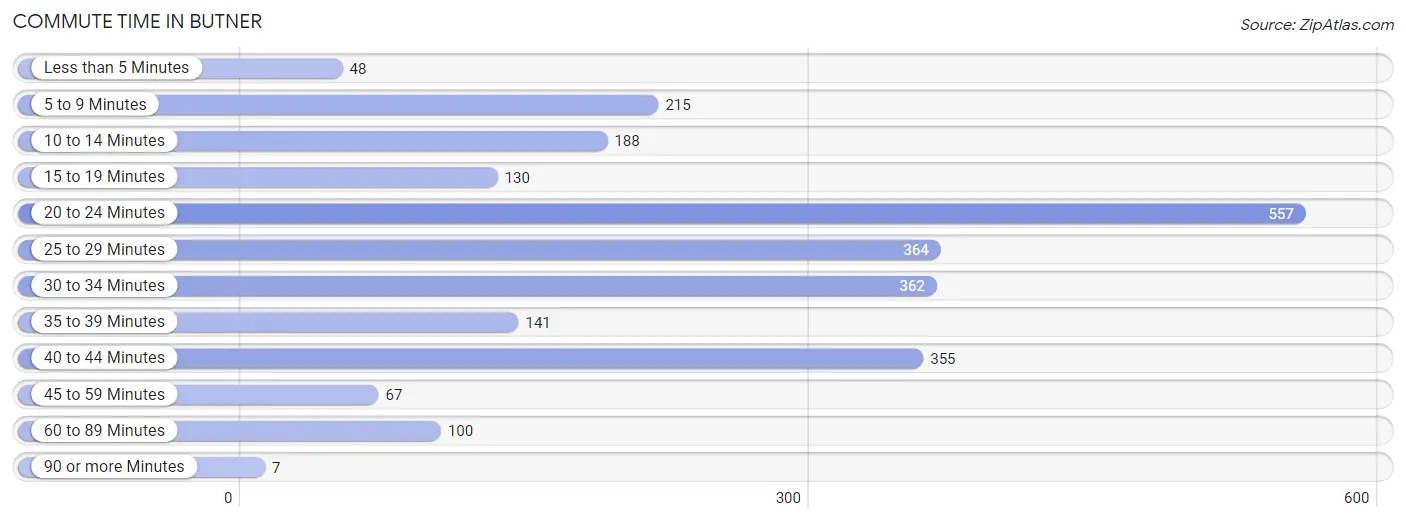
| Commute Time | # Commuters | % Commuters |
| Less than 5 Minutes | 48 | 1.9% |
| 5 to 9 Minutes | 215 | 8.5% |
| 10 to 14 Minutes | 188 | 7.4% |
| 15 to 19 Minutes | 130 | 5.1% |
| 20 to 24 Minutes | 557 | 22.0% |
| 25 to 29 Minutes | 364 | 14.4% |
| 30 to 34 Minutes | 362 | 14.3% |
| 35 to 39 Minutes | 141 | 5.6% |
| 40 to 44 Minutes | 355 | 14.0% |
| 45 to 59 Minutes | 67 | 2.6% |
| 60 to 89 Minutes | 100 | 4.0% |
| 90 or more Minutes | 7 | 0.3% |
Commute Time by Sex in Butner
The most common commute times in Butner are 20 to 24 minutes (201 commuters, 17.3%) for males and 20 to 24 minutes (356 commuters, 26.0%) for females.
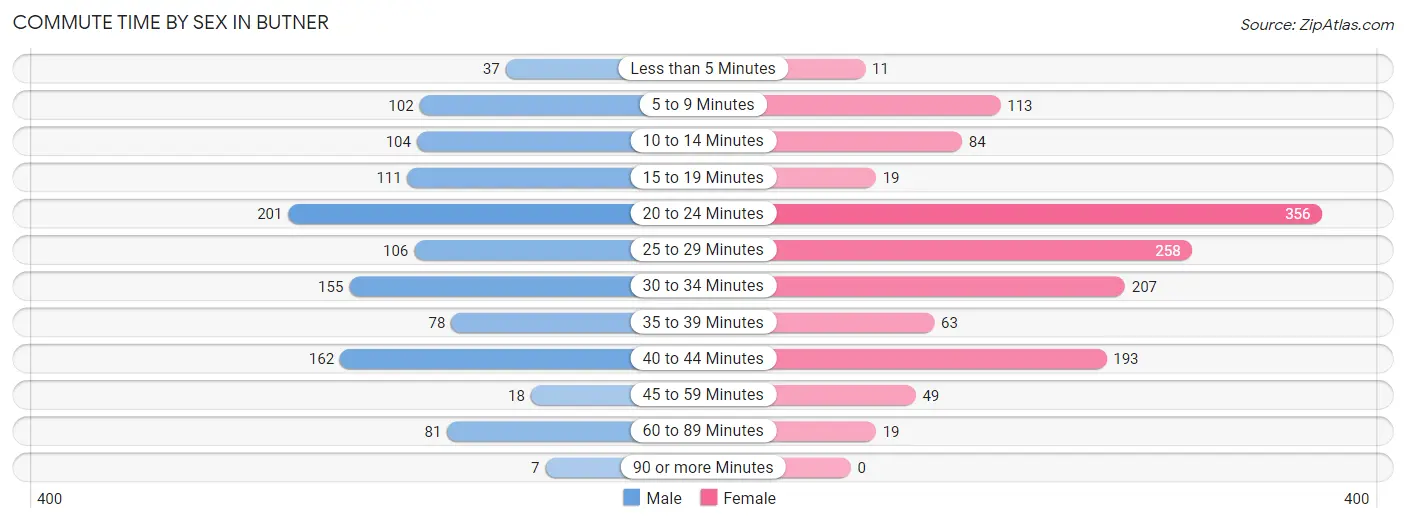
| Commute Time | Male | Female |
| Less than 5 Minutes | 37 (3.2%) | 11 (0.8%) |
| 5 to 9 Minutes | 102 (8.8%) | 113 (8.2%) |
| 10 to 14 Minutes | 104 (8.9%) | 84 (6.1%) |
| 15 to 19 Minutes | 111 (9.6%) | 19 (1.4%) |
| 20 to 24 Minutes | 201 (17.3%) | 356 (26.0%) |
| 25 to 29 Minutes | 106 (9.1%) | 258 (18.8%) |
| 30 to 34 Minutes | 155 (13.3%) | 207 (15.1%) |
| 35 to 39 Minutes | 78 (6.7%) | 63 (4.6%) |
| 40 to 44 Minutes | 162 (13.9%) | 193 (14.1%) |
| 45 to 59 Minutes | 18 (1.5%) | 49 (3.6%) |
| 60 to 89 Minutes | 81 (7.0%) | 19 (1.4%) |
| 90 or more Minutes | 7 (0.6%) | 0 (0.0%) |
Time of Departure to Work by Sex in Butner
The most frequent times of departure to work in Butner are 7:00 AM to 7:29 AM (282, 24.3%) for males and 7:30 AM to 7:59 AM (297, 21.6%) for females.
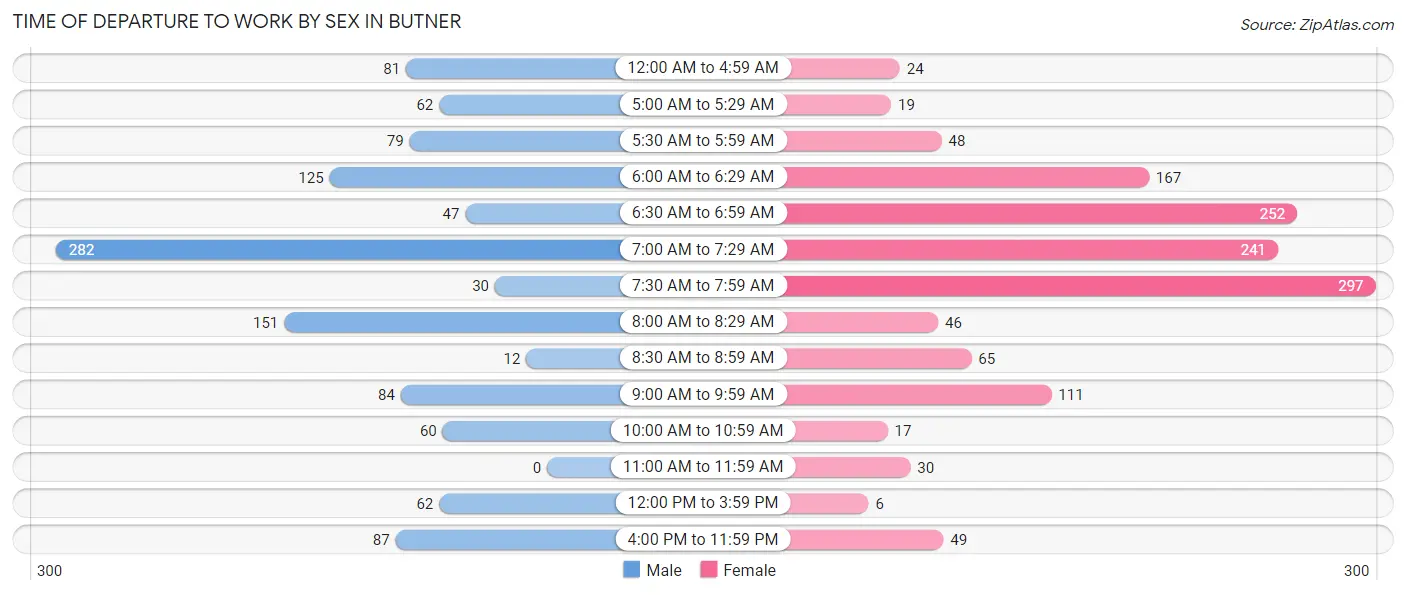
| Time of Departure | Male | Female |
| 12:00 AM to 4:59 AM | 81 (7.0%) | 24 (1.8%) |
| 5:00 AM to 5:29 AM | 62 (5.3%) | 19 (1.4%) |
| 5:30 AM to 5:59 AM | 79 (6.8%) | 48 (3.5%) |
| 6:00 AM to 6:29 AM | 125 (10.8%) | 167 (12.2%) |
| 6:30 AM to 6:59 AM | 47 (4.0%) | 252 (18.4%) |
| 7:00 AM to 7:29 AM | 282 (24.3%) | 241 (17.6%) |
| 7:30 AM to 7:59 AM | 30 (2.6%) | 297 (21.6%) |
| 8:00 AM to 8:29 AM | 151 (13.0%) | 46 (3.4%) |
| 8:30 AM to 8:59 AM | 12 (1.0%) | 65 (4.7%) |
| 9:00 AM to 9:59 AM | 84 (7.2%) | 111 (8.1%) |
| 10:00 AM to 10:59 AM | 60 (5.2%) | 17 (1.2%) |
| 11:00 AM to 11:59 AM | 0 (0.0%) | 30 (2.2%) |
| 12:00 PM to 3:59 PM | 62 (5.3%) | 6 (0.4%) |
| 4:00 PM to 11:59 PM | 87 (7.5%) | 49 (3.6%) |
| Total | 1,162 (100.0%) | 1,372 (100.0%) |
Housing Occupancy in Butner
Occupancy by Ownership in Butner
Of the total 2,343 dwellings in Butner, owner-occupied units account for 1,619 (69.1%), while renter-occupied units make up 724 (30.9%).
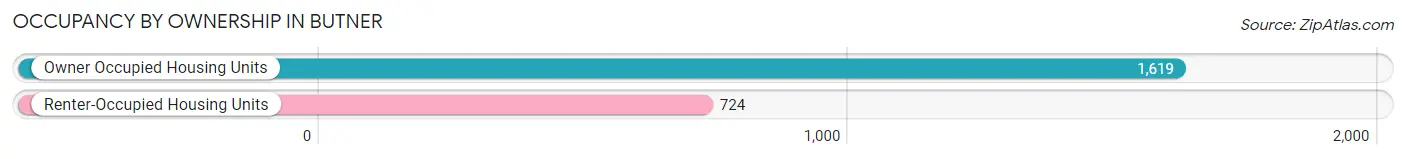
| Occupancy | # Housing Units | % Housing Units |
| Owner Occupied Housing Units | 1,619 | 69.1% |
| Renter-Occupied Housing Units | 724 | 30.9% |
| Total Occupied Housing Units | 2,343 | 100.0% |
Occupancy by Household Size in Butner
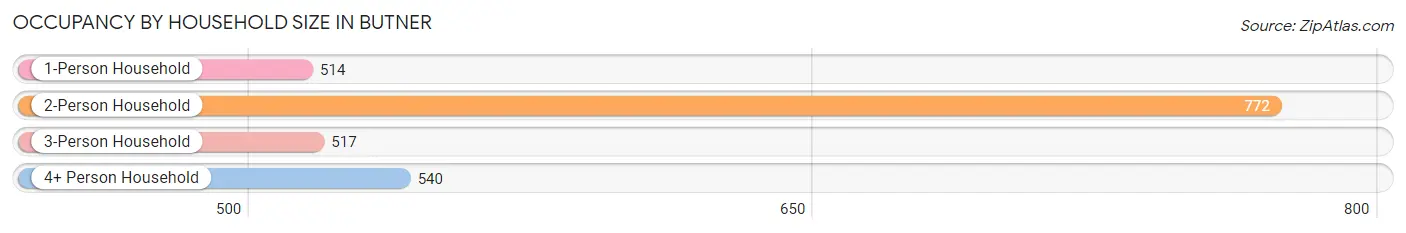
| Household Size | # Housing Units | % Housing Units |
| 1-Person Household | 514 | 21.9% |
| 2-Person Household | 772 | 33.0% |
| 3-Person Household | 517 | 22.1% |
| 4+ Person Household | 540 | 23.1% |
| Total Housing Units | 2,343 | 100.0% |
Occupancy by Ownership by Household Size in Butner
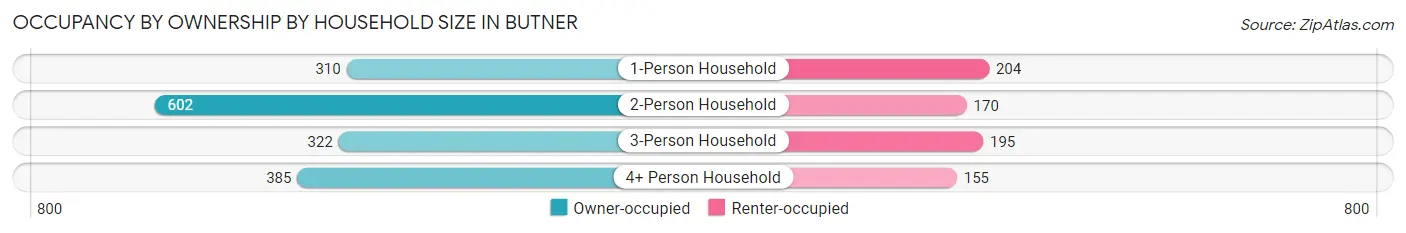
| Household Size | Owner-occupied | Renter-occupied |
| 1-Person Household | 310 (60.3%) | 204 (39.7%) |
| 2-Person Household | 602 (78.0%) | 170 (22.0%) |
| 3-Person Household | 322 (62.3%) | 195 (37.7%) |
| 4+ Person Household | 385 (71.3%) | 155 (28.7%) |
| Total Housing Units | 1,619 (69.1%) | 724 (30.9%) |
Occupancy by Educational Attainment in Butner
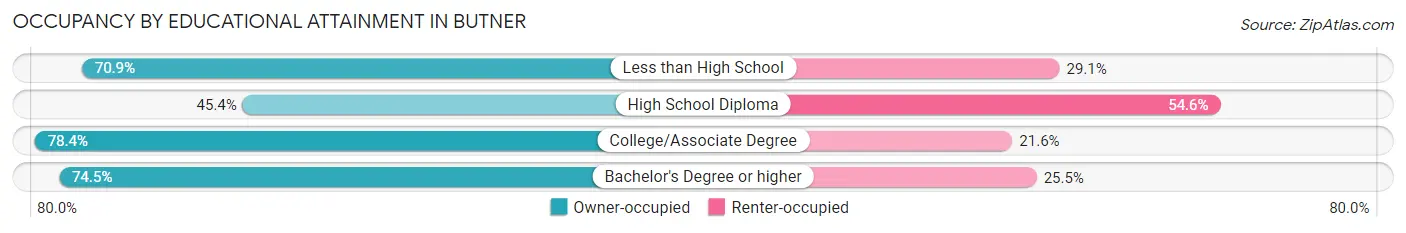
| Household Size | Owner-occupied | Renter-occupied |
| Less than High School | 239 (70.9%) | 98 (29.1%) |
| High School Diploma | 228 (45.4%) | 274 (54.6%) |
| College/Associate Degree | 631 (78.4%) | 174 (21.6%) |
| Bachelor's Degree or higher | 521 (74.5%) | 178 (25.5%) |
Occupancy by Age of Householder in Butner
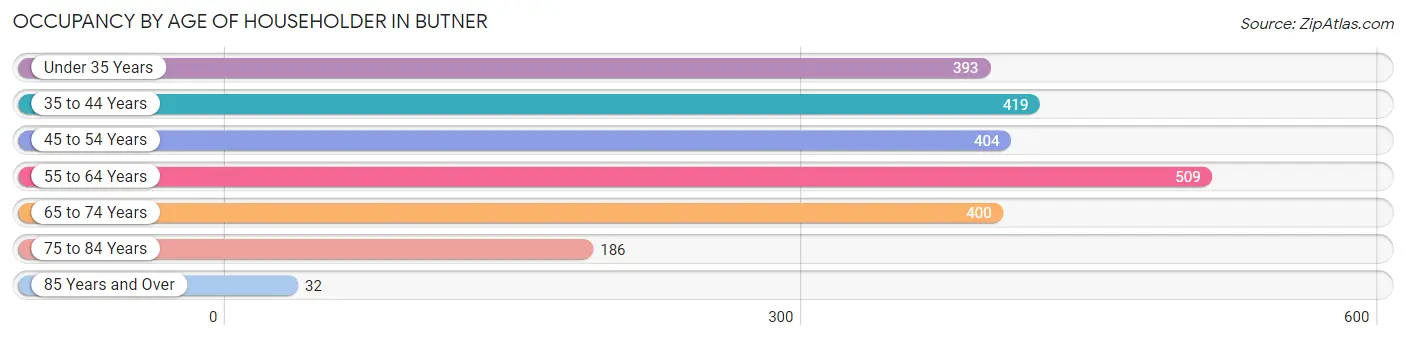
| Age Bracket | # Households | % Households |
| Under 35 Years | 393 | 16.8% |
| 35 to 44 Years | 419 | 17.9% |
| 45 to 54 Years | 404 | 17.2% |
| 55 to 64 Years | 509 | 21.7% |
| 65 to 74 Years | 400 | 17.1% |
| 75 to 84 Years | 186 | 7.9% |
| 85 Years and Over | 32 | 1.4% |
| Total | 2,343 | 100.0% |
Housing Finances in Butner
Median Income by Occupancy in Butner
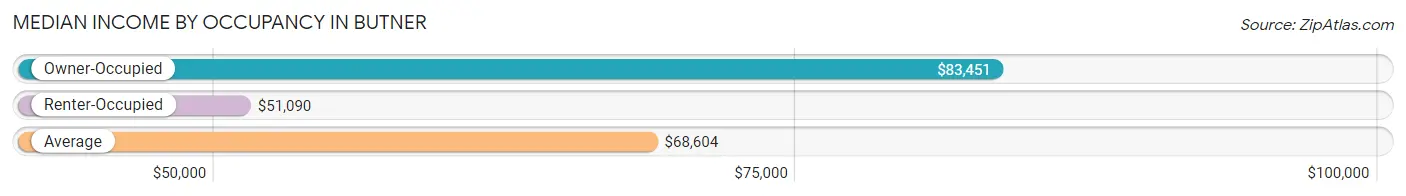
| Occupancy Type | # Households | Median Income |
| Owner-Occupied | 1,619 (69.1%) | $83,451 |
| Renter-Occupied | 724 (30.9%) | $51,090 |
| Average | 2,343 (100.0%) | $68,604 |
Occupancy by Householder Income Bracket in Butner
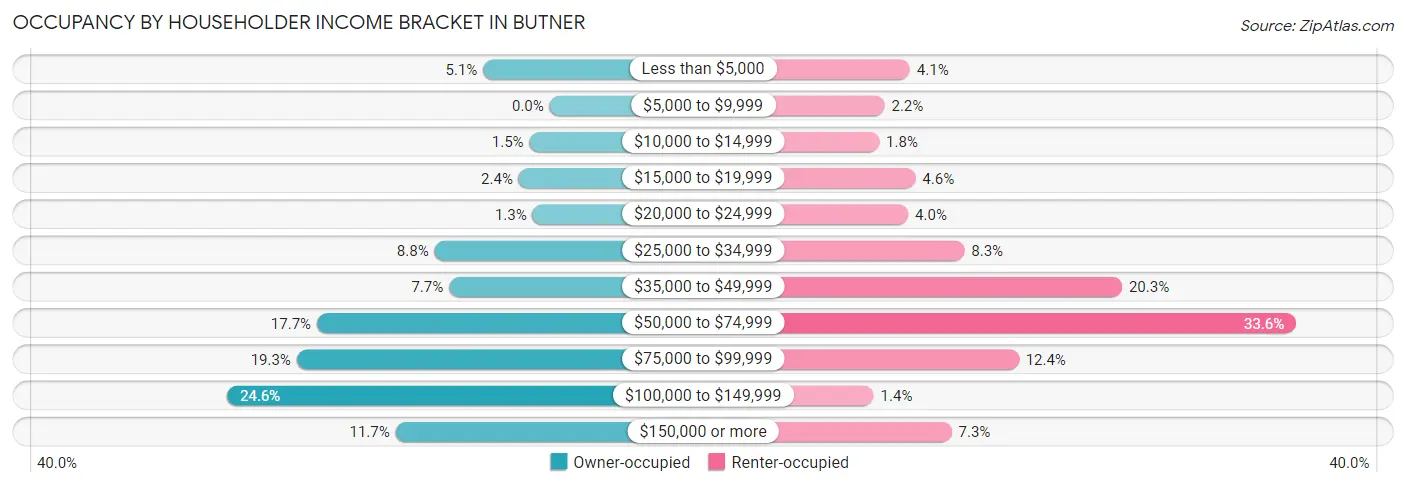
| Income Bracket | Owner-occupied | Renter-occupied |
| Less than $5,000 | 82 (5.1%) | 30 (4.1%) |
| $5,000 to $9,999 | 0 (0.0%) | 16 (2.2%) |
| $10,000 to $14,999 | 25 (1.5%) | 13 (1.8%) |
| $15,000 to $19,999 | 38 (2.4%) | 33 (4.6%) |
| $20,000 to $24,999 | 21 (1.3%) | 29 (4.0%) |
| $25,000 to $34,999 | 142 (8.8%) | 60 (8.3%) |
| $35,000 to $49,999 | 124 (7.7%) | 147 (20.3%) |
| $50,000 to $74,999 | 287 (17.7%) | 243 (33.6%) |
| $75,000 to $99,999 | 312 (19.3%) | 90 (12.4%) |
| $100,000 to $149,999 | 398 (24.6%) | 10 (1.4%) |
| $150,000 or more | 190 (11.7%) | 53 (7.3%) |
| Total | 1,619 (100.0%) | 724 (100.0%) |
Monthly Housing Cost Tiers in Butner
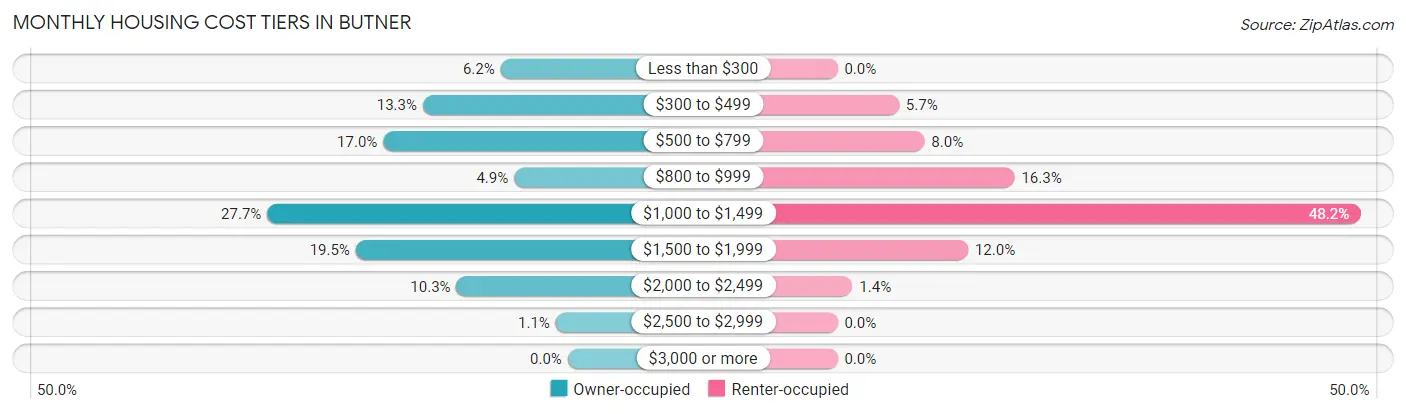
| Monthly Cost | Owner-occupied | Renter-occupied |
| Less than $300 | 100 (6.2%) | 0 (0.0%) |
| $300 to $499 | 216 (13.3%) | 41 (5.7%) |
| $500 to $799 | 275 (17.0%) | 58 (8.0%) |
| $800 to $999 | 80 (4.9%) | 118 (16.3%) |
| $1,000 to $1,499 | 448 (27.7%) | 349 (48.2%) |
| $1,500 to $1,999 | 316 (19.5%) | 87 (12.0%) |
| $2,000 to $2,499 | 166 (10.2%) | 10 (1.4%) |
| $2,500 to $2,999 | 18 (1.1%) | 0 (0.0%) |
| $3,000 or more | 0 (0.0%) | 0 (0.0%) |
| Total | 1,619 (100.0%) | 724 (100.0%) |
Physical Housing Characteristics in Butner
Housing Structures in Butner
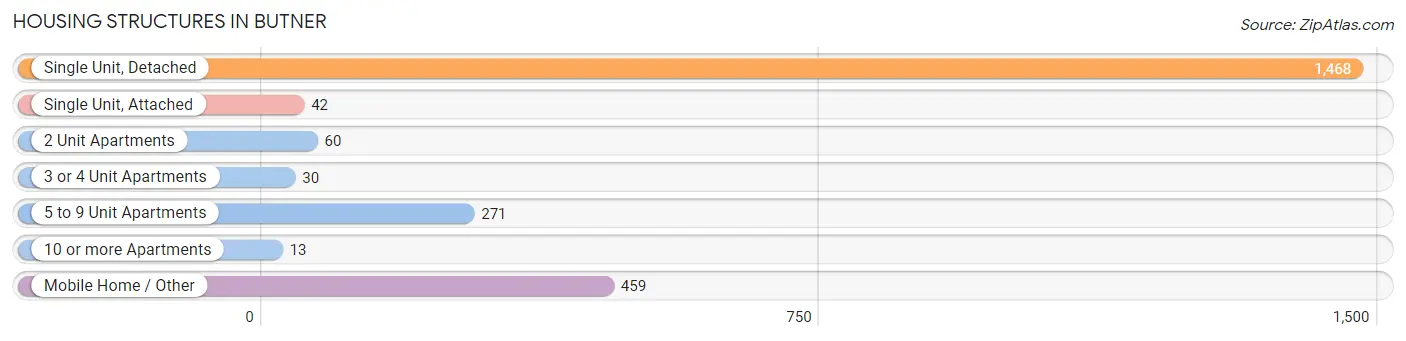
| Structure Type | # Housing Units | % Housing Units |
| Single Unit, Detached | 1,468 | 62.6% |
| Single Unit, Attached | 42 | 1.8% |
| 2 Unit Apartments | 60 | 2.6% |
| 3 or 4 Unit Apartments | 30 | 1.3% |
| 5 to 9 Unit Apartments | 271 | 11.6% |
| 10 or more Apartments | 13 | 0.5% |
| Mobile Home / Other | 459 | 19.6% |
| Total | 2,343 | 100.0% |
Housing Structures by Occupancy in Butner
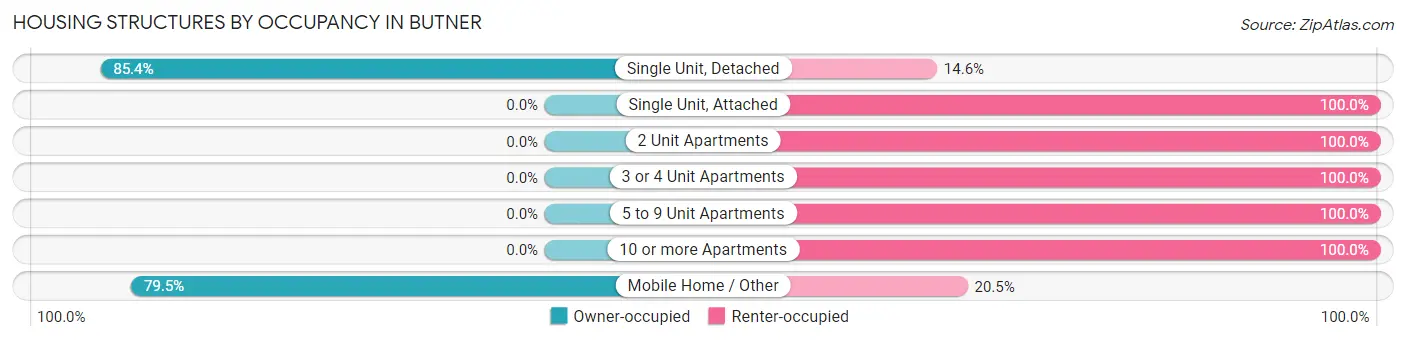
| Structure Type | Owner-occupied | Renter-occupied |
| Single Unit, Detached | 1,254 (85.4%) | 214 (14.6%) |
| Single Unit, Attached | 0 (0.0%) | 42 (100.0%) |
| 2 Unit Apartments | 0 (0.0%) | 60 (100.0%) |
| 3 or 4 Unit Apartments | 0 (0.0%) | 30 (100.0%) |
| 5 to 9 Unit Apartments | 0 (0.0%) | 271 (100.0%) |
| 10 or more Apartments | 0 (0.0%) | 13 (100.0%) |
| Mobile Home / Other | 365 (79.5%) | 94 (20.5%) |
| Total | 1,619 (69.1%) | 724 (30.9%) |
Housing Structures by Number of Rooms in Butner

| Number of Rooms | Owner-occupied | Renter-occupied |
| 1 Room | 0 (0.0%) | 3 (0.4%) |
| 2 or 3 Rooms | 24 (1.5%) | 130 (18.0%) |
| 4 or 5 Rooms | 552 (34.1%) | 484 (66.8%) |
| 6 or 7 Rooms | 689 (42.6%) | 95 (13.1%) |
| 8 or more Rooms | 354 (21.9%) | 12 (1.7%) |
| Total | 1,619 (100.0%) | 724 (100.0%) |
Housing Structure by Heating Type in Butner
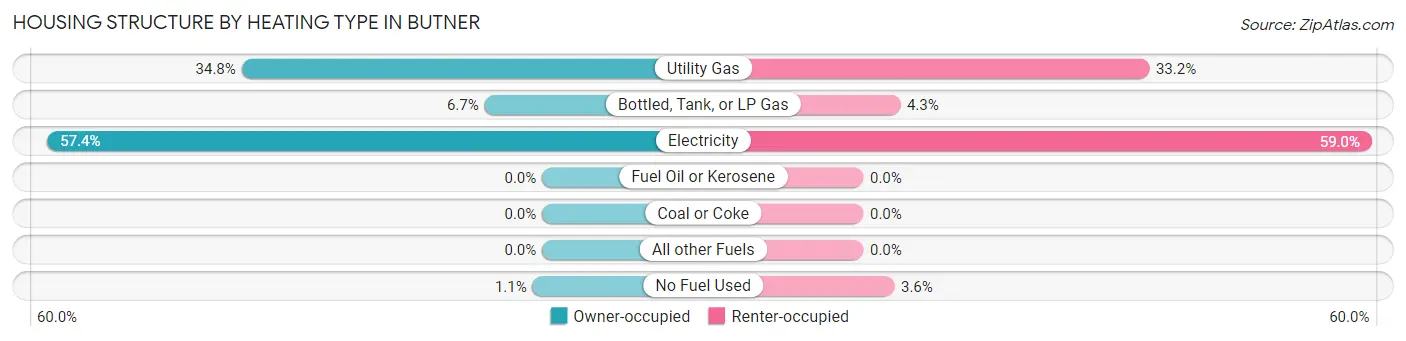
| Heating Type | Owner-occupied | Renter-occupied |
| Utility Gas | 564 (34.8%) | 240 (33.2%) |
| Bottled, Tank, or LP Gas | 108 (6.7%) | 31 (4.3%) |
| Electricity | 929 (57.4%) | 427 (59.0%) |
| Fuel Oil or Kerosene | 0 (0.0%) | 0 (0.0%) |
| Coal or Coke | 0 (0.0%) | 0 (0.0%) |
| All other Fuels | 0 (0.0%) | 0 (0.0%) |
| No Fuel Used | 18 (1.1%) | 26 (3.6%) |
| Total | 1,619 (100.0%) | 724 (100.0%) |
Household Vehicle Usage in Butner
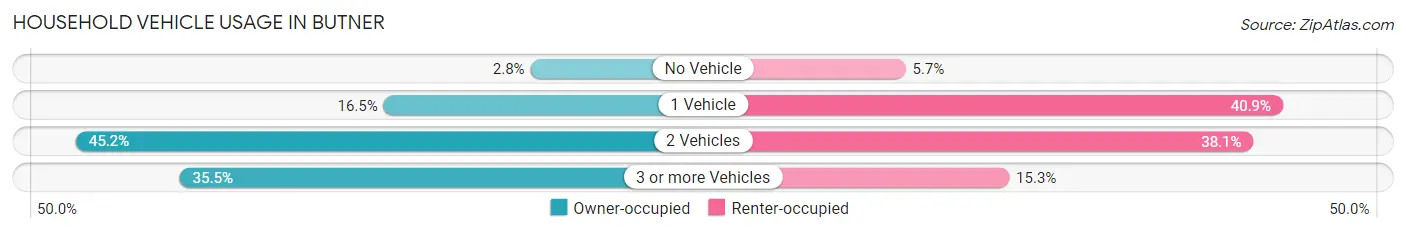
| Vehicles per Household | Owner-occupied | Renter-occupied |
| No Vehicle | 45 (2.8%) | 41 (5.7%) |
| 1 Vehicle | 267 (16.5%) | 296 (40.9%) |
| 2 Vehicles | 732 (45.2%) | 276 (38.1%) |
| 3 or more Vehicles | 575 (35.5%) | 111 (15.3%) |
| Total | 1,619 (100.0%) | 724 (100.0%) |
Real Estate & Mortgages in Butner
Real Estate and Mortgage Overview in Butner
| Characteristic | Without Mortgage | With Mortgage |
| Housing Units | 562 | 1,057 |
| Median Property Value | $62,600 | $220,600 |
| Median Household Income | $43,333 | $181 |
| Monthly Housing Costs | $462 | $0 |
| Real Estate Taxes | - | - |
Property Value by Mortgage Status in Butner
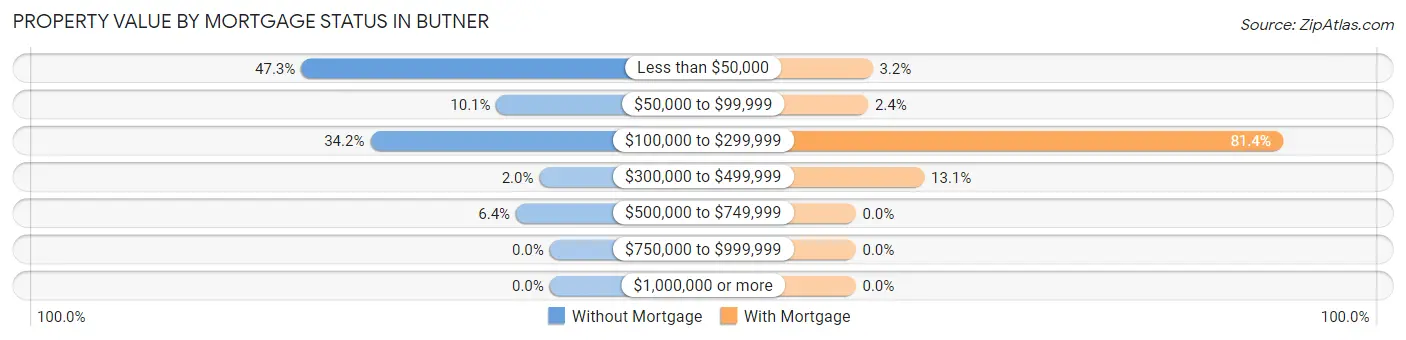
| Property Value | Without Mortgage | With Mortgage |
| Less than $50,000 | 266 (47.3%) | 34 (3.2%) |
| $50,000 to $99,999 | 57 (10.1%) | 25 (2.4%) |
| $100,000 to $299,999 | 192 (34.2%) | 860 (81.4%) |
| $300,000 to $499,999 | 11 (2.0%) | 138 (13.1%) |
| $500,000 to $749,999 | 36 (6.4%) | 0 (0.0%) |
| $750,000 to $999,999 | 0 (0.0%) | 0 (0.0%) |
| $1,000,000 or more | 0 (0.0%) | 0 (0.0%) |
| Total | 562 (100.0%) | 1,057 (100.0%) |
Household Income by Mortgage Status in Butner
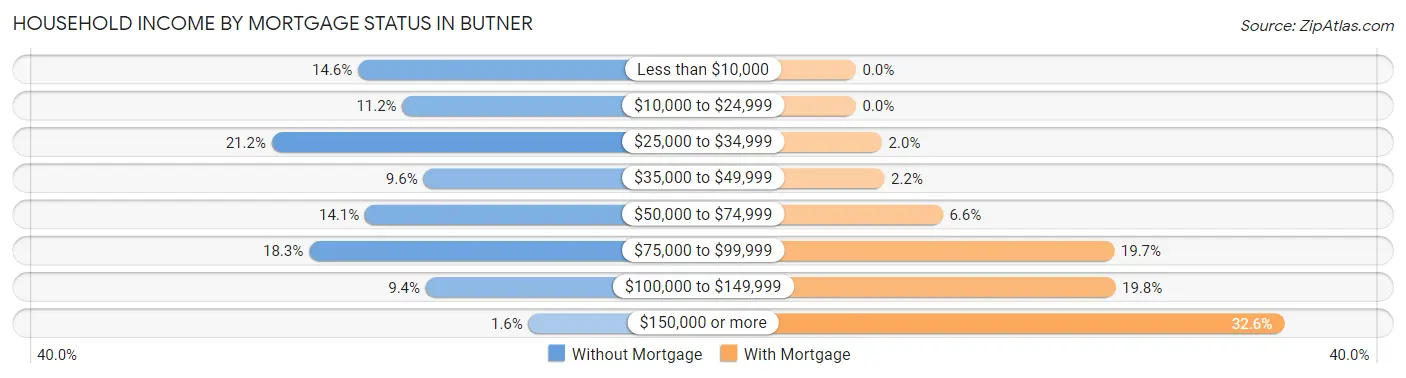
| Household Income | Without Mortgage | With Mortgage |
| Less than $10,000 | 82 (14.6%) | 0 (0.0%) |
| $10,000 to $24,999 | 63 (11.2%) | 0 (0.0%) |
| $25,000 to $34,999 | 119 (21.2%) | 21 (2.0%) |
| $35,000 to $49,999 | 54 (9.6%) | 23 (2.2%) |
| $50,000 to $74,999 | 79 (14.1%) | 70 (6.6%) |
| $75,000 to $99,999 | 103 (18.3%) | 208 (19.7%) |
| $100,000 to $149,999 | 53 (9.4%) | 209 (19.8%) |
| $150,000 or more | 9 (1.6%) | 345 (32.6%) |
| Total | 562 (100.0%) | 1,057 (100.0%) |
Property Value to Household Income Ratio in Butner
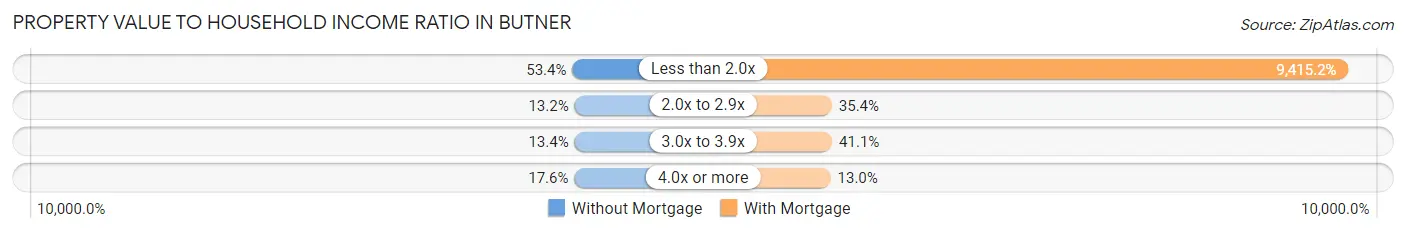
| Value-to-Income Ratio | Without Mortgage | With Mortgage |
| Less than 2.0x | 300 (53.4%) | 99,519 (9,415.2%) |
| 2.0x to 2.9x | 74 (13.2%) | 374 (35.4%) |
| 3.0x to 3.9x | 75 (13.4%) | 434 (41.1%) |
| 4.0x or more | 99 (17.6%) | 137 (13.0%) |
| Total | 562 (100.0%) | 1,057 (100.0%) |
Real Estate Taxes by Mortgage Status in Butner
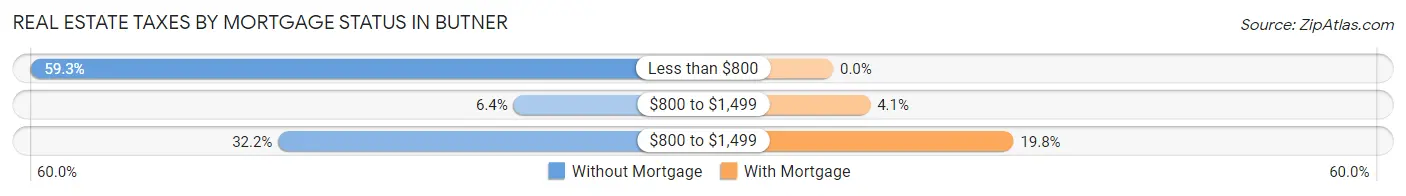
| Property Taxes | Without Mortgage | With Mortgage |
| Less than $800 | 333 (59.3%) | 0 (0.0%) |
| $800 to $1,499 | 36 (6.4%) | 43 (4.1%) |
| $800 to $1,499 | 181 (32.2%) | 209 (19.8%) |
| Total | 562 (100.0%) | 1,057 (100.0%) |
Health & Disability in Butner
Health Insurance Coverage by Age in Butner
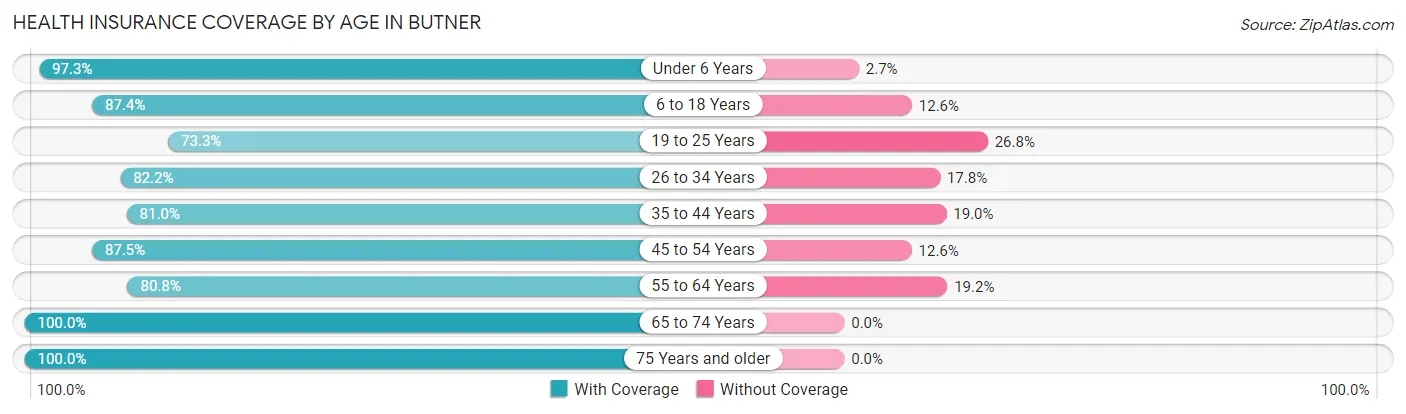
| Age Bracket | With Coverage | Without Coverage |
| Under 6 Years | 610 (97.3%) | 17 (2.7%) |
| 6 to 18 Years | 964 (87.4%) | 139 (12.6%) |
| 19 to 25 Years | 304 (73.3%) | 111 (26.8%) |
| 26 to 34 Years | 663 (82.2%) | 144 (17.8%) |
| 35 to 44 Years | 868 (81.0%) | 204 (19.0%) |
| 45 to 54 Years | 801 (87.5%) | 115 (12.6%) |
| 55 to 64 Years | 846 (80.8%) | 201 (19.2%) |
| 65 to 74 Years | 798 (100.0%) | 0 (0.0%) |
| 75 Years and older | 410 (100.0%) | 0 (0.0%) |
| Total | 6,264 (87.1%) | 931 (12.9%) |
Health Insurance Coverage by Citizenship Status in Butner
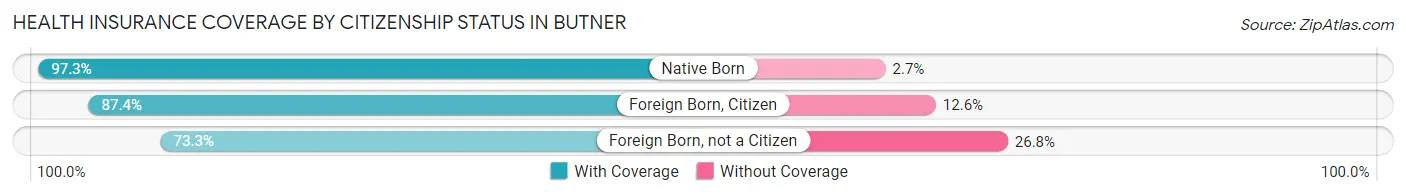
| Citizenship Status | With Coverage | Without Coverage |
| Native Born | 610 (97.3%) | 17 (2.7%) |
| Foreign Born, Citizen | 964 (87.4%) | 139 (12.6%) |
| Foreign Born, not a Citizen | 304 (73.3%) | 111 (26.8%) |
Health Insurance Coverage by Household Income in Butner
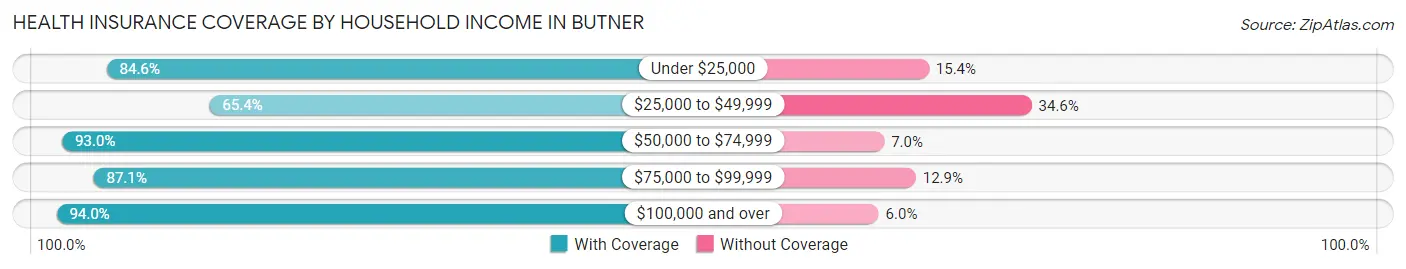
| Household Income | With Coverage | Without Coverage |
| Under $25,000 | 523 (84.6%) | 95 (15.4%) |
| $25,000 to $49,999 | 759 (65.4%) | 402 (34.6%) |
| $50,000 to $74,999 | 1,261 (93.0%) | 95 (7.0%) |
| $75,000 to $99,999 | 1,333 (87.1%) | 198 (12.9%) |
| $100,000 and over | 1,983 (94.0%) | 126 (6.0%) |
Public vs Private Health Insurance Coverage by Age in Butner
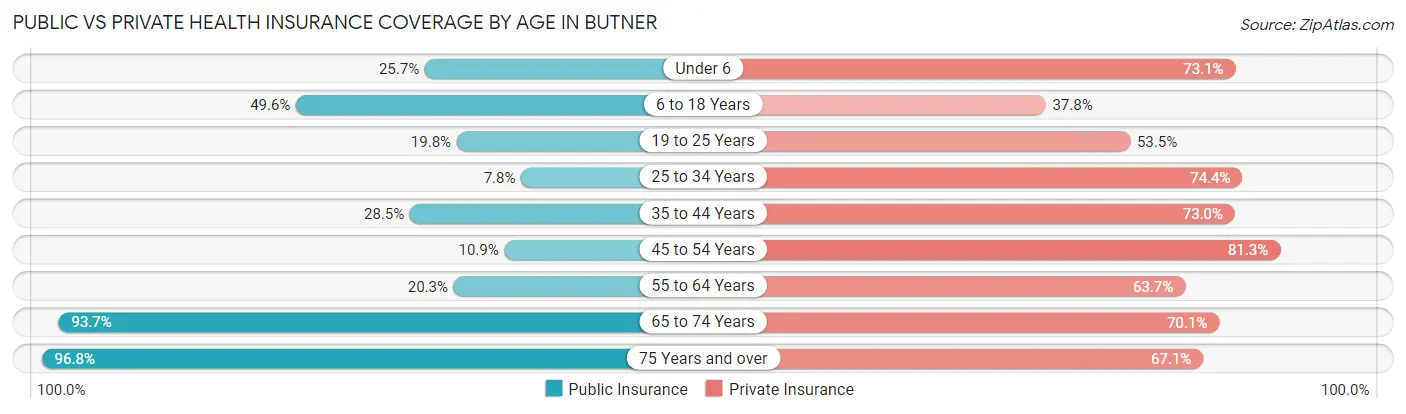
| Age Bracket | Public Insurance | Private Insurance |
| Under 6 | 161 (25.7%) | 458 (73.1%) |
| 6 to 18 Years | 547 (49.6%) | 417 (37.8%) |
| 19 to 25 Years | 82 (19.8%) | 222 (53.5%) |
| 25 to 34 Years | 63 (7.8%) | 600 (74.4%) |
| 35 to 44 Years | 305 (28.4%) | 782 (73.0%) |
| 45 to 54 Years | 100 (10.9%) | 745 (81.3%) |
| 55 to 64 Years | 213 (20.3%) | 667 (63.7%) |
| 65 to 74 Years | 748 (93.7%) | 559 (70.1%) |
| 75 Years and over | 397 (96.8%) | 275 (67.1%) |
| Total | 2,616 (36.4%) | 4,725 (65.7%) |
Disability Status by Sex by Age in Butner
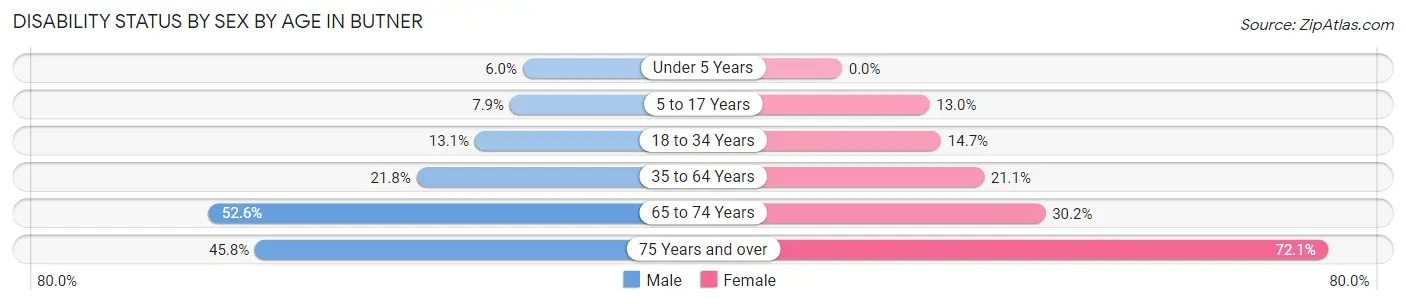
| Age Bracket | Male | Female |
| Under 5 Years | 20 (6.0%) | 0 (0.0%) |
| 5 to 17 Years | 45 (7.9%) | 76 (13.0%) |
| 18 to 34 Years | 62 (13.1%) | 111 (14.7%) |
| 35 to 64 Years | 338 (21.8%) | 313 (21.1%) |
| 65 to 74 Years | 190 (52.6%) | 132 (30.2%) |
| 75 Years and over | 76 (45.8%) | 176 (72.1%) |
Disability Class by Sex by Age in Butner
Disability Class: Hearing Difficulty
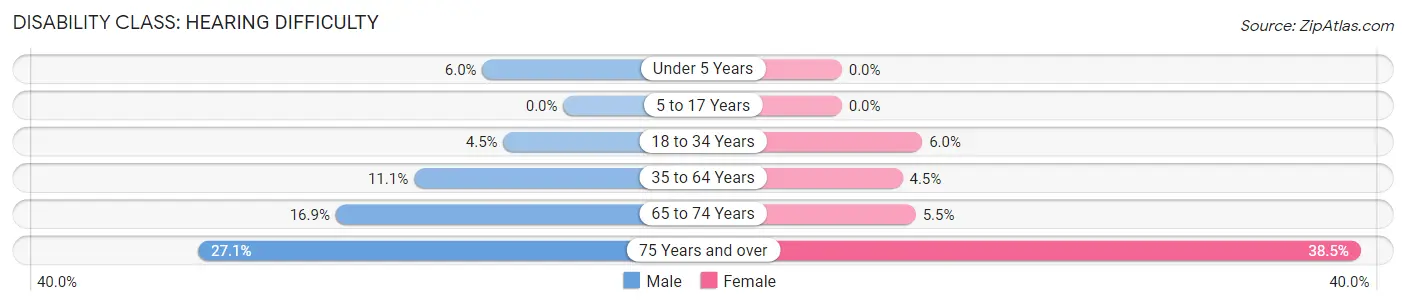
| Age Bracket | Male | Female |
| Under 5 Years | 20 (6.0%) | 0 (0.0%) |
| 5 to 17 Years | 0 (0.0%) | 0 (0.0%) |
| 18 to 34 Years | 21 (4.4%) | 45 (6.0%) |
| 35 to 64 Years | 172 (11.1%) | 67 (4.5%) |
| 65 to 74 Years | 61 (16.9%) | 24 (5.5%) |
| 75 Years and over | 45 (27.1%) | 94 (38.5%) |
Disability Class: Vision Difficulty
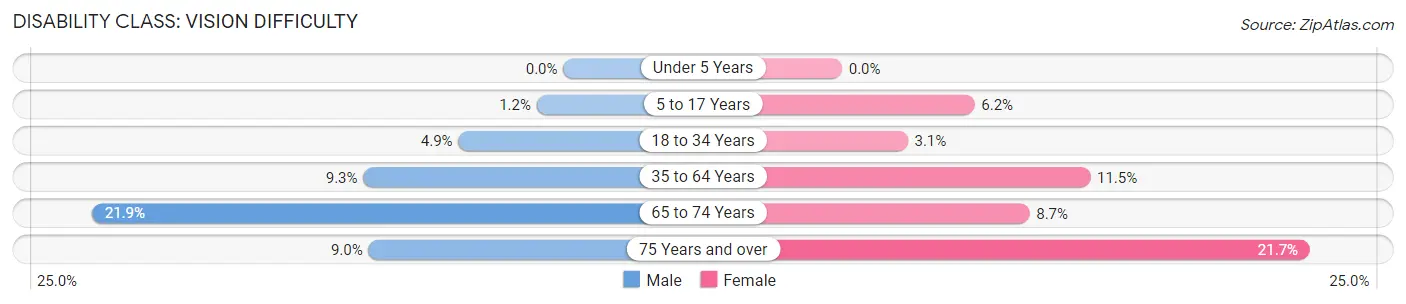
| Age Bracket | Male | Female |
| Under 5 Years | 0 (0.0%) | 0 (0.0%) |
| 5 to 17 Years | 7 (1.2%) | 36 (6.1%) |
| 18 to 34 Years | 23 (4.9%) | 23 (3.0%) |
| 35 to 64 Years | 144 (9.3%) | 171 (11.5%) |
| 65 to 74 Years | 79 (21.9%) | 38 (8.7%) |
| 75 Years and over | 15 (9.0%) | 53 (21.7%) |
Disability Class: Cognitive Difficulty
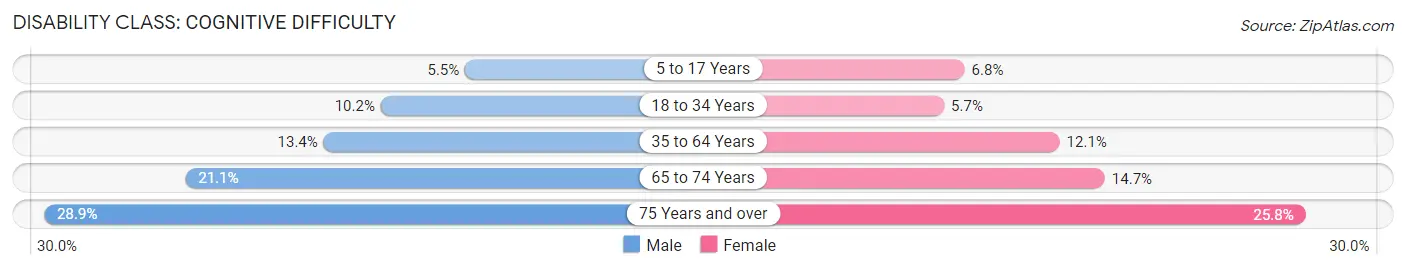
| Age Bracket | Male | Female |
| 5 to 17 Years | 31 (5.5%) | 40 (6.8%) |
| 18 to 34 Years | 48 (10.2%) | 43 (5.7%) |
| 35 to 64 Years | 207 (13.4%) | 180 (12.1%) |
| 65 to 74 Years | 76 (21.0%) | 64 (14.6%) |
| 75 Years and over | 48 (28.9%) | 63 (25.8%) |
Disability Class: Ambulatory Difficulty
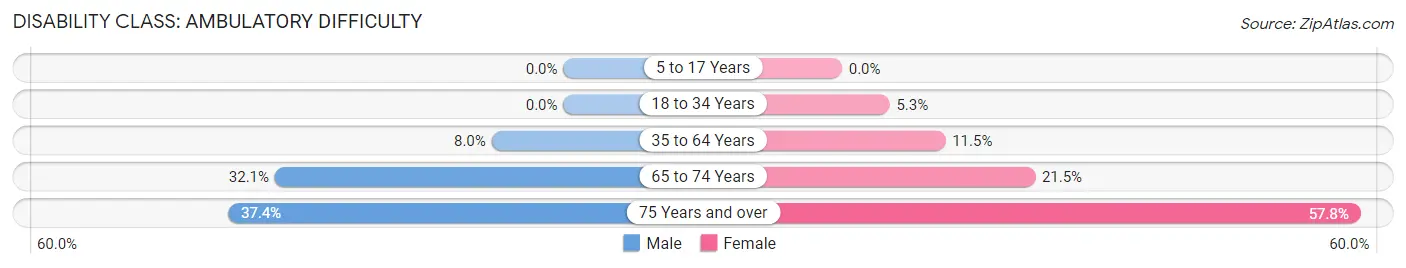
| Age Bracket | Male | Female |
| 5 to 17 Years | 0 (0.0%) | 0 (0.0%) |
| 18 to 34 Years | 0 (0.0%) | 40 (5.3%) |
| 35 to 64 Years | 124 (8.0%) | 171 (11.5%) |
| 65 to 74 Years | 116 (32.1%) | 94 (21.5%) |
| 75 Years and over | 62 (37.3%) | 141 (57.8%) |
Disability Class: Self-Care Difficulty
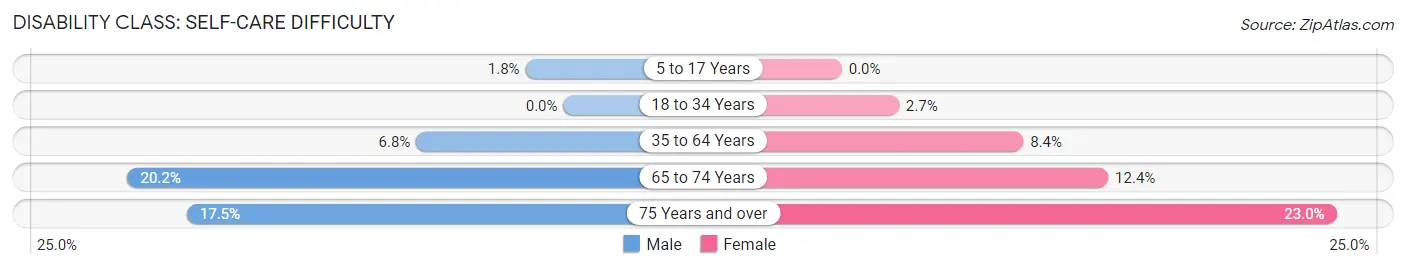
| Age Bracket | Male | Female |
| 5 to 17 Years | 10 (1.8%) | 0 (0.0%) |
| 18 to 34 Years | 0 (0.0%) | 20 (2.6%) |
| 35 to 64 Years | 106 (6.8%) | 125 (8.4%) |
| 65 to 74 Years | 73 (20.2%) | 54 (12.4%) |
| 75 Years and over | 29 (17.5%) | 56 (23.0%) |
Technology Access in Butner
Computing Device Access in Butner
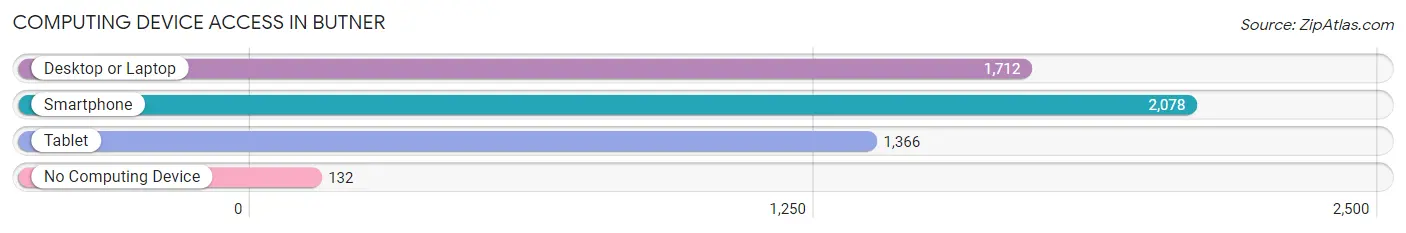
| Device Type | # Households | % Households |
| Desktop or Laptop | 1,712 | 73.1% |
| Smartphone | 2,078 | 88.7% |
| Tablet | 1,366 | 58.3% |
| No Computing Device | 132 | 5.6% |
| Total | 2,343 | 100.0% |
Internet Access in Butner
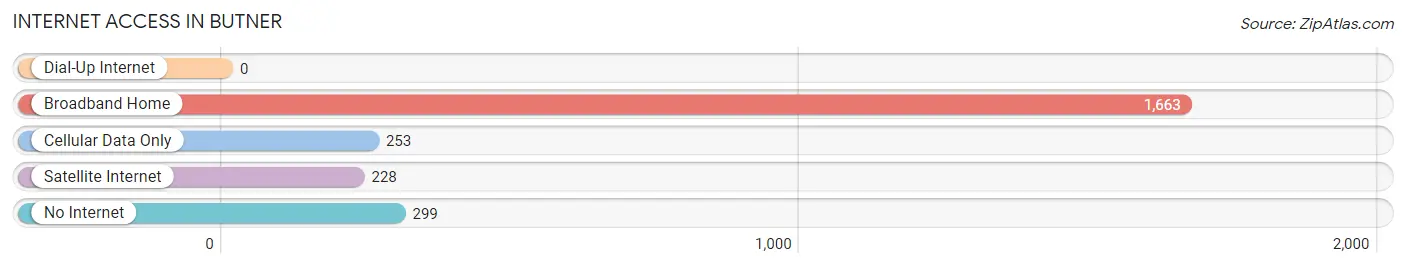
| Internet Type | # Households | % Households |
| Dial-Up Internet | 0 | 0.0% |
| Broadband Home | 1,663 | 71.0% |
| Cellular Data Only | 253 | 10.8% |
| Satellite Internet | 228 | 9.7% |
| No Internet | 299 | 12.8% |
| Total | 2,343 | 100.0% |
Butner Summary
Butner, North Carolina is a small town located in Granville County, North Carolina. It is situated about 25 miles north of Raleigh, the state capital. The town was founded in 1876 and was named after William Butner, a local landowner. The population of Butner was 3,717 at the 2010 census.
Geography
Butner is located at 36°14'25" North, 78°45'45" West (36.240278, -78.7625). It is situated in the northern part of Granville County, about 25 miles north of Raleigh. The town is located in the Piedmont region of North Carolina, and is surrounded by rolling hills and forests. The terrain is mostly flat, with some hills and valleys. The town is located near the Neuse River, which provides a source of water for the town.
Climate
Butner has a humid subtropical climate, with hot, humid summers and mild winters. The average annual temperature is around 61°F (16°C). The average annual precipitation is around 45 inches (114 cm).
Demographics
As of the 2010 census, the population of Butner was 3,717. The racial makeup of the town was 79.3% White, 15.2% African American, 0.3% Native American, 0.7% Asian, 0.1% Pacific Islander, and 4.4% from other races. Hispanic or Latino of any race were 3.2% of the population.
Economy
Butner is home to several businesses, including a number of small retail stores, restaurants, and other services. The town is also home to a number of manufacturing companies, including a paper mill, a furniture factory, and a plastics factory. The town is also home to a number of government offices, including the Butner Federal Correctional Complex, which houses several federal prisons.
The town is served by the Butner-Stem Railroad, which provides freight service to the town. The town is also served by the Raleigh-Durham International Airport, which is located about 25 miles south of Butner.
History
Butner was founded in 1876 and was named after William Butner, a local landowner. The town was originally a small farming community, but grew rapidly in the early 20th century due to the construction of the Butner-Stem Railroad. The railroad provided a link to the larger cities of Raleigh and Durham, and allowed the town to become a center for manufacturing and industry.
In the mid-20th century, the town was home to a number of military installations, including Camp Butner, which was used as a training center for the U.S. Army during World War II. The town was also home to the Butner Federal Correctional Complex, which opened in the 1950s and is still in operation today.
Today, Butner is a small town with a population of just over 3,700. The town is home to a number of businesses, including manufacturing companies, retail stores, restaurants, and other services. The town is also home to a number of government offices, including the Butner Federal Correctional Complex.
Common Questions
What is Per Capita Income in Butner?
Per Capita income in Butner is $24,658.
What is the Median Family Income in Butner?
Median Family Income in Butner is $82,039.
What is the Median Household income in Butner?
Median Household Income in Butner is $68,604.
What is Income or Wage Gap in Butner?
Income or Wage Gap in Butner is 6.8%.
Women in Butner earn 93.2 cents for every dollar earned by a man.
What is Inequality or Gini Index in Butner?
Inequality or Gini Index in Butner is 0.37.
What is the Total Population of Butner?
Total Population of Butner is 8,374.
What is the Total Male Population of Butner?
Total Male Population of Butner is 4,614.
What is the Total Female Population of Butner?
Total Female Population of Butner is 3,760.
What is the Ratio of Males per 100 Females in Butner?
There are 122.71 Males per 100 Females in Butner.
What is the Ratio of Females per 100 Males in Butner?
There are 81.49 Females per 100 Males in Butner.
What is the Median Population Age in Butner?
Median Population Age in Butner is 41.2 Years.
What is the Average Family Size in Butner
Average Family Size in Butner is 3.4 People.
What is the Average Household Size in Butner
Average Household Size in Butner is 2.9 People.
How Large is the Labor Force in Butner?
There are 3,239 People in the Labor Forcein in Butner.
What is the Percentage of People in the Labor Force in Butner?
48.0% of People are in the Labor Force in Butner.
What is the Unemployment Rate in Butner?
Unemployment Rate in Butner is 6.1%.