Elm City, NC Map & Demographics
Elm City Map
Elm City Overview
$25,503
PER CAPITA INCOME
$60,952
AVG FAMILY INCOME
$48,125
AVG HOUSEHOLD INCOME
23.1%
WAGE / INCOME GAP [ % ]
76.9¢/ $1
WAGE / INCOME GAP [ $ ]
0.44
INEQUALITY / GINI INDEX
1,157
TOTAL POPULATION
626
MALE POPULATION
531
FEMALE POPULATION
117.89
MALES / 100 FEMALES
84.82
FEMALES / 100 MALES
48.0
MEDIAN AGE
3.0
AVG FAMILY SIZE
2.4
AVG HOUSEHOLD SIZE
495
LABOR FORCE [ PEOPLE ]
48.4%
PERCENT IN LABOR FORCE
6.3%
UNEMPLOYMENT RATE
Elm City Zip Codes
Elm City Area Codes
Income in Elm City
Income Overview in Elm City
Per Capita Income in Elm City is $25,503, while median incomes of families and households are $60,952 and $48,125 respectively.
| Characteristic | Number | Measure |
| Per Capita Income | 1,157 | $25,503 |
| Median Family Income | 332 | $60,952 |
| Mean Family Income | 332 | $71,596 |
| Median Household Income | 475 | $48,125 |
| Mean Household Income | 475 | $57,383 |
| Income Deficit | 332 | $0 |
| Wage / Income Gap (%) | 1,157 | 23.12% |
| Wage / Income Gap ($) | 1,157 | 76.88¢ per $1 |
| Gini / Inequality Index | 1,157 | 0.44 |
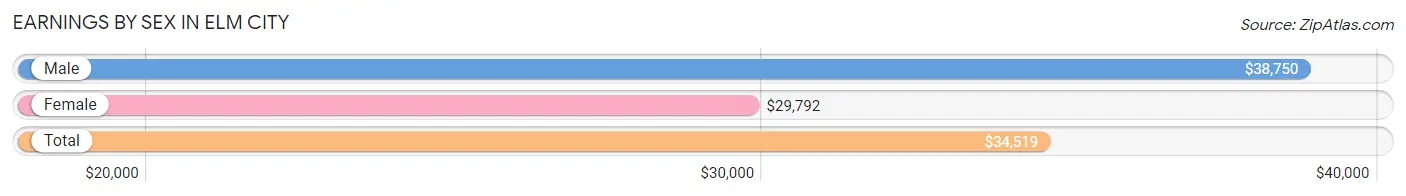
Earnings by Sex in Elm City
Average Earnings in Elm City are $34,519, $38,750 for men and $29,792 for women, a difference of 23.1%.
| Sex | Number | Average Earnings |
| Male | 277 (53.4%) | $38,750 |
| Female | 242 (46.6%) | $29,792 |
| Total | 519 (100.0%) | $34,519 |
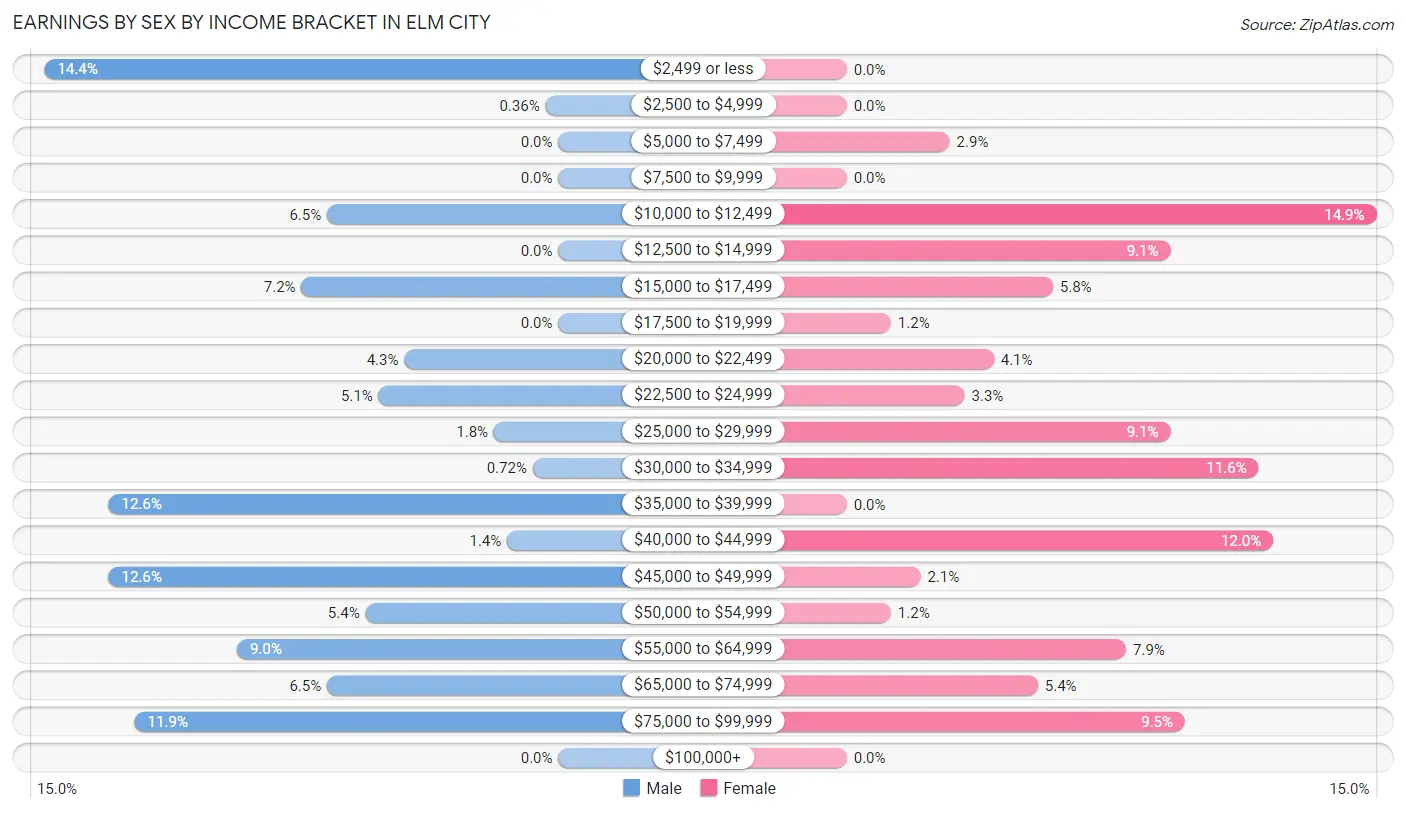
Earnings by Sex by Income Bracket in Elm City
The most common earnings brackets in Elm City are $2,499 or less for men (40 | 14.4%) and $10,000 to $12,499 for women (36 | 14.9%).
| Income | Male | Female |
| $2,499 or less | 40 (14.4%) | 0 (0.0%) |
| $2,500 to $4,999 | 1 (0.4%) | 0 (0.0%) |
| $5,000 to $7,499 | 0 (0.0%) | 7 (2.9%) |
| $7,500 to $9,999 | 0 (0.0%) | 0 (0.0%) |
| $10,000 to $12,499 | 18 (6.5%) | 36 (14.9%) |
| $12,500 to $14,999 | 0 (0.0%) | 22 (9.1%) |
| $15,000 to $17,499 | 20 (7.2%) | 14 (5.8%) |
| $17,500 to $19,999 | 0 (0.0%) | 3 (1.2%) |
| $20,000 to $22,499 | 12 (4.3%) | 10 (4.1%) |
| $22,500 to $24,999 | 14 (5.1%) | 8 (3.3%) |
| $25,000 to $29,999 | 5 (1.8%) | 22 (9.1%) |
| $30,000 to $34,999 | 2 (0.7%) | 28 (11.6%) |
| $35,000 to $39,999 | 35 (12.6%) | 0 (0.0%) |
| $40,000 to $44,999 | 4 (1.4%) | 29 (12.0%) |
| $45,000 to $49,999 | 35 (12.6%) | 5 (2.1%) |
| $50,000 to $54,999 | 15 (5.4%) | 3 (1.2%) |
| $55,000 to $64,999 | 25 (9.0%) | 19 (7.9%) |
| $65,000 to $74,999 | 18 (6.5%) | 13 (5.4%) |
| $75,000 to $99,999 | 33 (11.9%) | 23 (9.5%) |
| $100,000+ | 0 (0.0%) | 0 (0.0%) |
| Total | 277 (100.0%) | 242 (100.0%) |
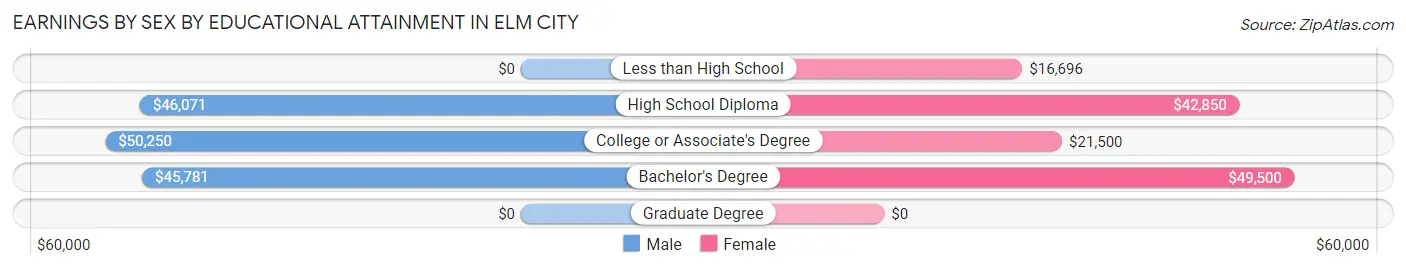
Earnings by Sex by Educational Attainment in Elm City
Average earnings in Elm City are $45,750 for men and $31,333 for women, a difference of 31.5%. Men with an educational attainment of college or associate's degree enjoy the highest average annual earnings of $50,250, while those with bachelor's degree education earn the least with $45,781. Women with an educational attainment of bachelor's degree earn the most with the average annual earnings of $49,500, while those with less than high school education have the smallest earnings of $16,696.
| Educational Attainment | Male Income | Female Income |
| Less than High School | - | - |
| High School Diploma | $46,071 | $42,850 |
| College or Associate's Degree | $50,250 | $21,500 |
| Bachelor's Degree | $45,781 | $49,500 |
| Graduate Degree | - | - |
| Total | $45,750 | $31,333 |
Family Income in Elm City
Family Income Brackets in Elm City
According to the Elm City family income data, there are 88 families falling into the $50,000 to $74,999 income range, which is the most common income bracket and makes up 26.5% of all families.
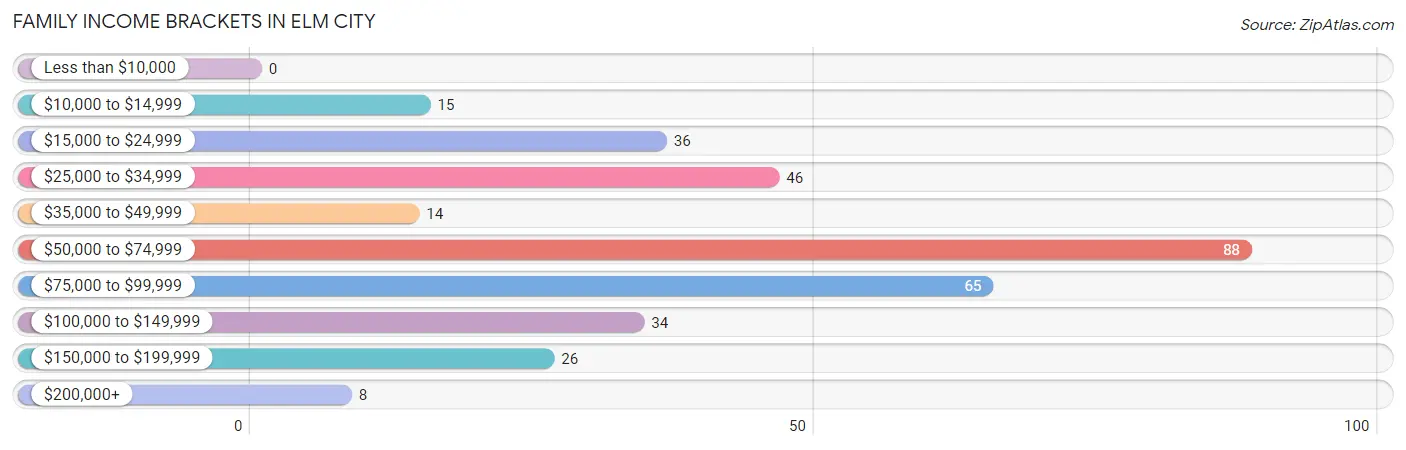
| Income Bracket | # Families | % Families |
| Less than $10,000 | 0 | 0.0% |
| $10,000 to $14,999 | 15 | 4.5% |
| $15,000 to $24,999 | 36 | 10.8% |
| $25,000 to $34,999 | 46 | 13.9% |
| $35,000 to $49,999 | 14 | 4.2% |
| $50,000 to $74,999 | 88 | 26.5% |
| $75,000 to $99,999 | 65 | 19.6% |
| $100,000 to $149,999 | 34 | 10.2% |
| $150,000 to $199,999 | 26 | 7.8% |
| $200,000+ | 8 | 2.4% |
Family Income by Famaliy Size in Elm City
3-person families (85 | 25.6%) account for the highest median family income in Elm City with $79,479 per family, while 2-person families (181 | 54.5%) have the highest median income of $26,562 per family member.
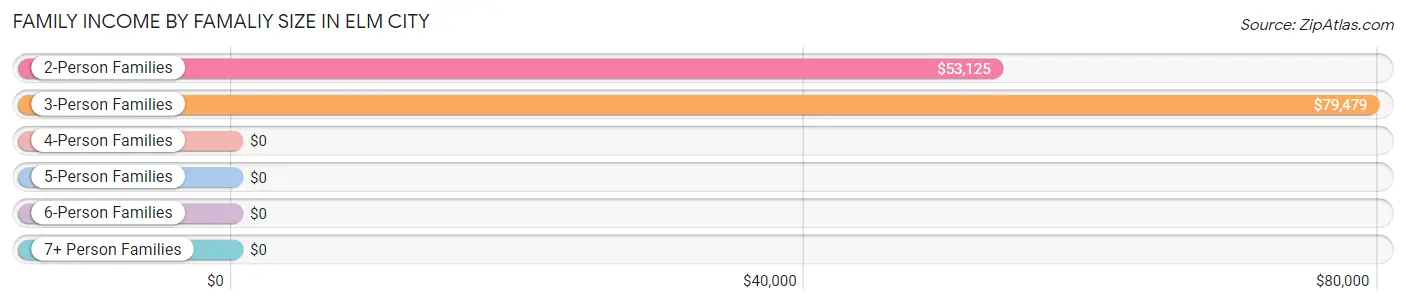
| Income Bracket | # Families | Median Income |
| 2-Person Families | 181 (54.5%) | $53,125 |
| 3-Person Families | 85 (25.6%) | $79,479 |
| 4-Person Families | 50 (15.1%) | $0 |
| 5-Person Families | 0 (0.0%) | $0 |
| 6-Person Families | 16 (4.8%) | $0 |
| 7+ Person Families | 0 (0.0%) | $0 |
| Total | 332 (100.0%) | $60,952 |
Family Income by Number of Earners in Elm City
The median family income in Elm City is $60,952, with families comprising 3+ earners (32) having the highest median family income of $131,667, while families with no earners (65) have the lowest median family income of $50,446, accounting for 9.6% and 19.6% of families, respectively.
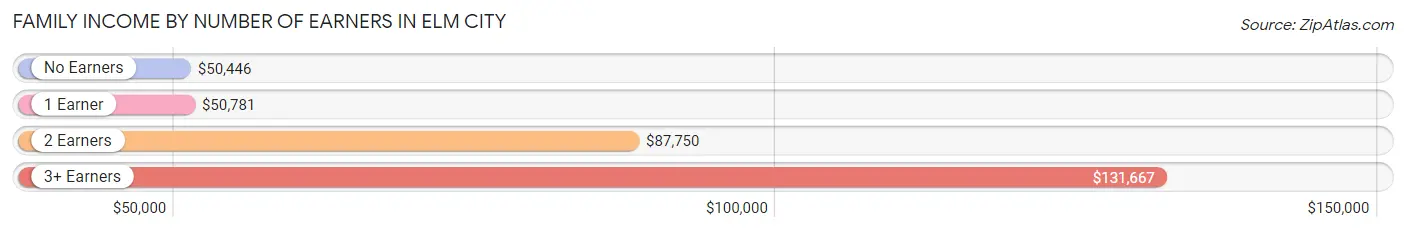
| Number of Earners | # Families | Median Income |
| No Earners | 65 (19.6%) | $50,446 |
| 1 Earner | 152 (45.8%) | $50,781 |
| 2 Earners | 83 (25.0%) | $87,750 |
| 3+ Earners | 32 (9.6%) | $131,667 |
| Total | 332 (100.0%) | $60,952 |
Household Income in Elm City
Household Income Brackets in Elm City
With 97 households falling in the category, the $50,000 to $74,999 income range is the most frequent in Elm City, accounting for 20.4% of all households. In contrast, only 8 households (1.7%) fall into the $200,000+ income bracket, making it the least populous group.
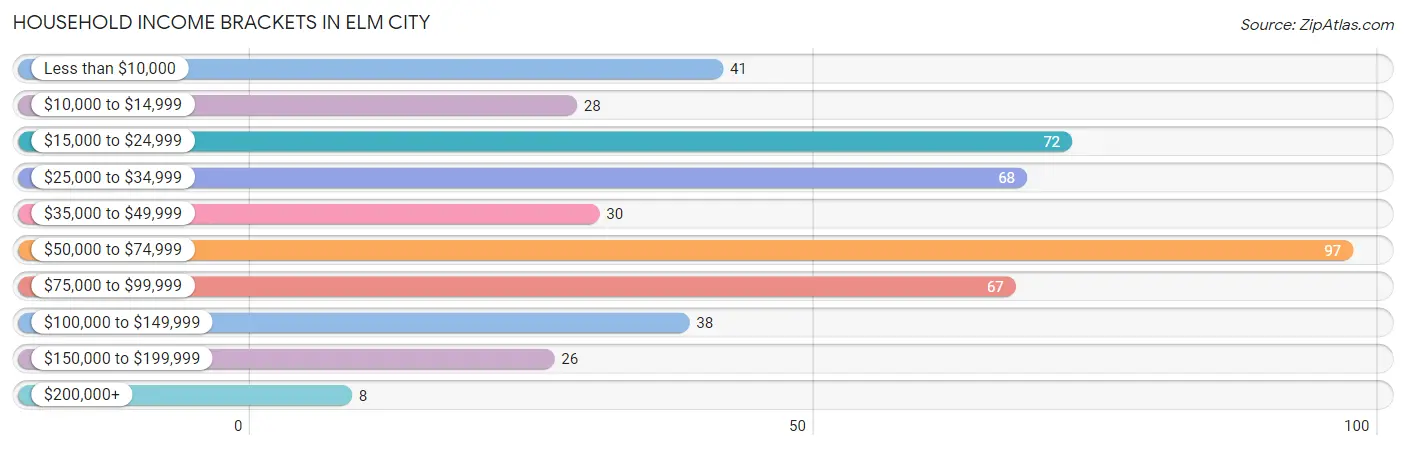
| Income Bracket | # Households | % Households |
| Less than $10,000 | 41 | 8.6% |
| $10,000 to $14,999 | 28 | 5.9% |
| $15,000 to $24,999 | 72 | 15.2% |
| $25,000 to $34,999 | 68 | 14.3% |
| $35,000 to $49,999 | 30 | 6.3% |
| $50,000 to $74,999 | 97 | 20.4% |
| $75,000 to $99,999 | 67 | 14.1% |
| $100,000 to $149,999 | 38 | 8.0% |
| $150,000 to $199,999 | 26 | 5.5% |
| $200,000+ | 8 | 1.7% |
Household Income by Householder Age in Elm City
The median household income in Elm City is $48,125, with the highest median household income of $70,357 found in the 45 to 64 years age bracket for the primary householder. A total of 186 households (39.2%) fall into this category.
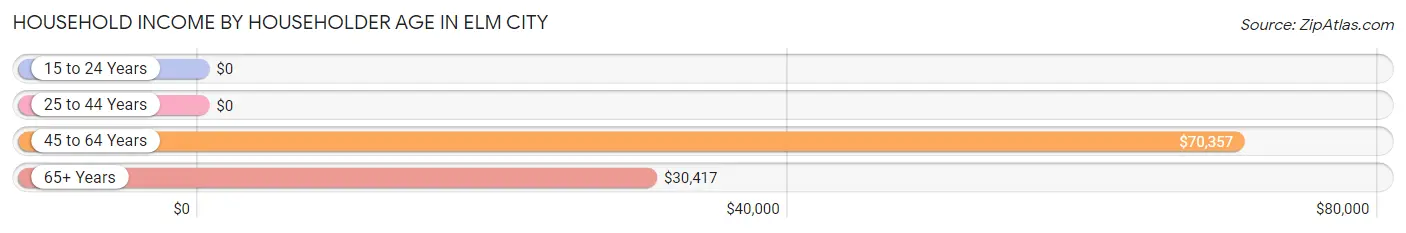
| Income Bracket | # Households | Median Income |
| 15 to 24 Years | 0 (0.0%) | $0 |
| 25 to 44 Years | 77 (16.2%) | $0 |
| 45 to 64 Years | 186 (39.2%) | $70,357 |
| 65+ Years | 212 (44.6%) | $30,417 |
| Total | 475 (100.0%) | $48,125 |
Poverty in Elm City
Income Below Poverty by Sex and Age in Elm City
With 17.2% poverty level for males and 24.9% for females among the residents of Elm City, 16 and 17 year old males and 6 to 11 year old females are the most vulnerable to poverty, with 35 males (53.8%) and 14 females (87.5%) in their respective age groups living below the poverty level.
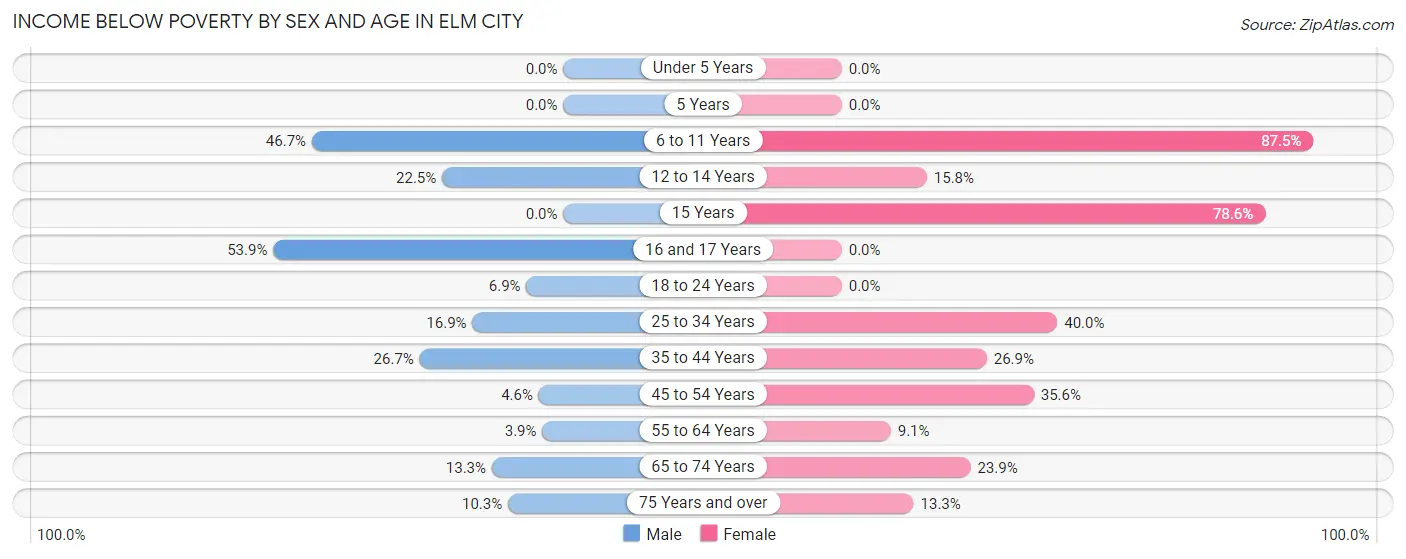
| Age Bracket | Male | Female |
| Under 5 Years | 0 (0.0%) | 0 (0.0%) |
| 5 Years | 0 (0.0%) | 0 (0.0%) |
| 6 to 11 Years | 7 (46.7%) | 14 (87.5%) |
| 12 to 14 Years | 9 (22.5%) | 3 (15.8%) |
| 15 Years | 0 (0.0%) | 11 (78.6%) |
| 16 and 17 Years | 35 (53.8%) | 0 (0.0%) |
| 18 to 24 Years | 5 (6.9%) | 0 (0.0%) |
| 25 to 34 Years | 13 (16.9%) | 14 (40.0%) |
| 35 to 44 Years | 16 (26.7%) | 14 (26.9%) |
| 45 to 54 Years | 3 (4.5%) | 36 (35.6%) |
| 55 to 64 Years | 3 (3.9%) | 9 (9.1%) |
| 65 to 74 Years | 13 (13.3%) | 27 (23.9%) |
| 75 Years and over | 4 (10.3%) | 4 (13.3%) |
| Total | 108 (17.2%) | 132 (24.9%) |
Income Above Poverty by Sex and Age in Elm City
According to the poverty statistics in Elm City, males aged under 5 years and females aged under 5 years are the age groups that are most secure financially, with 100.0% of males and 100.0% of females in these age groups living above the poverty line.
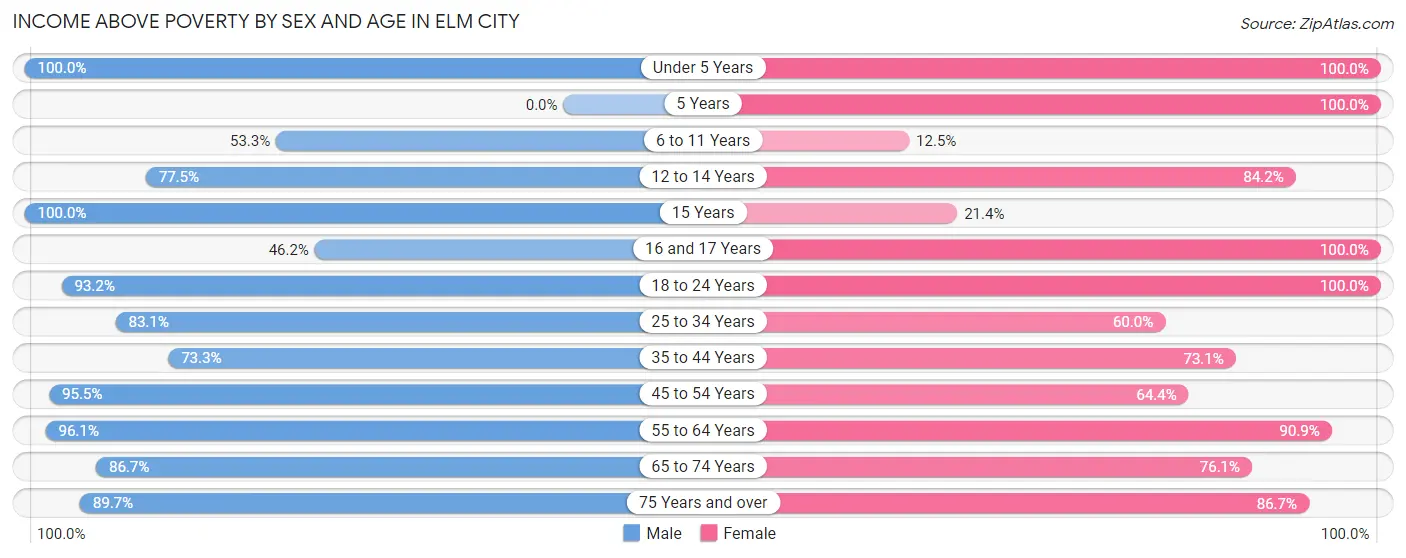
| Age Bracket | Male | Female |
| Under 5 Years | 9 (100.0%) | 13 (100.0%) |
| 5 Years | 0 (0.0%) | 2 (100.0%) |
| 6 to 11 Years | 8 (53.3%) | 2 (12.5%) |
| 12 to 14 Years | 31 (77.5%) | 16 (84.2%) |
| 15 Years | 7 (100.0%) | 3 (21.4%) |
| 16 and 17 Years | 30 (46.2%) | 1 (100.0%) |
| 18 to 24 Years | 68 (93.1%) | 36 (100.0%) |
| 25 to 34 Years | 64 (83.1%) | 21 (60.0%) |
| 35 to 44 Years | 44 (73.3%) | 38 (73.1%) |
| 45 to 54 Years | 63 (95.5%) | 65 (64.4%) |
| 55 to 64 Years | 74 (96.1%) | 90 (90.9%) |
| 65 to 74 Years | 85 (86.7%) | 86 (76.1%) |
| 75 Years and over | 35 (89.7%) | 26 (86.7%) |
| Total | 518 (82.8%) | 399 (75.1%) |
Income Below Poverty Among Married-Couple Families in Elm City
The poverty statistics for married-couple families in Elm City show that 6.7% or 16 of the total 238 families live below the poverty line. Families with 1 or 2 children have the highest poverty rate of 16.8%, comprising of 16 families. On the other hand, families with no children have the lowest poverty rate of 0.0%, which includes 0 families.
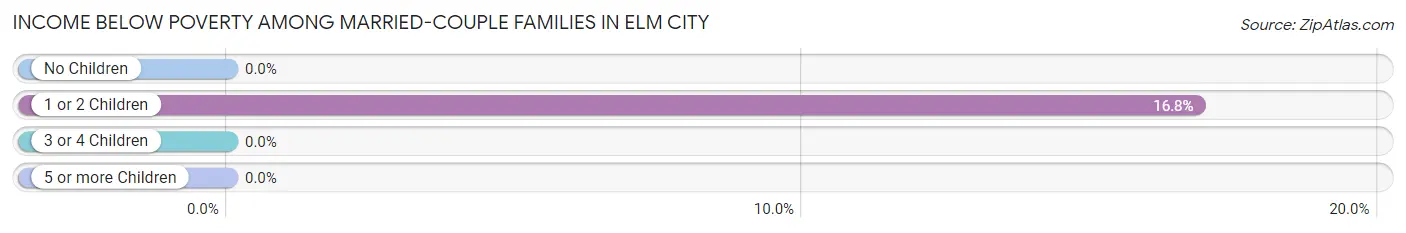
| Children | Above Poverty | Below Poverty |
| No Children | 143 (100.0%) | 0 (0.0%) |
| 1 or 2 Children | 79 (83.2%) | 16 (16.8%) |
| 3 or 4 Children | 0 (0.0%) | 0 (0.0%) |
| 5 or more Children | 0 (0.0%) | 0 (0.0%) |
| Total | 222 (93.3%) | 16 (6.7%) |
Income Below Poverty Among Single-Parent Households in Elm City
According to the poverty data in Elm City, 44.4% or 4 single-father households and 36.5% or 31 single-mother households are living below the poverty line. Among single-father households, those with 1 or 2 children have the highest poverty rate, with 4 households (44.4%) experiencing poverty. Likewise, among single-mother households, those with 5 or more children have the highest poverty rate, with 6 households (100.0%) falling below the poverty line.
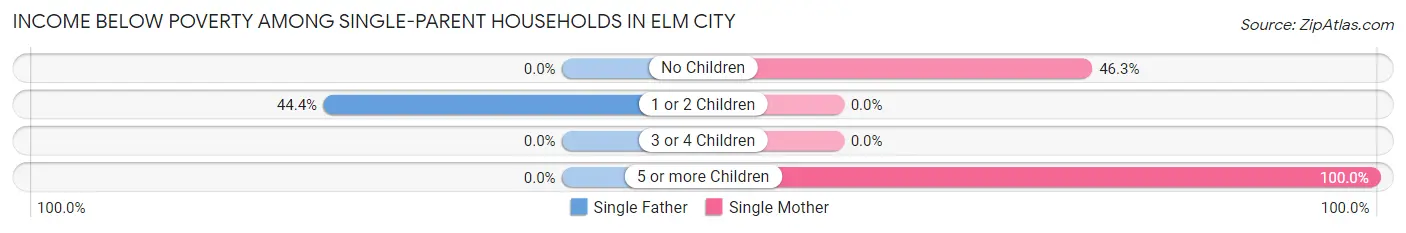
| Children | Single Father | Single Mother |
| No Children | 0 (0.0%) | 25 (46.3%) |
| 1 or 2 Children | 4 (44.4%) | 0 (0.0%) |
| 3 or 4 Children | 0 (0.0%) | 0 (0.0%) |
| 5 or more Children | 0 (0.0%) | 6 (100.0%) |
| Total | 4 (44.4%) | 31 (36.5%) |
Income Below Poverty Among Married-Couple vs Single-Parent Households in Elm City
The poverty data for Elm City shows that 16 of the married-couple family households (6.7%) and 35 of the single-parent households (37.2%) are living below the poverty level. Within the married-couple family households, those with 1 or 2 children have the highest poverty rate, with 16 households (16.8%) falling below the poverty line. Among the single-parent households, those with 5 or more children have the highest poverty rate, with 6 household (100.0%) living below poverty.
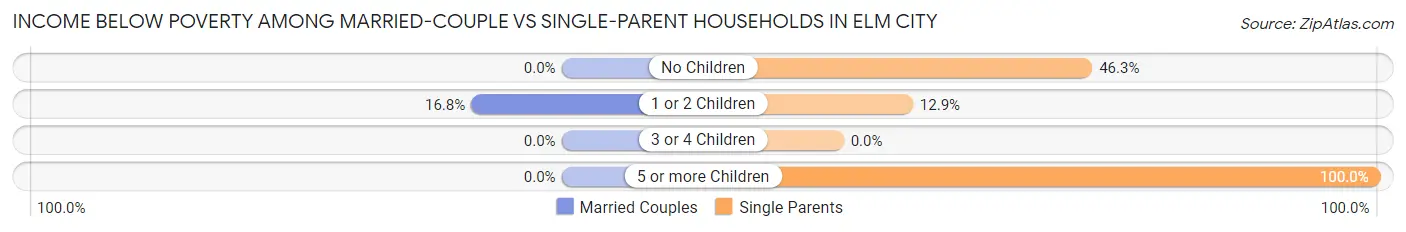
| Children | Married-Couple Families | Single-Parent Households |
| No Children | 0 (0.0%) | 25 (46.3%) |
| 1 or 2 Children | 16 (16.8%) | 4 (12.9%) |
| 3 or 4 Children | 0 (0.0%) | 0 (0.0%) |
| 5 or more Children | 0 (0.0%) | 6 (100.0%) |
| Total | 16 (6.7%) | 35 (37.2%) |
Race in Elm City
The most populous races in Elm City are Black / African American (725 | 62.7%), White / Caucasian (318 | 27.5%), and Hispanic or Latino (135 | 11.7%).
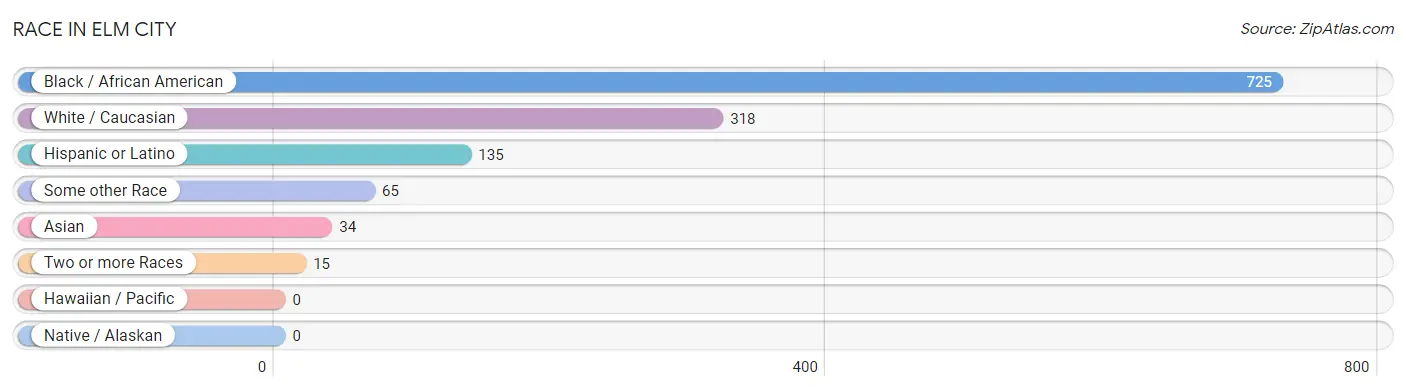
| Race | # Population | % Population |
| Asian | 34 | 2.9% |
| Black / African American | 725 | 62.7% |
| Hawaiian / Pacific | 0 | 0.0% |
| Hispanic or Latino | 135 | 11.7% |
| Native / Alaskan | 0 | 0.0% |
| White / Caucasian | 318 | 27.5% |
| Two or more Races | 15 | 1.3% |
| Some other Race | 65 | 5.6% |
| Total | 1,157 | 100.0% |
Ancestry in Elm City
The most populous ancestries reported in Elm City are Irish (94 | 8.1%), Mexican (79 | 6.8%), Puerto Rican (56 | 4.8%), American (54 | 4.7%), and Indian (Asian) (37 | 3.2%), together accounting for 27.7% of all Elm City residents.
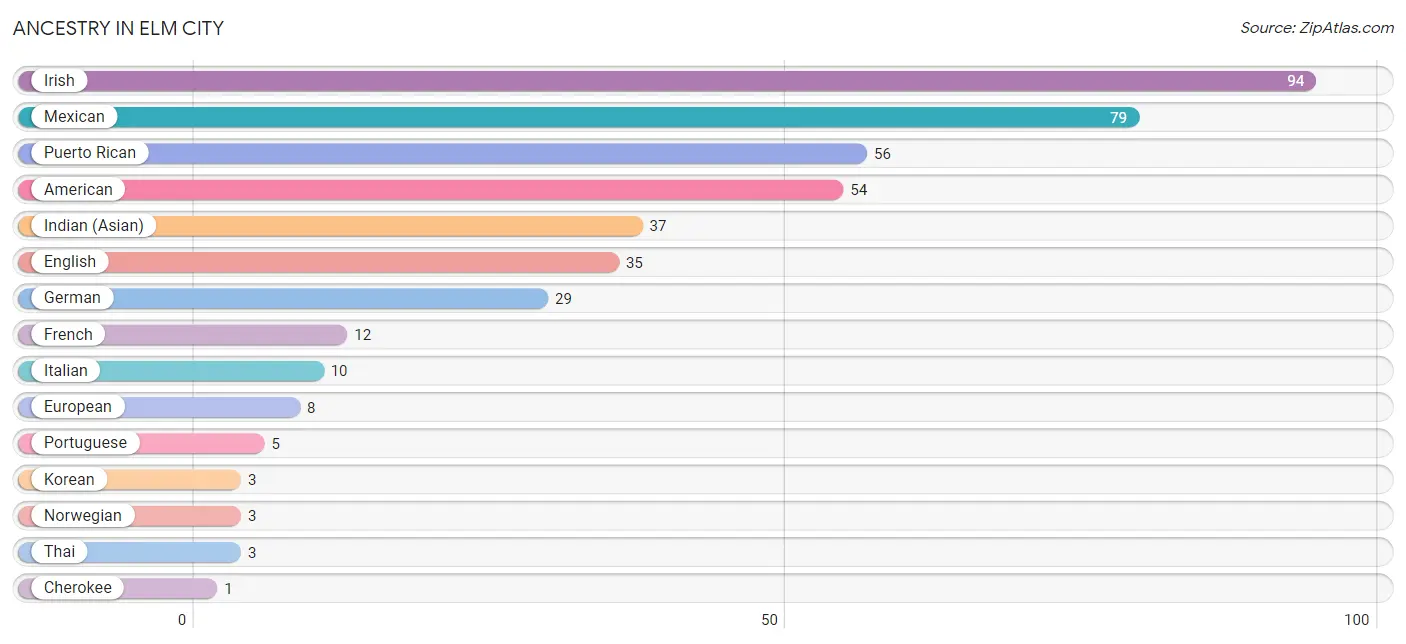
| Ancestry | # Population | % Population |
| American | 54 | 4.7% |
| Cherokee | 1 | 0.1% |
| English | 35 | 3.0% |
| European | 8 | 0.7% |
| French | 12 | 1.0% |
| German | 29 | 2.5% |
| Indian (Asian) | 37 | 3.2% |
| Irish | 94 | 8.1% |
| Italian | 10 | 0.9% |
| Korean | 3 | 0.3% |
| Mexican | 79 | 6.8% |
| Norwegian | 3 | 0.3% |
| Portuguese | 5 | 0.4% |
| Puerto Rican | 56 | 4.8% |
| Scottish | 1 | 0.1% |
| Thai | 3 | 0.3% | View All 16 Rows |
Immigrants in Elm City
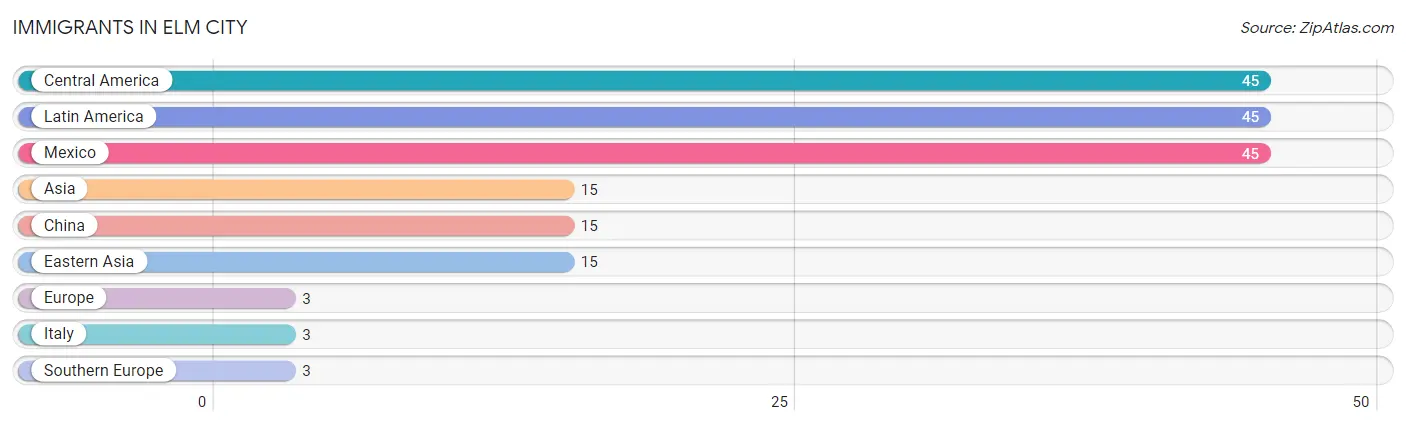
The most numerous immigrant groups reported in Elm City came from Central America (45 | 3.9%), Latin America (45 | 3.9%), Mexico (45 | 3.9%), Asia (15 | 1.3%), and China (15 | 1.3%), together accounting for 14.3% of all Elm City residents.
| Immigration Origin | # Population | % Population |
| Asia | 15 | 1.3% |
| Central America | 45 | 3.9% |
| China | 15 | 1.3% |
| Eastern Asia | 15 | 1.3% |
| Europe | 3 | 0.3% |
| Italy | 3 | 0.3% |
| Latin America | 45 | 3.9% |
| Mexico | 45 | 3.9% |
| Southern Europe | 3 | 0.3% | View All 9 Rows |
Sex and Age in Elm City
Sex and Age in Elm City
The most populous age groups in Elm City are 15 to 19 Years (94 | 15.0%) for men and 65 to 69 Years (70 | 13.2%) for women.
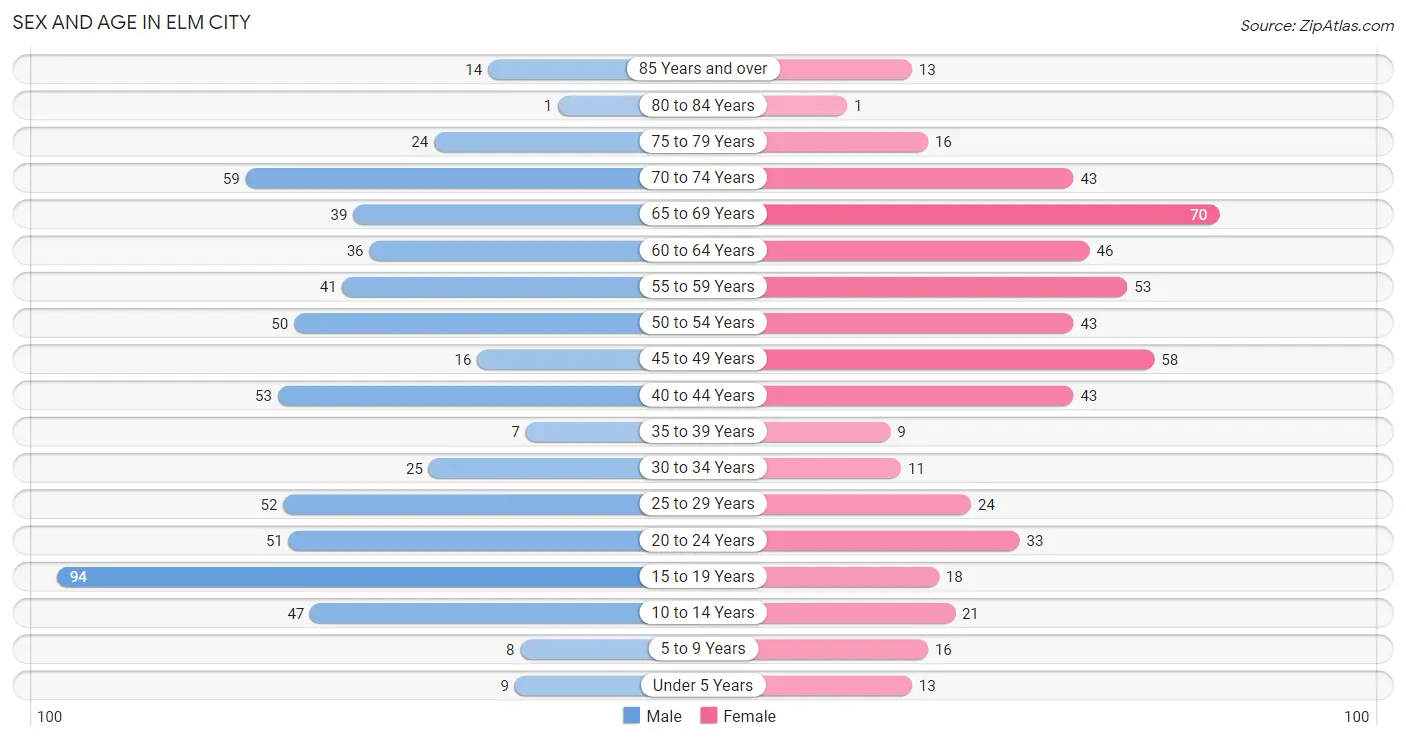
| Age Bracket | Male | Female |
| Under 5 Years | 9 (1.4%) | 13 (2.5%) |
| 5 to 9 Years | 8 (1.3%) | 16 (3.0%) |
| 10 to 14 Years | 47 (7.5%) | 21 (4.0%) |
| 15 to 19 Years | 94 (15.0%) | 18 (3.4%) |
| 20 to 24 Years | 51 (8.2%) | 33 (6.2%) |
| 25 to 29 Years | 52 (8.3%) | 24 (4.5%) |
| 30 to 34 Years | 25 (4.0%) | 11 (2.1%) |
| 35 to 39 Years | 7 (1.1%) | 9 (1.7%) |
| 40 to 44 Years | 53 (8.5%) | 43 (8.1%) |
| 45 to 49 Years | 16 (2.6%) | 58 (10.9%) |
| 50 to 54 Years | 50 (8.0%) | 43 (8.1%) |
| 55 to 59 Years | 41 (6.6%) | 53 (10.0%) |
| 60 to 64 Years | 36 (5.8%) | 46 (8.7%) |
| 65 to 69 Years | 39 (6.2%) | 70 (13.2%) |
| 70 to 74 Years | 59 (9.4%) | 43 (8.1%) |
| 75 to 79 Years | 24 (3.8%) | 16 (3.0%) |
| 80 to 84 Years | 1 (0.2%) | 1 (0.2%) |
| 85 Years and over | 14 (2.2%) | 13 (2.5%) |
| Total | 626 (100.0%) | 531 (100.0%) |
Families and Households in Elm City
Median Family Size in Elm City
The median family size in Elm City is 3.01 persons per family, with married-couple families (238 | 71.7%) accounting for the largest median family size of 3.13 persons per family. On the other hand, single male/father families (9 | 2.7%) represent the smallest median family size with 2.33 persons per family.
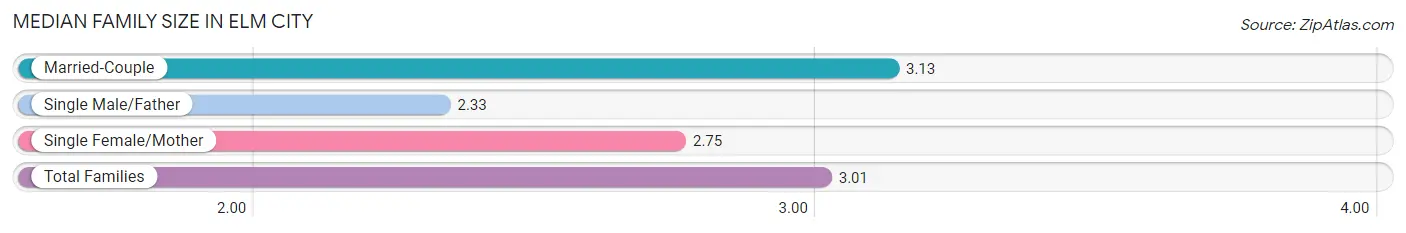
| Family Type | # Families | Family Size |
| Married-Couple | 238 (71.7%) | 3.13 |
| Single Male/Father | 9 (2.7%) | 2.33 |
| Single Female/Mother | 85 (25.6%) | 2.75 |
| Total Families | 332 (100.0%) | 3.01 |
Median Household Size in Elm City
The median household size in Elm City is 2.44 persons per household, with married-couple households (238 | 50.1%) accounting for the largest median household size of 3.15 persons per household. non-family households (143 | 30.1%) represent the smallest median household size with 1.02 persons per household.
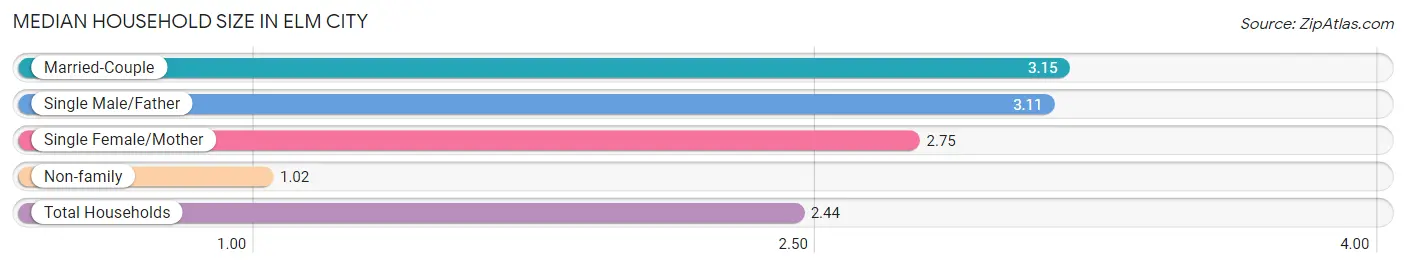
| Household Type | # Households | Household Size |
| Married-Couple | 238 (50.1%) | 3.15 |
| Single Male/Father | 9 (1.9%) | 3.11 |
| Single Female/Mother | 85 (17.9%) | 2.75 |
| Non-family | 143 (30.1%) | 1.02 |
| Total Households | 475 (100.0%) | 2.44 |
Household Size by Marriage Status in Elm City
Out of a total of 475 households in Elm City, 332 (69.9%) are family households, while 143 (30.1%) are nonfamily households. The most numerous type of family households are 2-person households, comprising 181, and the most common type of nonfamily households are 1-person households, comprising 139.
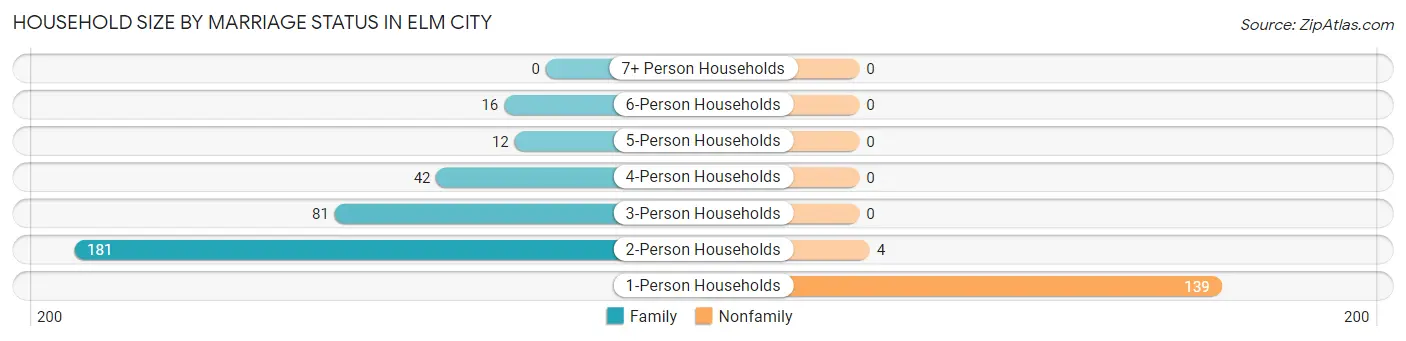
| Household Size | Family Households | Nonfamily Households |
| 1-Person Households | - | 139 (29.3%) |
| 2-Person Households | 181 (38.1%) | 4 (0.8%) |
| 3-Person Households | 81 (17.1%) | 0 (0.0%) |
| 4-Person Households | 42 (8.8%) | 0 (0.0%) |
| 5-Person Households | 12 (2.5%) | 0 (0.0%) |
| 6-Person Households | 16 (3.4%) | 0 (0.0%) |
| 7+ Person Households | 0 (0.0%) | 0 (0.0%) |
| Total | 332 (69.9%) | 143 (30.1%) |
Female Fertility in Elm City
Fertility by Age in Elm City
| Age Bracket | Women with Births | Births / 1,000 Women |
| 15 to 19 years | 0 (0.0%) | 0.0 |
| 20 to 34 years | 0 (0.0%) | 0.0 |
| 35 to 50 years | 0 (0.0%) | 0.0 |
| Total | 0 (0.0%) | 0.0 |
Fertility by Age by Marriage Status in Elm City
| Age Bracket | Married | Unmarried |
| 15 to 19 years | 0 (0.0%) | 0 (0.0%) |
| 20 to 34 years | 0 (0.0%) | 0 (0.0%) |
| 35 to 50 years | 0 (0.0%) | 0 (0.0%) |
| Total | 0 (0.0%) | 0 (0.0%) |
Fertility by Education in Elm City
| Educational Attainment | Women with Births | Births / 1,000 Women |
| Less than High School | 0 (0.0%) | 0.0 |
| High School Diploma | 0 (0.0%) | 0.0 |
| College or Associate's Degree | 0 (0.0%) | 0.0 |
| Bachelor's Degree | 0 (0.0%) | 0.0 |
| Graduate Degree | 0 (0.0%) | 0.0 |
| Total | 0 (0.0%) | 0.0 |
Fertility by Education by Marriage Status in Elm City
| Educational Attainment | Married | Unmarried |
| Less than High School | 0 (0.0%) | 0 (0.0%) |
| High School Diploma | 0 (0.0%) | 0 (0.0%) |
| College or Associate's Degree | 0 (0.0%) | 0 (0.0%) |
| Bachelor's Degree | 0 (0.0%) | 0 (0.0%) |
| Graduate Degree | 0 (0.0%) | 0 (0.0%) |
| Total | 0 (0.0%) | 0 (0.0%) |
Employment Characteristics in Elm City
Employment by Class of Employer in Elm City
Among the 448 employed individuals in Elm City, private company employees (345 | 77.0%), self-employed (incorporated) (25 | 5.6%), and not-for-profit organizations (21 | 4.7%) make up the most common classes of employment.
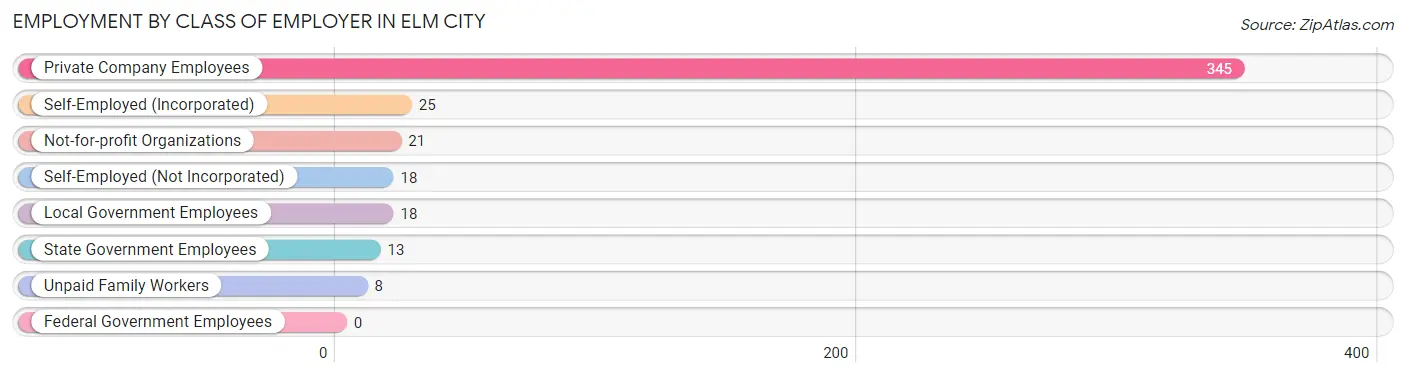
| Employer Class | # Employees | % Employees |
| Private Company Employees | 345 | 77.0% |
| Self-Employed (Incorporated) | 25 | 5.6% |
| Self-Employed (Not Incorporated) | 18 | 4.0% |
| Not-for-profit Organizations | 21 | 4.7% |
| Local Government Employees | 18 | 4.0% |
| State Government Employees | 13 | 2.9% |
| Federal Government Employees | 0 | 0.0% |
| Unpaid Family Workers | 8 | 1.8% |
| Total | 448 | 100.0% |
Employment Status by Age in Elm City
According to the labor force statistics for Elm City, out of the total population over 16 years of age (1,022), 48.4% or 495 individuals are in the labor force, with 6.3% or 31 of them unemployed. The age group with the highest labor force participation rate is 30 to 34 years, with 100.0% or 36 individuals in the labor force. Within the labor force, the 20 to 24 years age range has the highest percentage of unemployed individuals, with 43.8% or 28 of them being unemployed.
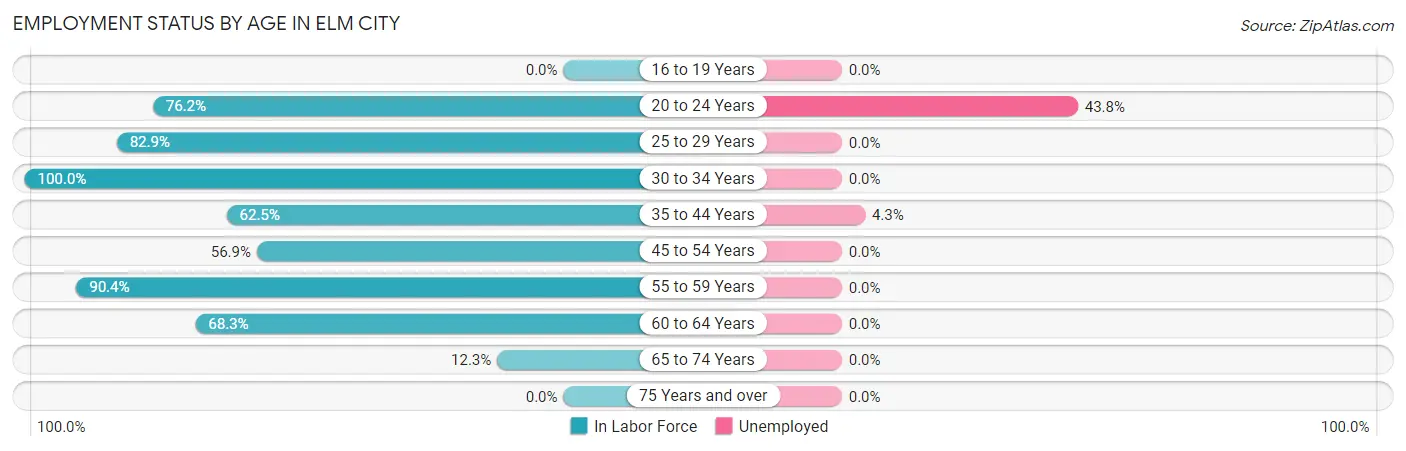
| Age Bracket | In Labor Force | Unemployed |
| 16 to 19 Years | 0 (0.0%) | 0 (0.0%) |
| 20 to 24 Years | 64 (76.2%) | 28 (43.8%) |
| 25 to 29 Years | 63 (82.9%) | 0 (0.0%) |
| 30 to 34 Years | 36 (100.0%) | 0 (0.0%) |
| 35 to 44 Years | 70 (62.5%) | 3 (4.3%) |
| 45 to 54 Years | 95 (56.9%) | 0 (0.0%) |
| 55 to 59 Years | 85 (90.4%) | 0 (0.0%) |
| 60 to 64 Years | 56 (68.3%) | 0 (0.0%) |
| 65 to 74 Years | 26 (12.3%) | 0 (0.0%) |
| 75 Years and over | 0 (0.0%) | 0 (0.0%) |
| Total | 495 (48.4%) | 31 (6.3%) |
Employment Status by Educational Attainment in Elm City
According to labor force statistics for Elm City, 71.4% of individuals (405) out of the total population between 25 and 64 years of age (567) are in the labor force, with 0.7% or 3 of them being unemployed. The group with the highest labor force participation rate are those with the educational attainment of bachelor's degree or higher, with 84.3% or 75 individuals in the labor force. Within the labor force, individuals with high school diploma education have the highest percentage of unemployment, with 1.6% or 3 of them being unemployed.
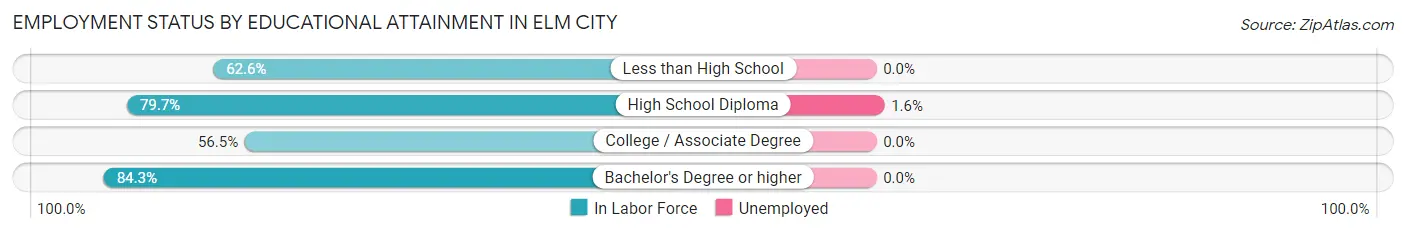
| Educational Attainment | In Labor Force | Unemployed |
| Less than High School | 62 (62.6%) | 0 (0.0%) |
| High School Diploma | 185 (79.7%) | 4 (1.6%) |
| College / Associate Degree | 83 (56.5%) | 0 (0.0%) |
| Bachelor's Degree or higher | 75 (84.3%) | 0 (0.0%) |
| Total | 405 (71.4%) | 4 (0.7%) |
Employment Occupations by Sex in Elm City
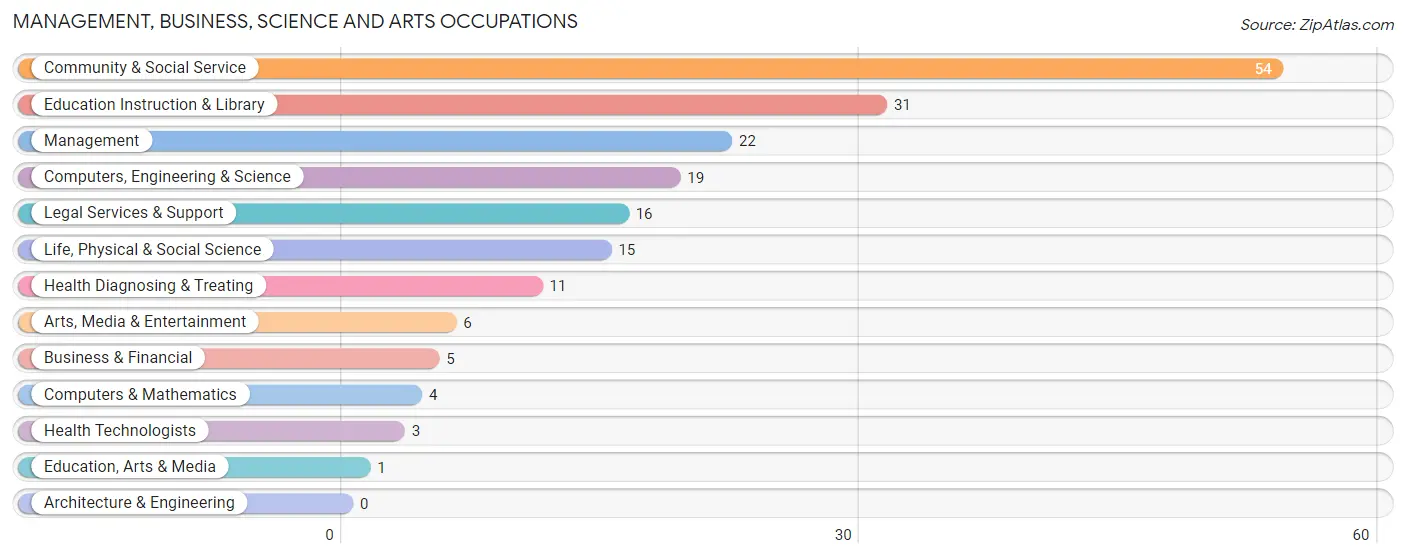
Management, Business, Science and Arts Occupations
The most common Management, Business, Science and Arts occupations in Elm City are Community & Social Service (54 | 11.6%), Education Instruction & Library (31 | 6.7%), Management (22 | 4.7%), Computers, Engineering & Science (19 | 4.1%), and Legal Services & Support (16 | 3.5%).
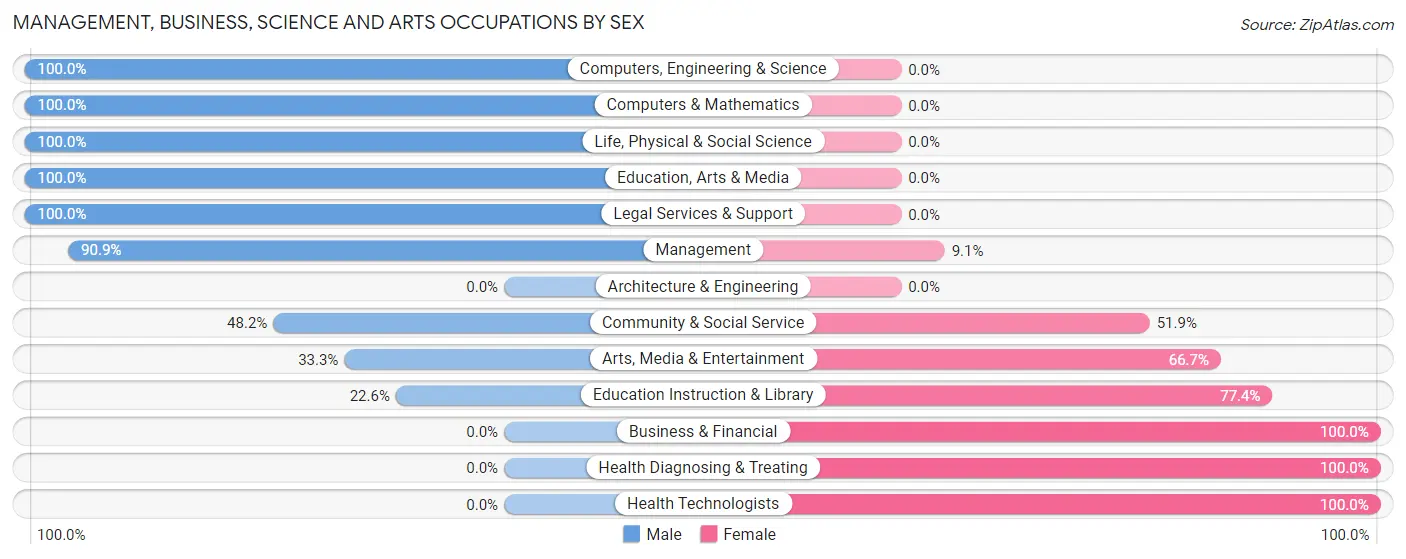
Management, Business, Science and Arts Occupations by Sex
Within the Management, Business, Science and Arts occupations in Elm City, the most male-oriented occupations are Computers, Engineering & Science (100.0%), Computers & Mathematics (100.0%), and Life, Physical & Social Science (100.0%), while the most female-oriented occupations are Business & Financial (100.0%), Health Diagnosing & Treating (100.0%), and Health Technologists (100.0%).
| Occupation | Male | Female |
| Management | 20 (90.9%) | 2 (9.1%) |
| Business & Financial | 0 (0.0%) | 5 (100.0%) |
| Computers, Engineering & Science | 19 (100.0%) | 0 (0.0%) |
| Computers & Mathematics | 4 (100.0%) | 0 (0.0%) |
| Architecture & Engineering | 0 (0.0%) | 0 (0.0%) |
| Life, Physical & Social Science | 15 (100.0%) | 0 (0.0%) |
| Community & Social Service | 26 (48.1%) | 28 (51.8%) |
| Education, Arts & Media | 1 (100.0%) | 0 (0.0%) |
| Legal Services & Support | 16 (100.0%) | 0 (0.0%) |
| Education Instruction & Library | 7 (22.6%) | 24 (77.4%) |
| Arts, Media & Entertainment | 2 (33.3%) | 4 (66.7%) |
| Health Diagnosing & Treating | 0 (0.0%) | 11 (100.0%) |
| Health Technologists | 0 (0.0%) | 3 (100.0%) |
| Total (Category) | 65 (58.6%) | 46 (41.4%) |
| Total (Overall) | 245 (52.8%) | 219 (47.2%) |
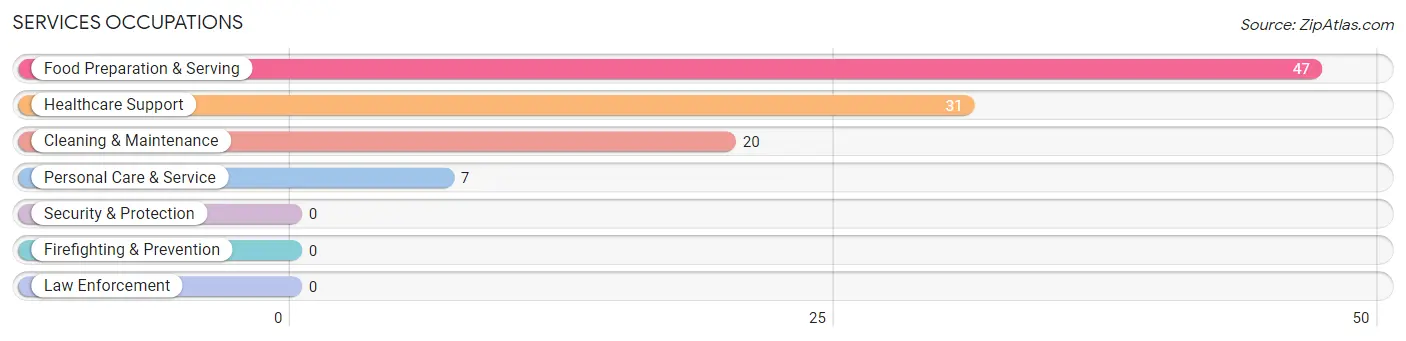
Services Occupations
The most common Services occupations in Elm City are Food Preparation & Serving (47 | 10.1%), Healthcare Support (31 | 6.7%), Cleaning & Maintenance (20 | 4.3%), and Personal Care & Service (7 | 1.5%).
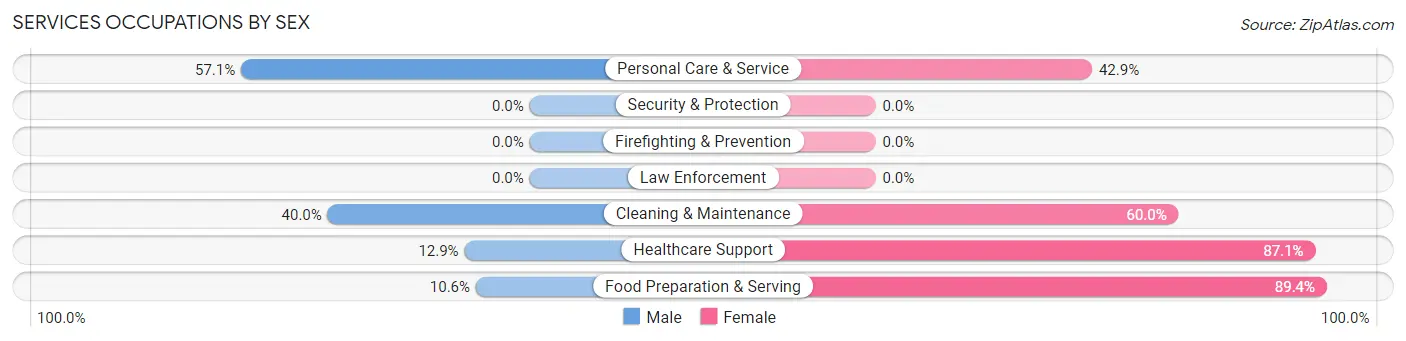
Services Occupations by Sex
Within the Services occupations in Elm City, the most male-oriented occupations are Personal Care & Service (57.1%), Cleaning & Maintenance (40.0%), and Healthcare Support (12.9%), while the most female-oriented occupations are Food Preparation & Serving (89.4%), Healthcare Support (87.1%), and Cleaning & Maintenance (60.0%).
| Occupation | Male | Female |
| Healthcare Support | 4 (12.9%) | 27 (87.1%) |
| Security & Protection | 0 (0.0%) | 0 (0.0%) |
| Firefighting & Prevention | 0 (0.0%) | 0 (0.0%) |
| Law Enforcement | 0 (0.0%) | 0 (0.0%) |
| Food Preparation & Serving | 5 (10.6%) | 42 (89.4%) |
| Cleaning & Maintenance | 8 (40.0%) | 12 (60.0%) |
| Personal Care & Service | 4 (57.1%) | 3 (42.9%) |
| Total (Category) | 21 (20.0%) | 84 (80.0%) |
| Total (Overall) | 245 (52.8%) | 219 (47.2%) |
Sales and Office Occupations
The most common Sales and Office occupations in Elm City are Office & Administration (46 | 9.9%), and Sales & Related (6 | 1.3%).
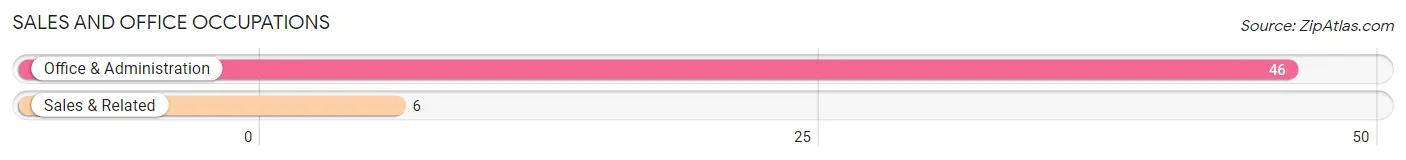
Sales and Office Occupations by Sex

| Occupation | Male | Female |
| Sales & Related | 3 (50.0%) | 3 (50.0%) |
| Office & Administration | 3 (6.5%) | 43 (93.5%) |
| Total (Category) | 6 (11.5%) | 46 (88.5%) |
| Total (Overall) | 245 (52.8%) | 219 (47.2%) |
Natural Resources, Construction and Maintenance Occupations
The most common Natural Resources, Construction and Maintenance occupations in Elm City are Construction & Extraction (31 | 6.7%), and Installation, Maintenance & Repair (25 | 5.4%).
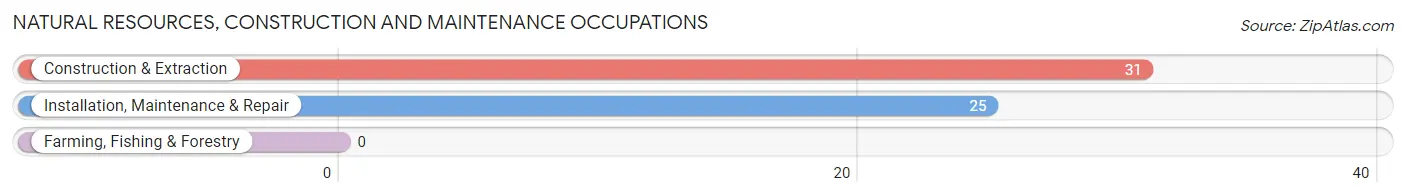
Natural Resources, Construction and Maintenance Occupations by Sex

| Occupation | Male | Female |
| Farming, Fishing & Forestry | 0 (0.0%) | 0 (0.0%) |
| Construction & Extraction | 31 (100.0%) | 0 (0.0%) |
| Installation, Maintenance & Repair | 25 (100.0%) | 0 (0.0%) |
| Total (Category) | 56 (100.0%) | 0 (0.0%) |
| Total (Overall) | 245 (52.8%) | 219 (47.2%) |
Production, Transportation and Moving Occupations
The most common Production, Transportation and Moving occupations in Elm City are Production (99 | 21.3%), Material Moving (39 | 8.4%), and Transportation (2 | 0.4%).
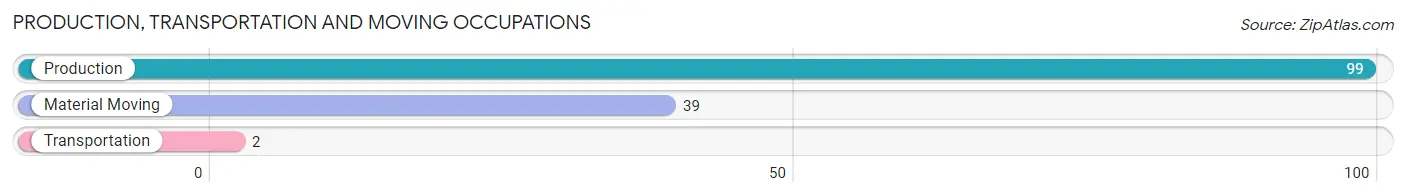
Production, Transportation and Moving Occupations by Sex
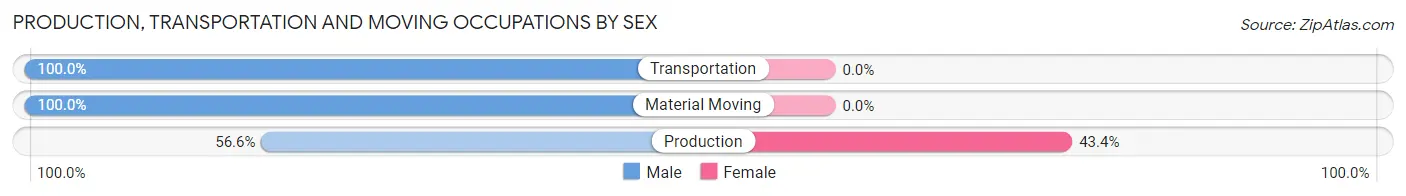
| Occupation | Male | Female |
| Production | 56 (56.6%) | 43 (43.4%) |
| Transportation | 2 (100.0%) | 0 (0.0%) |
| Material Moving | 39 (100.0%) | 0 (0.0%) |
| Total (Category) | 97 (69.3%) | 43 (30.7%) |
| Total (Overall) | 245 (52.8%) | 219 (47.2%) |
Employment Industries by Sex in Elm City
Employment Industries in Elm City
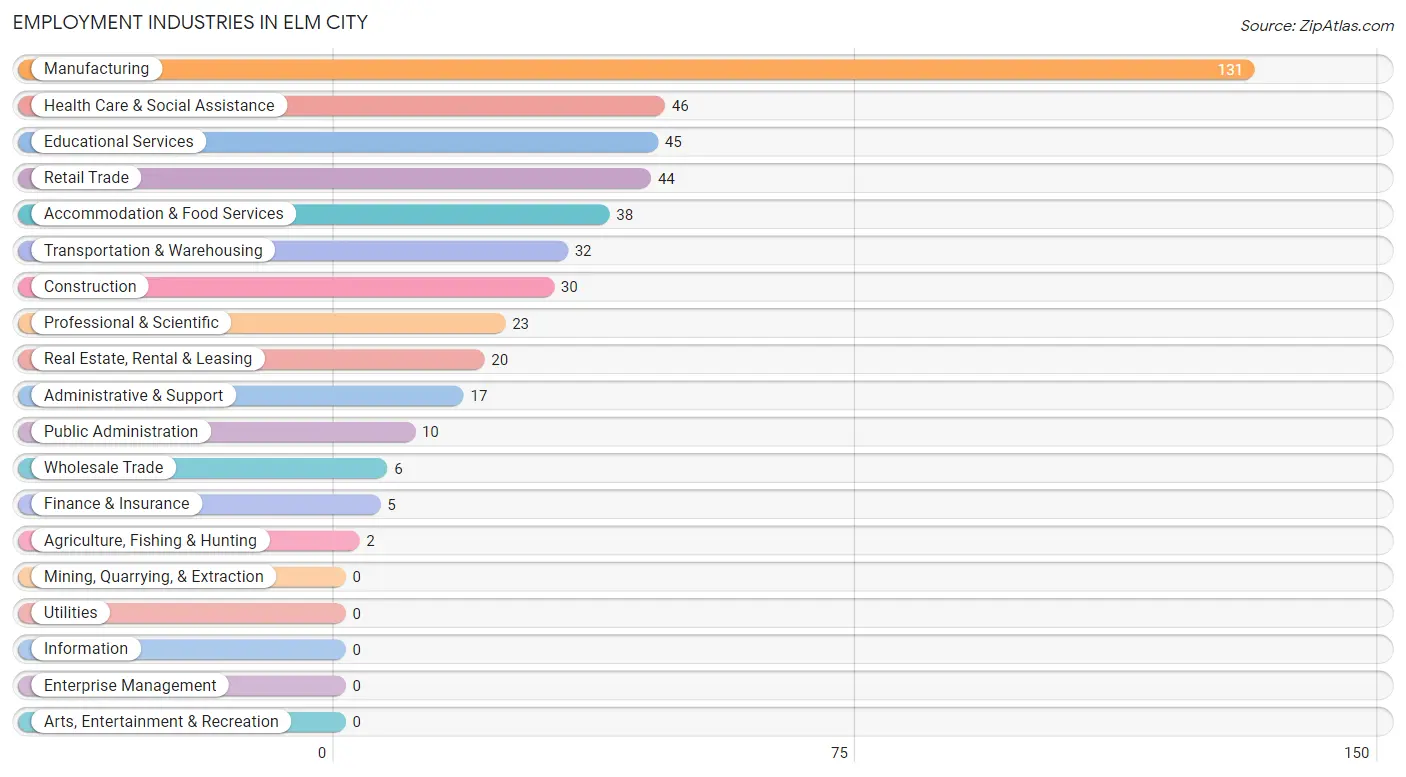
The major employment industries in Elm City include Manufacturing (131 | 28.2%), Health Care & Social Assistance (46 | 9.9%), Educational Services (45 | 9.7%), Retail Trade (44 | 9.5%), and Accommodation & Food Services (38 | 8.2%).
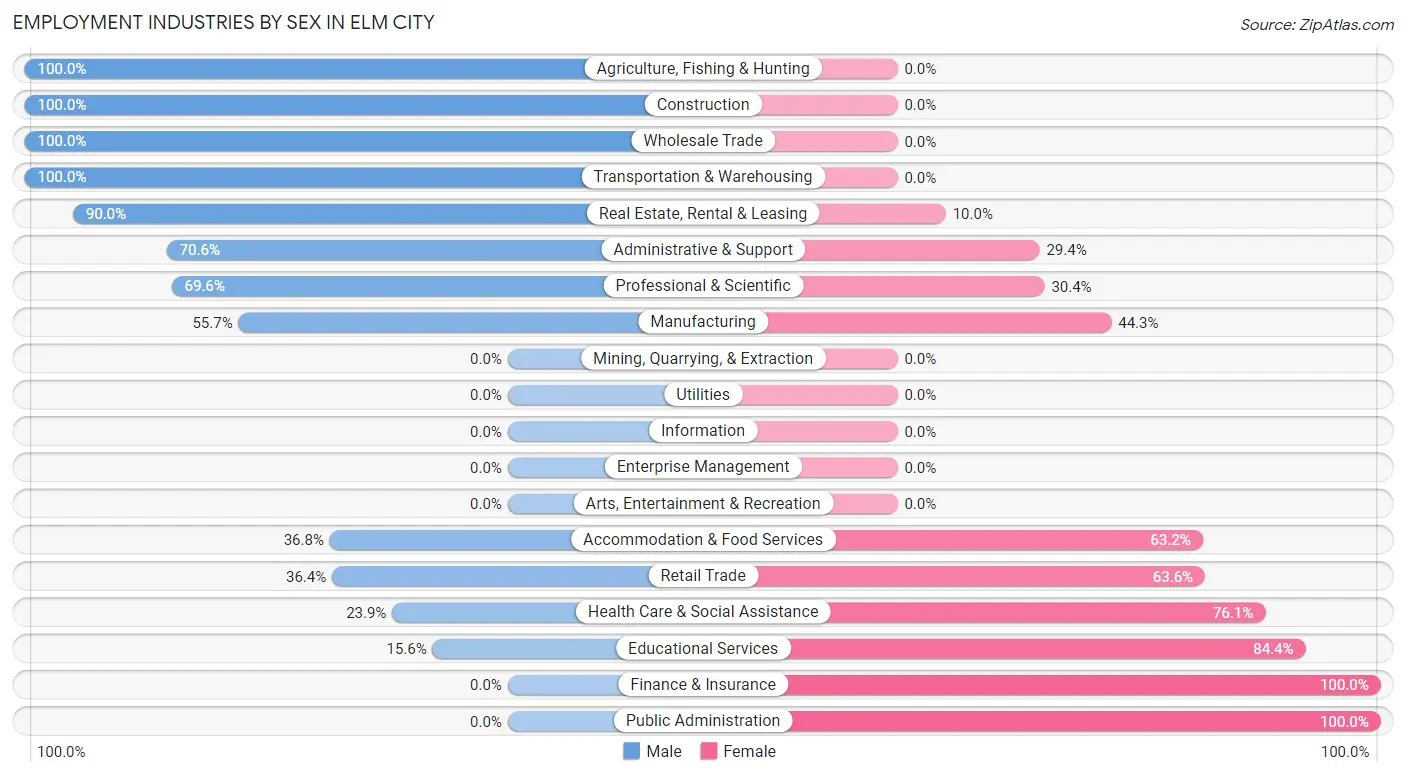
Employment Industries by Sex in Elm City
The Elm City industries that see more men than women are Agriculture, Fishing & Hunting (100.0%), Construction (100.0%), and Wholesale Trade (100.0%), whereas the industries that tend to have a higher number of women are Finance & Insurance (100.0%), Public Administration (100.0%), and Educational Services (84.4%).
| Industry | Male | Female |
| Agriculture, Fishing & Hunting | 2 (100.0%) | 0 (0.0%) |
| Mining, Quarrying, & Extraction | 0 (0.0%) | 0 (0.0%) |
| Construction | 30 (100.0%) | 0 (0.0%) |
| Manufacturing | 73 (55.7%) | 58 (44.3%) |
| Wholesale Trade | 6 (100.0%) | 0 (0.0%) |
| Retail Trade | 16 (36.4%) | 28 (63.6%) |
| Transportation & Warehousing | 32 (100.0%) | 0 (0.0%) |
| Utilities | 0 (0.0%) | 0 (0.0%) |
| Information | 0 (0.0%) | 0 (0.0%) |
| Finance & Insurance | 0 (0.0%) | 5 (100.0%) |
| Real Estate, Rental & Leasing | 18 (90.0%) | 2 (10.0%) |
| Professional & Scientific | 16 (69.6%) | 7 (30.4%) |
| Enterprise Management | 0 (0.0%) | 0 (0.0%) |
| Administrative & Support | 12 (70.6%) | 5 (29.4%) |
| Educational Services | 7 (15.6%) | 38 (84.4%) |
| Health Care & Social Assistance | 11 (23.9%) | 35 (76.1%) |
| Arts, Entertainment & Recreation | 0 (0.0%) | 0 (0.0%) |
| Accommodation & Food Services | 14 (36.8%) | 24 (63.2%) |
| Public Administration | 0 (0.0%) | 10 (100.0%) |
| Total | 245 (52.8%) | 219 (47.2%) |
Education in Elm City
School Enrollment in Elm City
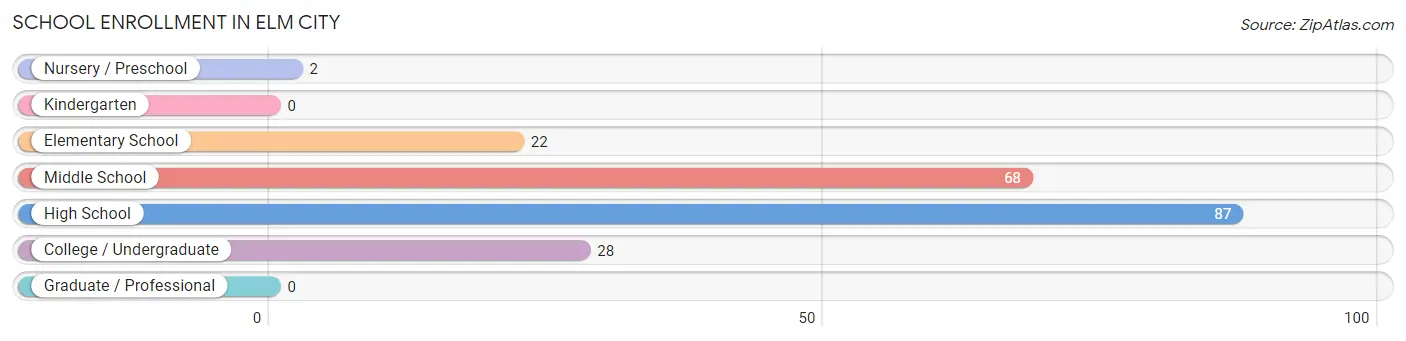
The most common levels of schooling among the 207 students in Elm City are high school (87 | 42.0%), middle school (68 | 32.9%), and college / undergraduate (28 | 13.5%).
| School Level | # Students | % Students |
| Nursery / Preschool | 2 | 1.0% |
| Kindergarten | 0 | 0.0% |
| Elementary School | 22 | 10.6% |
| Middle School | 68 | 32.9% |
| High School | 87 | 42.0% |
| College / Undergraduate | 28 | 13.5% |
| Graduate / Professional | 0 | 0.0% |
| Total | 207 | 100.0% |
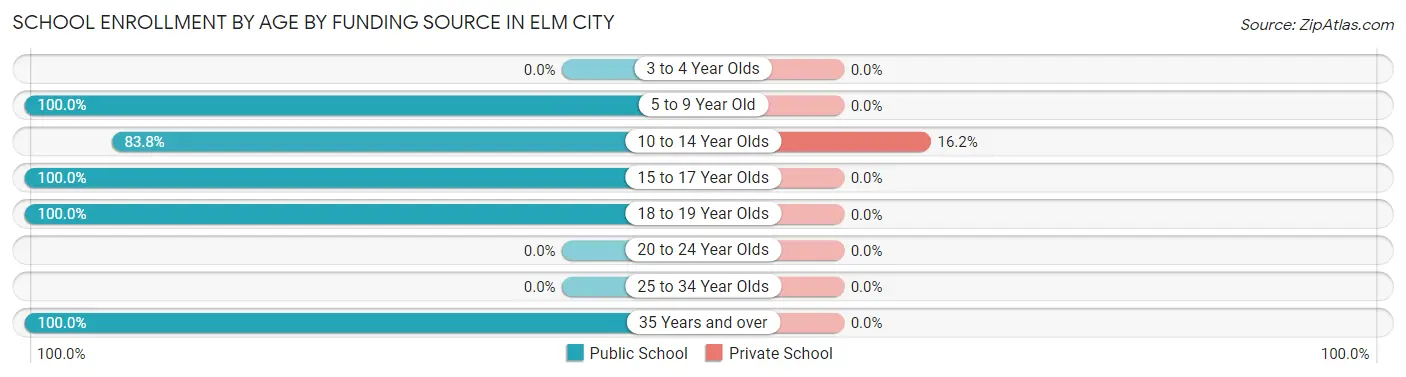
School Enrollment by Age by Funding Source in Elm City
Out of a total of 207 students who are enrolled in schools in Elm City, 11 (5.3%) attend a private institution, while the remaining 196 (94.7%) are enrolled in public schools. The age group of 10 to 14 year olds has the highest likelihood of being enrolled in private schools, with 11 (16.2% in the age bracket) enrolled. Conversely, the age group of 5 to 9 year old has the lowest likelihood of being enrolled in a private school, with 24 (100.0% in the age bracket) attending a public institution.
| Age Bracket | Public School | Private School |
| 3 to 4 Year Olds | 0 (0.0%) | 0 (0.0%) |
| 5 to 9 Year Old | 24 (100.0%) | 0 (0.0%) |
| 10 to 14 Year Olds | 57 (83.8%) | 11 (16.2%) |
| 15 to 17 Year Olds | 87 (100.0%) | 0 (0.0%) |
| 18 to 19 Year Olds | 12 (100.0%) | 0 (0.0%) |
| 20 to 24 Year Olds | 0 (0.0%) | 0 (0.0%) |
| 25 to 34 Year Olds | 0 (0.0%) | 0 (0.0%) |
| 35 Years and over | 16 (100.0%) | 0 (0.0%) |
| Total | 196 (94.7%) | 11 (5.3%) |
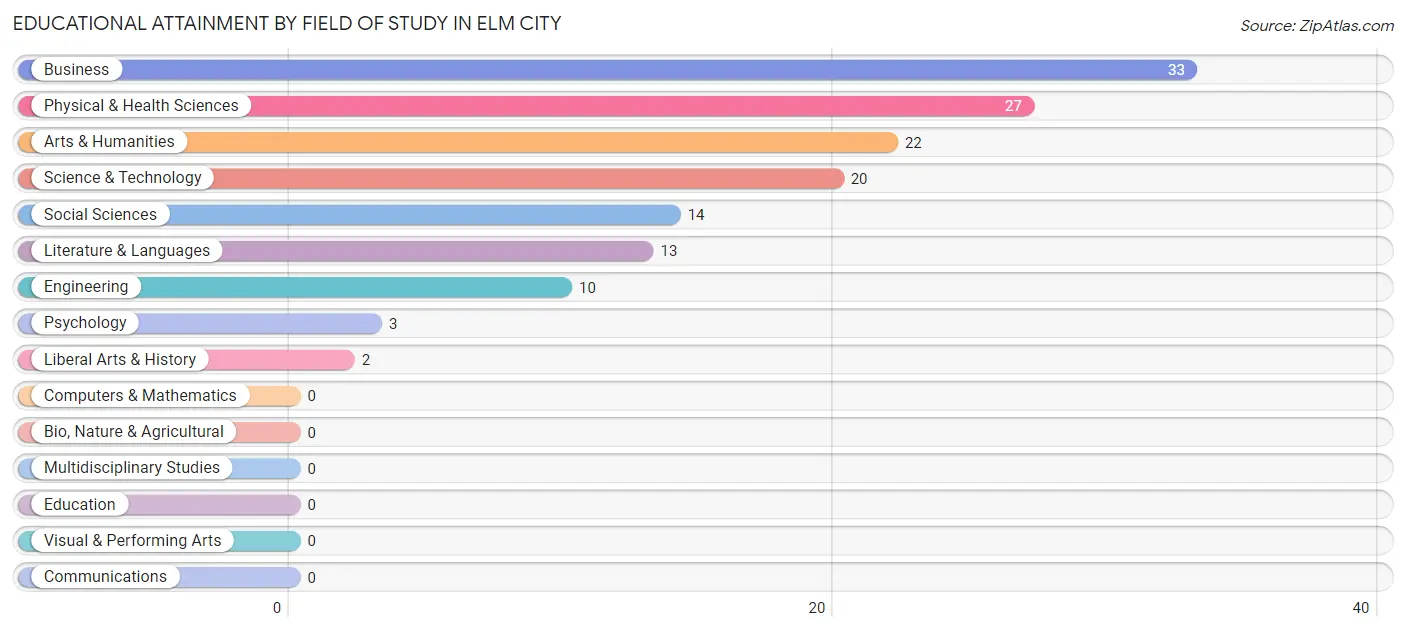
Educational Attainment by Field of Study in Elm City
Business (33 | 22.9%), physical & health sciences (27 | 18.8%), arts & humanities (22 | 15.3%), science & technology (20 | 13.9%), and social sciences (14 | 9.7%) are the most common fields of study among 144 individuals in Elm City who have obtained a bachelor's degree or higher.
| Field of Study | # Graduates | % Graduates |
| Computers & Mathematics | 0 | 0.0% |
| Bio, Nature & Agricultural | 0 | 0.0% |
| Physical & Health Sciences | 27 | 18.8% |
| Psychology | 3 | 2.1% |
| Social Sciences | 14 | 9.7% |
| Engineering | 10 | 6.9% |
| Multidisciplinary Studies | 0 | 0.0% |
| Science & Technology | 20 | 13.9% |
| Business | 33 | 22.9% |
| Education | 0 | 0.0% |
| Literature & Languages | 13 | 9.0% |
| Liberal Arts & History | 2 | 1.4% |
| Visual & Performing Arts | 0 | 0.0% |
| Communications | 0 | 0.0% |
| Arts & Humanities | 22 | 15.3% |
| Total | 144 | 100.0% |
Transportation & Commute in Elm City
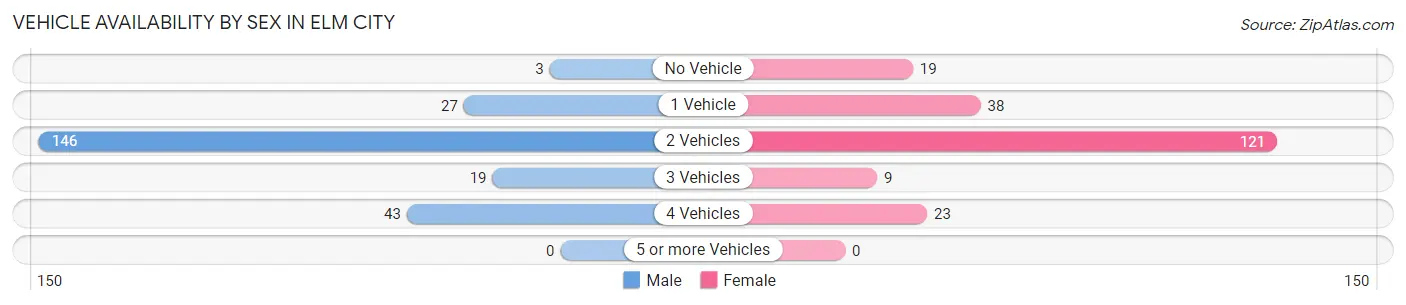
Vehicle Availability by Sex in Elm City
The most prevalent vehicle ownership categories in Elm City are males with 2 vehicles (146, accounting for 61.3%) and females with 2 vehicles (121, making up 69.5%).
| Vehicles Available | Male | Female |
| No Vehicle | 3 (1.3%) | 19 (9.0%) |
| 1 Vehicle | 27 (11.3%) | 38 (18.1%) |
| 2 Vehicles | 146 (61.3%) | 121 (57.6%) |
| 3 Vehicles | 19 (8.0%) | 9 (4.3%) |
| 4 Vehicles | 43 (18.1%) | 23 (11.0%) |
| 5 or more Vehicles | 0 (0.0%) | 0 (0.0%) |
| Total | 238 (100.0%) | 210 (100.0%) |
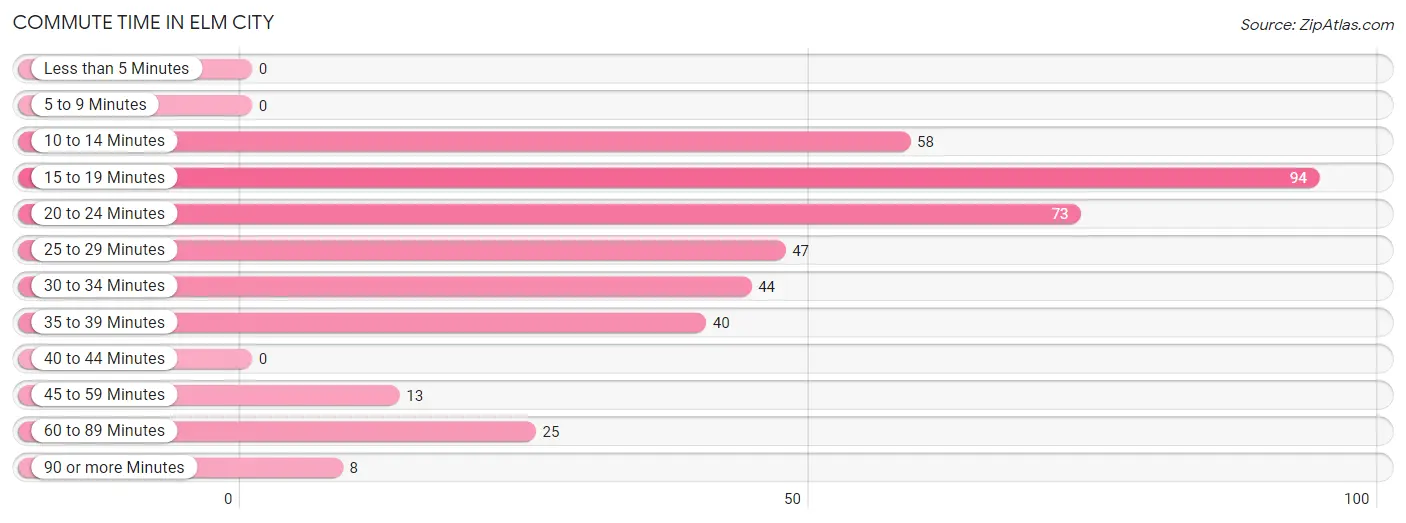
Commute Time in Elm City
The most frequently occuring commute durations in Elm City are 15 to 19 minutes (94 commuters, 23.4%), 20 to 24 minutes (73 commuters, 18.2%), and 10 to 14 minutes (58 commuters, 14.4%).
| Commute Time | # Commuters | % Commuters |
| Less than 5 Minutes | 0 | 0.0% |
| 5 to 9 Minutes | 0 | 0.0% |
| 10 to 14 Minutes | 58 | 14.4% |
| 15 to 19 Minutes | 94 | 23.4% |
| 20 to 24 Minutes | 73 | 18.2% |
| 25 to 29 Minutes | 47 | 11.7% |
| 30 to 34 Minutes | 44 | 11.0% |
| 35 to 39 Minutes | 40 | 10.0% |
| 40 to 44 Minutes | 0 | 0.0% |
| 45 to 59 Minutes | 13 | 3.2% |
| 60 to 89 Minutes | 25 | 6.2% |
| 90 or more Minutes | 8 | 2.0% |
Commute Time by Sex in Elm City
The most common commute times in Elm City are 15 to 19 minutes (84 commuters, 39.1%) for males and 20 to 24 minutes (61 commuters, 32.6%) for females.

| Commute Time | Male | Female |
| Less than 5 Minutes | 0 (0.0%) | 0 (0.0%) |
| 5 to 9 Minutes | 0 (0.0%) | 0 (0.0%) |
| 10 to 14 Minutes | 30 (14.0%) | 28 (15.0%) |
| 15 to 19 Minutes | 84 (39.1%) | 10 (5.3%) |
| 20 to 24 Minutes | 12 (5.6%) | 61 (32.6%) |
| 25 to 29 Minutes | 33 (15.3%) | 14 (7.5%) |
| 30 to 34 Minutes | 28 (13.0%) | 16 (8.6%) |
| 35 to 39 Minutes | 0 (0.0%) | 40 (21.4%) |
| 40 to 44 Minutes | 0 (0.0%) | 0 (0.0%) |
| 45 to 59 Minutes | 0 (0.0%) | 13 (7.0%) |
| 60 to 89 Minutes | 20 (9.3%) | 5 (2.7%) |
| 90 or more Minutes | 8 (3.7%) | 0 (0.0%) |
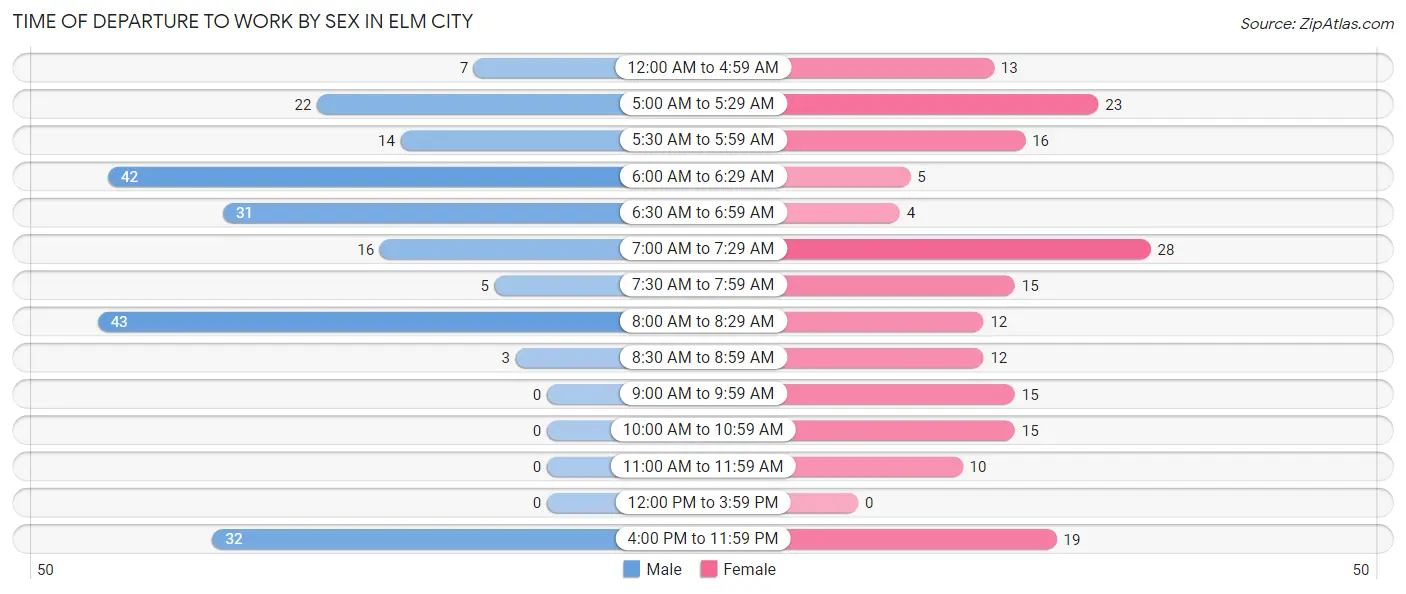
Time of Departure to Work by Sex in Elm City
The most frequent times of departure to work in Elm City are 8:00 AM to 8:29 AM (43, 20.0%) for males and 7:00 AM to 7:29 AM (28, 15.0%) for females.
| Time of Departure | Male | Female |
| 12:00 AM to 4:59 AM | 7 (3.3%) | 13 (7.0%) |
| 5:00 AM to 5:29 AM | 22 (10.2%) | 23 (12.3%) |
| 5:30 AM to 5:59 AM | 14 (6.5%) | 16 (8.6%) |
| 6:00 AM to 6:29 AM | 42 (19.5%) | 5 (2.7%) |
| 6:30 AM to 6:59 AM | 31 (14.4%) | 4 (2.1%) |
| 7:00 AM to 7:29 AM | 16 (7.4%) | 28 (15.0%) |
| 7:30 AM to 7:59 AM | 5 (2.3%) | 15 (8.0%) |
| 8:00 AM to 8:29 AM | 43 (20.0%) | 12 (6.4%) |
| 8:30 AM to 8:59 AM | 3 (1.4%) | 12 (6.4%) |
| 9:00 AM to 9:59 AM | 0 (0.0%) | 15 (8.0%) |
| 10:00 AM to 10:59 AM | 0 (0.0%) | 15 (8.0%) |
| 11:00 AM to 11:59 AM | 0 (0.0%) | 10 (5.3%) |
| 12:00 PM to 3:59 PM | 0 (0.0%) | 0 (0.0%) |
| 4:00 PM to 11:59 PM | 32 (14.9%) | 19 (10.2%) |
| Total | 215 (100.0%) | 187 (100.0%) |
Housing Occupancy in Elm City
Occupancy by Ownership in Elm City
Of the total 475 dwellings in Elm City, owner-occupied units account for 325 (68.4%), while renter-occupied units make up 150 (31.6%).
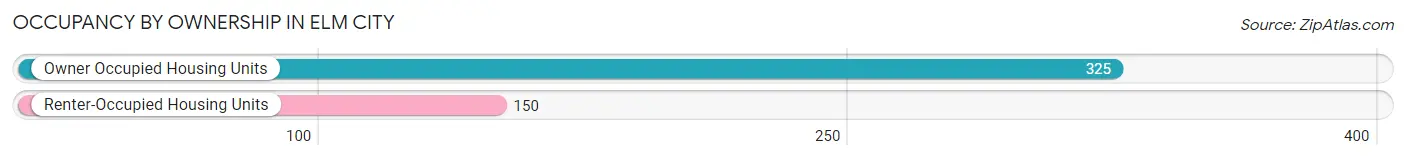
| Occupancy | # Housing Units | % Housing Units |
| Owner Occupied Housing Units | 325 | 68.4% |
| Renter-Occupied Housing Units | 150 | 31.6% |
| Total Occupied Housing Units | 475 | 100.0% |
Occupancy by Household Size in Elm City
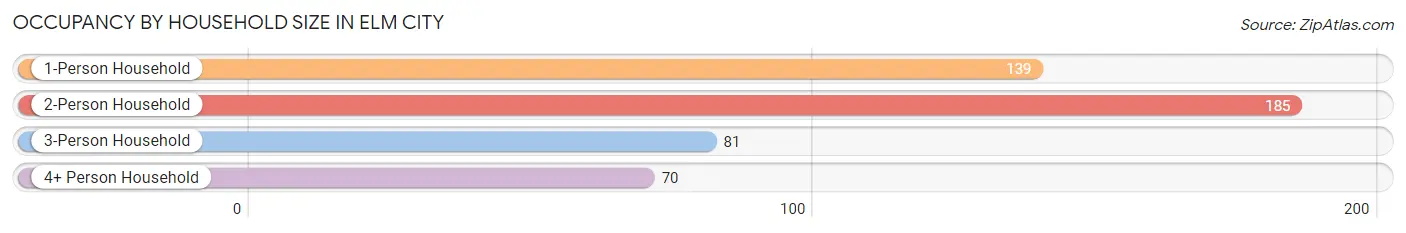
| Household Size | # Housing Units | % Housing Units |
| 1-Person Household | 139 | 29.3% |
| 2-Person Household | 185 | 39.0% |
| 3-Person Household | 81 | 17.1% |
| 4+ Person Household | 70 | 14.7% |
| Total Housing Units | 475 | 100.0% |
Occupancy by Ownership by Household Size in Elm City
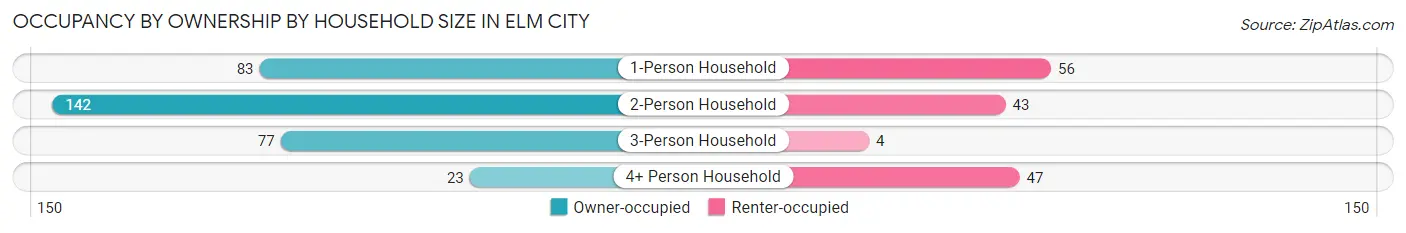
| Household Size | Owner-occupied | Renter-occupied |
| 1-Person Household | 83 (59.7%) | 56 (40.3%) |
| 2-Person Household | 142 (76.8%) | 43 (23.2%) |
| 3-Person Household | 77 (95.1%) | 4 (4.9%) |
| 4+ Person Household | 23 (32.9%) | 47 (67.1%) |
| Total Housing Units | 325 (68.4%) | 150 (31.6%) |
Occupancy by Educational Attainment in Elm City
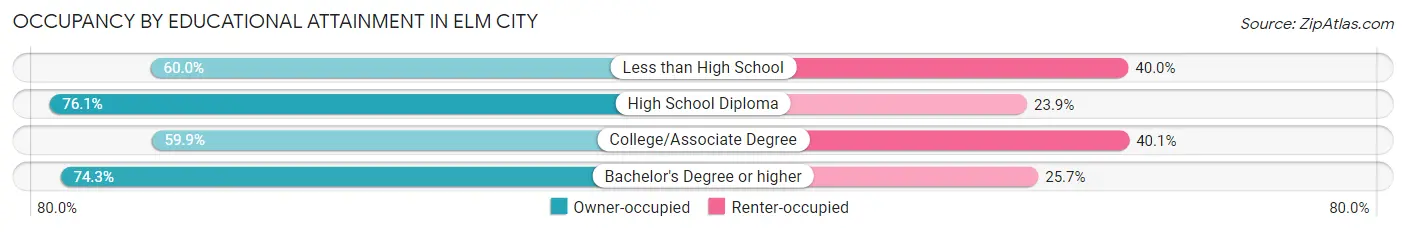
| Household Size | Owner-occupied | Renter-occupied |
| Less than High School | 45 (60.0%) | 30 (40.0%) |
| High School Diploma | 143 (76.1%) | 45 (23.9%) |
| College/Associate Degree | 85 (59.9%) | 57 (40.1%) |
| Bachelor's Degree or higher | 52 (74.3%) | 18 (25.7%) |
Occupancy by Age of Householder in Elm City
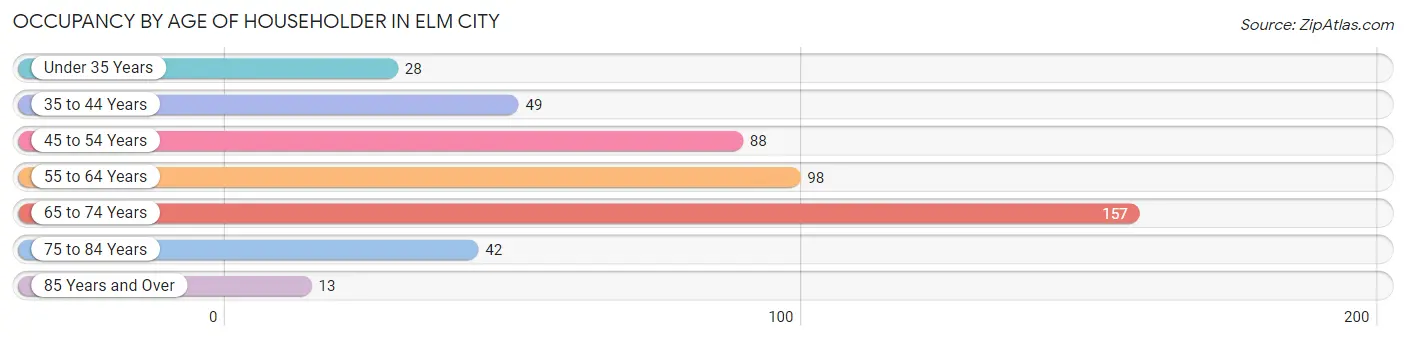
| Age Bracket | # Households | % Households |
| Under 35 Years | 28 | 5.9% |
| 35 to 44 Years | 49 | 10.3% |
| 45 to 54 Years | 88 | 18.5% |
| 55 to 64 Years | 98 | 20.6% |
| 65 to 74 Years | 157 | 33.1% |
| 75 to 84 Years | 42 | 8.8% |
| 85 Years and Over | 13 | 2.7% |
| Total | 475 | 100.0% |
Housing Finances in Elm City
Median Income by Occupancy in Elm City
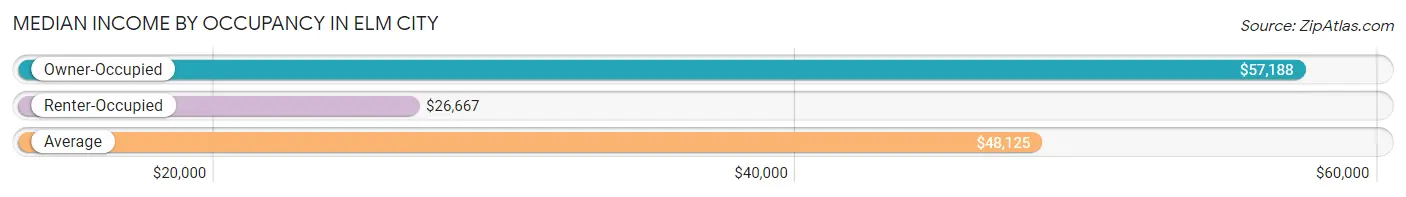
| Occupancy Type | # Households | Median Income |
| Owner-Occupied | 325 (68.4%) | $57,188 |
| Renter-Occupied | 150 (31.6%) | $26,667 |
| Average | 475 (100.0%) | $48,125 |
Occupancy by Householder Income Bracket in Elm City
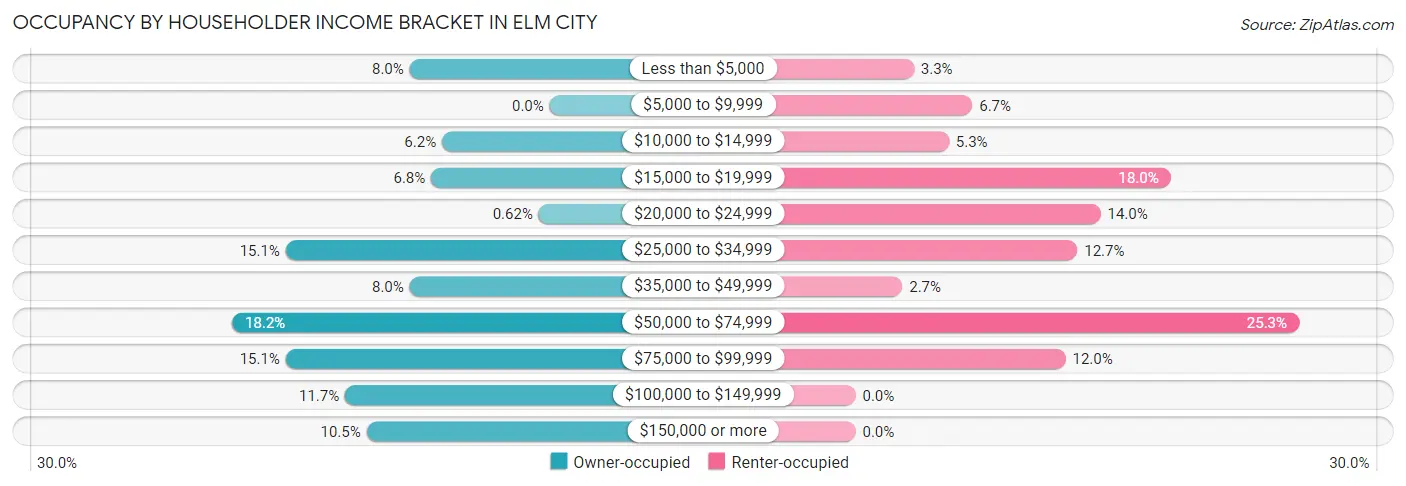
| Income Bracket | Owner-occupied | Renter-occupied |
| Less than $5,000 | 26 (8.0%) | 5 (3.3%) |
| $5,000 to $9,999 | 0 (0.0%) | 10 (6.7%) |
| $10,000 to $14,999 | 20 (6.1%) | 8 (5.3%) |
| $15,000 to $19,999 | 22 (6.8%) | 27 (18.0%) |
| $20,000 to $24,999 | 2 (0.6%) | 21 (14.0%) |
| $25,000 to $34,999 | 49 (15.1%) | 19 (12.7%) |
| $35,000 to $49,999 | 26 (8.0%) | 4 (2.7%) |
| $50,000 to $74,999 | 59 (18.1%) | 38 (25.3%) |
| $75,000 to $99,999 | 49 (15.1%) | 18 (12.0%) |
| $100,000 to $149,999 | 38 (11.7%) | 0 (0.0%) |
| $150,000 or more | 34 (10.5%) | 0 (0.0%) |
| Total | 325 (100.0%) | 150 (100.0%) |
Monthly Housing Cost Tiers in Elm City
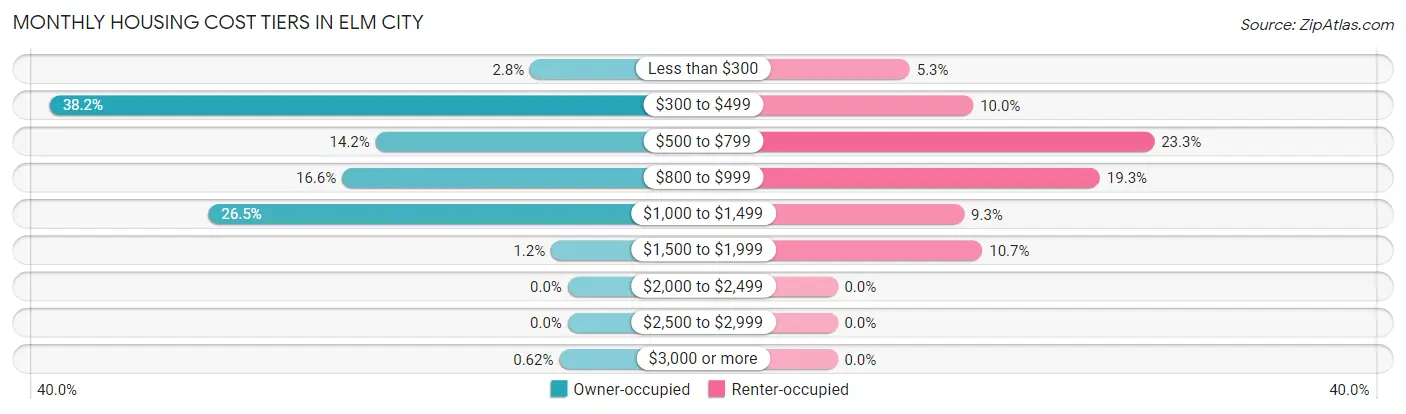
| Monthly Cost | Owner-occupied | Renter-occupied |
| Less than $300 | 9 (2.8%) | 8 (5.3%) |
| $300 to $499 | 124 (38.2%) | 15 (10.0%) |
| $500 to $799 | 46 (14.1%) | 35 (23.3%) |
| $800 to $999 | 54 (16.6%) | 29 (19.3%) |
| $1,000 to $1,499 | 86 (26.5%) | 14 (9.3%) |
| $1,500 to $1,999 | 4 (1.2%) | 16 (10.7%) |
| $2,000 to $2,499 | 0 (0.0%) | 0 (0.0%) |
| $2,500 to $2,999 | 0 (0.0%) | 0 (0.0%) |
| $3,000 or more | 2 (0.6%) | 0 (0.0%) |
| Total | 325 (100.0%) | 150 (100.0%) |
Physical Housing Characteristics in Elm City
Housing Structures in Elm City
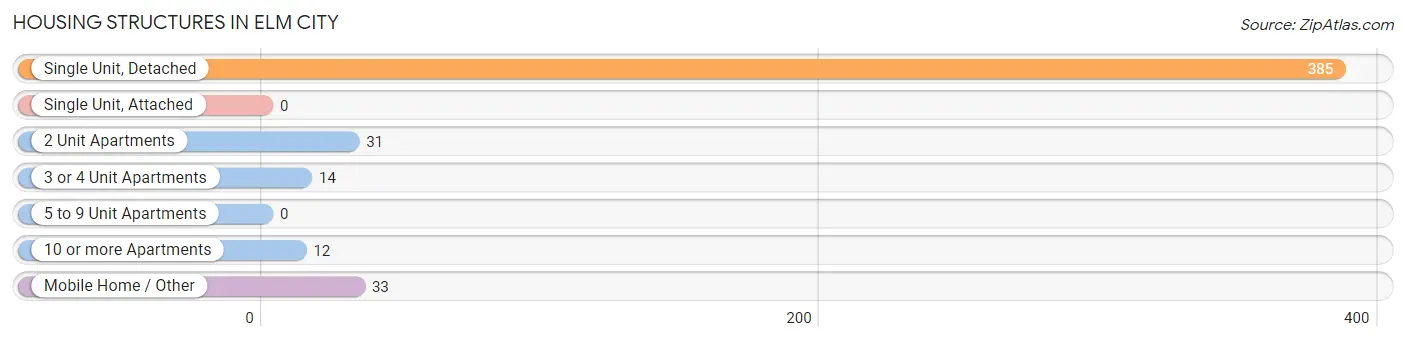
| Structure Type | # Housing Units | % Housing Units |
| Single Unit, Detached | 385 | 81.0% |
| Single Unit, Attached | 0 | 0.0% |
| 2 Unit Apartments | 31 | 6.5% |
| 3 or 4 Unit Apartments | 14 | 2.9% |
| 5 to 9 Unit Apartments | 0 | 0.0% |
| 10 or more Apartments | 12 | 2.5% |
| Mobile Home / Other | 33 | 7.0% |
| Total | 475 | 100.0% |
Housing Structures by Occupancy in Elm City
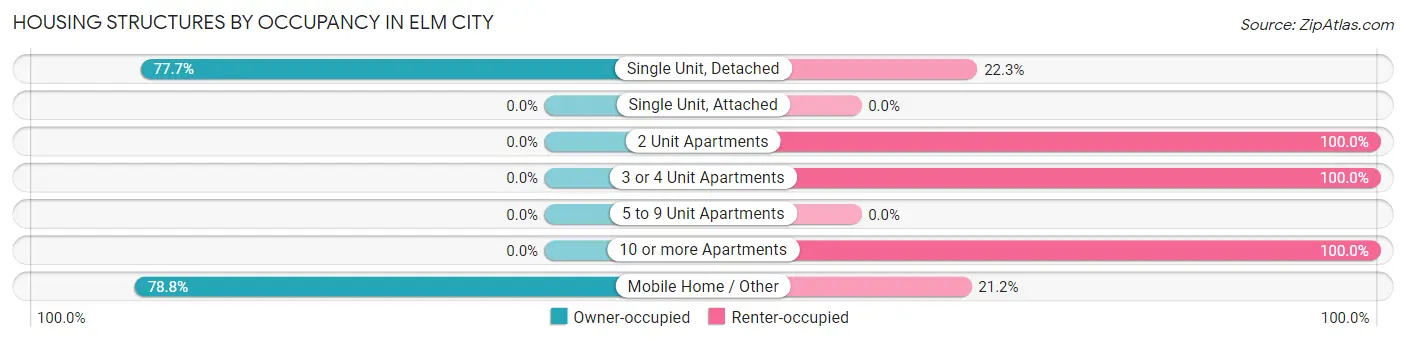
| Structure Type | Owner-occupied | Renter-occupied |
| Single Unit, Detached | 299 (77.7%) | 86 (22.3%) |
| Single Unit, Attached | 0 (0.0%) | 0 (0.0%) |
| 2 Unit Apartments | 0 (0.0%) | 31 (100.0%) |
| 3 or 4 Unit Apartments | 0 (0.0%) | 14 (100.0%) |
| 5 to 9 Unit Apartments | 0 (0.0%) | 0 (0.0%) |
| 10 or more Apartments | 0 (0.0%) | 12 (100.0%) |
| Mobile Home / Other | 26 (78.8%) | 7 (21.2%) |
| Total | 325 (68.4%) | 150 (31.6%) |
Housing Structures by Number of Rooms in Elm City
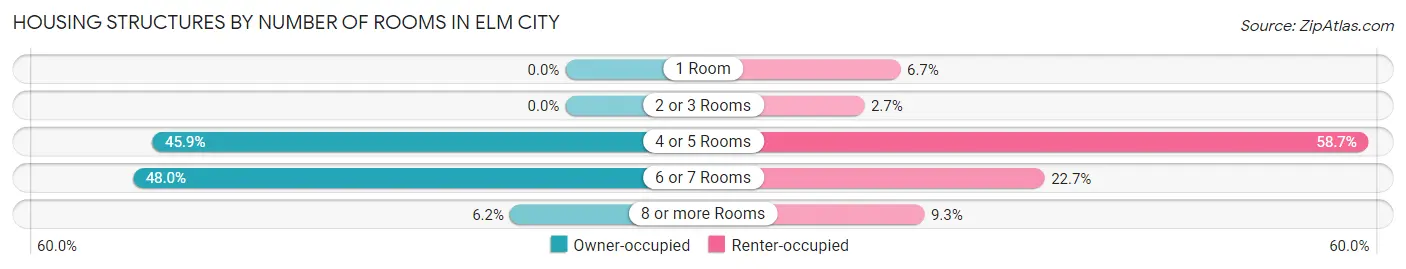
| Number of Rooms | Owner-occupied | Renter-occupied |
| 1 Room | 0 (0.0%) | 10 (6.7%) |
| 2 or 3 Rooms | 0 (0.0%) | 4 (2.7%) |
| 4 or 5 Rooms | 149 (45.9%) | 88 (58.7%) |
| 6 or 7 Rooms | 156 (48.0%) | 34 (22.7%) |
| 8 or more Rooms | 20 (6.1%) | 14 (9.3%) |
| Total | 325 (100.0%) | 150 (100.0%) |
Housing Structure by Heating Type in Elm City
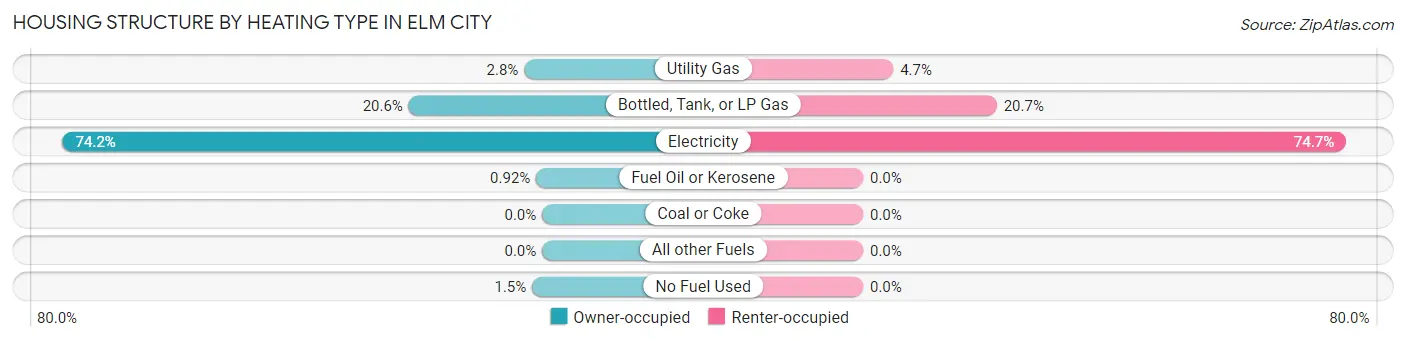
| Heating Type | Owner-occupied | Renter-occupied |
| Utility Gas | 9 (2.8%) | 7 (4.7%) |
| Bottled, Tank, or LP Gas | 67 (20.6%) | 31 (20.7%) |
| Electricity | 241 (74.2%) | 112 (74.7%) |
| Fuel Oil or Kerosene | 3 (0.9%) | 0 (0.0%) |
| Coal or Coke | 0 (0.0%) | 0 (0.0%) |
| All other Fuels | 0 (0.0%) | 0 (0.0%) |
| No Fuel Used | 5 (1.5%) | 0 (0.0%) |
| Total | 325 (100.0%) | 150 (100.0%) |
Household Vehicle Usage in Elm City
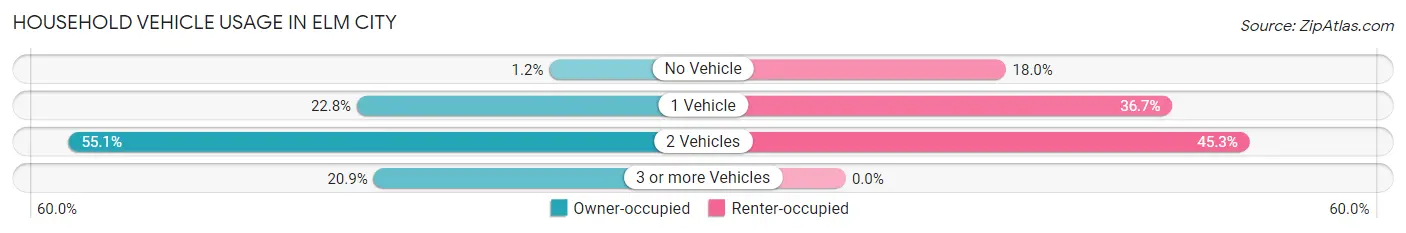
| Vehicles per Household | Owner-occupied | Renter-occupied |
| No Vehicle | 4 (1.2%) | 27 (18.0%) |
| 1 Vehicle | 74 (22.8%) | 55 (36.7%) |
| 2 Vehicles | 179 (55.1%) | 68 (45.3%) |
| 3 or more Vehicles | 68 (20.9%) | 0 (0.0%) |
| Total | 325 (100.0%) | 150 (100.0%) |
Real Estate & Mortgages in Elm City
Real Estate and Mortgage Overview in Elm City
| Characteristic | Without Mortgage | With Mortgage |
| Housing Units | 155 | 170 |
| Median Property Value | $95,800 | $100,700 |
| Median Household Income | $53,125 | $13 |
| Monthly Housing Costs | $438 | $0 |
| Real Estate Taxes | $1,039 | $4 |
Property Value by Mortgage Status in Elm City
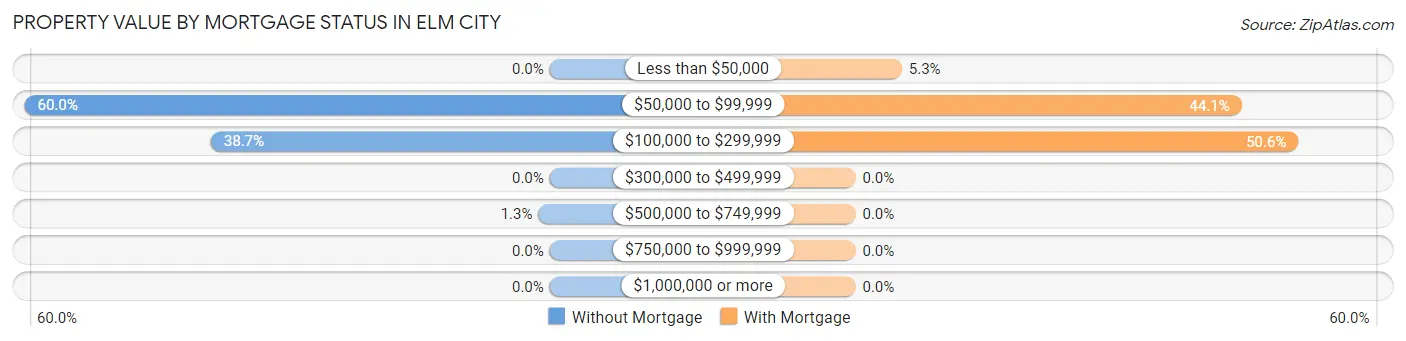
| Property Value | Without Mortgage | With Mortgage |
| Less than $50,000 | 0 (0.0%) | 9 (5.3%) |
| $50,000 to $99,999 | 93 (60.0%) | 75 (44.1%) |
| $100,000 to $299,999 | 60 (38.7%) | 86 (50.6%) |
| $300,000 to $499,999 | 0 (0.0%) | 0 (0.0%) |
| $500,000 to $749,999 | 2 (1.3%) | 0 (0.0%) |
| $750,000 to $999,999 | 0 (0.0%) | 0 (0.0%) |
| $1,000,000 or more | 0 (0.0%) | 0 (0.0%) |
| Total | 155 (100.0%) | 170 (100.0%) |
Household Income by Mortgage Status in Elm City
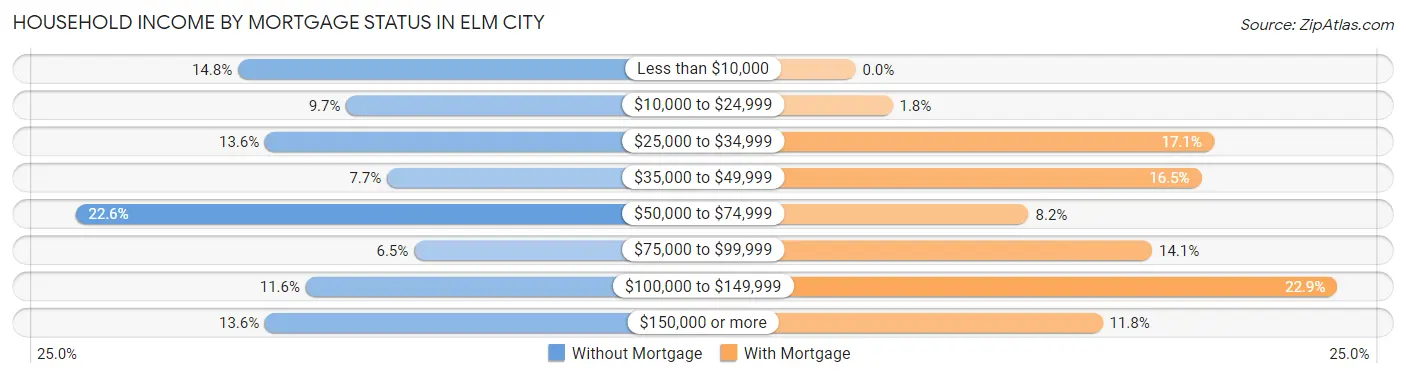
| Household Income | Without Mortgage | With Mortgage |
| Less than $10,000 | 23 (14.8%) | 0 (0.0%) |
| $10,000 to $24,999 | 15 (9.7%) | 3 (1.8%) |
| $25,000 to $34,999 | 21 (13.6%) | 29 (17.1%) |
| $35,000 to $49,999 | 12 (7.7%) | 28 (16.5%) |
| $50,000 to $74,999 | 35 (22.6%) | 14 (8.2%) |
| $75,000 to $99,999 | 10 (6.5%) | 24 (14.1%) |
| $100,000 to $149,999 | 18 (11.6%) | 39 (22.9%) |
| $150,000 or more | 21 (13.6%) | 20 (11.8%) |
| Total | 155 (100.0%) | 170 (100.0%) |
Property Value to Household Income Ratio in Elm City
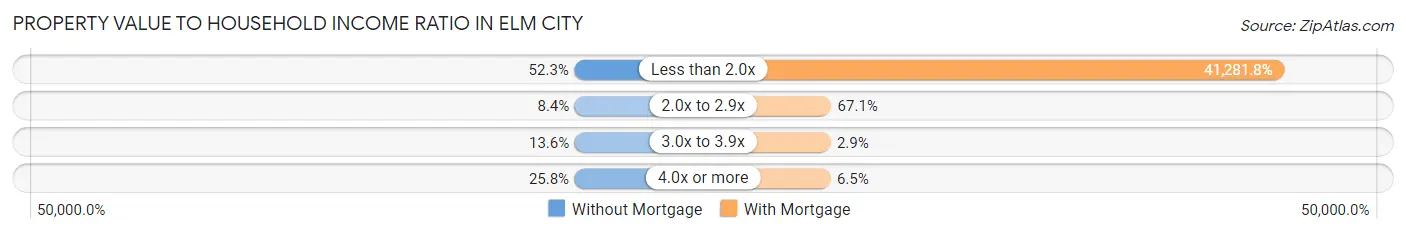
| Value-to-Income Ratio | Without Mortgage | With Mortgage |
| Less than 2.0x | 81 (52.3%) | 70,179 (41,281.8%) |
| 2.0x to 2.9x | 13 (8.4%) | 114 (67.1%) |
| 3.0x to 3.9x | 21 (13.6%) | 5 (2.9%) |
| 4.0x or more | 40 (25.8%) | 11 (6.5%) |
| Total | 155 (100.0%) | 170 (100.0%) |
Real Estate Taxes by Mortgage Status in Elm City
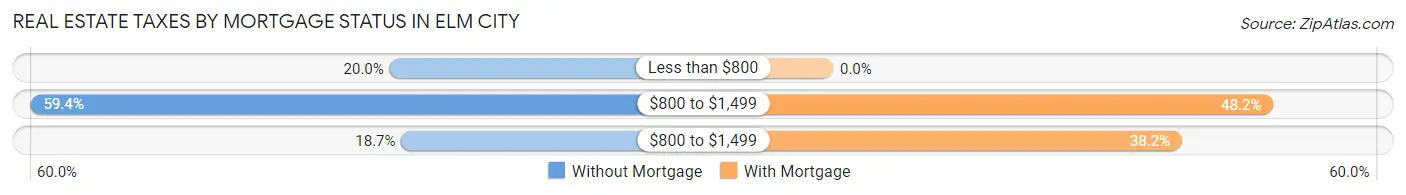
| Property Taxes | Without Mortgage | With Mortgage |
| Less than $800 | 31 (20.0%) | 0 (0.0%) |
| $800 to $1,499 | 92 (59.4%) | 82 (48.2%) |
| $800 to $1,499 | 29 (18.7%) | 65 (38.2%) |
| Total | 155 (100.0%) | 170 (100.0%) |
Health & Disability in Elm City
Health Insurance Coverage by Age in Elm City
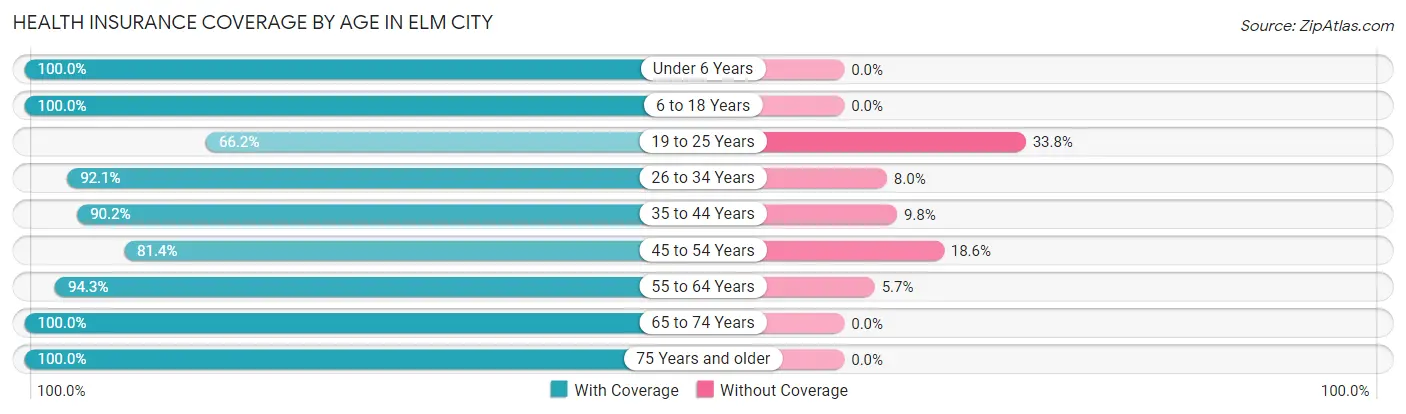
| Age Bracket | With Coverage | Without Coverage |
| Under 6 Years | 24 (100.0%) | 0 (0.0%) |
| 6 to 18 Years | 177 (100.0%) | 0 (0.0%) |
| 19 to 25 Years | 88 (66.2%) | 45 (33.8%) |
| 26 to 34 Years | 81 (92.0%) | 7 (8.0%) |
| 35 to 44 Years | 101 (90.2%) | 11 (9.8%) |
| 45 to 54 Years | 136 (81.4%) | 31 (18.6%) |
| 55 to 64 Years | 166 (94.3%) | 10 (5.7%) |
| 65 to 74 Years | 211 (100.0%) | 0 (0.0%) |
| 75 Years and older | 69 (100.0%) | 0 (0.0%) |
| Total | 1,053 (91.0%) | 104 (9.0%) |
Health Insurance Coverage by Citizenship Status in Elm City
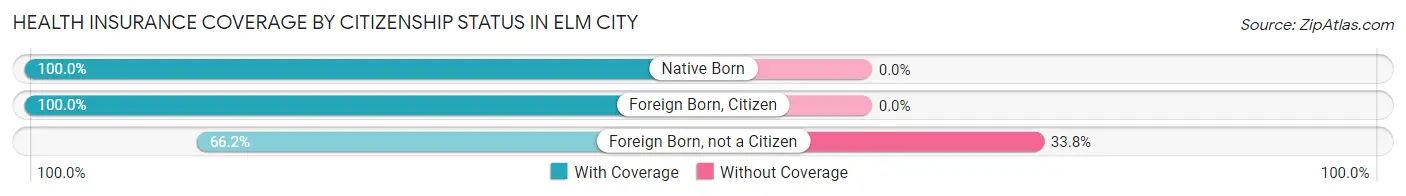
| Citizenship Status | With Coverage | Without Coverage |
| Native Born | 24 (100.0%) | 0 (0.0%) |
| Foreign Born, Citizen | 177 (100.0%) | 0 (0.0%) |
| Foreign Born, not a Citizen | 88 (66.2%) | 45 (33.8%) |
Health Insurance Coverage by Household Income in Elm City
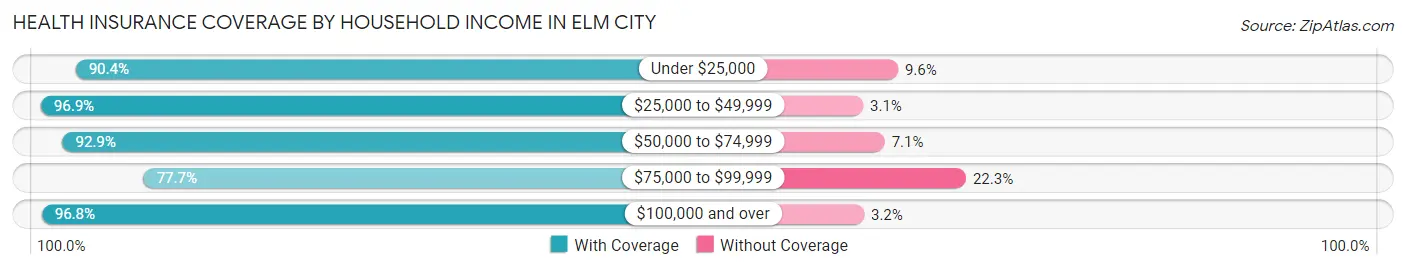
| Household Income | With Coverage | Without Coverage |
| Under $25,000 | 245 (90.4%) | 26 (9.6%) |
| $25,000 to $49,999 | 222 (96.9%) | 7 (3.1%) |
| $50,000 to $74,999 | 209 (92.9%) | 16 (7.1%) |
| $75,000 to $99,999 | 167 (77.7%) | 48 (22.3%) |
| $100,000 and over | 210 (96.8%) | 7 (3.2%) |
Public vs Private Health Insurance Coverage by Age in Elm City
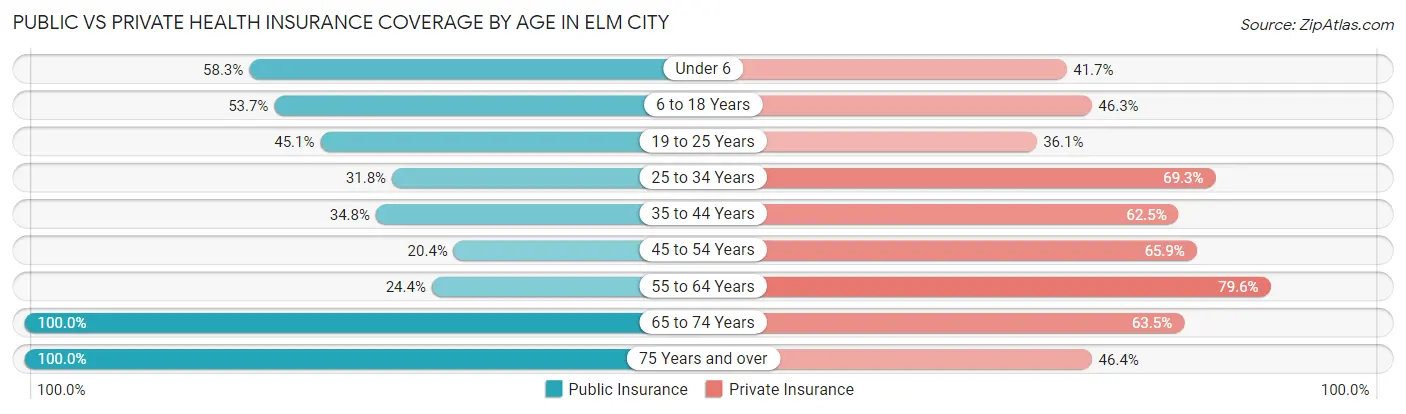
| Age Bracket | Public Insurance | Private Insurance |
| Under 6 | 14 (58.3%) | 10 (41.7%) |
| 6 to 18 Years | 95 (53.7%) | 82 (46.3%) |
| 19 to 25 Years | 60 (45.1%) | 48 (36.1%) |
| 25 to 34 Years | 28 (31.8%) | 61 (69.3%) |
| 35 to 44 Years | 39 (34.8%) | 70 (62.5%) |
| 45 to 54 Years | 34 (20.4%) | 110 (65.9%) |
| 55 to 64 Years | 43 (24.4%) | 140 (79.5%) |
| 65 to 74 Years | 211 (100.0%) | 134 (63.5%) |
| 75 Years and over | 69 (100.0%) | 32 (46.4%) |
| Total | 593 (51.2%) | 687 (59.4%) |
Disability Status by Sex by Age in Elm City
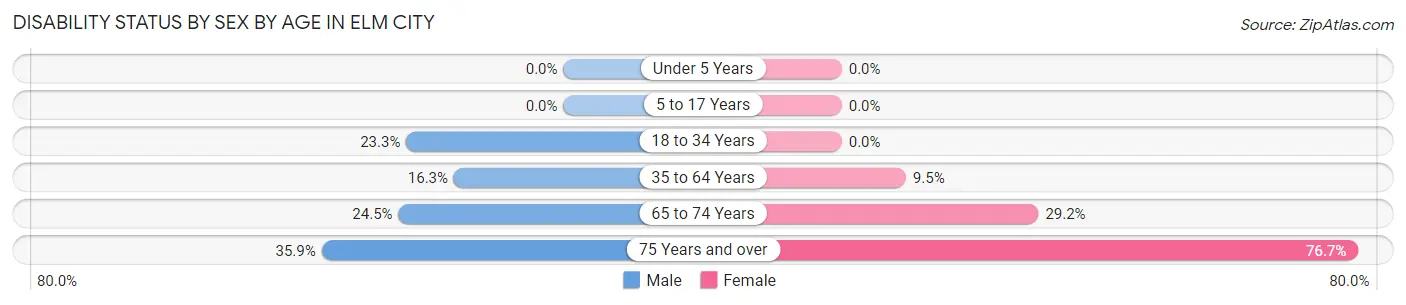
| Age Bracket | Male | Female |
| Under 5 Years | 0 (0.0%) | 0 (0.0%) |
| 5 to 17 Years | 0 (0.0%) | 0 (0.0%) |
| 18 to 34 Years | 35 (23.3%) | 0 (0.0%) |
| 35 to 64 Years | 33 (16.3%) | 24 (9.5%) |
| 65 to 74 Years | 24 (24.5%) | 33 (29.2%) |
| 75 Years and over | 14 (35.9%) | 23 (76.7%) |
Disability Class by Sex by Age in Elm City
Disability Class: Hearing Difficulty
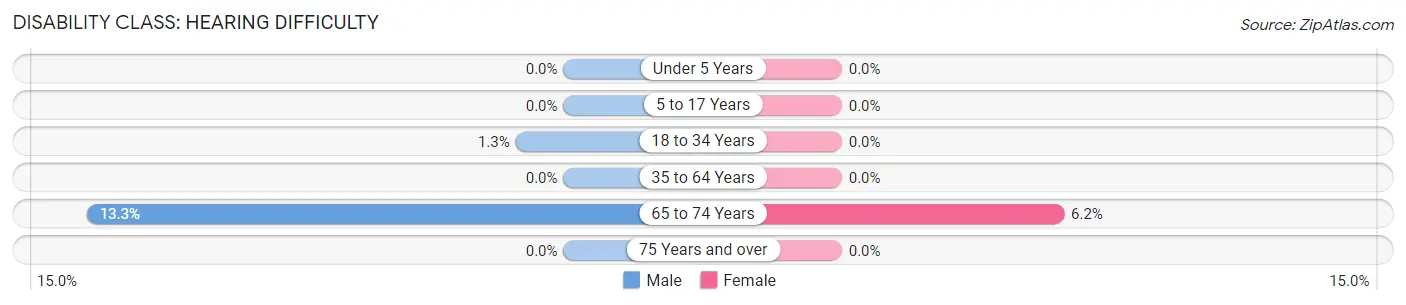
| Age Bracket | Male | Female |
| Under 5 Years | 0 (0.0%) | 0 (0.0%) |
| 5 to 17 Years | 0 (0.0%) | 0 (0.0%) |
| 18 to 34 Years | 2 (1.3%) | 0 (0.0%) |
| 35 to 64 Years | 0 (0.0%) | 0 (0.0%) |
| 65 to 74 Years | 13 (13.3%) | 7 (6.2%) |
| 75 Years and over | 0 (0.0%) | 0 (0.0%) |
Disability Class: Vision Difficulty
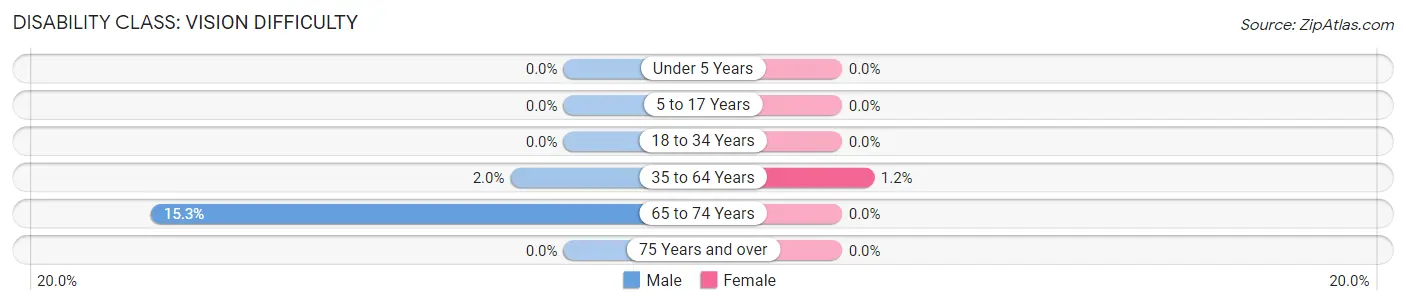
| Age Bracket | Male | Female |
| Under 5 Years | 0 (0.0%) | 0 (0.0%) |
| 5 to 17 Years | 0 (0.0%) | 0 (0.0%) |
| 18 to 34 Years | 0 (0.0%) | 0 (0.0%) |
| 35 to 64 Years | 4 (2.0%) | 3 (1.2%) |
| 65 to 74 Years | 15 (15.3%) | 0 (0.0%) |
| 75 Years and over | 0 (0.0%) | 0 (0.0%) |
Disability Class: Cognitive Difficulty
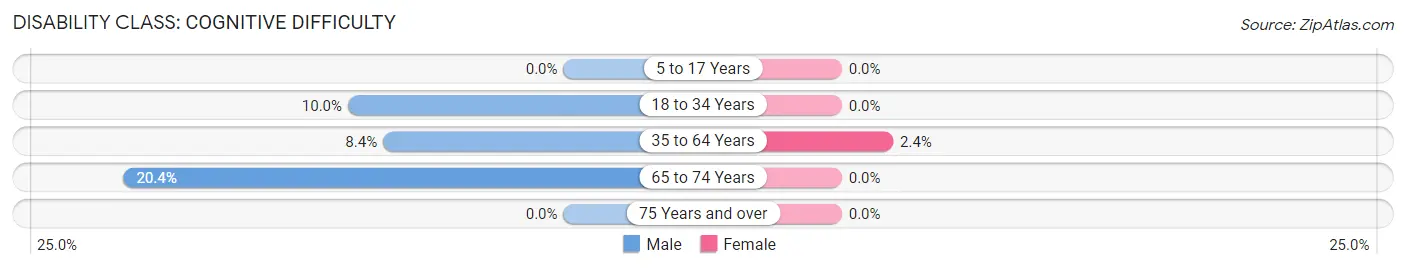
| Age Bracket | Male | Female |
| 5 to 17 Years | 0 (0.0%) | 0 (0.0%) |
| 18 to 34 Years | 15 (10.0%) | 0 (0.0%) |
| 35 to 64 Years | 17 (8.4%) | 6 (2.4%) |
| 65 to 74 Years | 20 (20.4%) | 0 (0.0%) |
| 75 Years and over | 0 (0.0%) | 0 (0.0%) |
Disability Class: Ambulatory Difficulty
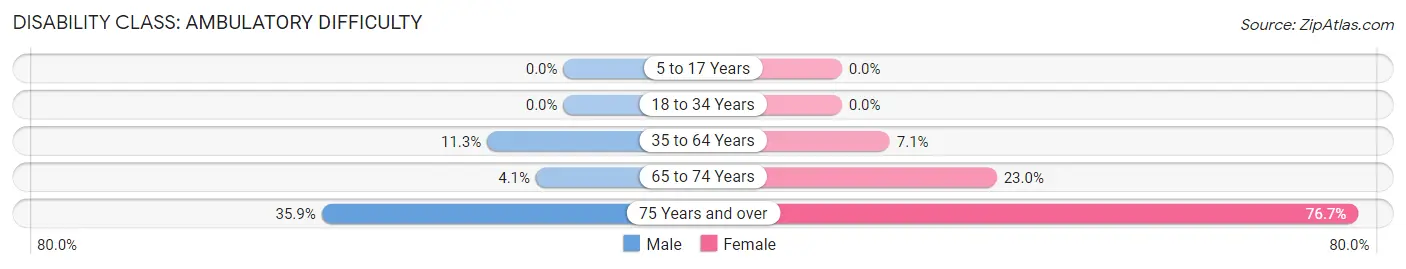
| Age Bracket | Male | Female |
| 5 to 17 Years | 0 (0.0%) | 0 (0.0%) |
| 18 to 34 Years | 0 (0.0%) | 0 (0.0%) |
| 35 to 64 Years | 23 (11.3%) | 18 (7.1%) |
| 65 to 74 Years | 4 (4.1%) | 26 (23.0%) |
| 75 Years and over | 14 (35.9%) | 23 (76.7%) |
Disability Class: Self-Care Difficulty
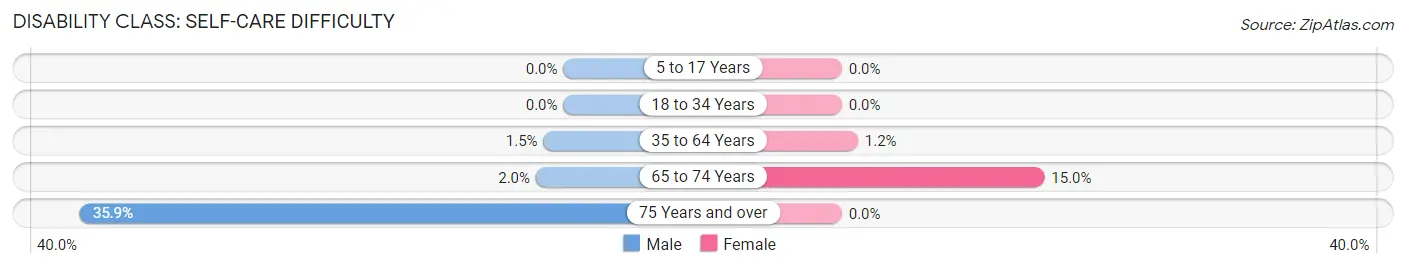
| Age Bracket | Male | Female |
| 5 to 17 Years | 0 (0.0%) | 0 (0.0%) |
| 18 to 34 Years | 0 (0.0%) | 0 (0.0%) |
| 35 to 64 Years | 3 (1.5%) | 3 (1.2%) |
| 65 to 74 Years | 2 (2.0%) | 17 (15.0%) |
| 75 Years and over | 14 (35.9%) | 0 (0.0%) |
Technology Access in Elm City
Computing Device Access in Elm City
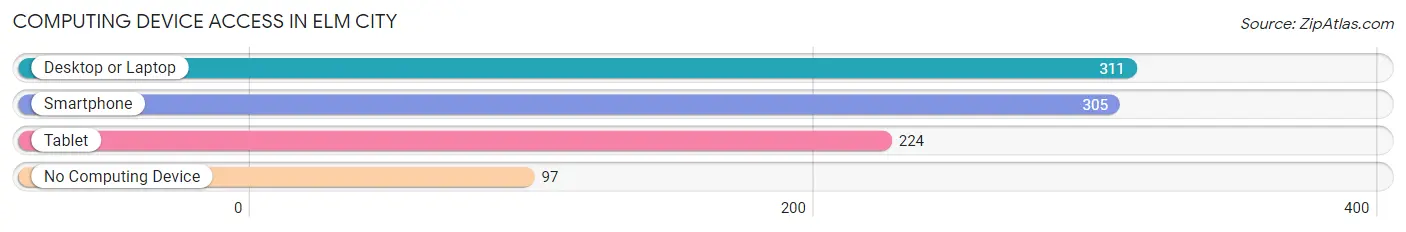
| Device Type | # Households | % Households |
| Desktop or Laptop | 311 | 65.5% |
| Smartphone | 305 | 64.2% |
| Tablet | 224 | 47.2% |
| No Computing Device | 97 | 20.4% |
| Total | 475 | 100.0% |
Internet Access in Elm City
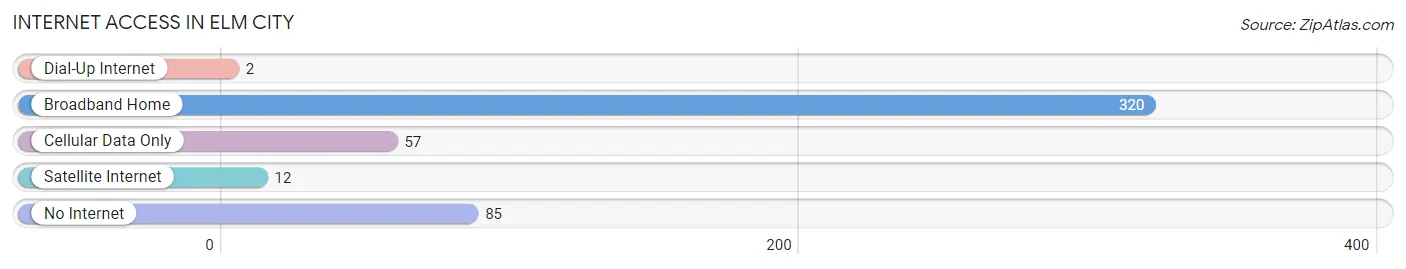
| Internet Type | # Households | % Households |
| Dial-Up Internet | 2 | 0.4% |
| Broadband Home | 320 | 67.4% |
| Cellular Data Only | 57 | 12.0% |
| Satellite Internet | 12 | 2.5% |
| No Internet | 85 | 17.9% |
| Total | 475 | 100.0% |
Elm City Summary
Elm City is a small town located in Wilson County, North Carolina. It is situated in the eastern part of the state, approximately 30 miles east of Raleigh. The town was founded in 1891 and has a population of approximately 2,000 people.
Geography
Elm City is located in the Coastal Plain region of North Carolina. The town is situated on the banks of the Tar River, which flows through the town and provides a source of recreation for the residents. The town is surrounded by rolling hills and farmland, and is located near the Neuse River. The town is located in a humid subtropical climate, with hot summers and mild winters.
Economy
The economy of Elm City is largely based on agriculture. The town is home to several farms, which produce a variety of crops, including corn, soybeans, cotton, and tobacco. The town also has a number of small businesses, including restaurants, retail stores, and service providers. The town is also home to a number of manufacturing companies, which produce a variety of products, including furniture, textiles, and electronics.
Demographics
As of the 2010 census, the population of Elm City was 2,000 people. The racial makeup of the town was 79.2% White, 16.2% African American, 0.7% Native American, 0.7% Asian, and 3.2% from other races. The median household income was $35,000, and the median family income was $41,000. The town has a poverty rate of 17.2%.
History
Elm City was founded in 1891 by a group of settlers from the nearby town of Wilson. The town was named after the elm trees that grew in the area. The town was originally a farming community, and the residents grew a variety of crops, including corn, soybeans, cotton, and tobacco. The town was also home to a number of small businesses, including restaurants, retail stores, and service providers.
In the early 20th century, the town began to experience a period of growth and development. The town was home to a number of manufacturing companies, which produced a variety of products, including furniture, textiles, and electronics. The town also became a popular tourist destination, and the town was home to a number of hotels and resorts.
In the late 20th century, the town began to experience a period of decline. The manufacturing companies began to move out of the town, and the population began to decline. The town has since experienced a period of revitalization, and the population has begun to increase. The town is now home to a number of small businesses, and the town is a popular tourist destination.
Common Questions
What is Per Capita Income in Elm City?
Per Capita income in Elm City is $25,503.
What is the Median Family Income in Elm City?
Median Family Income in Elm City is $60,952.
What is the Median Household income in Elm City?
Median Household Income in Elm City is $48,125.
What is Income or Wage Gap in Elm City?
Income or Wage Gap in Elm City is 23.1%.
Women in Elm City earn 76.9 cents for every dollar earned by a man.
What is Inequality or Gini Index in Elm City?
Inequality or Gini Index in Elm City is 0.44.
What is the Total Population of Elm City?
Total Population of Elm City is 1,157.
What is the Total Male Population of Elm City?
Total Male Population of Elm City is 626.
What is the Total Female Population of Elm City?
Total Female Population of Elm City is 531.
What is the Ratio of Males per 100 Females in Elm City?
There are 117.89 Males per 100 Females in Elm City.
What is the Ratio of Females per 100 Males in Elm City?
There are 84.82 Females per 100 Males in Elm City.
What is the Median Population Age in Elm City?
Median Population Age in Elm City is 48.0 Years.
What is the Average Family Size in Elm City
Average Family Size in Elm City is 3.0 People.
What is the Average Household Size in Elm City
Average Household Size in Elm City is 2.4 People.
How Large is the Labor Force in Elm City?
There are 495 People in the Labor Forcein in Elm City.
What is the Percentage of People in the Labor Force in Elm City?
48.4% of People are in the Labor Force in Elm City.
What is the Unemployment Rate in Elm City?
Unemployment Rate in Elm City is 6.3%.