Cities with the Most Immigrants from China in Pennsylvania
RELATED REPORTS & OPTIONS
China
Pennsylvania
Compare Cities
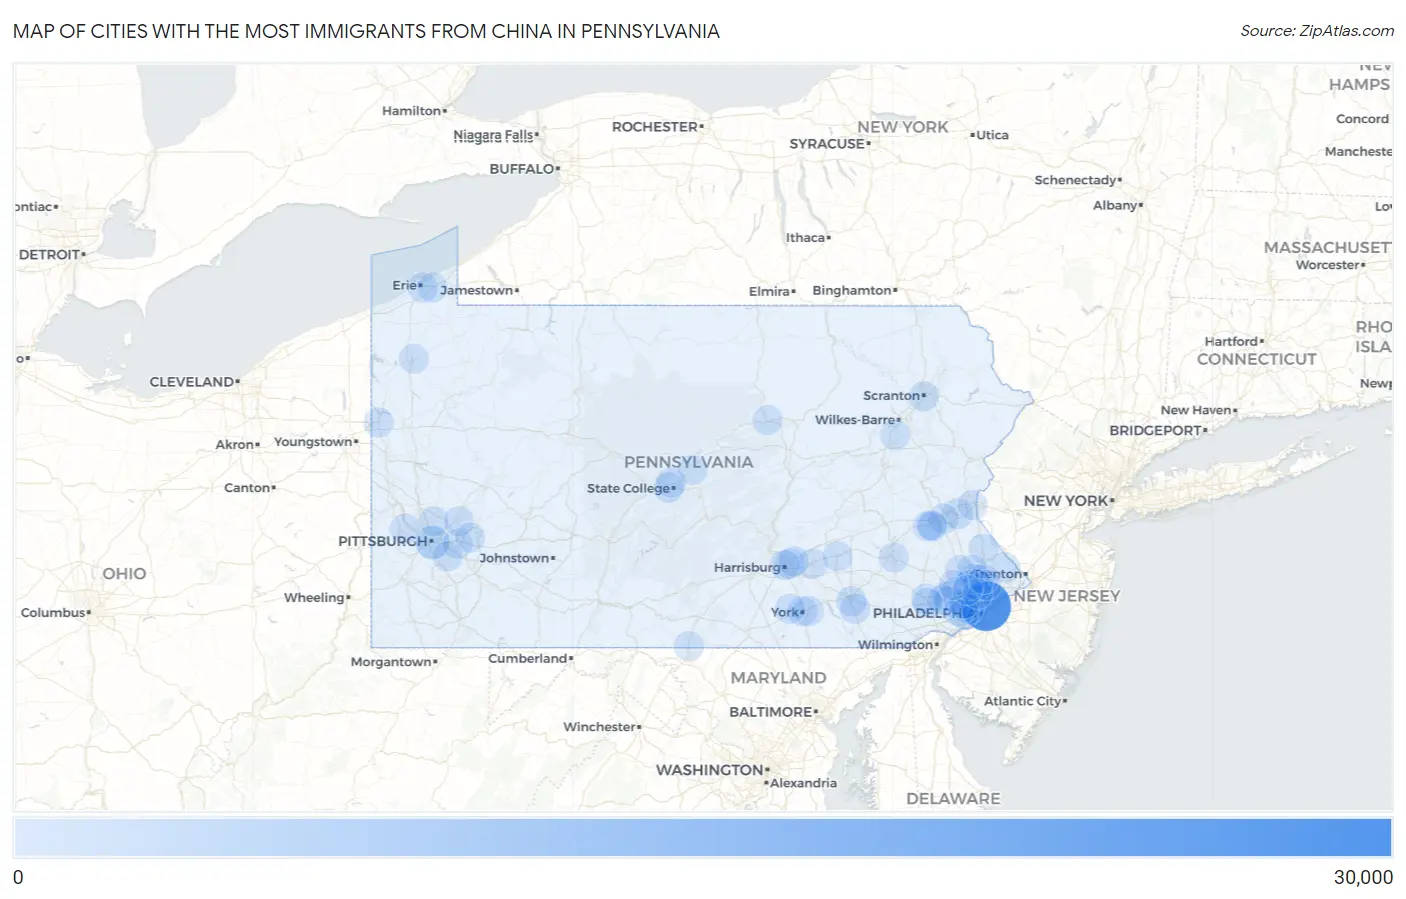
Map of Cities with the Most Immigrants from China in Pennsylvania
0
30,000
Cities with the Most Immigrants from China in Pennsylvania
| City | China | vs State | vs National | |
| 1. | Philadelphia | 26,264 | 77,046(34.09%)#1 | 2,829,008(0.93%)#9 |
| 2. | Pittsburgh | 4,651 | 77,046(6.04%)#2 | 2,829,008(0.16%)#76 |
| 3. | State College Borough | 1,775 | 77,046(2.30%)#3 | 2,829,008(0.06%)#196 |
| 4. | Bethlehem | 902 | 77,046(1.17%)#4 | 2,829,008(0.03%)#384 |
| 5. | King Of Prussia | 568 | 77,046(0.74%)#5 | 2,829,008(0.02%)#567 |
| 6. | Park Forest Village | 522 | 77,046(0.68%)#6 | 2,829,008(0.02%)#615 |
| 7. | Franklin Park Borough | 469 | 77,046(0.61%)#7 | 2,829,008(0.02%)#668 |
| 8. | Morgan Hill | 349 | 77,046(0.45%)#8 | 2,829,008(0.01%)#826 |
| 9. | Chesterbrook | 297 | 77,046(0.39%)#9 | 2,829,008(0.01%)#928 |
| 10. | Swarthmore Borough | 289 | 77,046(0.38%)#10 | 2,829,008(0.01%)#945 |
| 11. | Lancaster | 286 | 77,046(0.37%)#11 | 2,829,008(0.01%)#951 |
| 12. | Penn Wynne | 269 | 77,046(0.35%)#12 | 2,829,008(0.01%)#1,008 |
| 13. | Allentown | 244 | 77,046(0.32%)#13 | 2,829,008(0.01%)#1,079 |
| 14. | Willow Street | 232 | 77,046(0.30%)#14 | 2,829,008(0.01%)#1,136 |
| 15. | Scranton | 231 | 77,046(0.30%)#15 | 2,829,008(0.01%)#1,140 |
| 16. | Lionville | 224 | 77,046(0.29%)#16 | 2,829,008(0.01%)#1,180 |
| 17. | Spring House | 209 | 77,046(0.27%)#17 | 2,829,008(0.01%)#1,236 |
| 18. | Hershey | 207 | 77,046(0.27%)#18 | 2,829,008(0.01%)#1,242 |
| 19. | Allison Park | 202 | 77,046(0.26%)#19 | 2,829,008(0.01%)#1,272 |
| 20. | Maple Glen | 200 | 77,046(0.26%)#20 | 2,829,008(0.01%)#1,282 |
| 21. | Phoenixville Borough | 198 | 77,046(0.26%)#21 | 2,829,008(0.01%)#1,295 |
| 22. | Narberth Borough | 194 | 77,046(0.25%)#22 | 2,829,008(0.01%)#1,311 |
| 23. | Berwyn | 193 | 77,046(0.25%)#23 | 2,829,008(0.01%)#1,317 |
| 24. | Paoli | 189 | 77,046(0.25%)#24 | 2,829,008(0.01%)#1,333 |
| 25. | Easton | 182 | 77,046(0.24%)#25 | 2,829,008(0.01%)#1,367 |
| 26. | Ardmore | 181 | 77,046(0.23%)#26 | 2,829,008(0.01%)#1,374 |
| 27. | Toftrees | 180 | 77,046(0.23%)#27 | 2,829,008(0.01%)#1,380 |
| 28. | Breinigsville | 173 | 77,046(0.22%)#28 | 2,829,008(0.01%)#1,418 |
| 29. | Rosemont | 173 | 77,046(0.22%)#29 | 2,829,008(0.01%)#1,420 |
| 30. | Bala Cynwyd | 171 | 77,046(0.22%)#30 | 2,829,008(0.01%)#1,430 |
| 31. | Montgomeryville | 167 | 77,046(0.22%)#31 | 2,829,008(0.01%)#1,451 |
| 32. | Broomall | 164 | 77,046(0.21%)#32 | 2,829,008(0.01%)#1,465 |
| 33. | St. Davids | 159 | 77,046(0.21%)#33 | 2,829,008(0.01%)#1,506 |
| 34. | Carnot Moon | 157 | 77,046(0.20%)#34 | 2,829,008(0.01%)#1,518 |
| 35. | Aspinwall Borough | 151 | 77,046(0.20%)#35 | 2,829,008(0.01%)#1,564 |
| 36. | Castle Shannon Borough | 150 | 77,046(0.19%)#36 | 2,829,008(0.01%)#1,570 |
| 37. | Jefferson Hills Borough | 149 | 77,046(0.19%)#37 | 2,829,008(0.01%)#1,573 |
| 38. | Newtown Grant | 145 | 77,046(0.19%)#38 | 2,829,008(0.01%)#1,608 |
| 39. | Willow Grove | 140 | 77,046(0.18%)#39 | 2,829,008(0.00%)#1,633 |
| 40. | Kulpsville | 140 | 77,046(0.18%)#40 | 2,829,008(0.00%)#1,634 |
| 41. | Reading | 134 | 77,046(0.17%)#41 | 2,829,008(0.00%)#1,686 |
| 42. | Progress | 132 | 77,046(0.17%)#42 | 2,829,008(0.00%)#1,703 |
| 43. | Monroeville | 130 | 77,046(0.17%)#43 | 2,829,008(0.00%)#1,715 |
| 44. | Fort Washington | 128 | 77,046(0.17%)#44 | 2,829,008(0.00%)#1,740 |
| 45. | Drexel Hill | 126 | 77,046(0.16%)#45 | 2,829,008(0.00%)#1,750 |
| 46. | Media Borough | 124 | 77,046(0.16%)#46 | 2,829,008(0.00%)#1,776 |
| 47. | Trexlertown | 118 | 77,046(0.15%)#47 | 2,829,008(0.00%)#1,827 |
| 48. | New Kensington | 113 | 77,046(0.15%)#48 | 2,829,008(0.00%)#1,866 |
| 49. | Bryn Mawr | 113 | 77,046(0.15%)#49 | 2,829,008(0.00%)#1,869 |
| 50. | Merion Station | 109 | 77,046(0.14%)#50 | 2,829,008(0.00%)#1,910 |
| 51. | Fox Chapel Borough | 107 | 77,046(0.14%)#51 | 2,829,008(0.00%)#1,938 |
| 52. | Wesleyville Borough | 104 | 77,046(0.13%)#52 | 2,829,008(0.00%)#1,973 |
| 53. | Murrysville | 102 | 77,046(0.13%)#53 | 2,829,008(0.00%)#1,989 |
| 54. | Wilkinsburg Borough | 102 | 77,046(0.13%)#54 | 2,829,008(0.00%)#1,992 |
| 55. | East York | 91 | 77,046(0.12%)#55 | 2,829,008(0.00%)#2,137 |
| 56. | Williamsport | 90 | 77,046(0.12%)#56 | 2,829,008(0.00%)#2,145 |
| 57. | Colonial Park | 88 | 77,046(0.11%)#57 | 2,829,008(0.00%)#2,177 |
| 58. | Hermitage | 88 | 77,046(0.11%)#58 | 2,829,008(0.00%)#2,178 |
| 59. | Ancient Oaks | 88 | 77,046(0.11%)#59 | 2,829,008(0.00%)#2,184 |
| 60. | Blue Bell | 88 | 77,046(0.11%)#60 | 2,829,008(0.00%)#2,185 |
| 61. | Lebanon | 86 | 77,046(0.11%)#61 | 2,829,008(0.00%)#2,208 |
| 62. | Penn Farms | 86 | 77,046(0.11%)#62 | 2,829,008(0.00%)#2,219 |
| 63. | Harrisburg | 85 | 77,046(0.11%)#63 | 2,829,008(0.00%)#2,221 |
| 64. | York | 84 | 77,046(0.11%)#64 | 2,829,008(0.00%)#2,234 |
| 65. | Elizabethtown Borough | 83 | 77,046(0.11%)#65 | 2,829,008(0.00%)#2,249 |
| 66. | Northampton Borough | 83 | 77,046(0.11%)#66 | 2,829,008(0.00%)#2,253 |
| 67. | Chambersburg Borough | 82 | 77,046(0.11%)#67 | 2,829,008(0.00%)#2,261 |
| 68. | Eagleville Cdp Montgomery County | 82 | 77,046(0.11%)#68 | 2,829,008(0.00%)#2,268 |
| 69. | Wyomissing Borough | 81 | 77,046(0.11%)#69 | 2,829,008(0.00%)#2,283 |
| 70. | Middletown Borough | 81 | 77,046(0.11%)#70 | 2,829,008(0.00%)#2,285 |
| 71. | Wayne | 81 | 77,046(0.11%)#71 | 2,829,008(0.00%)#2,290 |
| 72. | West Reading Borough | 80 | 77,046(0.10%)#72 | 2,829,008(0.00%)#2,307 |
| 73. | Mckeesport | 76 | 77,046(0.10%)#73 | 2,829,008(0.00%)#2,363 |
| 74. | Whitehall Borough | 76 | 77,046(0.10%)#74 | 2,829,008(0.00%)#2,365 |
| 75. | Mountain Top | 73 | 77,046(0.09%)#75 | 2,829,008(0.00%)#2,418 |
| 76. | Roslyn | 73 | 77,046(0.09%)#76 | 2,829,008(0.00%)#2,421 |
| 77. | Paxtang Borough | 71 | 77,046(0.09%)#77 | 2,829,008(0.00%)#2,467 |
| 78. | Morton Borough | 70 | 77,046(0.09%)#78 | 2,829,008(0.00%)#2,487 |
| 79. | Erie | 69 | 77,046(0.09%)#79 | 2,829,008(0.00%)#2,489 |
| 80. | Villanova | 69 | 77,046(0.09%)#80 | 2,829,008(0.00%)#2,498 |
| 81. | Wyndmoor | 68 | 77,046(0.09%)#81 | 2,829,008(0.00%)#2,522 |
| 82. | Penn State Erie Behrend | 68 | 77,046(0.09%)#82 | 2,829,008(0.00%)#2,526 |
| 83. | Plumsteadville | 67 | 77,046(0.09%)#83 | 2,829,008(0.00%)#2,543 |
| 84. | Horsham | 65 | 77,046(0.08%)#84 | 2,829,008(0.00%)#2,572 |
| 85. | Meadville | 65 | 77,046(0.08%)#85 | 2,829,008(0.00%)#2,575 |
| 86. | Clifton Heights Borough | 65 | 77,046(0.08%)#86 | 2,829,008(0.00%)#2,580 |
| 87. | Trooper | 64 | 77,046(0.08%)#87 | 2,829,008(0.00%)#2,601 |
| 88. | Zion | 64 | 77,046(0.08%)#88 | 2,829,008(0.00%)#2,605 |
| 89. | Avondale Borough | 63 | 77,046(0.08%)#89 | 2,829,008(0.00%)#2,628 |
| 90. | Indiana Borough | 62 | 77,046(0.08%)#90 | 2,829,008(0.00%)#2,640 |
| 91. | Gettysburg Borough | 62 | 77,046(0.08%)#91 | 2,829,008(0.00%)#2,643 |
| 92. | Avalon Borough | 62 | 77,046(0.08%)#92 | 2,829,008(0.00%)#2,648 |
| 93. | State Line | 62 | 77,046(0.08%)#93 | 2,829,008(0.00%)#2,650 |
| 94. | Exton | 60 | 77,046(0.08%)#94 | 2,829,008(0.00%)#2,695 |
| 95. | Malvern Borough | 60 | 77,046(0.08%)#95 | 2,829,008(0.00%)#2,699 |
| 96. | Prospect Park Borough | 55 | 77,046(0.07%)#96 | 2,829,008(0.00%)#2,808 |
| 97. | Sellersville Borough | 54 | 77,046(0.07%)#97 | 2,829,008(0.00%)#2,831 |
| 98. | Big Beaver Borough | 54 | 77,046(0.07%)#98 | 2,829,008(0.00%)#2,833 |
| 99. | Weigelstown | 53 | 77,046(0.07%)#99 | 2,829,008(0.00%)#2,846 |
| 100. | Plymouth Meeting | 53 | 77,046(0.07%)#100 | 2,829,008(0.00%)#2,850 |
Common Questions
What are the Top 10 Cities with the Most Immigrants from China in Pennsylvania?
Top 10 Cities with the Most Immigrants from China in Pennsylvania are:
#1
26,264
#2
4,651
#3
902
#4
568
#5
522
#6
297
#7
286
#8
269
#9
244
#10
232
What city has the Most Immigrants from China in Pennsylvania?
Philadelphia has the Most Immigrants from China in Pennsylvania with 26,264.
What is the Total Immigrants from China in the State of Pennsylvania?
Total Immigrants from China in Pennsylvania is 77,046.
What is the Total Immigrants from China in the United States?
Total Immigrants from China in the United States is 2,829,008.