Eden, NC Map & Demographics
Eden Map
Eden Overview
$26,304
PER CAPITA INCOME
$62,111
AVG FAMILY INCOME
$43,607
AVG HOUSEHOLD INCOME
14.5%
WAGE / INCOME GAP [ % ]
85.5¢/ $1
WAGE / INCOME GAP [ $ ]
$10,550
FAMILY INCOME DEFICIT
0.49
INEQUALITY / GINI INDEX
15,349
TOTAL POPULATION
7,327
MALE POPULATION
8,022
FEMALE POPULATION
91.34
MALES / 100 FEMALES
109.49
FEMALES / 100 MALES
39.3
MEDIAN AGE
3.0
AVG FAMILY SIZE
2.4
AVG HOUSEHOLD SIZE
6,945
LABOR FORCE [ PEOPLE ]
56.2%
PERCENT IN LABOR FORCE
6.0%
UNEMPLOYMENT RATE
Eden Zip Codes
Eden Area Codes
Income in Eden
Income Overview in Eden
Per Capita Income in Eden is $26,304, while median incomes of families and households are $62,111 and $43,607 respectively.
| Characteristic | Number | Measure |
| Per Capita Income | 15,349 | $26,304 |
| Median Family Income | 3,767 | $62,111 |
| Mean Family Income | 3,767 | $80,010 |
| Median Household Income | 6,266 | $43,607 |
| Mean Household Income | 6,266 | $61,963 |
| Income Deficit | 3,767 | $10,550 |
| Wage / Income Gap (%) | 15,349 | 14.51% |
| Wage / Income Gap ($) | 15,349 | 85.49¢ per $1 |
| Gini / Inequality Index | 15,349 | 0.49 |
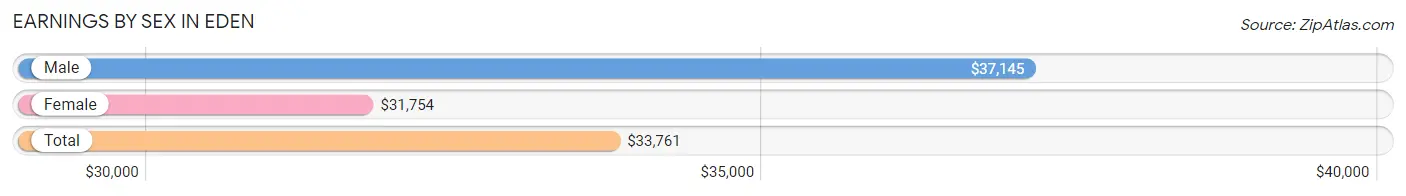
Earnings by Sex in Eden
Average Earnings in Eden are $33,761, $37,145 for men and $31,754 for women, a difference of 14.5%.
| Sex | Number | Average Earnings |
| Male | 3,905 (54.5%) | $37,145 |
| Female | 3,262 (45.5%) | $31,754 |
| Total | 7,167 (100.0%) | $33,761 |
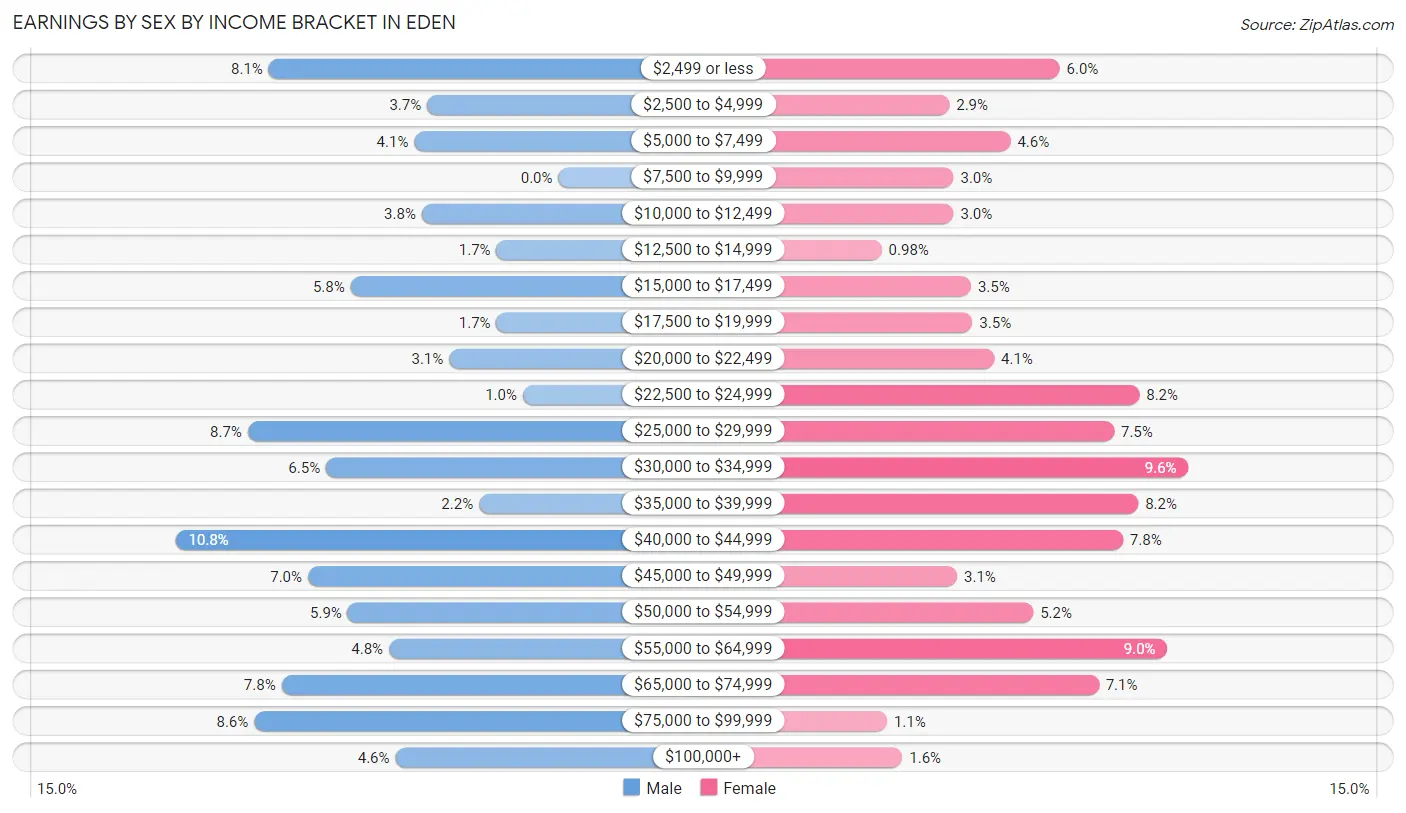
Earnings by Sex by Income Bracket in Eden
The most common earnings brackets in Eden are $40,000 to $44,999 for men (420 | 10.8%) and $30,000 to $34,999 for women (313 | 9.6%).
| Income | Male | Female |
| $2,499 or less | 318 (8.1%) | 195 (6.0%) |
| $2,500 to $4,999 | 144 (3.7%) | 94 (2.9%) |
| $5,000 to $7,499 | 158 (4.1%) | 150 (4.6%) |
| $7,500 to $9,999 | 0 (0.0%) | 98 (3.0%) |
| $10,000 to $12,499 | 150 (3.8%) | 98 (3.0%) |
| $12,500 to $14,999 | 68 (1.7%) | 32 (1.0%) |
| $15,000 to $17,499 | 228 (5.8%) | 114 (3.5%) |
| $17,500 to $19,999 | 68 (1.7%) | 115 (3.5%) |
| $20,000 to $22,499 | 120 (3.1%) | 135 (4.1%) |
| $22,500 to $24,999 | 39 (1.0%) | 268 (8.2%) |
| $25,000 to $29,999 | 341 (8.7%) | 245 (7.5%) |
| $30,000 to $34,999 | 255 (6.5%) | 313 (9.6%) |
| $35,000 to $39,999 | 87 (2.2%) | 267 (8.2%) |
| $40,000 to $44,999 | 420 (10.8%) | 253 (7.8%) |
| $45,000 to $49,999 | 275 (7.0%) | 101 (3.1%) |
| $50,000 to $54,999 | 231 (5.9%) | 171 (5.2%) |
| $55,000 to $64,999 | 186 (4.8%) | 294 (9.0%) |
| $65,000 to $74,999 | 304 (7.8%) | 231 (7.1%) |
| $75,000 to $99,999 | 334 (8.6%) | 37 (1.1%) |
| $100,000+ | 179 (4.6%) | 51 (1.6%) |
| Total | 3,905 (100.0%) | 3,262 (100.0%) |
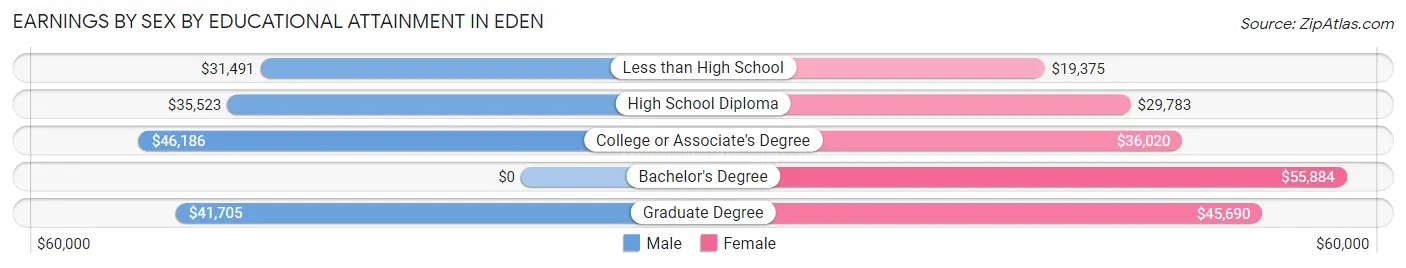
Earnings by Sex by Educational Attainment in Eden
Average earnings in Eden are $43,837 for men and $35,201 for women, a difference of 19.7%. Men with an educational attainment of college or associate's degree enjoy the highest average annual earnings of $46,186, while those with less than high school education earn the least with $31,491. Women with an educational attainment of bachelor's degree earn the most with the average annual earnings of $55,884, while those with less than high school education have the smallest earnings of $19,375.
| Educational Attainment | Male Income | Female Income |
| Less than High School | $31,491 | $19,375 |
| High School Diploma | $35,523 | $29,783 |
| College or Associate's Degree | $46,186 | $36,020 |
| Bachelor's Degree | - | - |
| Graduate Degree | $41,705 | $45,690 |
| Total | $43,837 | $35,201 |
Family Income in Eden
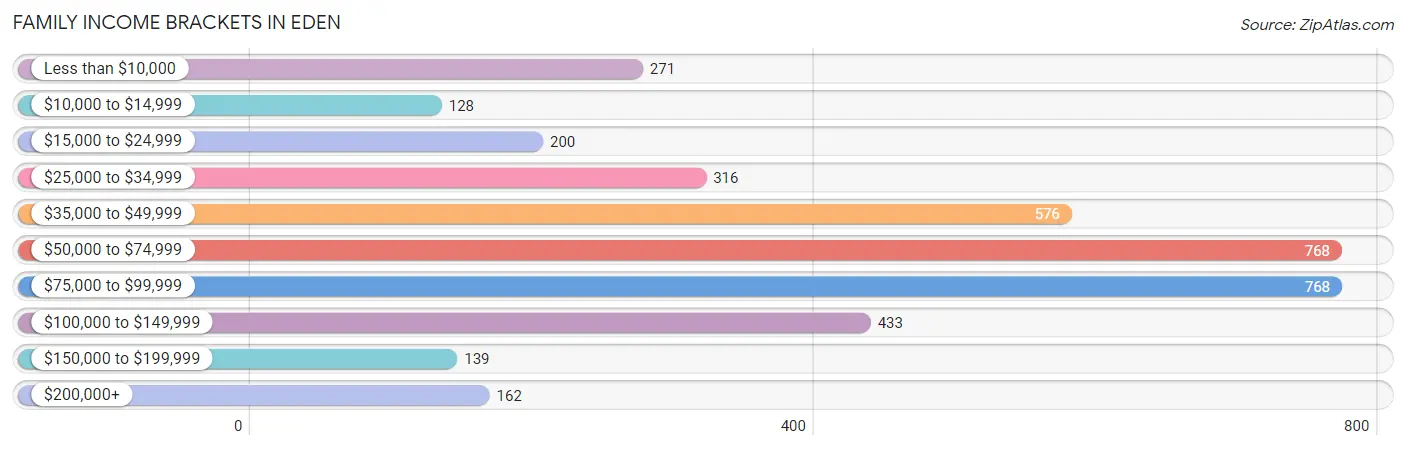
Family Income Brackets in Eden
According to the Eden family income data, there are 768 families falling into the $50,000 to $74,999 income range, which is the most common income bracket and makes up 20.4% of all families. Conversely, the $10,000 to $14,999 income bracket is the least frequent group with only 128 families (3.4%) belonging to this category.
| Income Bracket | # Families | % Families |
| Less than $10,000 | 271 | 7.2% |
| $10,000 to $14,999 | 128 | 3.4% |
| $15,000 to $24,999 | 200 | 5.3% |
| $25,000 to $34,999 | 316 | 8.4% |
| $35,000 to $49,999 | 576 | 15.3% |
| $50,000 to $74,999 | 768 | 20.4% |
| $75,000 to $99,999 | 768 | 20.4% |
| $100,000 to $149,999 | 433 | 11.5% |
| $150,000 to $199,999 | 139 | 3.7% |
| $200,000+ | 162 | 4.3% |
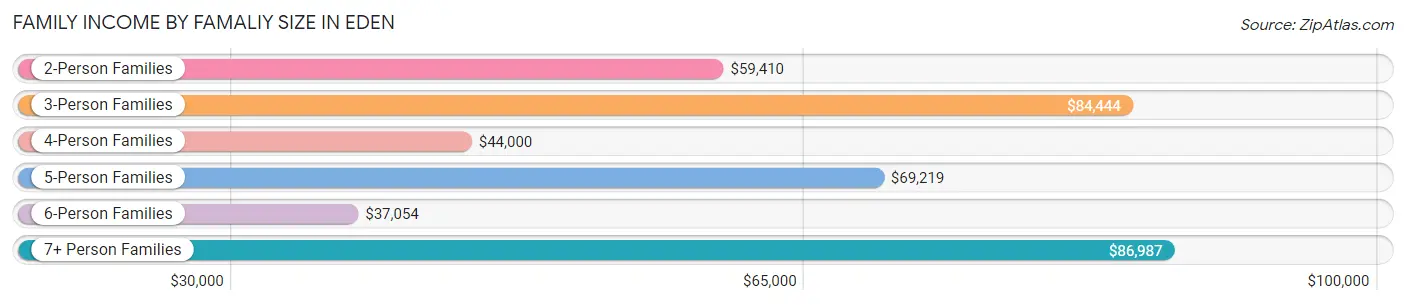
Family Income by Famaliy Size in Eden
7+ person families (84 | 2.2%) account for the highest median family income in Eden with $86,987 per family, while 2-person families (1,762 | 46.8%) have the highest median income of $29,705 per family member.
| Income Bracket | # Families | Median Income |
| 2-Person Families | 1,762 (46.8%) | $59,410 |
| 3-Person Families | 1,056 (28.0%) | $84,444 |
| 4-Person Families | 598 (15.9%) | $44,000 |
| 5-Person Families | 158 (4.2%) | $69,219 |
| 6-Person Families | 109 (2.9%) | $37,054 |
| 7+ Person Families | 84 (2.2%) | $86,987 |
| Total | 3,767 (100.0%) | $62,111 |
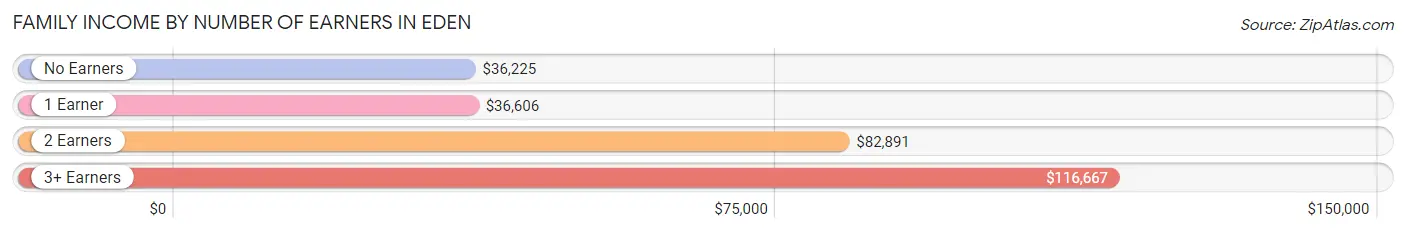
Family Income by Number of Earners in Eden
The median family income in Eden is $62,111, with families comprising 3+ earners (378) having the highest median family income of $116,667, while families with no earners (614) have the lowest median family income of $36,225, accounting for 10.0% and 16.3% of families, respectively.
| Number of Earners | # Families | Median Income |
| No Earners | 614 (16.3%) | $36,225 |
| 1 Earner | 1,354 (35.9%) | $36,606 |
| 2 Earners | 1,421 (37.7%) | $82,891 |
| 3+ Earners | 378 (10.0%) | $116,667 |
| Total | 3,767 (100.0%) | $62,111 |
Household Income in Eden
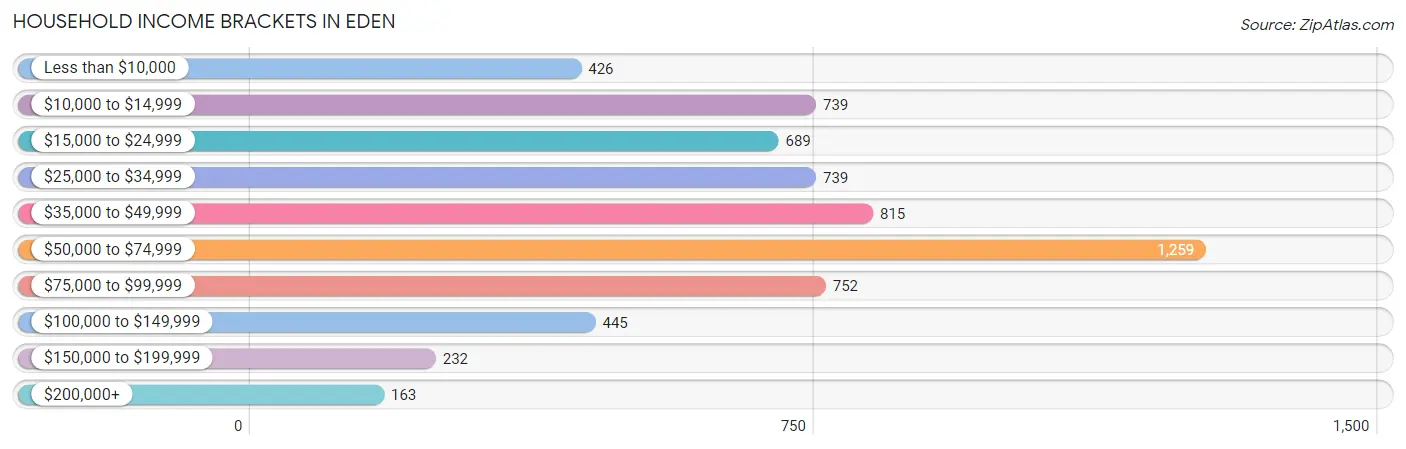
Household Income Brackets in Eden
With 1,259 households falling in the category, the $50,000 to $74,999 income range is the most frequent in Eden, accounting for 20.1% of all households. In contrast, only 163 households (2.6%) fall into the $200,000+ income bracket, making it the least populous group.
| Income Bracket | # Households | % Households |
| Less than $10,000 | 426 | 6.8% |
| $10,000 to $14,999 | 739 | 11.8% |
| $15,000 to $24,999 | 689 | 11.0% |
| $25,000 to $34,999 | 739 | 11.8% |
| $35,000 to $49,999 | 815 | 13.0% |
| $50,000 to $74,999 | 1,259 | 20.1% |
| $75,000 to $99,999 | 752 | 12.0% |
| $100,000 to $149,999 | 445 | 7.1% |
| $150,000 to $199,999 | 232 | 3.7% |
| $200,000+ | 163 | 2.6% |
Household Income by Householder Age in Eden
The median household income in Eden is $43,607, with the highest median household income of $50,764 found in the 45 to 64 years age bracket for the primary householder. A total of 2,290 households (36.5%) fall into this category. Meanwhile, the 65+ years age bracket for the primary householder has the lowest median household income of $29,394, with 1,692 households (27.0%) in this group.
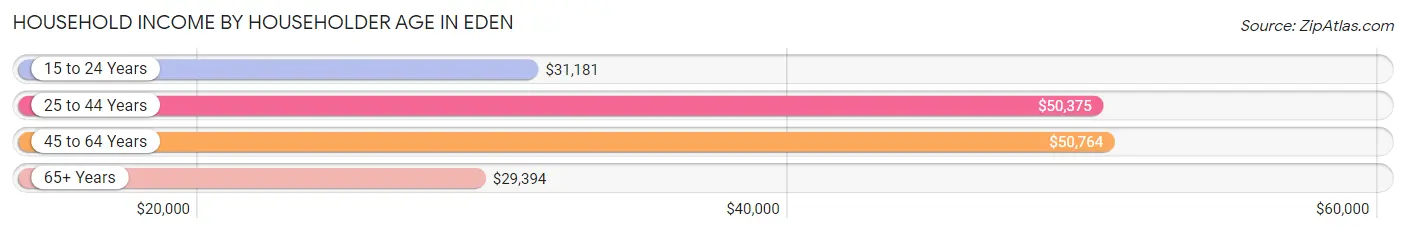
| Income Bracket | # Households | Median Income |
| 15 to 24 Years | 357 (5.7%) | $31,181 |
| 25 to 44 Years | 1,927 (30.7%) | $50,375 |
| 45 to 64 Years | 2,290 (36.5%) | $50,764 |
| 65+ Years | 1,692 (27.0%) | $29,394 |
| Total | 6,266 (100.0%) | $43,607 |
Poverty in Eden
Income Below Poverty by Sex and Age in Eden
With 21.2% poverty level for males and 23.1% for females among the residents of Eden, 6 to 11 year old males and under 5 year old females are the most vulnerable to poverty, with 239 males (58.4%) and 283 females (79.3%) in their respective age groups living below the poverty level.
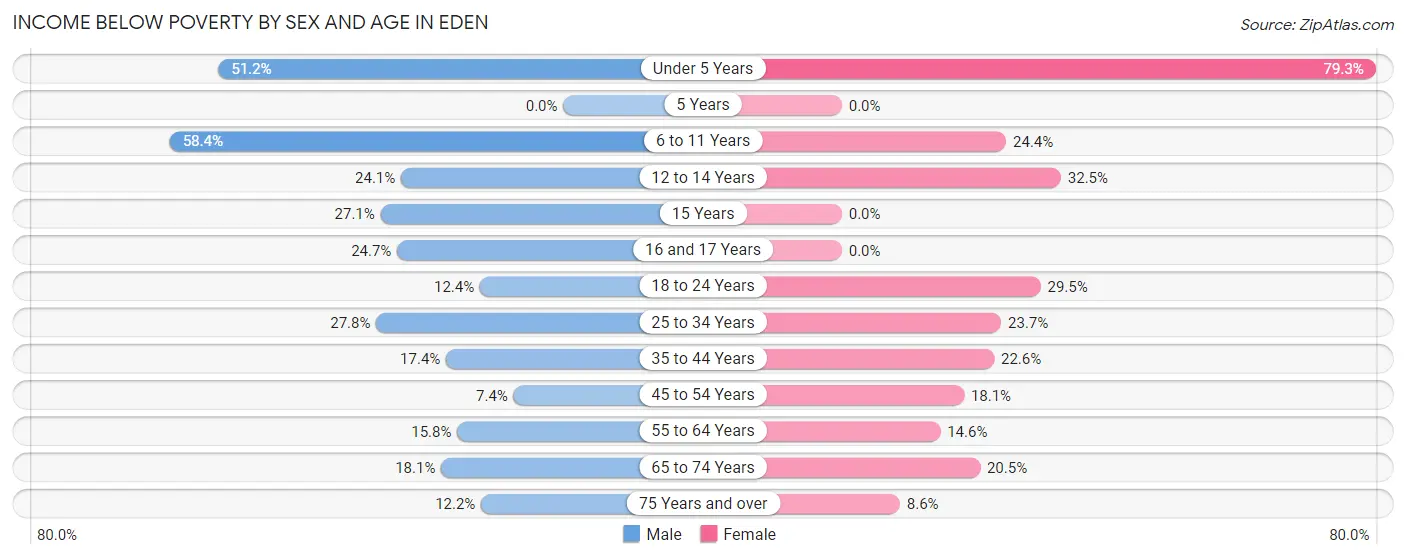
| Age Bracket | Male | Female |
| Under 5 Years | 208 (51.2%) | 283 (79.3%) |
| 5 Years | 0 (0.0%) | 0 (0.0%) |
| 6 to 11 Years | 239 (58.4%) | 133 (24.4%) |
| 12 to 14 Years | 53 (24.1%) | 190 (32.5%) |
| 15 Years | 19 (27.1%) | 0 (0.0%) |
| 16 and 17 Years | 74 (24.7%) | 0 (0.0%) |
| 18 to 24 Years | 82 (12.4%) | 175 (29.5%) |
| 25 to 34 Years | 267 (27.8%) | 247 (23.7%) |
| 35 to 44 Years | 178 (17.4%) | 225 (22.6%) |
| 45 to 54 Years | 81 (7.4%) | 156 (18.1%) |
| 55 to 64 Years | 152 (15.8%) | 143 (14.6%) |
| 65 to 74 Years | 101 (18.1%) | 158 (20.5%) |
| 75 Years and over | 51 (12.2%) | 63 (8.6%) |
| Total | 1,505 (21.2%) | 1,773 (23.1%) |
Income Above Poverty by Sex and Age in Eden
According to the poverty statistics in Eden, males aged 5 years and females aged 5 years are the age groups that are most secure financially, with 100.0% of males and 100.0% of females in these age groups living above the poverty line.
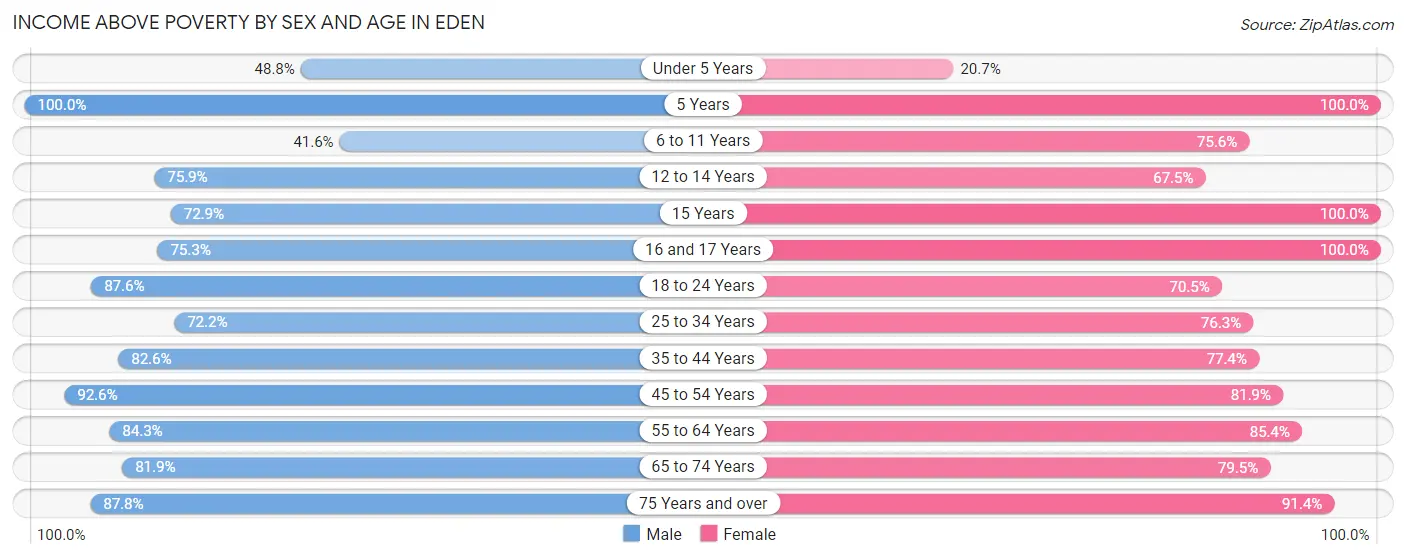
| Age Bracket | Male | Female |
| Under 5 Years | 198 (48.8%) | 74 (20.7%) |
| 5 Years | 17 (100.0%) | 30 (100.0%) |
| 6 to 11 Years | 170 (41.6%) | 412 (75.6%) |
| 12 to 14 Years | 167 (75.9%) | 394 (67.5%) |
| 15 Years | 51 (72.9%) | 12 (100.0%) |
| 16 and 17 Years | 226 (75.3%) | 183 (100.0%) |
| 18 to 24 Years | 581 (87.6%) | 418 (70.5%) |
| 25 to 34 Years | 694 (72.2%) | 797 (76.3%) |
| 35 to 44 Years | 845 (82.6%) | 770 (77.4%) |
| 45 to 54 Years | 1,016 (92.6%) | 704 (81.9%) |
| 55 to 64 Years | 813 (84.3%) | 835 (85.4%) |
| 65 to 74 Years | 456 (81.9%) | 612 (79.5%) |
| 75 Years and over | 367 (87.8%) | 668 (91.4%) |
| Total | 5,601 (78.8%) | 5,909 (76.9%) |
Income Below Poverty Among Married-Couple Families in Eden
The poverty statistics for married-couple families in Eden show that 11.0% or 283 of the total 2,576 families live below the poverty line. Families with 3 or 4 children have the highest poverty rate of 30.3%, comprising of 60 families. On the other hand, families with no children have the lowest poverty rate of 5.7%, which includes 84 families.
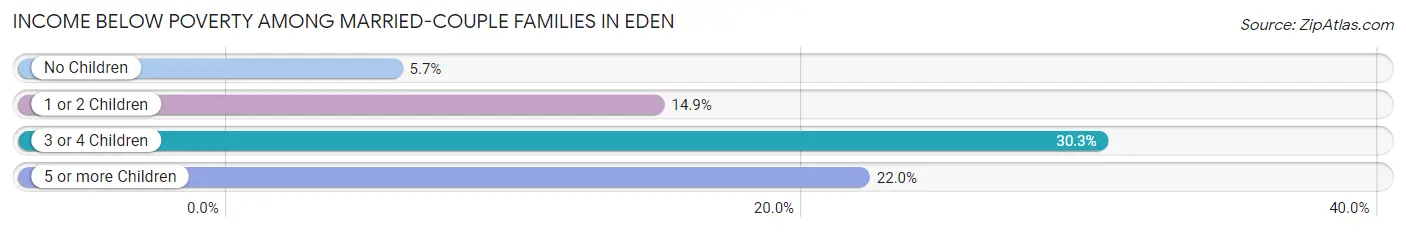
| Children | Above Poverty | Below Poverty |
| No Children | 1,382 (94.3%) | 84 (5.7%) |
| 1 or 2 Children | 734 (85.2%) | 128 (14.8%) |
| 3 or 4 Children | 138 (69.7%) | 60 (30.3%) |
| 5 or more Children | 39 (78.0%) | 11 (22.0%) |
| Total | 2,293 (89.0%) | 283 (11.0%) |
Income Below Poverty Among Single-Parent Households in Eden
According to the poverty data in Eden, 31.1% or 73 single-father households and 34.8% or 333 single-mother households are living below the poverty line. Among single-father households, those with 5 or more children have the highest poverty rate, with 14 households (100.0%) experiencing poverty. Likewise, among single-mother households, those with 3 or 4 children have the highest poverty rate, with 128 households (67.4%) falling below the poverty line.
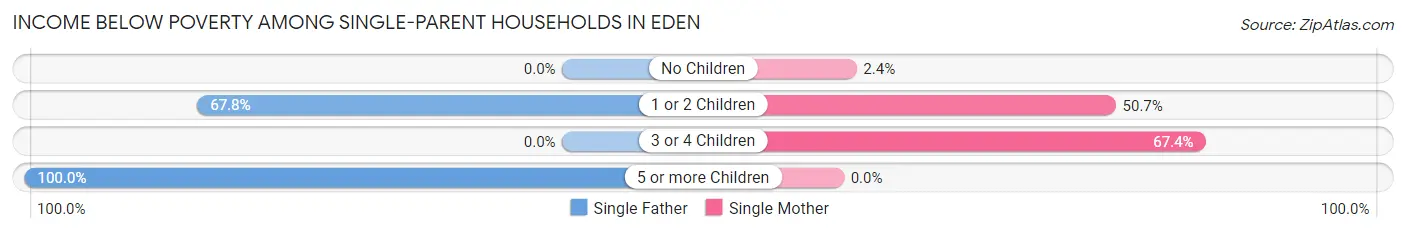
| Children | Single Father | Single Mother |
| No Children | 0 (0.0%) | 9 (2.4%) |
| 1 or 2 Children | 59 (67.8%) | 196 (50.6%) |
| 3 or 4 Children | 0 (0.0%) | 128 (67.4%) |
| 5 or more Children | 14 (100.0%) | 0 (0.0%) |
| Total | 73 (31.1%) | 333 (34.8%) |
Income Below Poverty Among Married-Couple vs Single-Parent Households in Eden
The poverty data for Eden shows that 283 of the married-couple family households (11.0%) and 406 of the single-parent households (34.1%) are living below the poverty level. Within the married-couple family households, those with 3 or 4 children have the highest poverty rate, with 60 households (30.3%) falling below the poverty line. Among the single-parent households, those with 5 or more children have the highest poverty rate, with 14 household (100.0%) living below poverty.
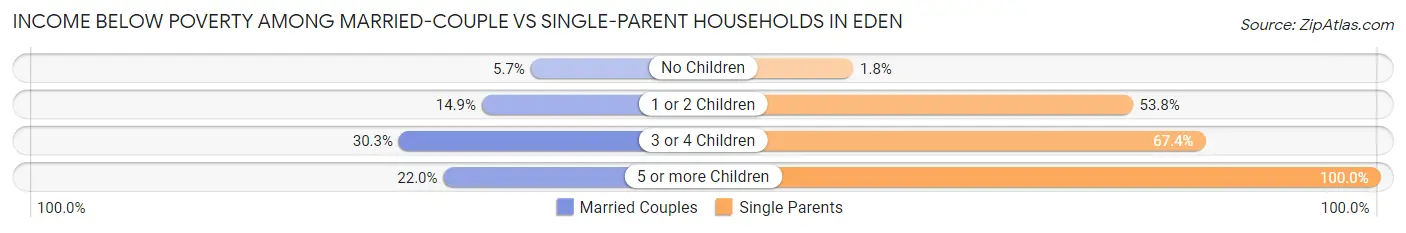
| Children | Married-Couple Families | Single-Parent Households |
| No Children | 84 (5.7%) | 9 (1.8%) |
| 1 or 2 Children | 128 (14.8%) | 255 (53.8%) |
| 3 or 4 Children | 60 (30.3%) | 128 (67.4%) |
| 5 or more Children | 11 (22.0%) | 14 (100.0%) |
| Total | 283 (11.0%) | 406 (34.1%) |
Race in Eden
The most populous races in Eden are White / Caucasian (9,259 | 60.3%), Black / African American (4,520 | 29.4%), and Hispanic or Latino (932 | 6.1%).
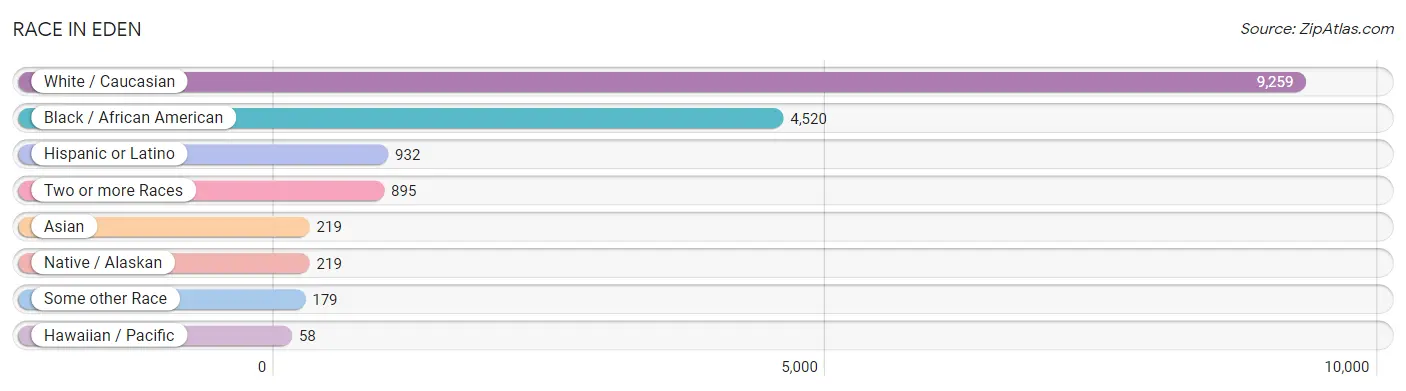
| Race | # Population | % Population |
| Asian | 219 | 1.4% |
| Black / African American | 4,520 | 29.4% |
| Hawaiian / Pacific | 58 | 0.4% |
| Hispanic or Latino | 932 | 6.1% |
| Native / Alaskan | 219 | 1.4% |
| White / Caucasian | 9,259 | 60.3% |
| Two or more Races | 895 | 5.8% |
| Some other Race | 179 | 1.2% |
| Total | 15,349 | 100.0% |
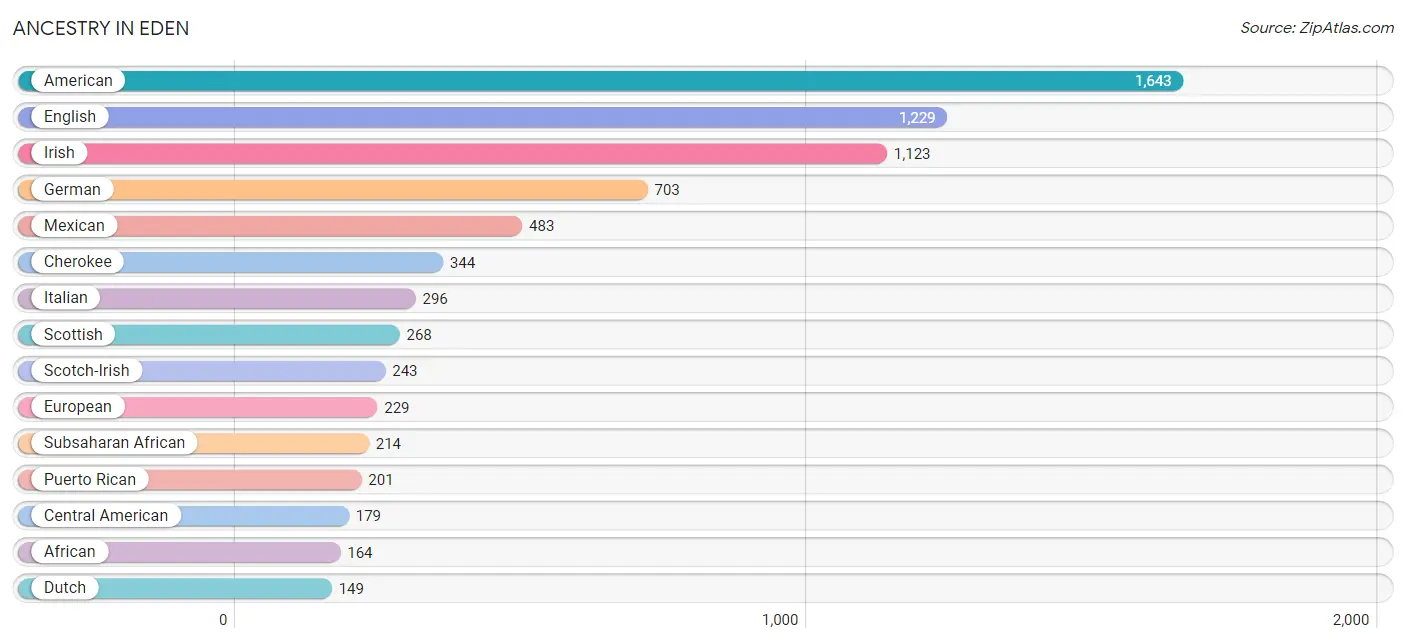
Ancestry in Eden
The most populous ancestries reported in Eden are American (1,643 | 10.7%), English (1,229 | 8.0%), Irish (1,123 | 7.3%), German (703 | 4.6%), and Mexican (483 | 3.2%), together accounting for 33.8% of all Eden residents.
| Ancestry | # Population | % Population |
| African | 164 | 1.1% |
| Albanian | 6 | 0.0% |
| American | 1,643 | 10.7% |
| Arab | 6 | 0.0% |
| Armenian | 7 | 0.1% |
| British | 30 | 0.2% |
| Canadian | 11 | 0.1% |
| Central American | 179 | 1.2% |
| Cherokee | 344 | 2.2% |
| Colombian | 14 | 0.1% |
| Dominican | 35 | 0.2% |
| Dutch | 149 | 1.0% |
| English | 1,229 | 8.0% |
| European | 229 | 1.5% |
| French | 81 | 0.5% |
| French Canadian | 46 | 0.3% |
| German | 703 | 4.6% |
| Greek | 19 | 0.1% |
| Guatemalan | 12 | 0.1% |
| Honduran | 44 | 0.3% |
| Hungarian | 29 | 0.2% |
| Indian (Asian) | 75 | 0.5% |
| Iranian | 18 | 0.1% |
| Irish | 1,123 | 7.3% |
| Italian | 296 | 1.9% |
| Korean | 144 | 0.9% |
| Lebanese | 6 | 0.0% |
| Lumbee | 22 | 0.1% |
| Mexican | 483 | 3.2% |
| Native Hawaiian | 100 | 0.6% |
| Navajo | 19 | 0.1% |
| Nigerian | 49 | 0.3% |
| Norwegian | 33 | 0.2% |
| Polish | 106 | 0.7% |
| Portuguese | 44 | 0.3% |
| Puerto Rican | 201 | 1.3% |
| Salvadoran | 123 | 0.8% |
| Scotch-Irish | 243 | 1.6% |
| Scottish | 268 | 1.8% |
| South American | 34 | 0.2% |
| Subsaharan African | 214 | 1.4% |
| Swedish | 33 | 0.2% |
| Uruguayan | 20 | 0.1% |
| Welsh | 129 | 0.8% | View All 44 Rows |
Immigrants in Eden
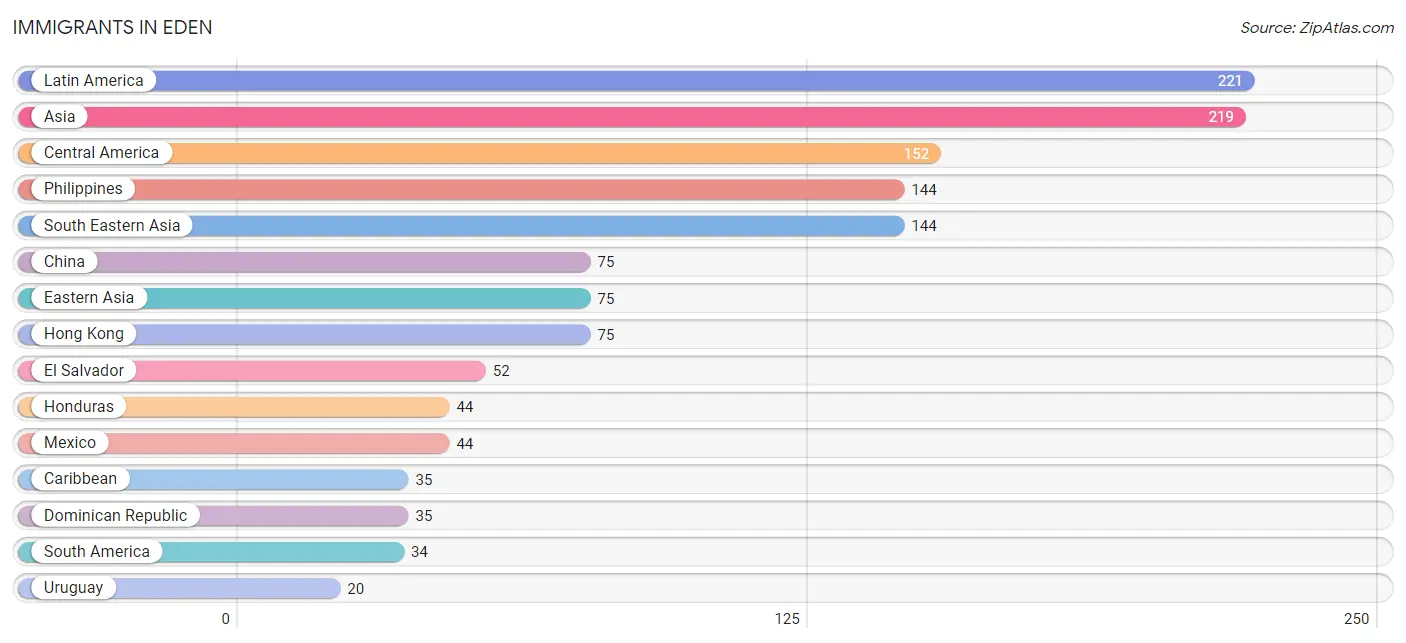
The most numerous immigrant groups reported in Eden came from Latin America (221 | 1.4%), Asia (219 | 1.4%), Central America (152 | 1.0%), Philippines (144 | 0.9%), and South Eastern Asia (144 | 0.9%), together accounting for 5.7% of all Eden residents.
| Immigration Origin | # Population | % Population |
| Africa | 18 | 0.1% |
| Asia | 219 | 1.4% |
| Canada | 12 | 0.1% |
| Caribbean | 35 | 0.2% |
| Central America | 152 | 1.0% |
| China | 75 | 0.5% |
| Colombia | 14 | 0.1% |
| Dominican Republic | 35 | 0.2% |
| Eastern Africa | 1 | 0.0% |
| Eastern Asia | 75 | 0.5% |
| El Salvador | 52 | 0.3% |
| Europe | 15 | 0.1% |
| Germany | 9 | 0.1% |
| Guatemala | 12 | 0.1% |
| Honduras | 44 | 0.3% |
| Hong Kong | 75 | 0.5% |
| Latin America | 221 | 1.4% |
| Mexico | 44 | 0.3% |
| Nigeria | 17 | 0.1% |
| Philippines | 144 | 0.9% |
| South America | 34 | 0.2% |
| South Eastern Asia | 144 | 0.9% |
| Uruguay | 20 | 0.1% |
| Western Africa | 17 | 0.1% |
| Western Europe | 9 | 0.1% | View All 25 Rows |
Sex and Age in Eden
Sex and Age in Eden
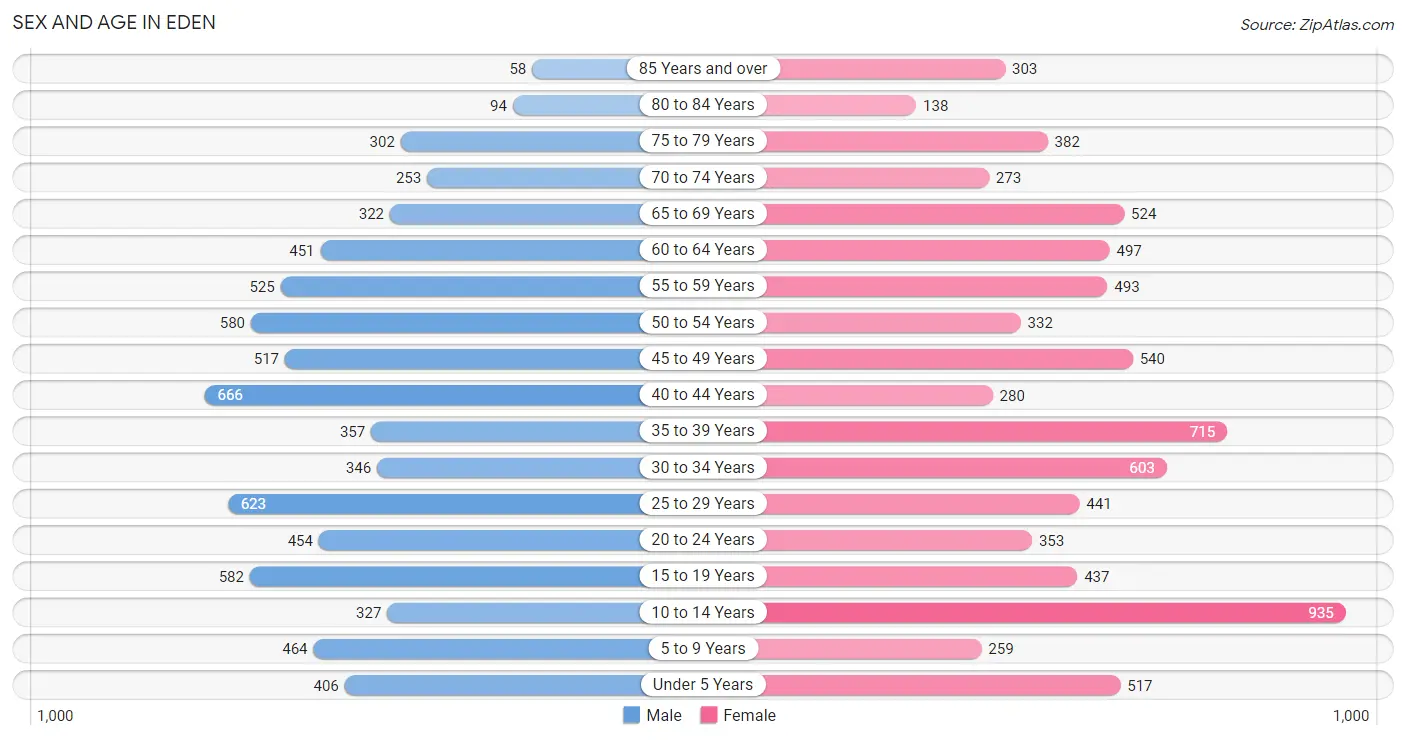
The most populous age groups in Eden are 40 to 44 Years (666 | 9.1%) for men and 10 to 14 Years (935 | 11.7%) for women.
| Age Bracket | Male | Female |
| Under 5 Years | 406 (5.5%) | 517 (6.4%) |
| 5 to 9 Years | 464 (6.3%) | 259 (3.2%) |
| 10 to 14 Years | 327 (4.5%) | 935 (11.7%) |
| 15 to 19 Years | 582 (7.9%) | 437 (5.4%) |
| 20 to 24 Years | 454 (6.2%) | 353 (4.4%) |
| 25 to 29 Years | 623 (8.5%) | 441 (5.5%) |
| 30 to 34 Years | 346 (4.7%) | 603 (7.5%) |
| 35 to 39 Years | 357 (4.9%) | 715 (8.9%) |
| 40 to 44 Years | 666 (9.1%) | 280 (3.5%) |
| 45 to 49 Years | 517 (7.1%) | 540 (6.7%) |
| 50 to 54 Years | 580 (7.9%) | 332 (4.1%) |
| 55 to 59 Years | 525 (7.2%) | 493 (6.1%) |
| 60 to 64 Years | 451 (6.2%) | 497 (6.2%) |
| 65 to 69 Years | 322 (4.4%) | 524 (6.5%) |
| 70 to 74 Years | 253 (3.5%) | 273 (3.4%) |
| 75 to 79 Years | 302 (4.1%) | 382 (4.8%) |
| 80 to 84 Years | 94 (1.3%) | 138 (1.7%) |
| 85 Years and over | 58 (0.8%) | 303 (3.8%) |
| Total | 7,327 (100.0%) | 8,022 (100.0%) |
Families and Households in Eden
Median Family Size in Eden
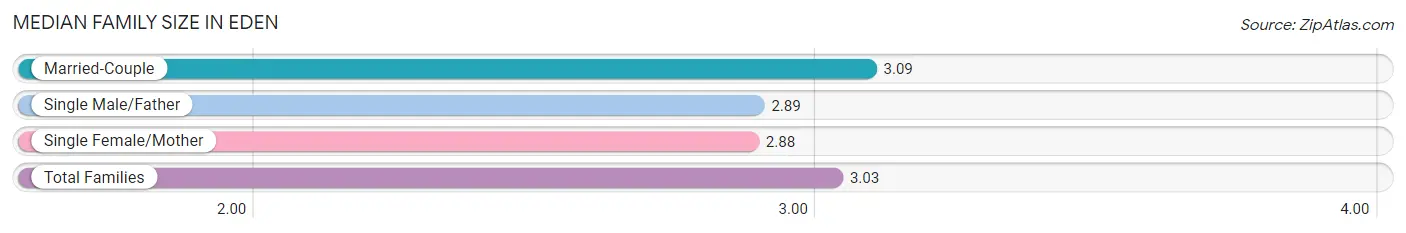
The median family size in Eden is 3.03 persons per family, with married-couple families (2,576 | 68.4%) accounting for the largest median family size of 3.09 persons per family. On the other hand, single female/mother families (956 | 25.4%) represent the smallest median family size with 2.88 persons per family.
| Family Type | # Families | Family Size |
| Married-Couple | 2,576 (68.4%) | 3.09 |
| Single Male/Father | 235 (6.2%) | 2.89 |
| Single Female/Mother | 956 (25.4%) | 2.88 |
| Total Families | 3,767 (100.0%) | 3.03 |
Median Household Size in Eden
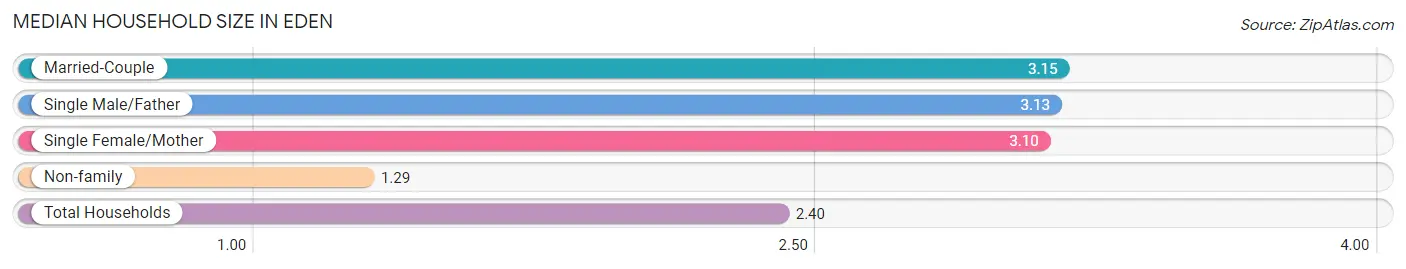
The median household size in Eden is 2.40 persons per household, with married-couple households (2,576 | 41.1%) accounting for the largest median household size of 3.15 persons per household. non-family households (2,499 | 39.9%) represent the smallest median household size with 1.29 persons per household.
| Household Type | # Households | Household Size |
| Married-Couple | 2,576 (41.1%) | 3.15 |
| Single Male/Father | 235 (3.7%) | 3.13 |
| Single Female/Mother | 956 (15.3%) | 3.10 |
| Non-family | 2,499 (39.9%) | 1.29 |
| Total Households | 6,266 (100.0%) | 2.40 |
Household Size by Marriage Status in Eden
Out of a total of 6,266 households in Eden, 3,767 (60.1%) are family households, while 2,499 (39.9%) are nonfamily households. The most numerous type of family households are 2-person households, comprising 1,545, and the most common type of nonfamily households are 1-person households, comprising 2,273.
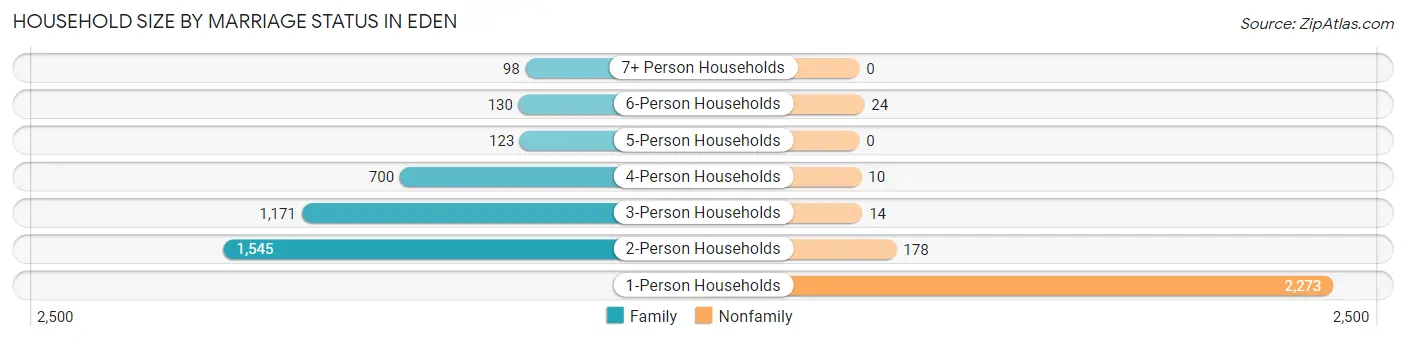
| Household Size | Family Households | Nonfamily Households |
| 1-Person Households | - | 2,273 (36.3%) |
| 2-Person Households | 1,545 (24.7%) | 178 (2.8%) |
| 3-Person Households | 1,171 (18.7%) | 14 (0.2%) |
| 4-Person Households | 700 (11.2%) | 10 (0.2%) |
| 5-Person Households | 123 (2.0%) | 0 (0.0%) |
| 6-Person Households | 130 (2.1%) | 24 (0.4%) |
| 7+ Person Households | 98 (1.6%) | 0 (0.0%) |
| Total | 3,767 (60.1%) | 2,499 (39.9%) |
Female Fertility in Eden
Fertility by Age in Eden
Average fertility rate in Eden is 42.0 births per 1,000 women. Women in the age bracket of 20 to 34 years have the highest fertility rate with 95.0 births per 1,000 women. Women in the age bracket of 20 to 34 years acount for 92.4% of all women with births.
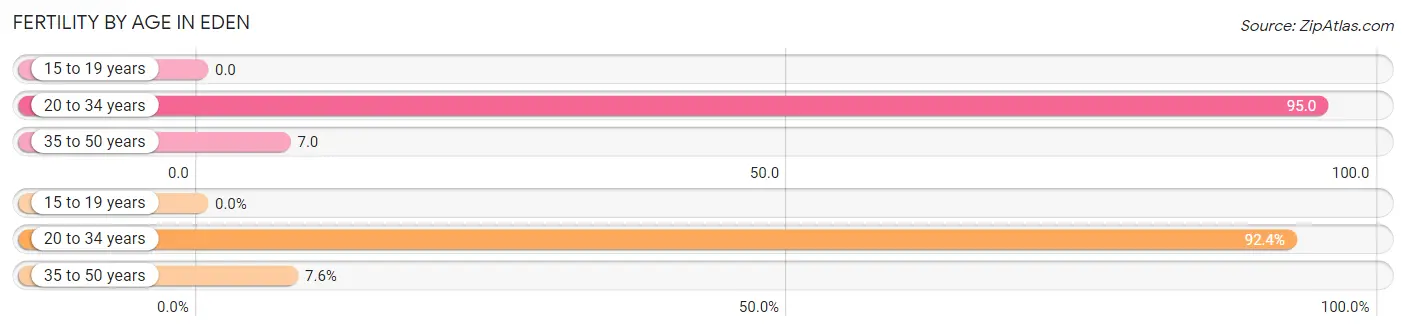
| Age Bracket | Women with Births | Births / 1,000 Women |
| 15 to 19 years | 0 (0.0%) | 0.0 |
| 20 to 34 years | 133 (92.4%) | 95.0 |
| 35 to 50 years | 11 (7.6%) | 7.0 |
| Total | 144 (100.0%) | 42.0 |
Fertility by Age by Marriage Status in Eden
41.7% of women with births (144) in Eden are married. The highest percentage of unmarried women with births falls into 20 to 34 years age bracket with 63.2% of them unmarried at the time of birth, while the lowest percentage of unmarried women with births belong to 35 to 50 years age bracket with 0.0% of them unmarried.
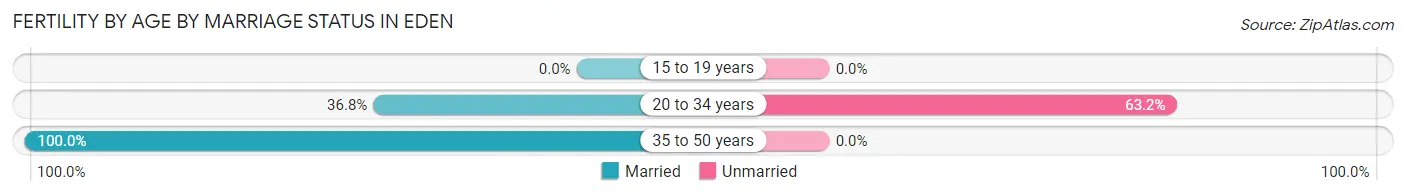
| Age Bracket | Married | Unmarried |
| 15 to 19 years | 0 (0.0%) | 0 (0.0%) |
| 20 to 34 years | 49 (36.8%) | 84 (63.2%) |
| 35 to 50 years | 11 (100.0%) | 0 (0.0%) |
| Total | 60 (41.7%) | 84 (58.3%) |
Fertility by Education in Eden
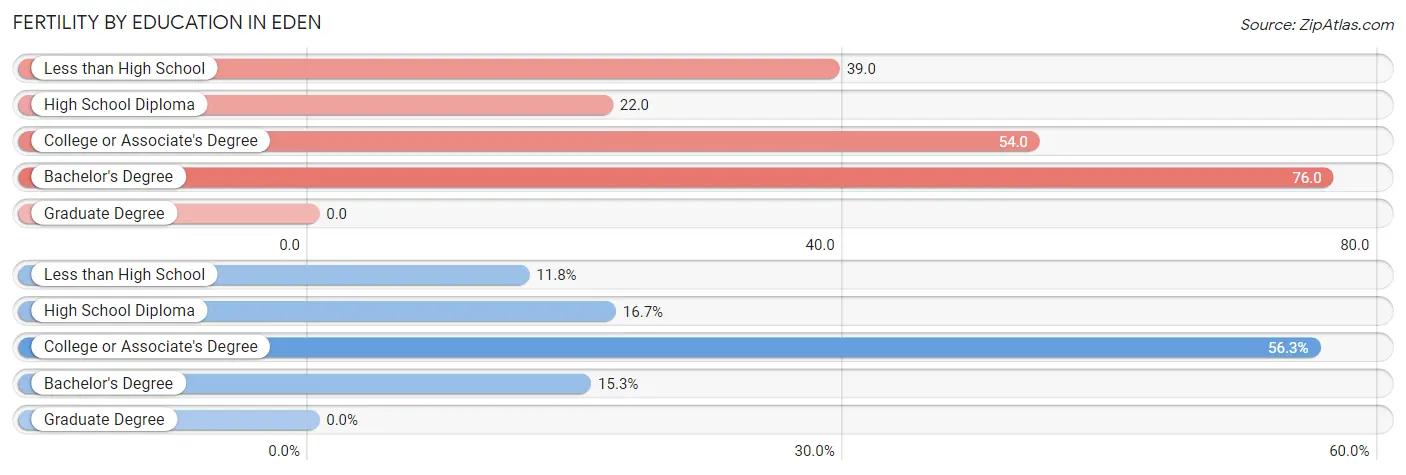
| Educational Attainment | Women with Births | Births / 1,000 Women |
| Less than High School | 17 (11.8%) | 39.0 |
| High School Diploma | 24 (16.7%) | 22.0 |
| College or Associate's Degree | 81 (56.2%) | 54.0 |
| Bachelor's Degree | 22 (15.3%) | 76.0 |
| Graduate Degree | 0 (0.0%) | 0.0 |
| Total | 144 (100.0%) | 42.0 |
Fertility by Education by Marriage Status in Eden
58.3% of women with births in Eden are unmarried. Women with the educational attainment of less than high school are most likely to be married with 100.0% of them married at childbirth, while women with the educational attainment of bachelor's degree are least likely to be married with 100.0% of them unmarried at childbirth.
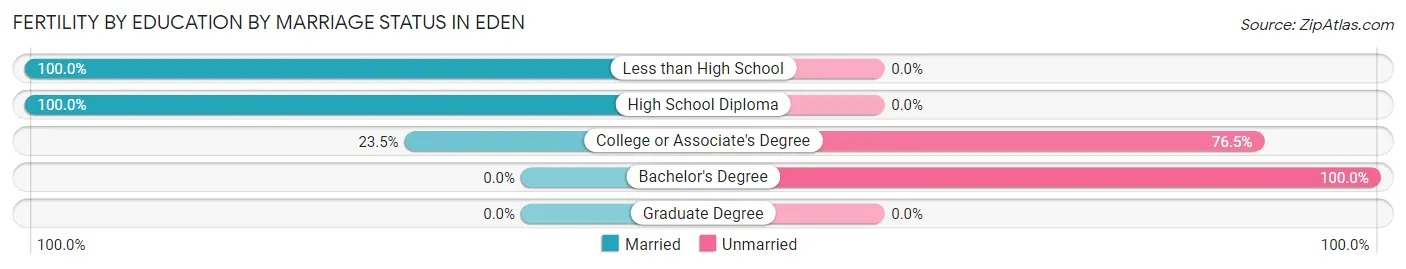
| Educational Attainment | Married | Unmarried |
| Less than High School | 17 (100.0%) | 0 (0.0%) |
| High School Diploma | 24 (100.0%) | 0 (0.0%) |
| College or Associate's Degree | 19 (23.5%) | 62 (76.5%) |
| Bachelor's Degree | 0 (0.0%) | 22 (100.0%) |
| Graduate Degree | 0 (0.0%) | 0 (0.0%) |
| Total | 60 (41.7%) | 84 (58.3%) |
Employment Characteristics in Eden
Employment by Class of Employer in Eden
Among the 6,429 employed individuals in Eden, private company employees (5,071 | 78.9%), self-employed (not incorporated) (440 | 6.8%), and local government employees (264 | 4.1%) make up the most common classes of employment.
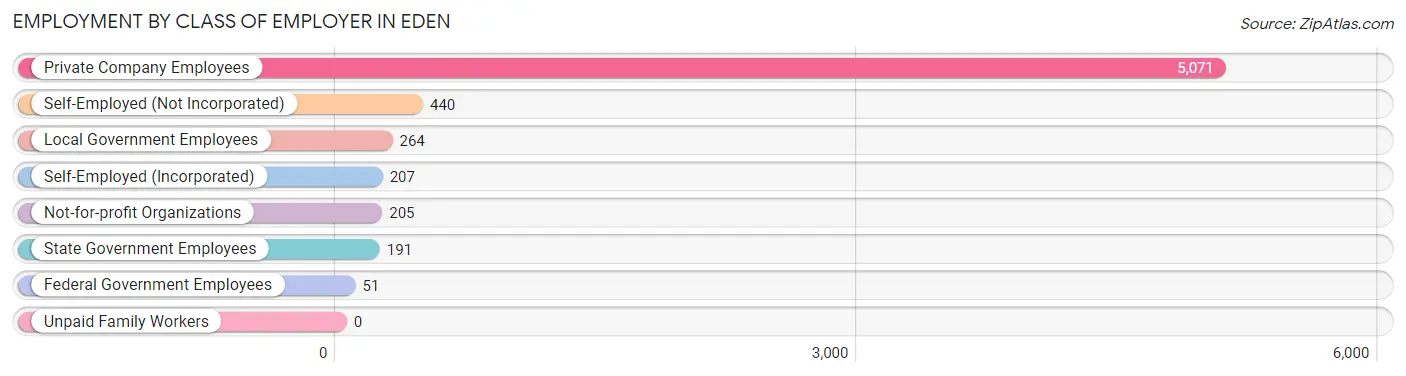
| Employer Class | # Employees | % Employees |
| Private Company Employees | 5,071 | 78.9% |
| Self-Employed (Incorporated) | 207 | 3.2% |
| Self-Employed (Not Incorporated) | 440 | 6.8% |
| Not-for-profit Organizations | 205 | 3.2% |
| Local Government Employees | 264 | 4.1% |
| State Government Employees | 191 | 3.0% |
| Federal Government Employees | 51 | 0.8% |
| Unpaid Family Workers | 0 | 0.0% |
| Total | 6,429 | 100.0% |
Employment Status by Age in Eden
According to the labor force statistics for Eden, out of the total population over 16 years of age (12,358), 56.2% or 6,945 individuals are in the labor force, with 6.0% or 417 of them unemployed. The age group with the highest labor force participation rate is 20 to 24 years, with 91.1% or 735 individuals in the labor force. Within the labor force, the 25 to 29 years age range has the highest percentage of unemployed individuals, with 20.8% or 142 of them being unemployed.
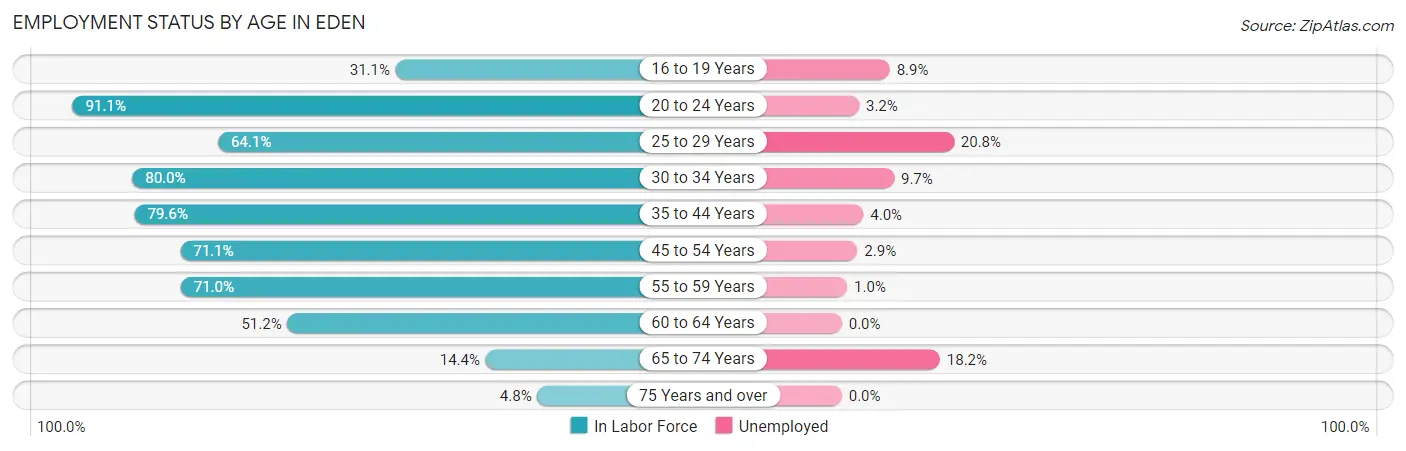
| Age Bracket | In Labor Force | Unemployed |
| 16 to 19 Years | 291 (31.1%) | 26 (8.9%) |
| 20 to 24 Years | 735 (91.1%) | 24 (3.2%) |
| 25 to 29 Years | 682 (64.1%) | 142 (20.8%) |
| 30 to 34 Years | 759 (80.0%) | 74 (9.7%) |
| 35 to 44 Years | 1,606 (79.6%) | 64 (4.0%) |
| 45 to 54 Years | 1,400 (71.1%) | 41 (2.9%) |
| 55 to 59 Years | 723 (71.0%) | 7 (1.0%) |
| 60 to 64 Years | 485 (51.2%) | 0 (0.0%) |
| 65 to 74 Years | 198 (14.4%) | 36 (18.2%) |
| 75 Years and over | 61 (4.8%) | 0 (0.0%) |
| Total | 6,945 (56.2%) | 417 (6.0%) |
Employment Status by Educational Attainment in Eden
According to labor force statistics for Eden, 71.0% of individuals (5,656) out of the total population between 25 and 64 years of age (7,966) are in the labor force, with 5.8% or 328 of them being unemployed. The group with the highest labor force participation rate are those with the educational attainment of bachelor's degree or higher, with 84.8% or 1,005 individuals in the labor force. Within the labor force, individuals with college / associate degree education have the highest percentage of unemployment, with 6.7% or 138 of them being unemployed.
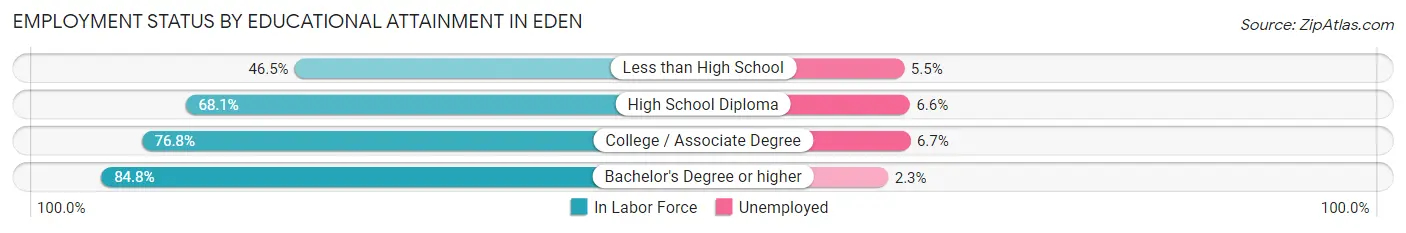
| Educational Attainment | In Labor Force | Unemployed |
| Less than High School | 437 (46.5%) | 52 (5.5%) |
| High School Diploma | 2,150 (68.1%) | 208 (6.6%) |
| College / Associate Degree | 2,061 (76.8%) | 180 (6.7%) |
| Bachelor's Degree or higher | 1,005 (84.8%) | 27 (2.3%) |
| Total | 5,656 (71.0%) | 462 (5.8%) |
Employment Occupations by Sex in Eden
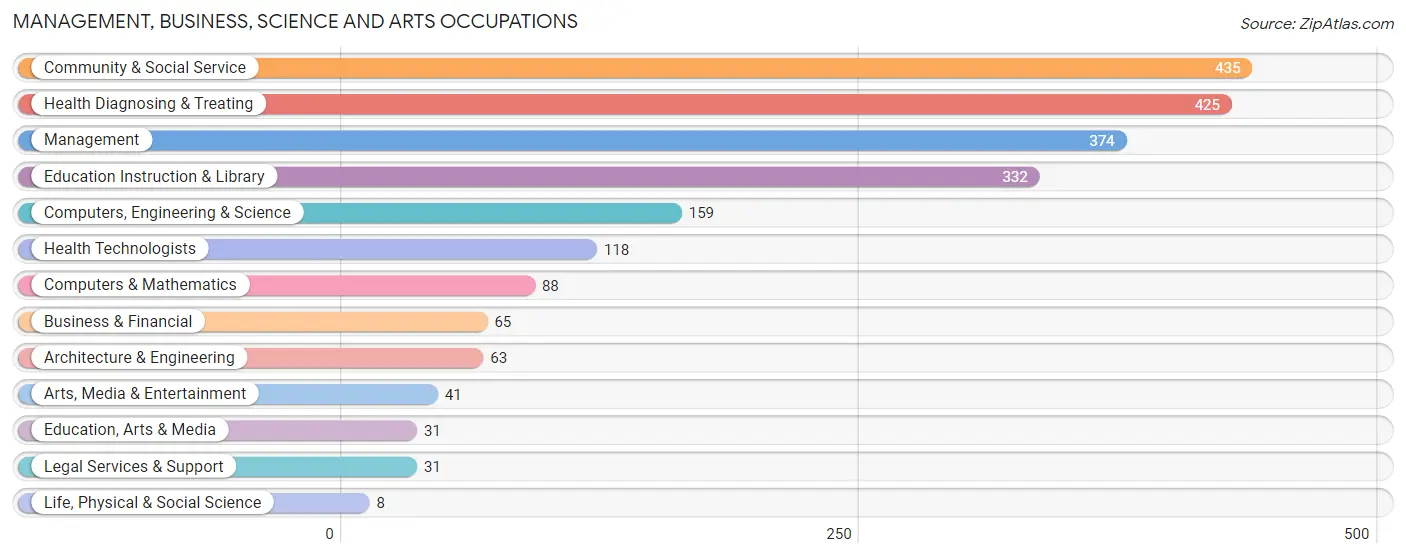
Management, Business, Science and Arts Occupations
The most common Management, Business, Science and Arts occupations in Eden are Community & Social Service (435 | 6.7%), Health Diagnosing & Treating (425 | 6.5%), Management (374 | 5.7%), Education Instruction & Library (332 | 5.1%), and Computers, Engineering & Science (159 | 2.4%).
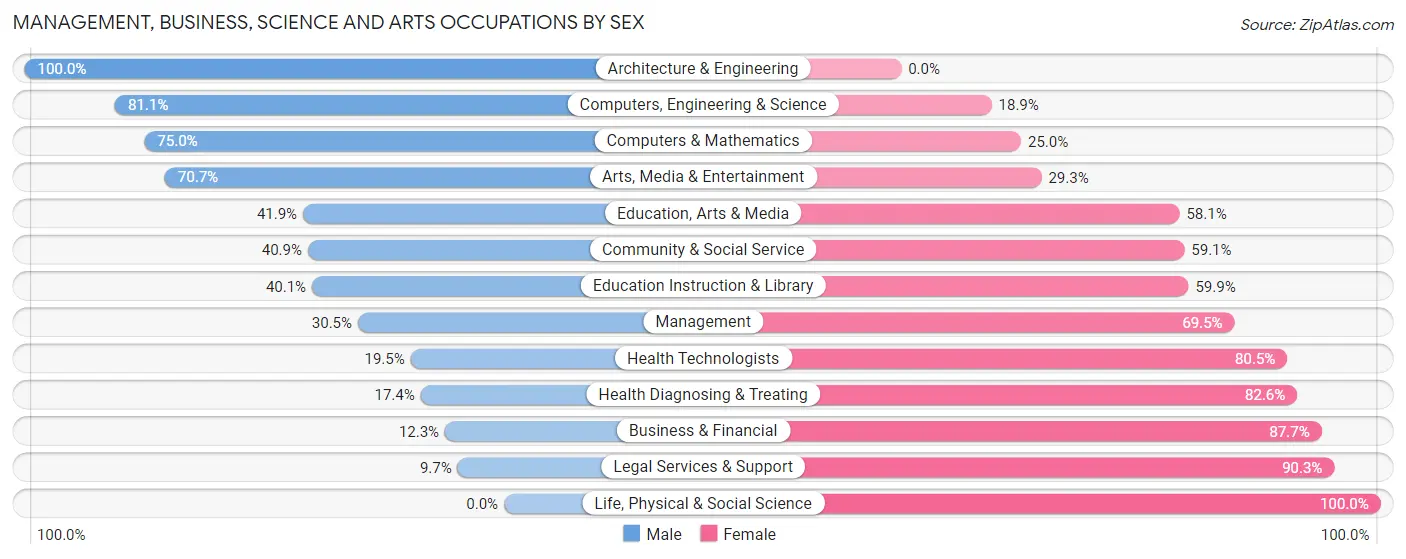
Management, Business, Science and Arts Occupations by Sex
Within the Management, Business, Science and Arts occupations in Eden, the most male-oriented occupations are Architecture & Engineering (100.0%), Computers, Engineering & Science (81.1%), and Computers & Mathematics (75.0%), while the most female-oriented occupations are Life, Physical & Social Science (100.0%), Legal Services & Support (90.3%), and Business & Financial (87.7%).
| Occupation | Male | Female |
| Management | 114 (30.5%) | 260 (69.5%) |
| Business & Financial | 8 (12.3%) | 57 (87.7%) |
| Computers, Engineering & Science | 129 (81.1%) | 30 (18.9%) |
| Computers & Mathematics | 66 (75.0%) | 22 (25.0%) |
| Architecture & Engineering | 63 (100.0%) | 0 (0.0%) |
| Life, Physical & Social Science | 0 (0.0%) | 8 (100.0%) |
| Community & Social Service | 178 (40.9%) | 257 (59.1%) |
| Education, Arts & Media | 13 (41.9%) | 18 (58.1%) |
| Legal Services & Support | 3 (9.7%) | 28 (90.3%) |
| Education Instruction & Library | 133 (40.1%) | 199 (59.9%) |
| Arts, Media & Entertainment | 29 (70.7%) | 12 (29.3%) |
| Health Diagnosing & Treating | 74 (17.4%) | 351 (82.6%) |
| Health Technologists | 23 (19.5%) | 95 (80.5%) |
| Total (Category) | 503 (34.5%) | 955 (65.5%) |
| Total (Overall) | 3,548 (54.5%) | 2,963 (45.5%) |
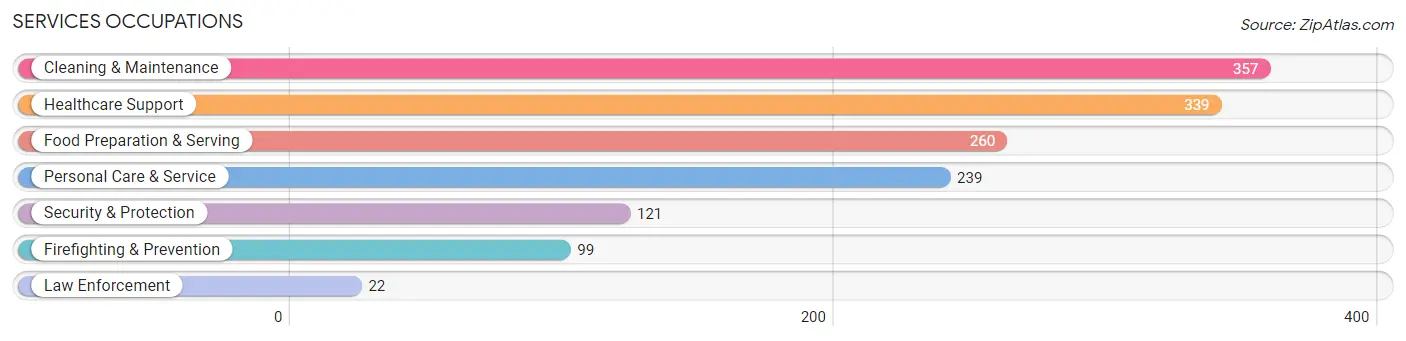
Services Occupations
The most common Services occupations in Eden are Cleaning & Maintenance (357 | 5.5%), Healthcare Support (339 | 5.2%), Food Preparation & Serving (260 | 4.0%), Personal Care & Service (239 | 3.7%), and Security & Protection (121 | 1.9%).
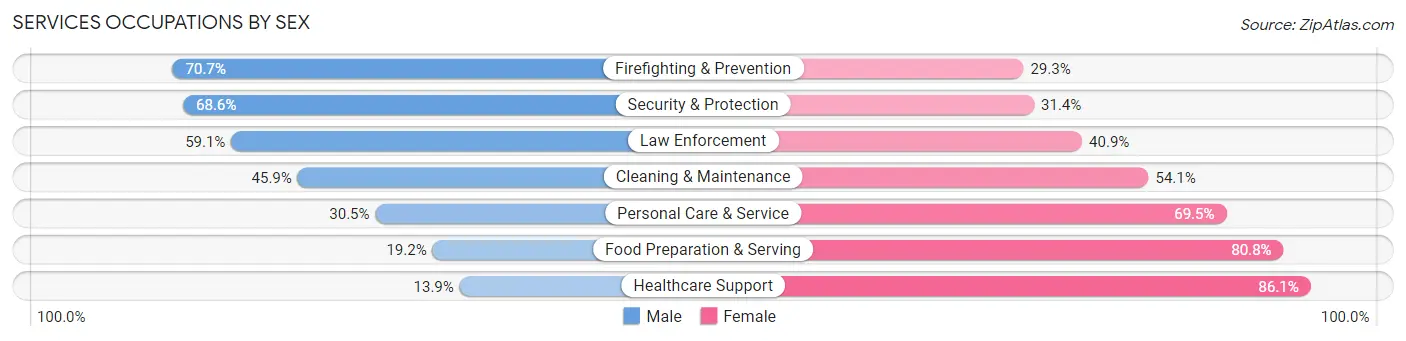
Services Occupations by Sex
Within the Services occupations in Eden, the most male-oriented occupations are Firefighting & Prevention (70.7%), Security & Protection (68.6%), and Law Enforcement (59.1%), while the most female-oriented occupations are Healthcare Support (86.1%), Food Preparation & Serving (80.8%), and Personal Care & Service (69.5%).
| Occupation | Male | Female |
| Healthcare Support | 47 (13.9%) | 292 (86.1%) |
| Security & Protection | 83 (68.6%) | 38 (31.4%) |
| Firefighting & Prevention | 70 (70.7%) | 29 (29.3%) |
| Law Enforcement | 13 (59.1%) | 9 (40.9%) |
| Food Preparation & Serving | 50 (19.2%) | 210 (80.8%) |
| Cleaning & Maintenance | 164 (45.9%) | 193 (54.1%) |
| Personal Care & Service | 73 (30.5%) | 166 (69.5%) |
| Total (Category) | 417 (31.7%) | 899 (68.3%) |
| Total (Overall) | 3,548 (54.5%) | 2,963 (45.5%) |
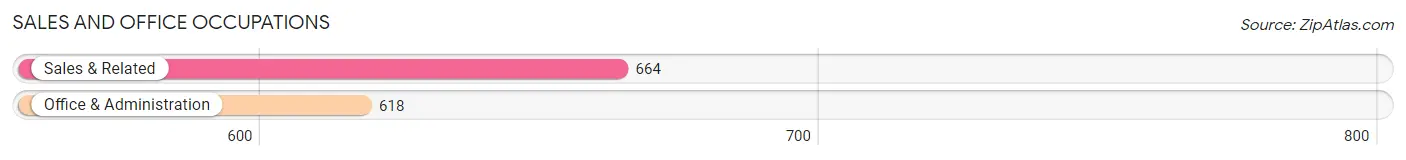
Sales and Office Occupations
The most common Sales and Office occupations in Eden are Sales & Related (664 | 10.2%), and Office & Administration (618 | 9.5%).
Sales and Office Occupations by Sex
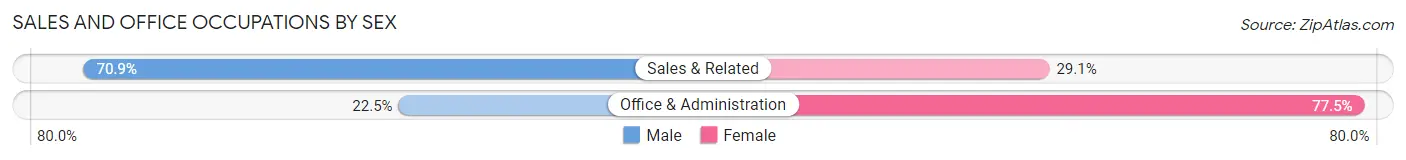
| Occupation | Male | Female |
| Sales & Related | 471 (70.9%) | 193 (29.1%) |
| Office & Administration | 139 (22.5%) | 479 (77.5%) |
| Total (Category) | 610 (47.6%) | 672 (52.4%) |
| Total (Overall) | 3,548 (54.5%) | 2,963 (45.5%) |
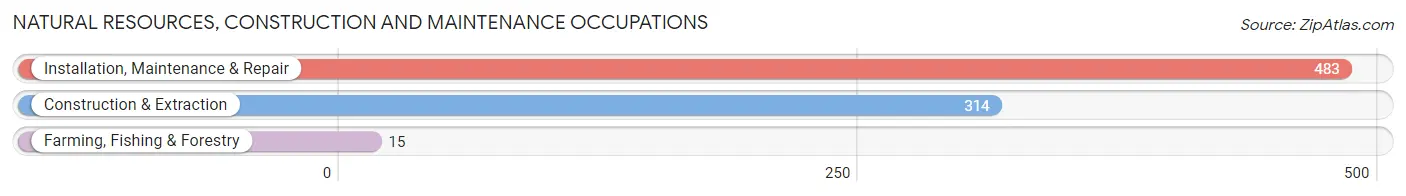
Natural Resources, Construction and Maintenance Occupations
The most common Natural Resources, Construction and Maintenance occupations in Eden are Installation, Maintenance & Repair (483 | 7.4%), Construction & Extraction (314 | 4.8%), and Farming, Fishing & Forestry (15 | 0.2%).
Natural Resources, Construction and Maintenance Occupations by Sex
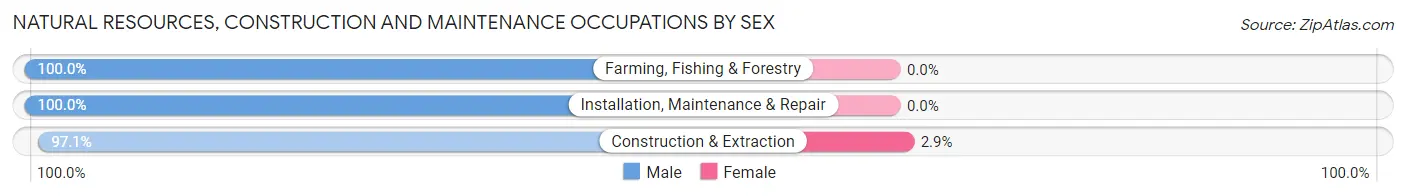
| Occupation | Male | Female |
| Farming, Fishing & Forestry | 15 (100.0%) | 0 (0.0%) |
| Construction & Extraction | 305 (97.1%) | 9 (2.9%) |
| Installation, Maintenance & Repair | 483 (100.0%) | 0 (0.0%) |
| Total (Category) | 803 (98.9%) | 9 (1.1%) |
| Total (Overall) | 3,548 (54.5%) | 2,963 (45.5%) |
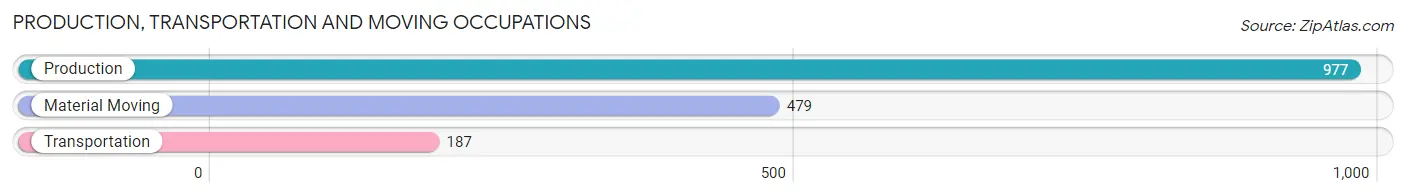
Production, Transportation and Moving Occupations
The most common Production, Transportation and Moving occupations in Eden are Production (977 | 15.0%), Material Moving (479 | 7.4%), and Transportation (187 | 2.9%).
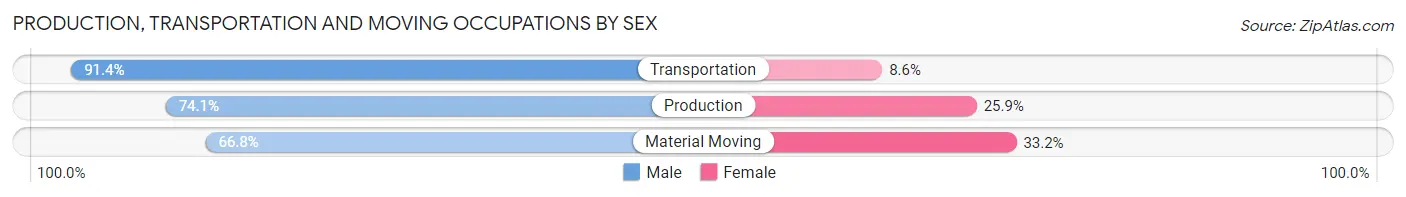
Production, Transportation and Moving Occupations by Sex
| Occupation | Male | Female |
| Production | 724 (74.1%) | 253 (25.9%) |
| Transportation | 171 (91.4%) | 16 (8.6%) |
| Material Moving | 320 (66.8%) | 159 (33.2%) |
| Total (Category) | 1,215 (74.0%) | 428 (26.1%) |
| Total (Overall) | 3,548 (54.5%) | 2,963 (45.5%) |
Employment Industries by Sex in Eden
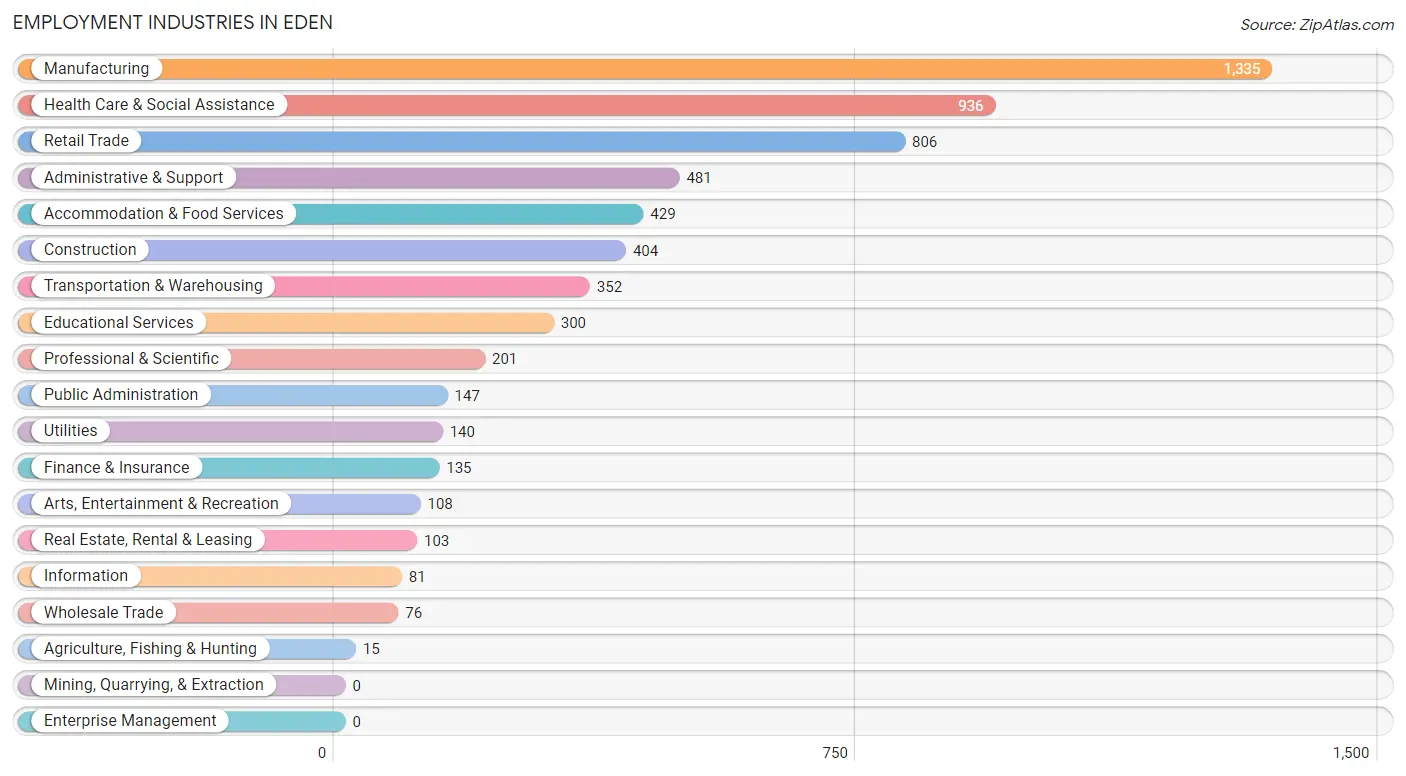
Employment Industries in Eden
The major employment industries in Eden include Manufacturing (1,335 | 20.5%), Health Care & Social Assistance (936 | 14.4%), Retail Trade (806 | 12.4%), Administrative & Support (481 | 7.4%), and Accommodation & Food Services (429 | 6.6%).
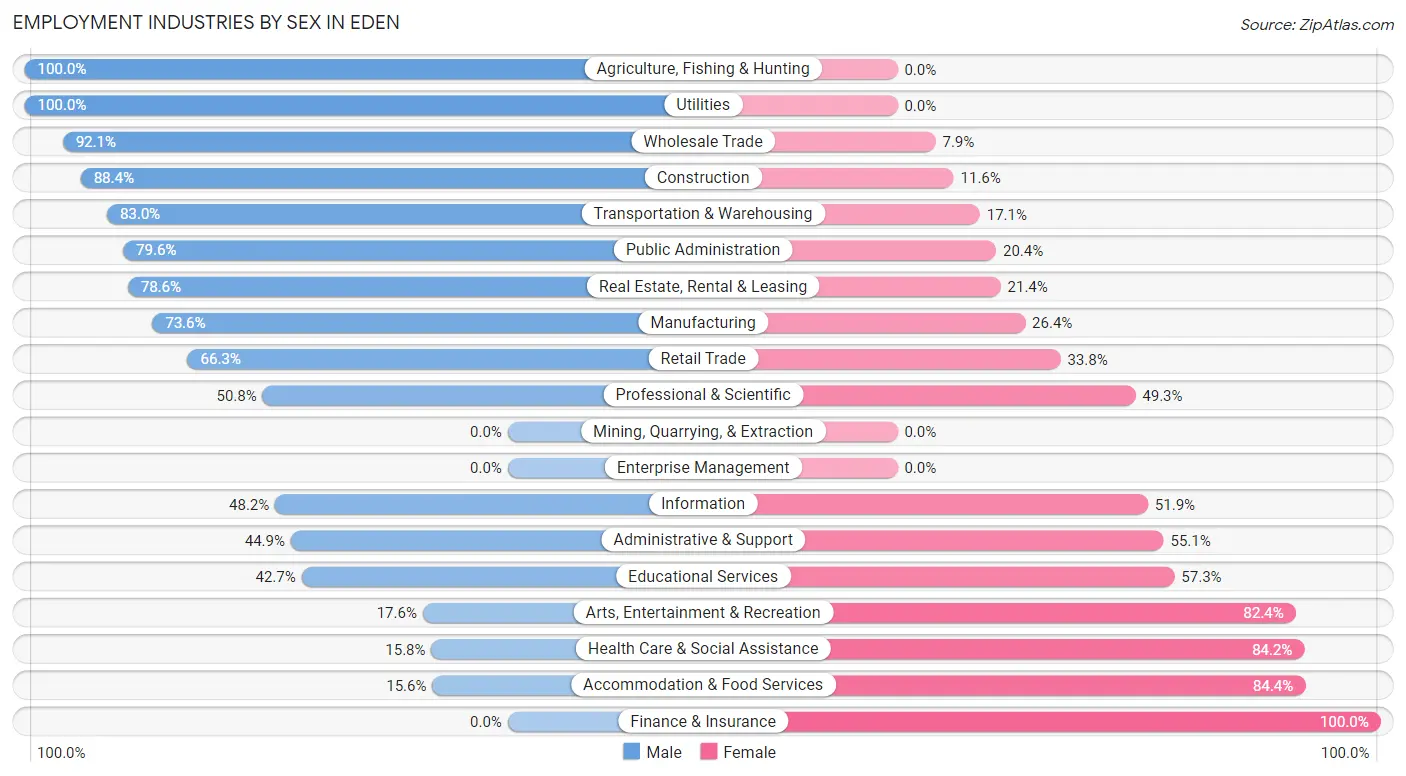
Employment Industries by Sex in Eden
The Eden industries that see more men than women are Agriculture, Fishing & Hunting (100.0%), Utilities (100.0%), and Wholesale Trade (92.1%), whereas the industries that tend to have a higher number of women are Finance & Insurance (100.0%), Accommodation & Food Services (84.4%), and Health Care & Social Assistance (84.2%).
| Industry | Male | Female |
| Agriculture, Fishing & Hunting | 15 (100.0%) | 0 (0.0%) |
| Mining, Quarrying, & Extraction | 0 (0.0%) | 0 (0.0%) |
| Construction | 357 (88.4%) | 47 (11.6%) |
| Manufacturing | 982 (73.6%) | 353 (26.4%) |
| Wholesale Trade | 70 (92.1%) | 6 (7.9%) |
| Retail Trade | 534 (66.2%) | 272 (33.8%) |
| Transportation & Warehousing | 292 (83.0%) | 60 (17.1%) |
| Utilities | 140 (100.0%) | 0 (0.0%) |
| Information | 39 (48.1%) | 42 (51.8%) |
| Finance & Insurance | 0 (0.0%) | 135 (100.0%) |
| Real Estate, Rental & Leasing | 81 (78.6%) | 22 (21.4%) |
| Professional & Scientific | 102 (50.7%) | 99 (49.2%) |
| Enterprise Management | 0 (0.0%) | 0 (0.0%) |
| Administrative & Support | 216 (44.9%) | 265 (55.1%) |
| Educational Services | 128 (42.7%) | 172 (57.3%) |
| Health Care & Social Assistance | 148 (15.8%) | 788 (84.2%) |
| Arts, Entertainment & Recreation | 19 (17.6%) | 89 (82.4%) |
| Accommodation & Food Services | 67 (15.6%) | 362 (84.4%) |
| Public Administration | 117 (79.6%) | 30 (20.4%) |
| Total | 3,548 (54.5%) | 2,963 (45.5%) |
Education in Eden
School Enrollment in Eden
The most common levels of schooling among the 3,631 students in Eden are middle school (1,043 | 28.7%), high school (790 | 21.8%), and college / undergraduate (671 | 18.5%).
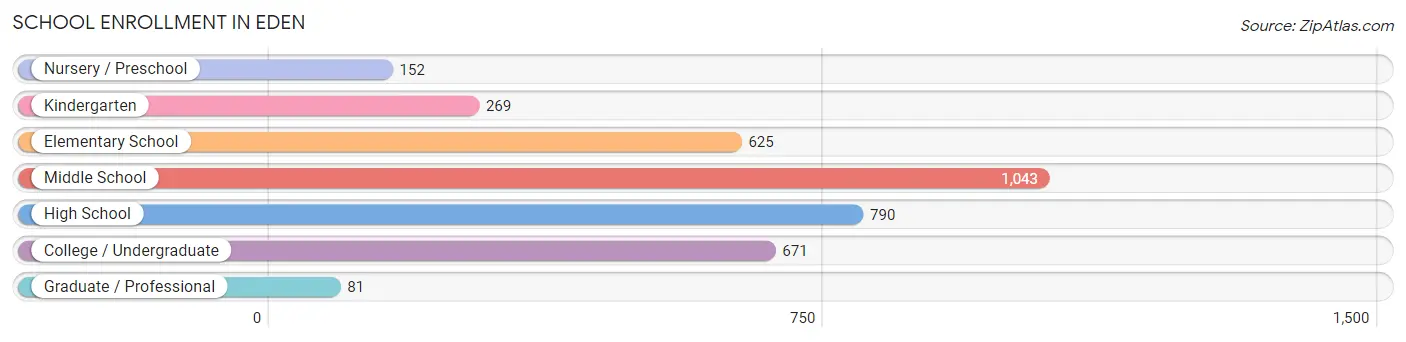
| School Level | # Students | % Students |
| Nursery / Preschool | 152 | 4.2% |
| Kindergarten | 269 | 7.4% |
| Elementary School | 625 | 17.2% |
| Middle School | 1,043 | 28.7% |
| High School | 790 | 21.8% |
| College / Undergraduate | 671 | 18.5% |
| Graduate / Professional | 81 | 2.2% |
| Total | 3,631 | 100.0% |
School Enrollment by Age by Funding Source in Eden
Out of a total of 3,631 students who are enrolled in schools in Eden, 294 (8.1%) attend a private institution, while the remaining 3,337 (91.9%) are enrolled in public schools. The age group of 20 to 24 year olds has the highest likelihood of being enrolled in private schools, with 78 (43.1% in the age bracket) enrolled. Conversely, the age group of 3 to 4 year olds has the lowest likelihood of being enrolled in a private school, with 165 (100.0% in the age bracket) attending a public institution.
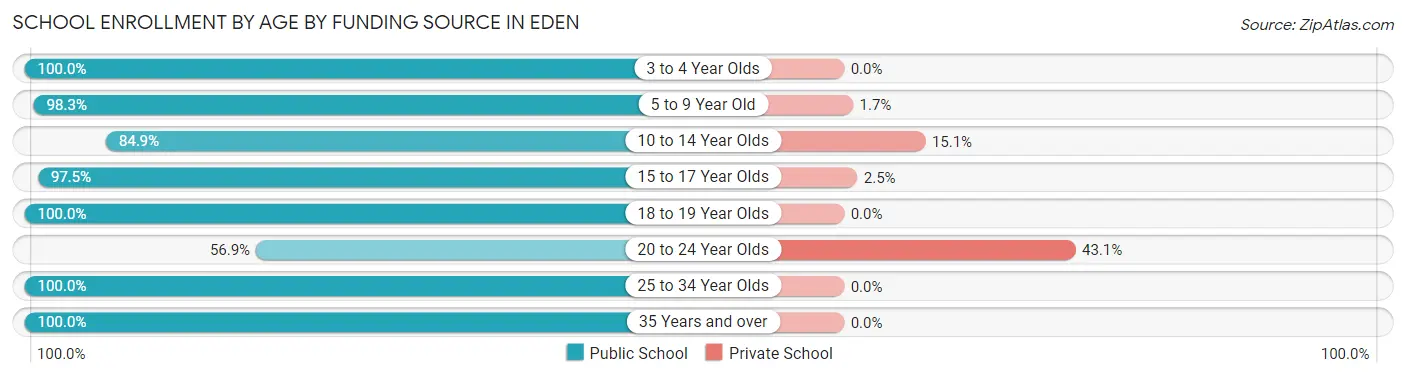
| Age Bracket | Public School | Private School |
| 3 to 4 Year Olds | 165 (100.0%) | 0 (0.0%) |
| 5 to 9 Year Old | 711 (98.3%) | 12 (1.7%) |
| 10 to 14 Year Olds | 1,065 (84.9%) | 190 (15.1%) |
| 15 to 17 Year Olds | 554 (97.5%) | 14 (2.5%) |
| 18 to 19 Year Olds | 429 (100.0%) | 0 (0.0%) |
| 20 to 24 Year Olds | 103 (56.9%) | 78 (43.1%) |
| 25 to 34 Year Olds | 148 (100.0%) | 0 (0.0%) |
| 35 Years and over | 162 (100.0%) | 0 (0.0%) |
| Total | 3,337 (91.9%) | 294 (8.1%) |
Educational Attainment by Field of Study in Eden
Business (431 | 26.6%), education (262 | 16.2%), liberal arts & history (178 | 11.0%), engineering (119 | 7.3%), and arts & humanities (108 | 6.7%) are the most common fields of study among 1,622 individuals in Eden who have obtained a bachelor's degree or higher.
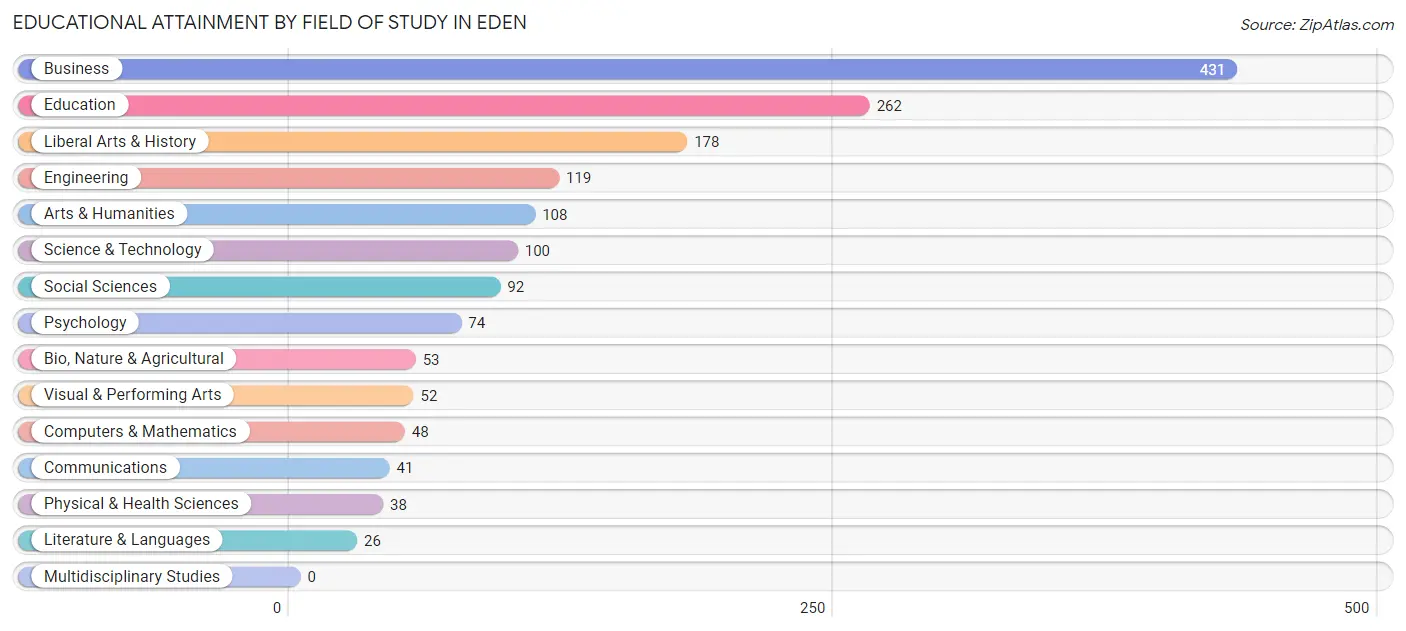
| Field of Study | # Graduates | % Graduates |
| Computers & Mathematics | 48 | 3.0% |
| Bio, Nature & Agricultural | 53 | 3.3% |
| Physical & Health Sciences | 38 | 2.3% |
| Psychology | 74 | 4.6% |
| Social Sciences | 92 | 5.7% |
| Engineering | 119 | 7.3% |
| Multidisciplinary Studies | 0 | 0.0% |
| Science & Technology | 100 | 6.2% |
| Business | 431 | 26.6% |
| Education | 262 | 16.2% |
| Literature & Languages | 26 | 1.6% |
| Liberal Arts & History | 178 | 11.0% |
| Visual & Performing Arts | 52 | 3.2% |
| Communications | 41 | 2.5% |
| Arts & Humanities | 108 | 6.7% |
| Total | 1,622 | 100.0% |
Transportation & Commute in Eden
Vehicle Availability by Sex in Eden
The most prevalent vehicle ownership categories in Eden are males with 2 vehicles (1,516, accounting for 43.0%) and females with 2 vehicles (1,361, making up 52.2%).
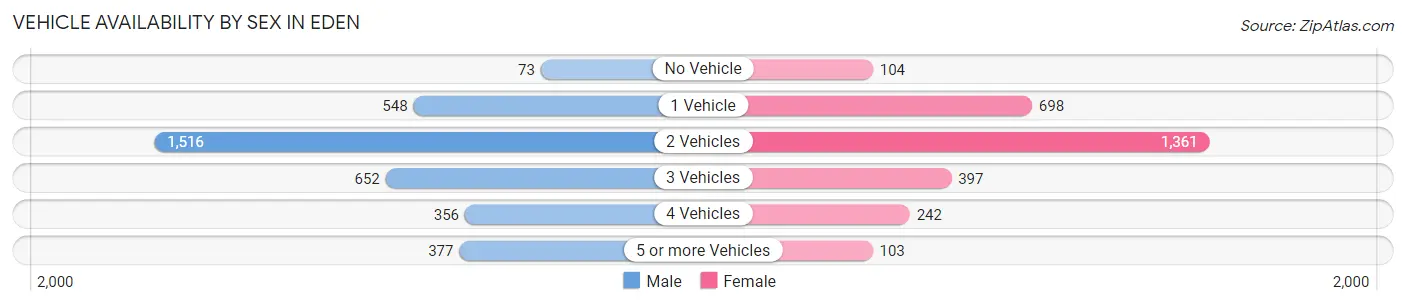
| Vehicles Available | Male | Female |
| No Vehicle | 73 (2.1%) | 104 (3.6%) |
| 1 Vehicle | 548 (15.6%) | 698 (24.0%) |
| 2 Vehicles | 1,516 (43.0%) | 1,361 (46.9%) |
| 3 Vehicles | 652 (18.5%) | 397 (13.7%) |
| 4 Vehicles | 356 (10.1%) | 242 (8.3%) |
| 5 or more Vehicles | 377 (10.7%) | 103 (3.5%) |
| Total | 3,522 (100.0%) | 2,905 (100.0%) |
Commute Time in Eden
The most frequently occuring commute durations in Eden are 5 to 9 minutes (1,016 commuters, 16.5%), 10 to 14 minutes (898 commuters, 14.5%), and 20 to 24 minutes (888 commuters, 14.4%).
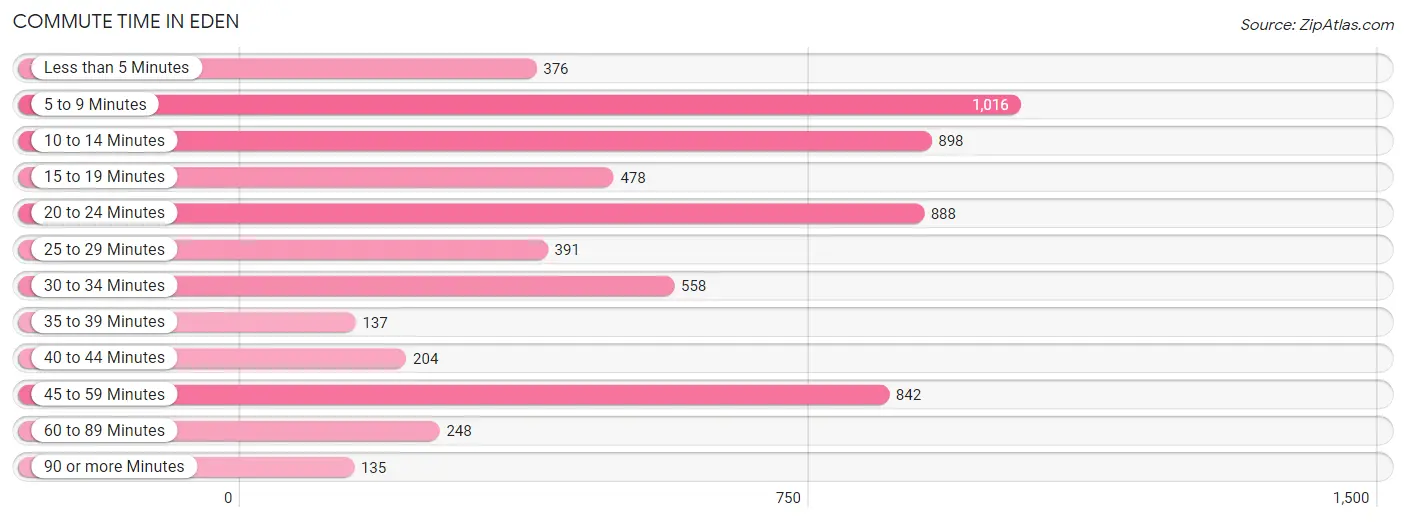
| Commute Time | # Commuters | % Commuters |
| Less than 5 Minutes | 376 | 6.1% |
| 5 to 9 Minutes | 1,016 | 16.5% |
| 10 to 14 Minutes | 898 | 14.5% |
| 15 to 19 Minutes | 478 | 7.7% |
| 20 to 24 Minutes | 888 | 14.4% |
| 25 to 29 Minutes | 391 | 6.3% |
| 30 to 34 Minutes | 558 | 9.0% |
| 35 to 39 Minutes | 137 | 2.2% |
| 40 to 44 Minutes | 204 | 3.3% |
| 45 to 59 Minutes | 842 | 13.6% |
| 60 to 89 Minutes | 248 | 4.0% |
| 90 or more Minutes | 135 | 2.2% |
Commute Time by Sex in Eden
The most common commute times in Eden are 5 to 9 minutes (541 commuters, 15.9%) for males and 10 to 14 minutes (663 commuters, 23.9%) for females.
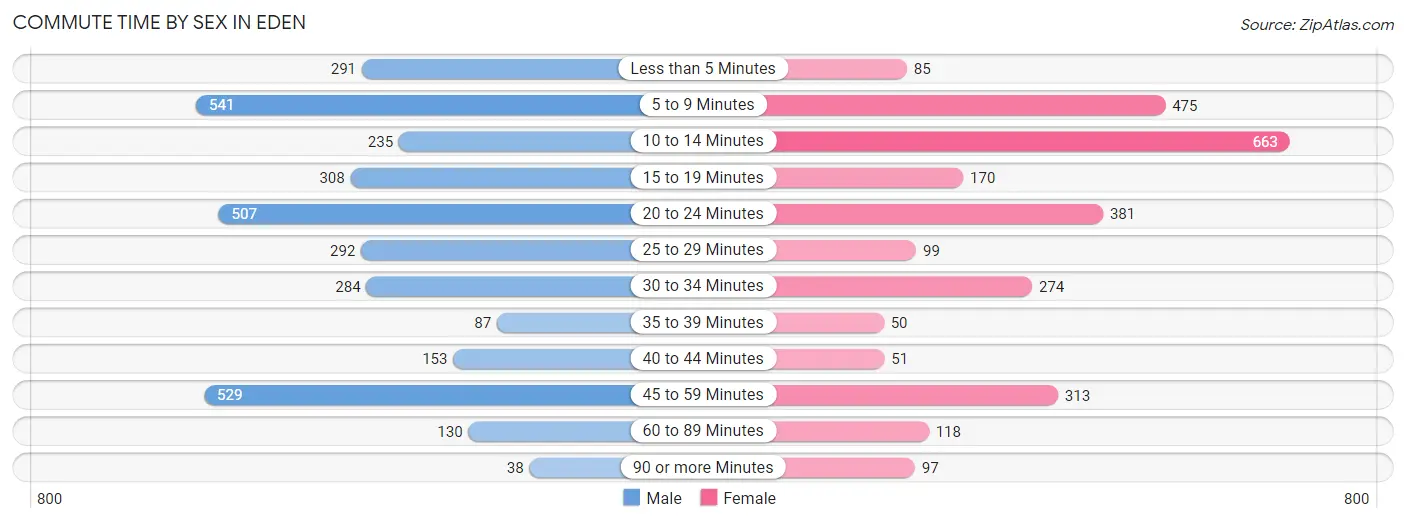
| Commute Time | Male | Female |
| Less than 5 Minutes | 291 (8.6%) | 85 (3.1%) |
| 5 to 9 Minutes | 541 (15.9%) | 475 (17.1%) |
| 10 to 14 Minutes | 235 (6.9%) | 663 (23.9%) |
| 15 to 19 Minutes | 308 (9.1%) | 170 (6.1%) |
| 20 to 24 Minutes | 507 (14.9%) | 381 (13.7%) |
| 25 to 29 Minutes | 292 (8.6%) | 99 (3.6%) |
| 30 to 34 Minutes | 284 (8.4%) | 274 (9.9%) |
| 35 to 39 Minutes | 87 (2.6%) | 50 (1.8%) |
| 40 to 44 Minutes | 153 (4.5%) | 51 (1.8%) |
| 45 to 59 Minutes | 529 (15.6%) | 313 (11.3%) |
| 60 to 89 Minutes | 130 (3.8%) | 118 (4.3%) |
| 90 or more Minutes | 38 (1.1%) | 97 (3.5%) |
Time of Departure to Work by Sex in Eden
The most frequent times of departure to work in Eden are 8:00 AM to 8:29 AM (463, 13.6%) for males and 7:30 AM to 7:59 AM (424, 15.3%) for females.
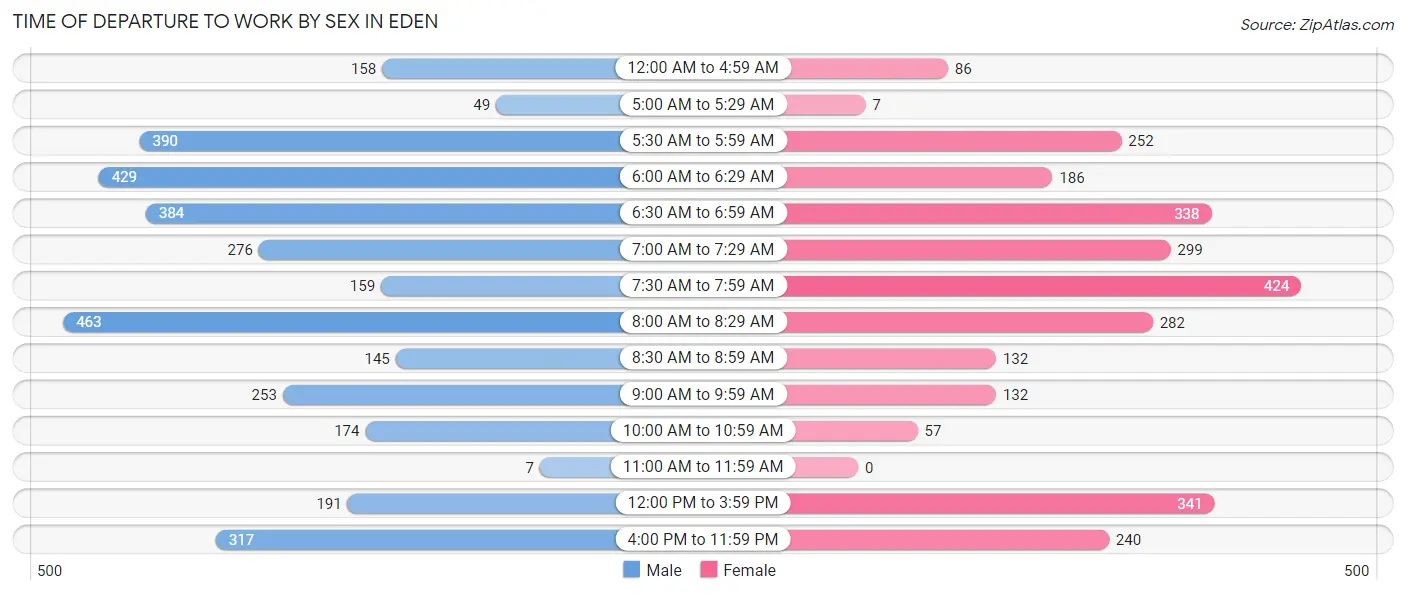
| Time of Departure | Male | Female |
| 12:00 AM to 4:59 AM | 158 (4.6%) | 86 (3.1%) |
| 5:00 AM to 5:29 AM | 49 (1.4%) | 7 (0.3%) |
| 5:30 AM to 5:59 AM | 390 (11.5%) | 252 (9.1%) |
| 6:00 AM to 6:29 AM | 429 (12.6%) | 186 (6.7%) |
| 6:30 AM to 6:59 AM | 384 (11.3%) | 338 (12.2%) |
| 7:00 AM to 7:29 AM | 276 (8.1%) | 299 (10.8%) |
| 7:30 AM to 7:59 AM | 159 (4.7%) | 424 (15.3%) |
| 8:00 AM to 8:29 AM | 463 (13.6%) | 282 (10.2%) |
| 8:30 AM to 8:59 AM | 145 (4.3%) | 132 (4.8%) |
| 9:00 AM to 9:59 AM | 253 (7.4%) | 132 (4.8%) |
| 10:00 AM to 10:59 AM | 174 (5.1%) | 57 (2.1%) |
| 11:00 AM to 11:59 AM | 7 (0.2%) | 0 (0.0%) |
| 12:00 PM to 3:59 PM | 191 (5.6%) | 341 (12.3%) |
| 4:00 PM to 11:59 PM | 317 (9.3%) | 240 (8.6%) |
| Total | 3,395 (100.0%) | 2,776 (100.0%) |
Housing Occupancy in Eden
Occupancy by Ownership in Eden
Of the total 6,266 dwellings in Eden, owner-occupied units account for 3,224 (51.4%), while renter-occupied units make up 3,042 (48.5%).
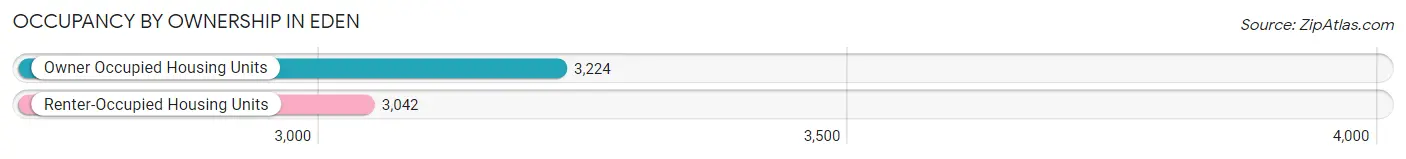
| Occupancy | # Housing Units | % Housing Units |
| Owner Occupied Housing Units | 3,224 | 51.4% |
| Renter-Occupied Housing Units | 3,042 | 48.5% |
| Total Occupied Housing Units | 6,266 | 100.0% |
Occupancy by Household Size in Eden
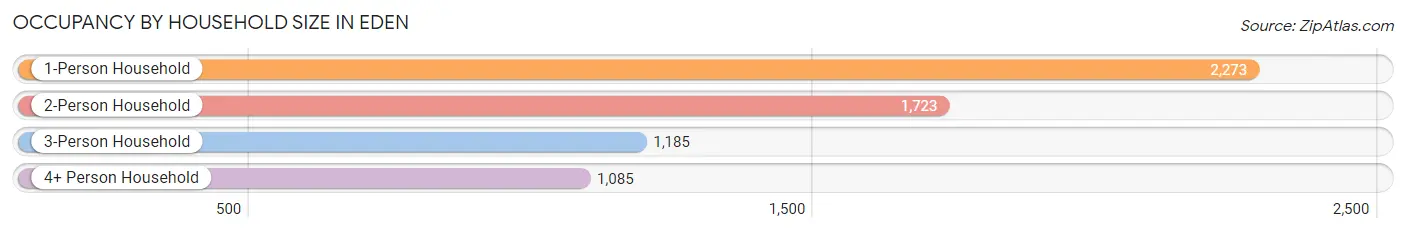
| Household Size | # Housing Units | % Housing Units |
| 1-Person Household | 2,273 | 36.3% |
| 2-Person Household | 1,723 | 27.5% |
| 3-Person Household | 1,185 | 18.9% |
| 4+ Person Household | 1,085 | 17.3% |
| Total Housing Units | 6,266 | 100.0% |
Occupancy by Ownership by Household Size in Eden
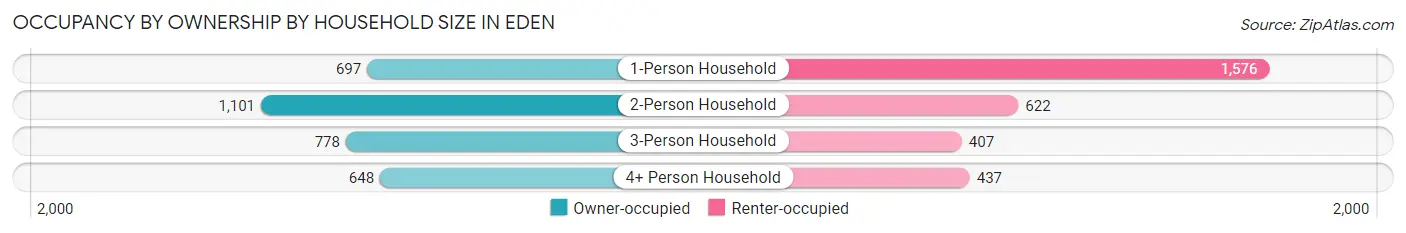
| Household Size | Owner-occupied | Renter-occupied |
| 1-Person Household | 697 (30.7%) | 1,576 (69.3%) |
| 2-Person Household | 1,101 (63.9%) | 622 (36.1%) |
| 3-Person Household | 778 (65.6%) | 407 (34.4%) |
| 4+ Person Household | 648 (59.7%) | 437 (40.3%) |
| Total Housing Units | 3,224 (51.4%) | 3,042 (48.5%) |
Occupancy by Educational Attainment in Eden
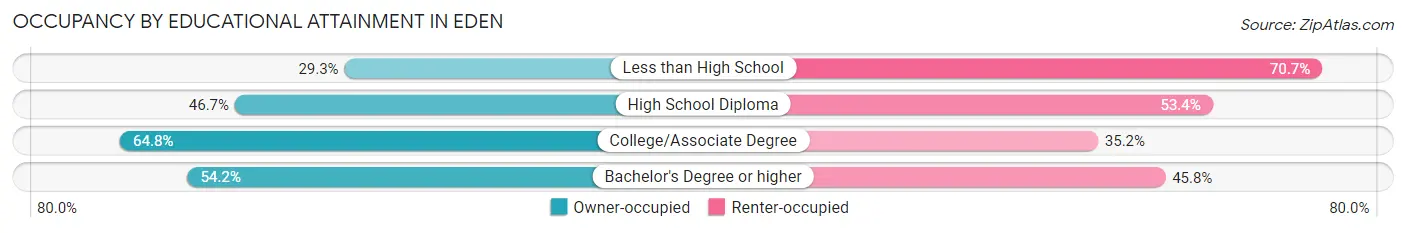
| Household Size | Owner-occupied | Renter-occupied |
| Less than High School | 281 (29.3%) | 679 (70.7%) |
| High School Diploma | 1,032 (46.7%) | 1,180 (53.3%) |
| College/Associate Degree | 1,429 (64.8%) | 775 (35.2%) |
| Bachelor's Degree or higher | 482 (54.2%) | 408 (45.8%) |
Occupancy by Age of Householder in Eden
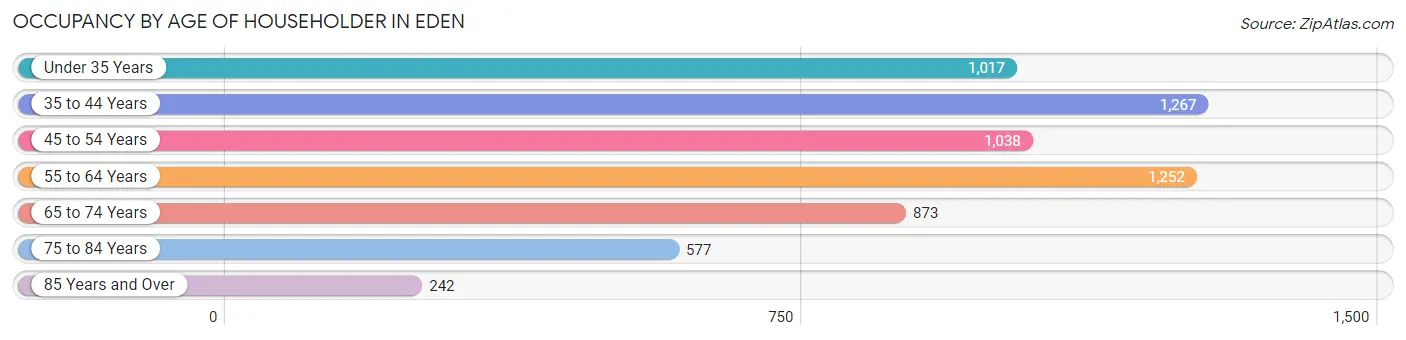
| Age Bracket | # Households | % Households |
| Under 35 Years | 1,017 | 16.2% |
| 35 to 44 Years | 1,267 | 20.2% |
| 45 to 54 Years | 1,038 | 16.6% |
| 55 to 64 Years | 1,252 | 20.0% |
| 65 to 74 Years | 873 | 13.9% |
| 75 to 84 Years | 577 | 9.2% |
| 85 Years and Over | 242 | 3.9% |
| Total | 6,266 | 100.0% |
Housing Finances in Eden
Median Income by Occupancy in Eden
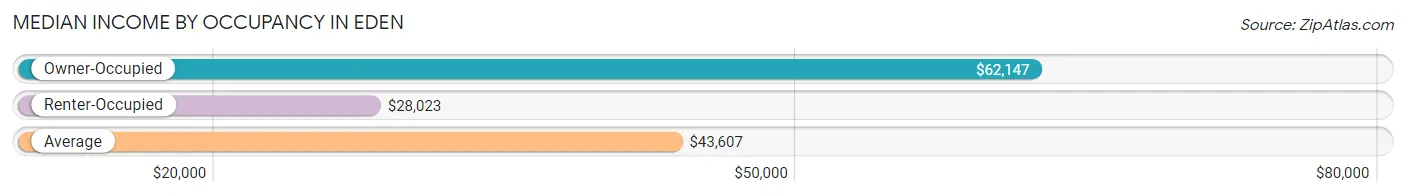
| Occupancy Type | # Households | Median Income |
| Owner-Occupied | 3,224 (51.4%) | $62,147 |
| Renter-Occupied | 3,042 (48.5%) | $28,023 |
| Average | 6,266 (100.0%) | $43,607 |
Occupancy by Householder Income Bracket in Eden
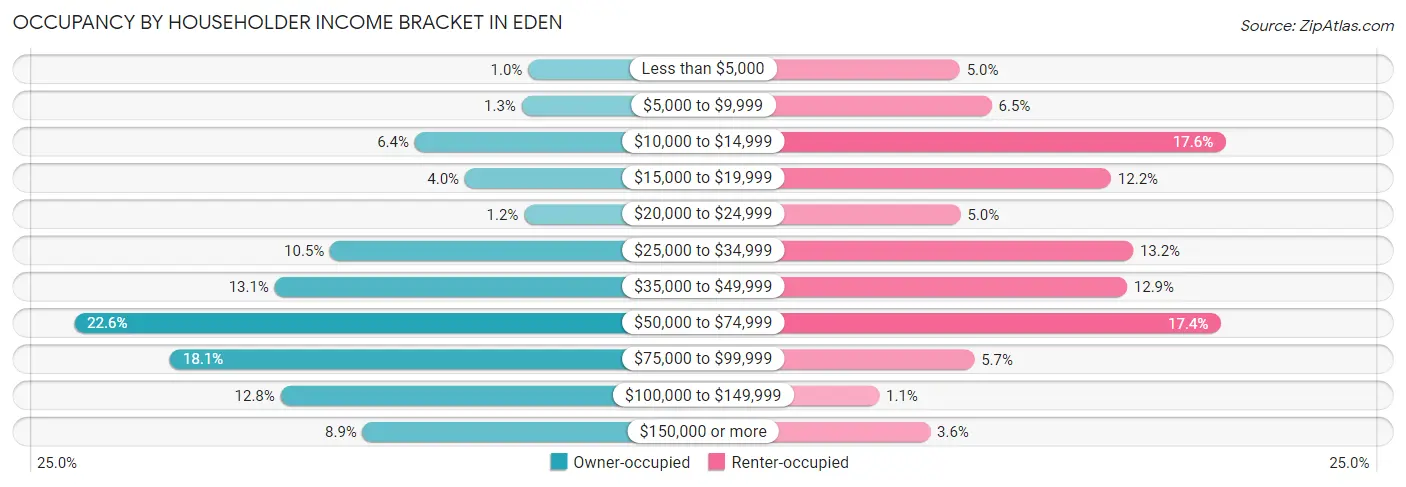
| Income Bracket | Owner-occupied | Renter-occupied |
| Less than $5,000 | 33 (1.0%) | 151 (5.0%) |
| $5,000 to $9,999 | 43 (1.3%) | 197 (6.5%) |
| $10,000 to $14,999 | 207 (6.4%) | 535 (17.6%) |
| $15,000 to $19,999 | 130 (4.0%) | 370 (12.2%) |
| $20,000 to $24,999 | 39 (1.2%) | 152 (5.0%) |
| $25,000 to $34,999 | 337 (10.4%) | 402 (13.2%) |
| $35,000 to $49,999 | 422 (13.1%) | 393 (12.9%) |
| $50,000 to $74,999 | 730 (22.6%) | 528 (17.4%) |
| $75,000 to $99,999 | 583 (18.1%) | 172 (5.7%) |
| $100,000 to $149,999 | 413 (12.8%) | 34 (1.1%) |
| $150,000 or more | 287 (8.9%) | 108 (3.5%) |
| Total | 3,224 (100.0%) | 3,042 (100.0%) |
Monthly Housing Cost Tiers in Eden
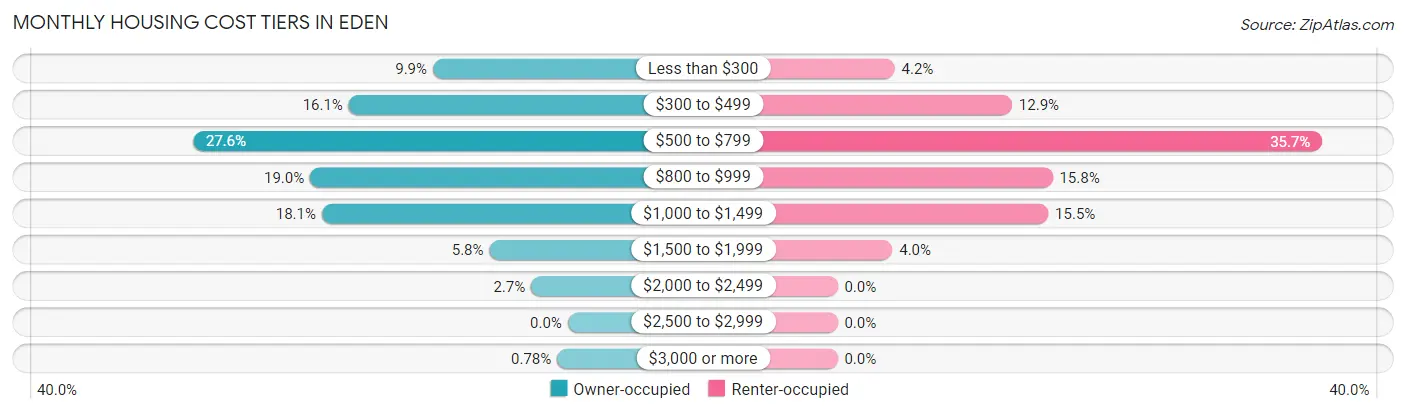
| Monthly Cost | Owner-occupied | Renter-occupied |
| Less than $300 | 320 (9.9%) | 128 (4.2%) |
| $300 to $499 | 520 (16.1%) | 391 (12.9%) |
| $500 to $799 | 890 (27.6%) | 1,086 (35.7%) |
| $800 to $999 | 612 (19.0%) | 482 (15.8%) |
| $1,000 to $1,499 | 584 (18.1%) | 472 (15.5%) |
| $1,500 to $1,999 | 186 (5.8%) | 123 (4.0%) |
| $2,000 to $2,499 | 87 (2.7%) | 0 (0.0%) |
| $2,500 to $2,999 | 0 (0.0%) | 0 (0.0%) |
| $3,000 or more | 25 (0.8%) | 0 (0.0%) |
| Total | 3,224 (100.0%) | 3,042 (100.0%) |
Physical Housing Characteristics in Eden
Housing Structures in Eden
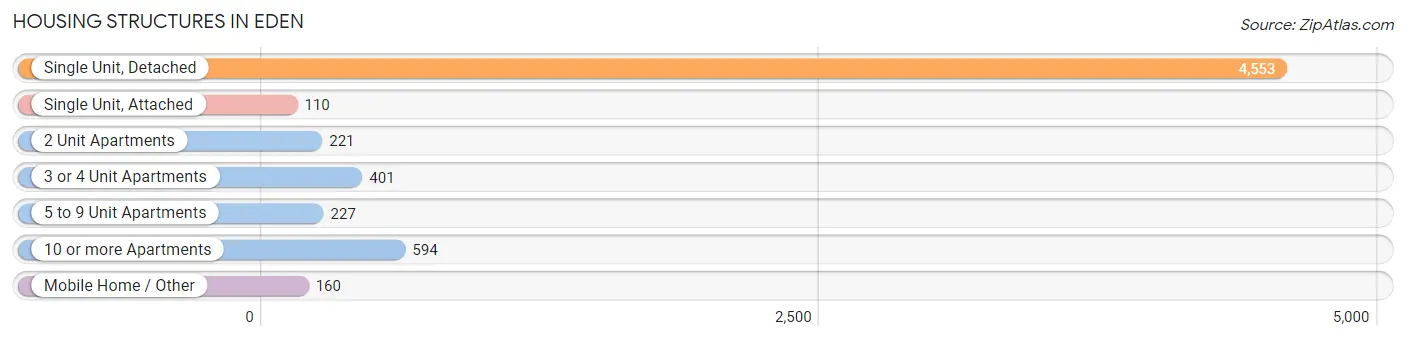
| Structure Type | # Housing Units | % Housing Units |
| Single Unit, Detached | 4,553 | 72.7% |
| Single Unit, Attached | 110 | 1.8% |
| 2 Unit Apartments | 221 | 3.5% |
| 3 or 4 Unit Apartments | 401 | 6.4% |
| 5 to 9 Unit Apartments | 227 | 3.6% |
| 10 or more Apartments | 594 | 9.5% |
| Mobile Home / Other | 160 | 2.5% |
| Total | 6,266 | 100.0% |
Housing Structures by Occupancy in Eden
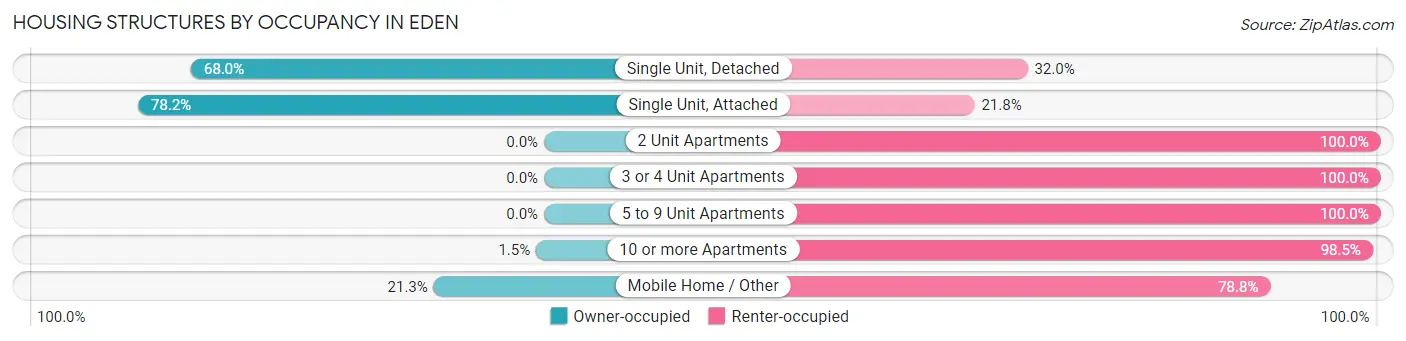
| Structure Type | Owner-occupied | Renter-occupied |
| Single Unit, Detached | 3,095 (68.0%) | 1,458 (32.0%) |
| Single Unit, Attached | 86 (78.2%) | 24 (21.8%) |
| 2 Unit Apartments | 0 (0.0%) | 221 (100.0%) |
| 3 or 4 Unit Apartments | 0 (0.0%) | 401 (100.0%) |
| 5 to 9 Unit Apartments | 0 (0.0%) | 227 (100.0%) |
| 10 or more Apartments | 9 (1.5%) | 585 (98.5%) |
| Mobile Home / Other | 34 (21.2%) | 126 (78.7%) |
| Total | 3,224 (51.4%) | 3,042 (48.5%) |
Housing Structures by Number of Rooms in Eden
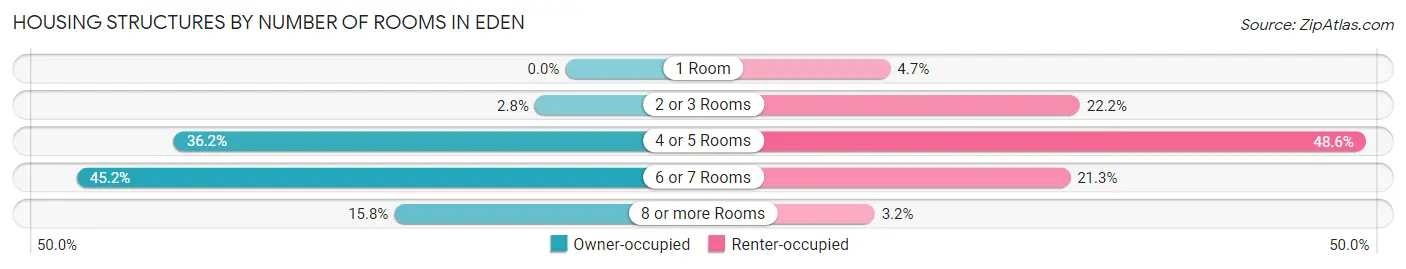
| Number of Rooms | Owner-occupied | Renter-occupied |
| 1 Room | 0 (0.0%) | 142 (4.7%) |
| 2 or 3 Rooms | 91 (2.8%) | 675 (22.2%) |
| 4 or 5 Rooms | 1,167 (36.2%) | 1,479 (48.6%) |
| 6 or 7 Rooms | 1,456 (45.2%) | 648 (21.3%) |
| 8 or more Rooms | 510 (15.8%) | 98 (3.2%) |
| Total | 3,224 (100.0%) | 3,042 (100.0%) |
Housing Structure by Heating Type in Eden
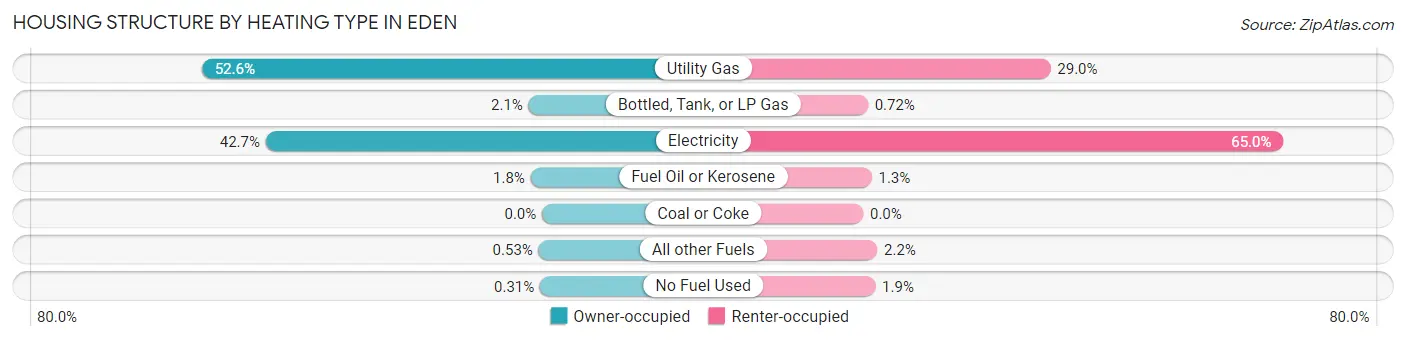
| Heating Type | Owner-occupied | Renter-occupied |
| Utility Gas | 1,696 (52.6%) | 881 (29.0%) |
| Bottled, Tank, or LP Gas | 67 (2.1%) | 22 (0.7%) |
| Electricity | 1,377 (42.7%) | 1,976 (65.0%) |
| Fuel Oil or Kerosene | 57 (1.8%) | 40 (1.3%) |
| Coal or Coke | 0 (0.0%) | 0 (0.0%) |
| All other Fuels | 17 (0.5%) | 66 (2.2%) |
| No Fuel Used | 10 (0.3%) | 57 (1.9%) |
| Total | 3,224 (100.0%) | 3,042 (100.0%) |
Household Vehicle Usage in Eden
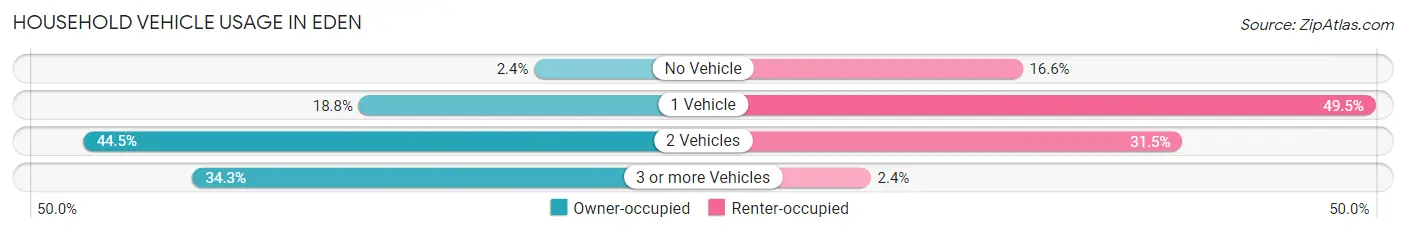
| Vehicles per Household | Owner-occupied | Renter-occupied |
| No Vehicle | 78 (2.4%) | 504 (16.6%) |
| 1 Vehicle | 606 (18.8%) | 1,507 (49.5%) |
| 2 Vehicles | 1,434 (44.5%) | 958 (31.5%) |
| 3 or more Vehicles | 1,106 (34.3%) | 73 (2.4%) |
| Total | 3,224 (100.0%) | 3,042 (100.0%) |
Real Estate & Mortgages in Eden
Real Estate and Mortgage Overview in Eden
| Characteristic | Without Mortgage | With Mortgage |
| Housing Units | 1,321 | 1,903 |
| Median Property Value | $99,300 | $108,100 |
| Median Household Income | $49,058 | $222 |
| Monthly Housing Costs | $409 | $25 |
| Real Estate Taxes | $1,025 | $31 |
Property Value by Mortgage Status in Eden
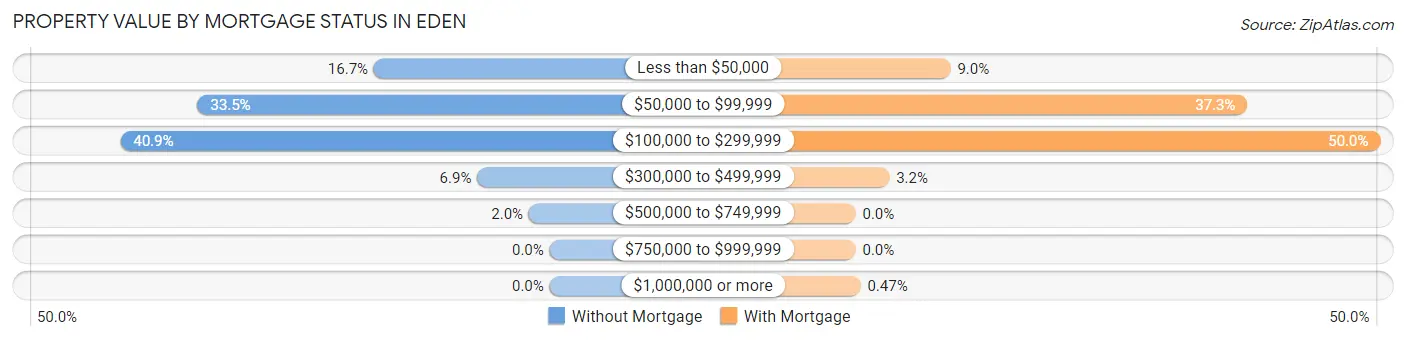
| Property Value | Without Mortgage | With Mortgage |
| Less than $50,000 | 221 (16.7%) | 172 (9.0%) |
| $50,000 to $99,999 | 443 (33.5%) | 710 (37.3%) |
| $100,000 to $299,999 | 540 (40.9%) | 951 (50.0%) |
| $300,000 to $499,999 | 91 (6.9%) | 61 (3.2%) |
| $500,000 to $749,999 | 26 (2.0%) | 0 (0.0%) |
| $750,000 to $999,999 | 0 (0.0%) | 0 (0.0%) |
| $1,000,000 or more | 0 (0.0%) | 9 (0.5%) |
| Total | 1,321 (100.0%) | 1,903 (100.0%) |
Household Income by Mortgage Status in Eden
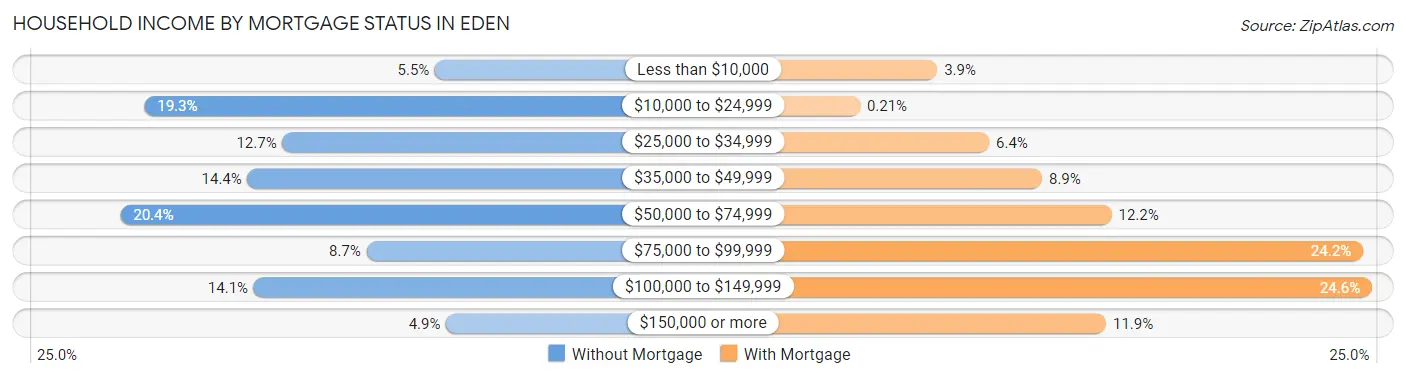
| Household Income | Without Mortgage | With Mortgage |
| Less than $10,000 | 72 (5.4%) | 74 (3.9%) |
| $10,000 to $24,999 | 255 (19.3%) | 4 (0.2%) |
| $25,000 to $34,999 | 168 (12.7%) | 121 (6.4%) |
| $35,000 to $49,999 | 190 (14.4%) | 169 (8.9%) |
| $50,000 to $74,999 | 270 (20.4%) | 232 (12.2%) |
| $75,000 to $99,999 | 115 (8.7%) | 460 (24.2%) |
| $100,000 to $149,999 | 186 (14.1%) | 468 (24.6%) |
| $150,000 or more | 65 (4.9%) | 227 (11.9%) |
| Total | 1,321 (100.0%) | 1,903 (100.0%) |
Property Value to Household Income Ratio in Eden
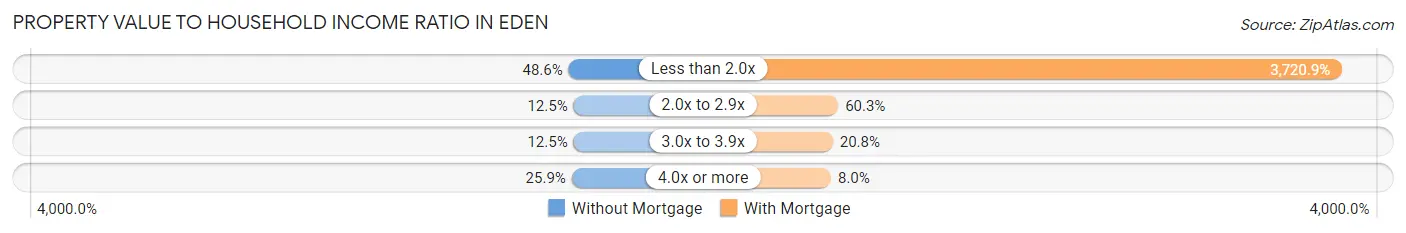
| Value-to-Income Ratio | Without Mortgage | With Mortgage |
| Less than 2.0x | 642 (48.6%) | 70,809 (3,720.9%) |
| 2.0x to 2.9x | 165 (12.5%) | 1,147 (60.3%) |
| 3.0x to 3.9x | 165 (12.5%) | 395 (20.8%) |
| 4.0x or more | 342 (25.9%) | 152 (8.0%) |
| Total | 1,321 (100.0%) | 1,903 (100.0%) |
Real Estate Taxes by Mortgage Status in Eden
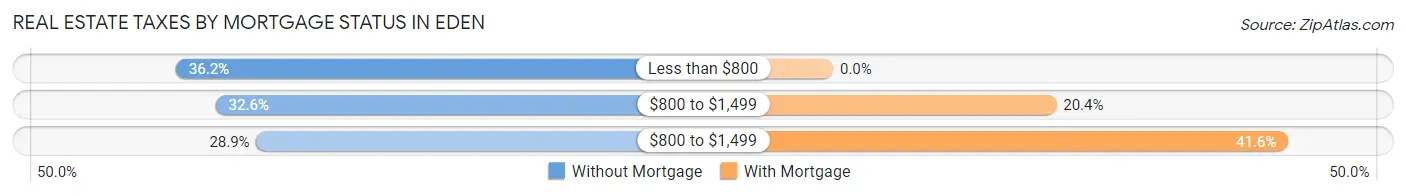
| Property Taxes | Without Mortgage | With Mortgage |
| Less than $800 | 478 (36.2%) | 0 (0.0%) |
| $800 to $1,499 | 430 (32.6%) | 388 (20.4%) |
| $800 to $1,499 | 382 (28.9%) | 791 (41.6%) |
| Total | 1,321 (100.0%) | 1,903 (100.0%) |
Health & Disability in Eden
Health Insurance Coverage by Age in Eden
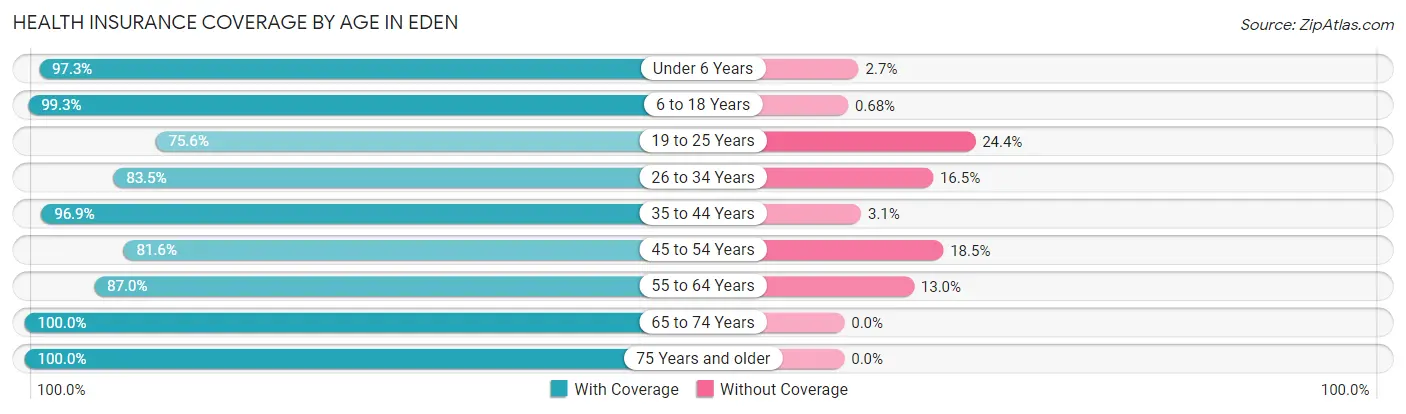
| Age Bracket | With Coverage | Without Coverage |
| Under 6 Years | 944 (97.3%) | 26 (2.7%) |
| 6 to 18 Years | 2,790 (99.3%) | 19 (0.7%) |
| 19 to 25 Years | 929 (75.6%) | 300 (24.4%) |
| 26 to 34 Years | 1,423 (83.5%) | 282 (16.5%) |
| 35 to 44 Years | 1,955 (96.9%) | 63 (3.1%) |
| 45 to 54 Years | 1,596 (81.6%) | 361 (18.4%) |
| 55 to 64 Years | 1,691 (87.0%) | 252 (13.0%) |
| 65 to 74 Years | 1,327 (100.0%) | 0 (0.0%) |
| 75 Years and older | 1,149 (100.0%) | 0 (0.0%) |
| Total | 13,804 (91.4%) | 1,303 (8.6%) |
Health Insurance Coverage by Citizenship Status in Eden
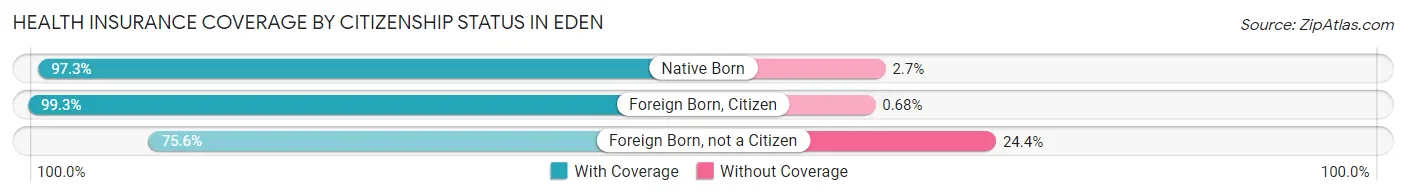
| Citizenship Status | With Coverage | Without Coverage |
| Native Born | 944 (97.3%) | 26 (2.7%) |
| Foreign Born, Citizen | 2,790 (99.3%) | 19 (0.7%) |
| Foreign Born, not a Citizen | 929 (75.6%) | 300 (24.4%) |
Health Insurance Coverage by Household Income in Eden

| Household Income | With Coverage | Without Coverage |
| Under $25,000 | 2,749 (92.0%) | 240 (8.0%) |
| $25,000 to $49,999 | 3,378 (92.1%) | 290 (7.9%) |
| $50,000 to $74,999 | 2,679 (88.3%) | 355 (11.7%) |
| $75,000 to $99,999 | 2,051 (94.4%) | 122 (5.6%) |
| $100,000 and over | 2,872 (90.7%) | 296 (9.3%) |
Public vs Private Health Insurance Coverage by Age in Eden
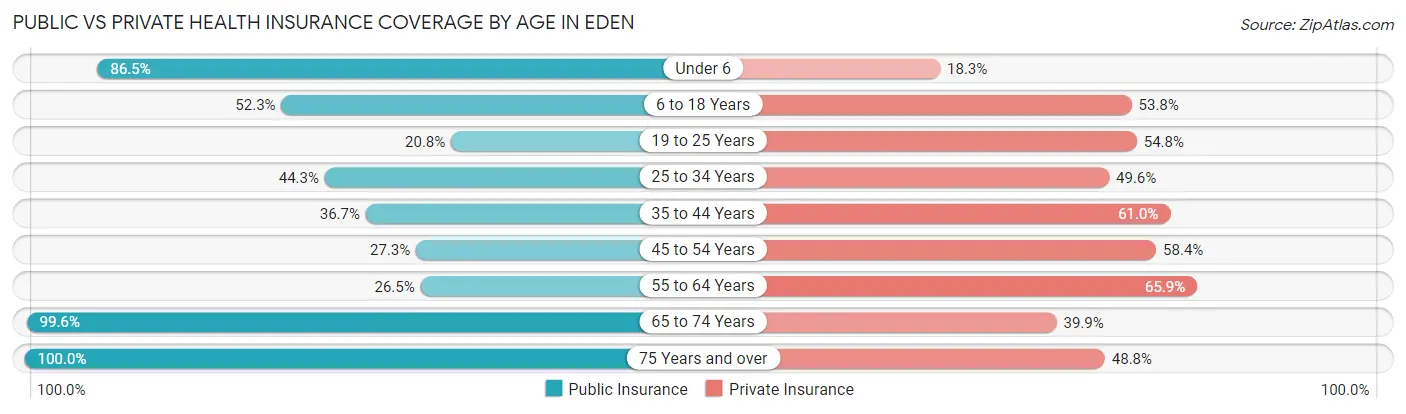
| Age Bracket | Public Insurance | Private Insurance |
| Under 6 | 839 (86.5%) | 177 (18.2%) |
| 6 to 18 Years | 1,470 (52.3%) | 1,511 (53.8%) |
| 19 to 25 Years | 256 (20.8%) | 673 (54.8%) |
| 25 to 34 Years | 755 (44.3%) | 846 (49.6%) |
| 35 to 44 Years | 740 (36.7%) | 1,230 (61.0%) |
| 45 to 54 Years | 535 (27.3%) | 1,142 (58.4%) |
| 55 to 64 Years | 515 (26.5%) | 1,281 (65.9%) |
| 65 to 74 Years | 1,322 (99.6%) | 529 (39.9%) |
| 75 Years and over | 1,149 (100.0%) | 561 (48.8%) |
| Total | 7,581 (50.2%) | 7,950 (52.6%) |
Disability Status by Sex by Age in Eden
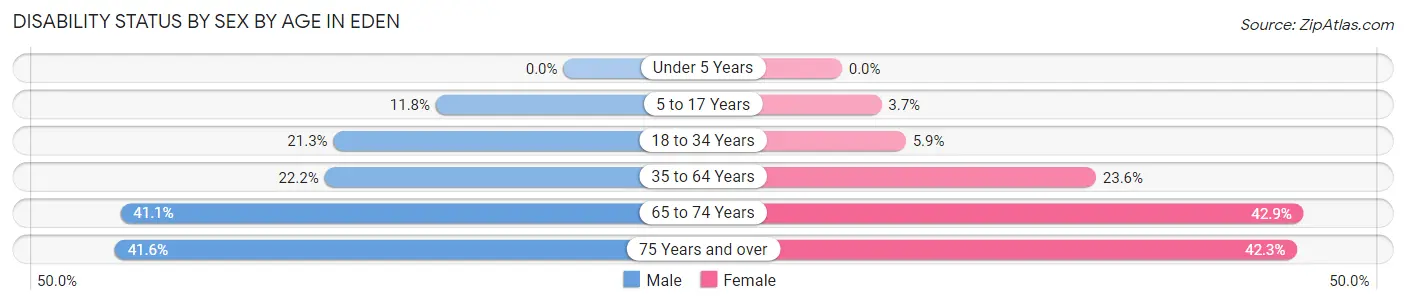
| Age Bracket | Male | Female |
| Under 5 Years | 0 (0.0%) | 0 (0.0%) |
| 5 to 17 Years | 137 (11.8%) | 51 (3.7%) |
| 18 to 34 Years | 343 (21.3%) | 97 (5.9%) |
| 35 to 64 Years | 684 (22.2%) | 668 (23.6%) |
| 65 to 74 Years | 229 (41.1%) | 330 (42.9%) |
| 75 Years and over | 174 (41.6%) | 309 (42.3%) |
Disability Class by Sex by Age in Eden
Disability Class: Hearing Difficulty
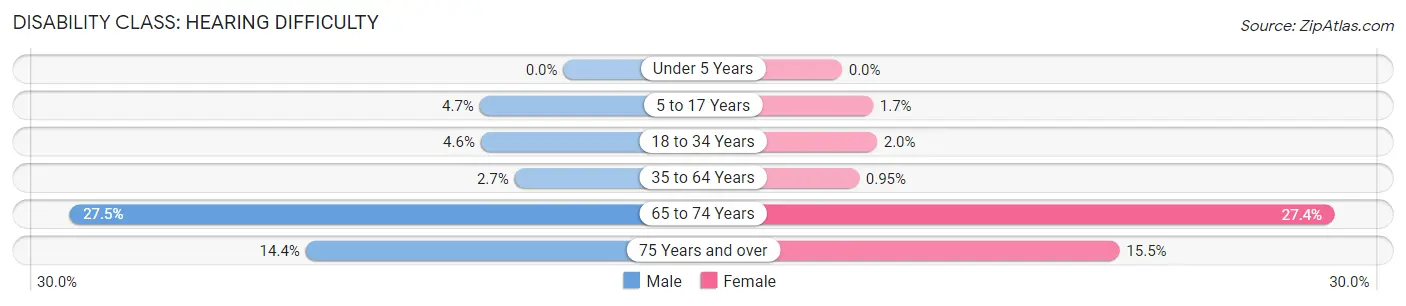
| Age Bracket | Male | Female |
| Under 5 Years | 0 (0.0%) | 0 (0.0%) |
| 5 to 17 Years | 54 (4.7%) | 24 (1.7%) |
| 18 to 34 Years | 74 (4.6%) | 32 (1.9%) |
| 35 to 64 Years | 84 (2.7%) | 27 (0.9%) |
| 65 to 74 Years | 153 (27.5%) | 211 (27.4%) |
| 75 Years and over | 60 (14.3%) | 113 (15.5%) |
Disability Class: Vision Difficulty
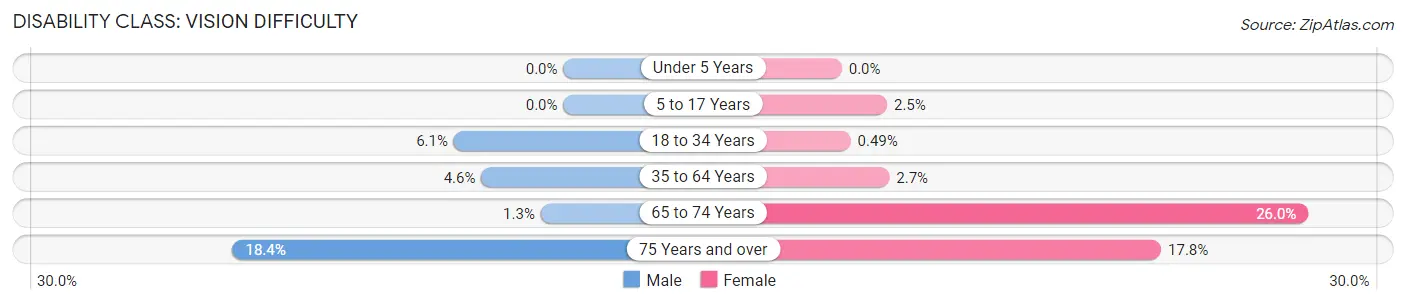
| Age Bracket | Male | Female |
| Under 5 Years | 0 (0.0%) | 0 (0.0%) |
| 5 to 17 Years | 0 (0.0%) | 35 (2.5%) |
| 18 to 34 Years | 98 (6.1%) | 8 (0.5%) |
| 35 to 64 Years | 141 (4.6%) | 75 (2.6%) |
| 65 to 74 Years | 7 (1.3%) | 200 (26.0%) |
| 75 Years and over | 77 (18.4%) | 130 (17.8%) |
Disability Class: Cognitive Difficulty
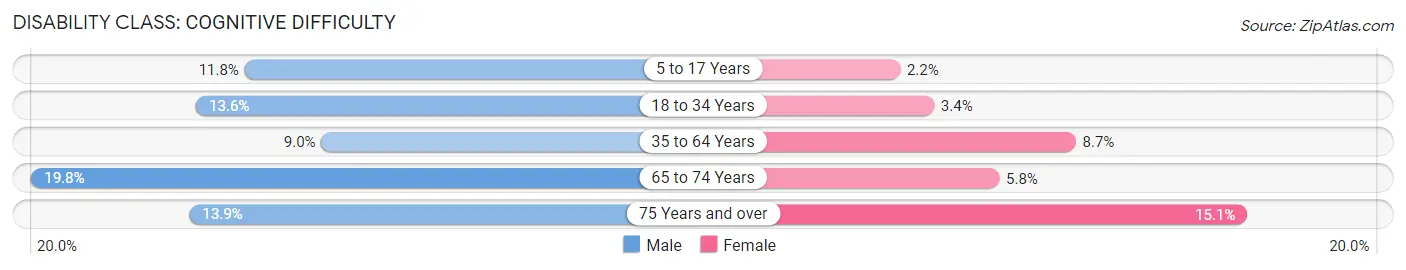
| Age Bracket | Male | Female |
| 5 to 17 Years | 137 (11.8%) | 30 (2.2%) |
| 18 to 34 Years | 219 (13.6%) | 56 (3.4%) |
| 35 to 64 Years | 277 (9.0%) | 246 (8.7%) |
| 65 to 74 Years | 110 (19.8%) | 45 (5.8%) |
| 75 Years and over | 58 (13.9%) | 110 (15.0%) |
Disability Class: Ambulatory Difficulty
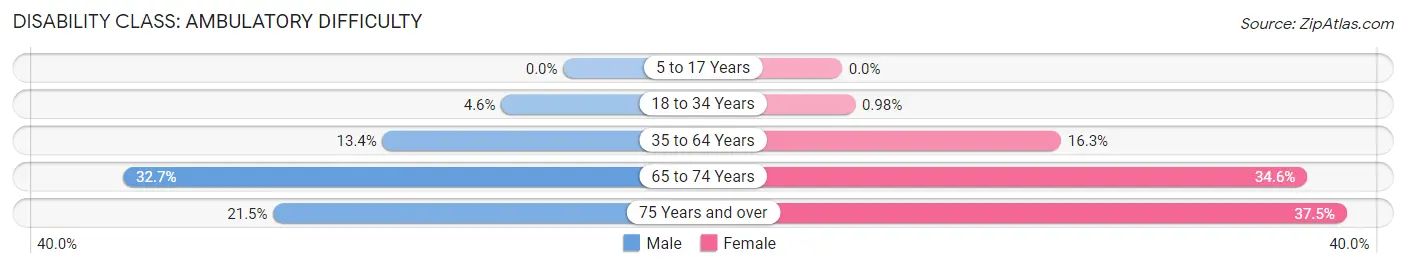
| Age Bracket | Male | Female |
| 5 to 17 Years | 0 (0.0%) | 0 (0.0%) |
| 18 to 34 Years | 74 (4.6%) | 16 (1.0%) |
| 35 to 64 Years | 414 (13.4%) | 461 (16.3%) |
| 65 to 74 Years | 182 (32.7%) | 266 (34.5%) |
| 75 Years and over | 90 (21.5%) | 274 (37.5%) |
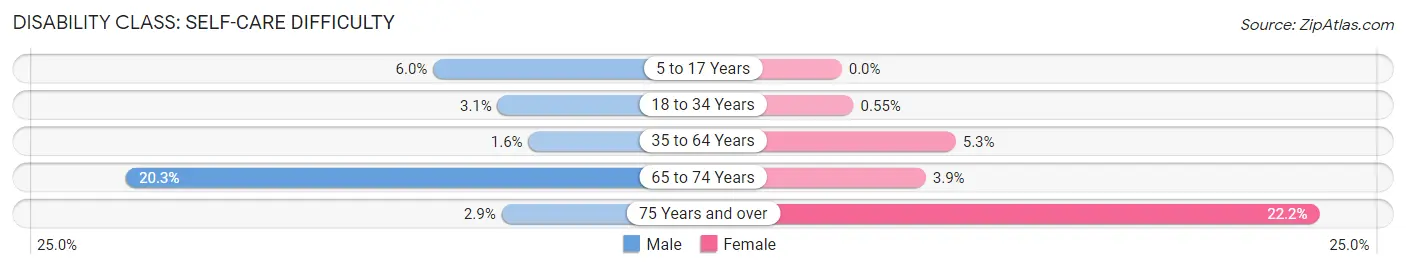
Disability Class: Self-Care Difficulty
| Age Bracket | Male | Female |
| 5 to 17 Years | 70 (6.0%) | 0 (0.0%) |
| 18 to 34 Years | 49 (3.0%) | 9 (0.5%) |
| 35 to 64 Years | 50 (1.6%) | 150 (5.3%) |
| 65 to 74 Years | 113 (20.3%) | 30 (3.9%) |
| 75 Years and over | 12 (2.9%) | 162 (22.2%) |
Technology Access in Eden
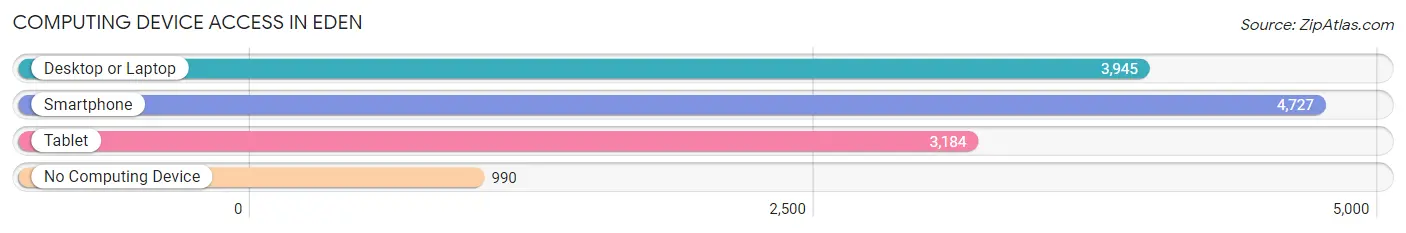
Computing Device Access in Eden
| Device Type | # Households | % Households |
| Desktop or Laptop | 3,945 | 63.0% |
| Smartphone | 4,727 | 75.4% |
| Tablet | 3,184 | 50.8% |
| No Computing Device | 990 | 15.8% |
| Total | 6,266 | 100.0% |
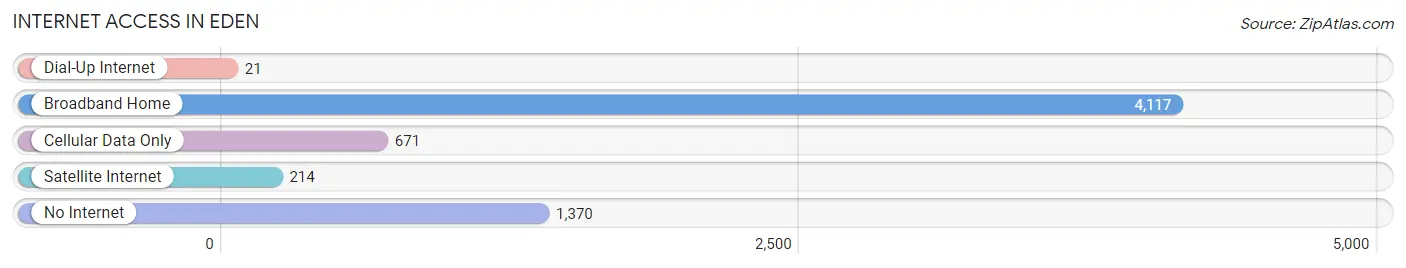
Internet Access in Eden
| Internet Type | # Households | % Households |
| Dial-Up Internet | 21 | 0.3% |
| Broadband Home | 4,117 | 65.7% |
| Cellular Data Only | 671 | 10.7% |
| Satellite Internet | 214 | 3.4% |
| No Internet | 1,370 | 21.9% |
| Total | 6,266 | 100.0% |
Eden Summary
Eden, North Carolina is a small city located in Rockingham County in the state of North Carolina. It is situated in the foothills of the Blue Ridge Mountains and is part of the Piedmont Triad region. The city has a population of approximately 15,000 people and is the county seat of Rockingham County.
History
Eden was founded in 1799 by a group of settlers from the nearby town of Reidsville. The town was named after the biblical Garden of Eden and was originally known as Leaksville. The town was incorporated in 1874 and was the first town in Rockingham County to be incorporated.
The town was an important center for the textile industry in the late 19th and early 20th centuries. The Leaksville Woolen Mill was established in 1883 and was the first woolen mill in the county. The mill was later renamed the Eden Woolen Mill and was the largest employer in the town for many years.
The town was also an important center for the tobacco industry. The American Tobacco Company opened a factory in Eden in 1892 and the town became known as the “Tobacco Capital of the World”. The factory closed in the late 1990s and the town has since shifted its focus to other industries.
Geography
Eden is located in the foothills of the Blue Ridge Mountains in the Piedmont region of North Carolina. The city is situated at the confluence of the Dan and Smith Rivers and is surrounded by rolling hills and forests. The city has a total area of 8.3 square miles and has an elevation of 845 feet.
The climate in Eden is humid subtropical with hot, humid summers and mild winters. The average annual temperature is around 60 degrees Fahrenheit and the average annual precipitation is around 45 inches.
Economy
Eden’s economy is largely based on manufacturing and agriculture. The city is home to several manufacturing companies, including the Eden Woolen Mill, which produces woolen fabrics and apparel. The city is also home to several agricultural businesses, including poultry farms, dairy farms, and vegetable farms.
The city is also home to several retail stores, restaurants, and other businesses. The city is served by the Rockingham County Airport, which provides air service to the surrounding area.
Demographics
As of the 2010 census, the population of Eden was 15,527. The racial makeup of the city was 79.3% White, 16.2% African American, 0.4% Native American, 0.7% Asian, 0.1% Pacific Islander, and 2.3% from other races. The median household income was $33,902 and the median family income was $41,945.
Eden is home to several churches, including the First Baptist Church, the First Presbyterian Church, and the Church of the Good Shepherd. The city is also home to several schools, including Eden Elementary School, Rockingham County High School, and Rockingham Community College.
Eden is a small city with a rich history and a diverse economy. The city is home to several manufacturing and agricultural businesses and is served by the Rockingham County Airport. The city has a population of 15,527 people and is the county seat of Rockingham County.
Common Questions
What is Per Capita Income in Eden?
Per Capita income in Eden is $26,304.
What is the Median Family Income in Eden?
Median Family Income in Eden is $62,111.
What is the Median Household income in Eden?
Median Household Income in Eden is $43,607.
What is Income or Wage Gap in Eden?
Income or Wage Gap in Eden is 14.5%.
Women in Eden earn 85.5 cents for every dollar earned by a man.
What is Family Income Deficit in Eden?
Family Income Deficit in Eden is $10,550.
Families that are below poverty line in Eden earn $10,550 less on average than the poverty threshold level.
What is Inequality or Gini Index in Eden?
Inequality or Gini Index in Eden is 0.49.
What is the Total Population of Eden?
Total Population of Eden is 15,349.
What is the Total Male Population of Eden?
Total Male Population of Eden is 7,327.
What is the Total Female Population of Eden?
Total Female Population of Eden is 8,022.
What is the Ratio of Males per 100 Females in Eden?
There are 91.34 Males per 100 Females in Eden.
What is the Ratio of Females per 100 Males in Eden?
There are 109.49 Females per 100 Males in Eden.
What is the Median Population Age in Eden?
Median Population Age in Eden is 39.3 Years.
What is the Average Family Size in Eden
Average Family Size in Eden is 3.0 People.
What is the Average Household Size in Eden
Average Household Size in Eden is 2.4 People.
How Large is the Labor Force in Eden?
There are 6,945 People in the Labor Forcein in Eden.
What is the Percentage of People in the Labor Force in Eden?
56.2% of People are in the Labor Force in Eden.
What is the Unemployment Rate in Eden?
Unemployment Rate in Eden is 6.0%.