Greenville, NC Map & Demographics
Greenville Map
Greenville Overview
$30,605
PER CAPITA INCOME
$69,496
AVG FAMILY INCOME
$47,485
AVG HOUSEHOLD INCOME
22.0%
WAGE / INCOME GAP [ % ]
78.0¢/ $1
WAGE / INCOME GAP [ $ ]
$14,004
FAMILY INCOME DEFICIT
0.50
INEQUALITY / GINI INDEX
87,894
TOTAL POPULATION
39,855
MALE POPULATION
48,039
FEMALE POPULATION
82.96
MALES / 100 FEMALES
120.53
FEMALES / 100 MALES
26.9
MEDIAN AGE
2.8
AVG FAMILY SIZE
2.2
AVG HOUSEHOLD SIZE
46,921
LABOR FORCE [ PEOPLE ]
64.5%
PERCENT IN LABOR FORCE
8.7%
UNEMPLOYMENT RATE
Greenville Area Codes
Income in Greenville
Income Overview in Greenville
Per Capita Income in Greenville is $30,605, while median incomes of families and households are $69,496 and $47,485 respectively.
| Characteristic | Number | Measure |
| Per Capita Income | 87,894 | $30,605 |
| Median Family Income | 17,377 | $69,496 |
| Mean Family Income | 17,377 | $91,157 |
| Median Household Income | 37,901 | $47,485 |
| Mean Household Income | 37,901 | $70,616 |
| Income Deficit | 17,377 | $14,004 |
| Wage / Income Gap (%) | 87,894 | 22.00% |
| Wage / Income Gap ($) | 87,894 | 78.00¢ per $1 |
| Gini / Inequality Index | 87,894 | 0.50 |
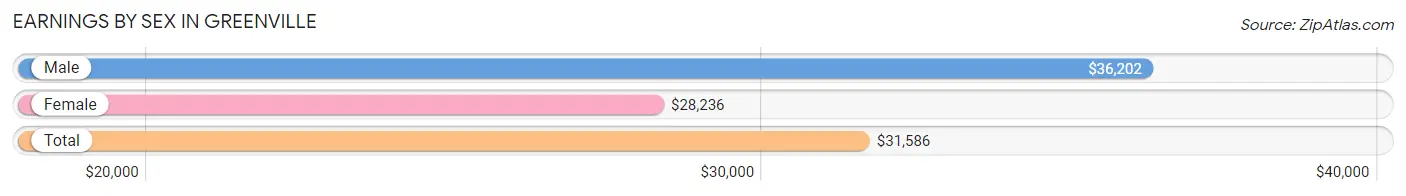
Earnings by Sex in Greenville
Average Earnings in Greenville are $31,586, $36,202 for men and $28,236 for women, a difference of 22.0%.
| Sex | Number | Average Earnings |
| Male | 22,887 (46.7%) | $36,202 |
| Female | 26,119 (53.3%) | $28,236 |
| Total | 49,006 (100.0%) | $31,586 |
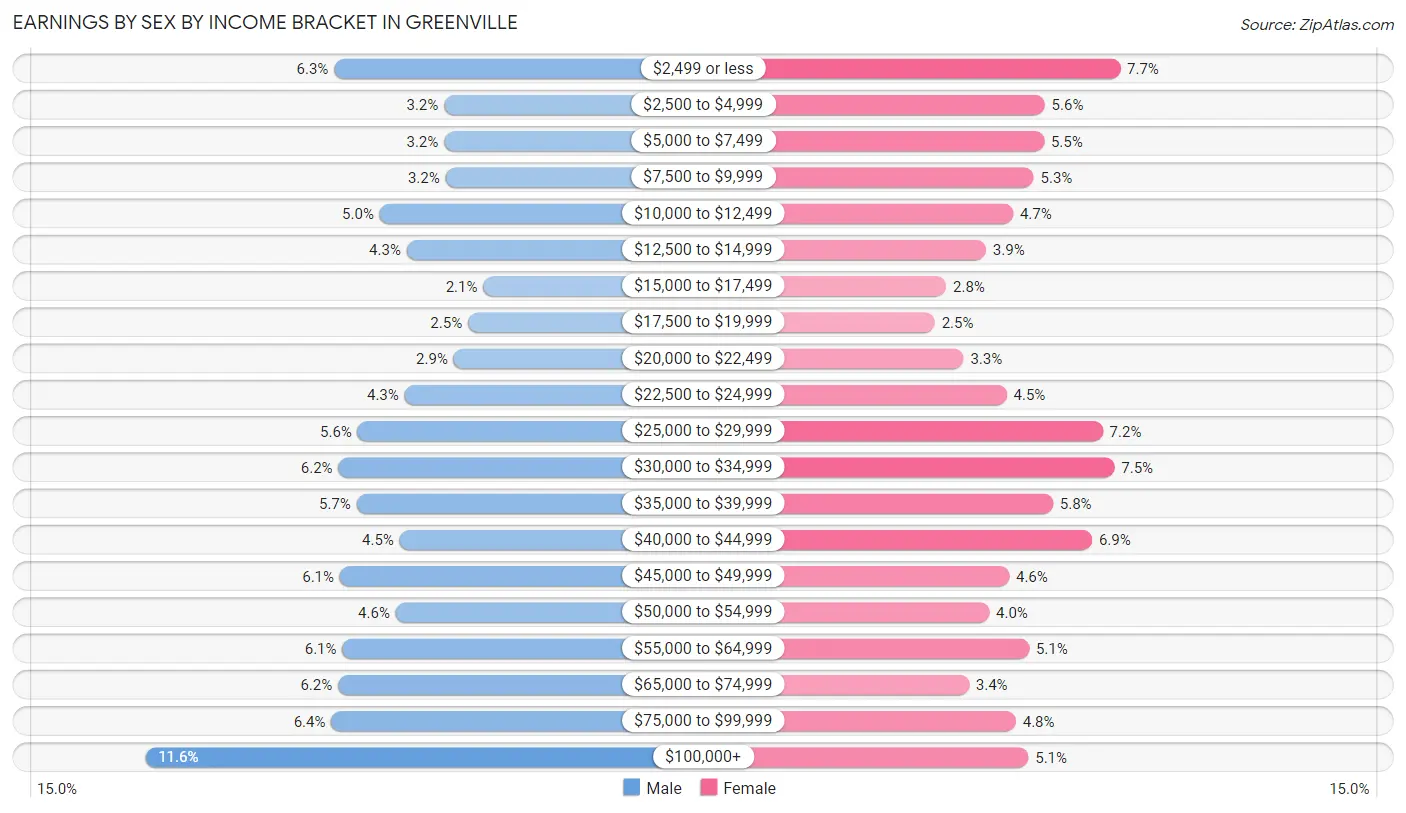
Earnings by Sex by Income Bracket in Greenville
The most common earnings brackets in Greenville are $100,000+ for men (2,657 | 11.6%) and $2,499 or less for women (2,006 | 7.7%).
| Income | Male | Female |
| $2,499 or less | 1,443 (6.3%) | 2,006 (7.7%) |
| $2,500 to $4,999 | 735 (3.2%) | 1,453 (5.6%) |
| $5,000 to $7,499 | 735 (3.2%) | 1,448 (5.5%) |
| $7,500 to $9,999 | 725 (3.2%) | 1,372 (5.2%) |
| $10,000 to $12,499 | 1,148 (5.0%) | 1,221 (4.7%) |
| $12,500 to $14,999 | 976 (4.3%) | 1,022 (3.9%) |
| $15,000 to $17,499 | 483 (2.1%) | 729 (2.8%) |
| $17,500 to $19,999 | 582 (2.5%) | 645 (2.5%) |
| $20,000 to $22,499 | 672 (2.9%) | 856 (3.3%) |
| $22,500 to $24,999 | 988 (4.3%) | 1,173 (4.5%) |
| $25,000 to $29,999 | 1,291 (5.6%) | 1,878 (7.2%) |
| $30,000 to $34,999 | 1,415 (6.2%) | 1,965 (7.5%) |
| $35,000 to $39,999 | 1,297 (5.7%) | 1,513 (5.8%) |
| $40,000 to $44,999 | 1,020 (4.5%) | 1,800 (6.9%) |
| $45,000 to $49,999 | 1,406 (6.1%) | 1,190 (4.6%) |
| $50,000 to $54,999 | 1,047 (4.6%) | 1,044 (4.0%) |
| $55,000 to $64,999 | 1,389 (6.1%) | 1,338 (5.1%) |
| $65,000 to $74,999 | 1,417 (6.2%) | 895 (3.4%) |
| $75,000 to $99,999 | 1,461 (6.4%) | 1,240 (4.8%) |
| $100,000+ | 2,657 (11.6%) | 1,331 (5.1%) |
| Total | 22,887 (100.0%) | 26,119 (100.0%) |
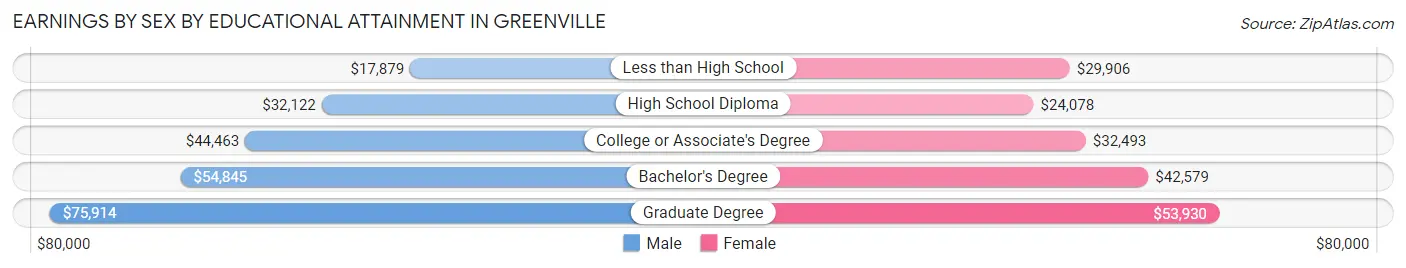
Earnings by Sex by Educational Attainment in Greenville
Average earnings in Greenville are $47,484 for men and $38,111 for women, a difference of 19.7%. Men with an educational attainment of graduate degree enjoy the highest average annual earnings of $75,914, while those with less than high school education earn the least with $17,879. Women with an educational attainment of graduate degree earn the most with the average annual earnings of $53,930, while those with high school diploma education have the smallest earnings of $24,078.
| Educational Attainment | Male Income | Female Income |
| Less than High School | $17,879 | $29,906 |
| High School Diploma | $32,122 | $24,078 |
| College or Associate's Degree | $44,463 | $32,493 |
| Bachelor's Degree | $54,845 | $42,579 |
| Graduate Degree | $75,914 | $53,930 |
| Total | $47,484 | $38,111 |
Family Income in Greenville
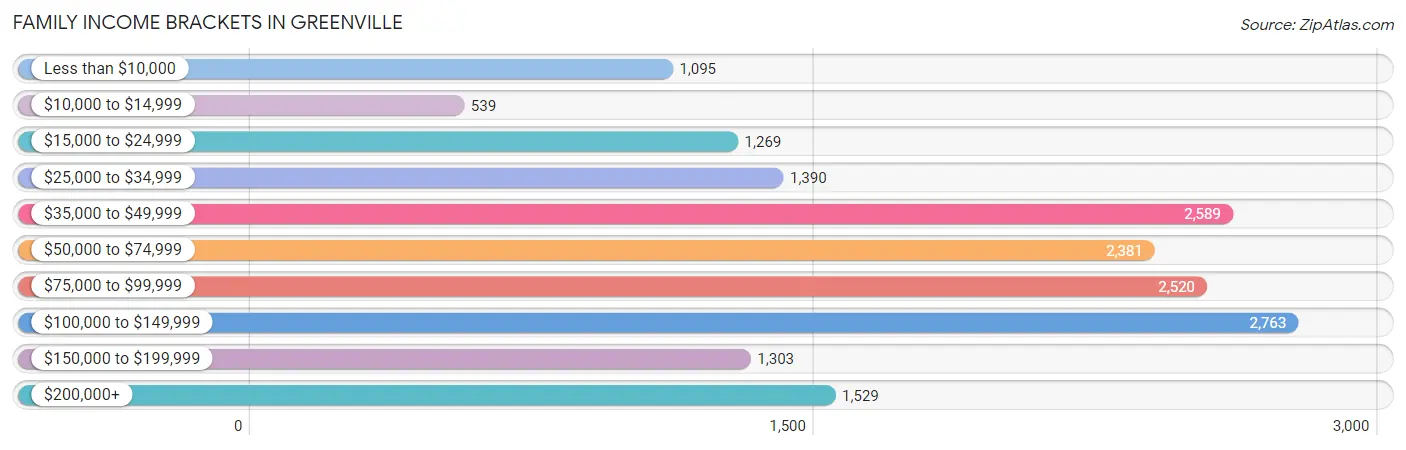
Family Income Brackets in Greenville
According to the Greenville family income data, there are 2,763 families falling into the $100,000 to $149,999 income range, which is the most common income bracket and makes up 15.9% of all families. Conversely, the $10,000 to $14,999 income bracket is the least frequent group with only 539 families (3.1%) belonging to this category.
| Income Bracket | # Families | % Families |
| Less than $10,000 | 1,095 | 6.3% |
| $10,000 to $14,999 | 539 | 3.1% |
| $15,000 to $24,999 | 1,269 | 7.3% |
| $25,000 to $34,999 | 1,390 | 8.0% |
| $35,000 to $49,999 | 2,589 | 14.9% |
| $50,000 to $74,999 | 2,381 | 13.7% |
| $75,000 to $99,999 | 2,520 | 14.5% |
| $100,000 to $149,999 | 2,763 | 15.9% |
| $150,000 to $199,999 | 1,303 | 7.5% |
| $200,000+ | 1,529 | 8.8% |
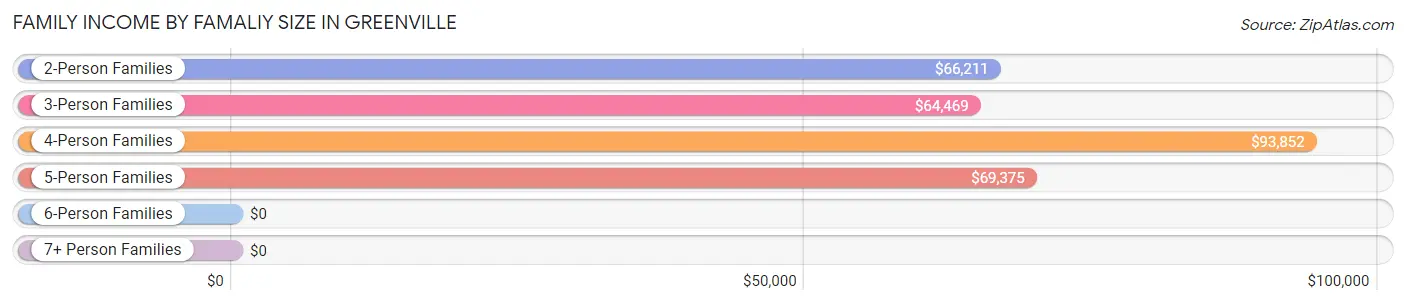
Family Income by Famaliy Size in Greenville
4-person families (2,721 | 15.7%) account for the highest median family income in Greenville with $93,852 per family, while 2-person families (8,990 | 51.7%) have the highest median income of $33,106 per family member.
| Income Bracket | # Families | Median Income |
| 2-Person Families | 8,990 (51.7%) | $66,211 |
| 3-Person Families | 3,946 (22.7%) | $64,469 |
| 4-Person Families | 2,721 (15.7%) | $93,852 |
| 5-Person Families | 1,367 (7.9%) | $69,375 |
| 6-Person Families | 257 (1.5%) | $0 |
| 7+ Person Families | 96 (0.5%) | $0 |
| Total | 17,377 (100.0%) | $69,496 |
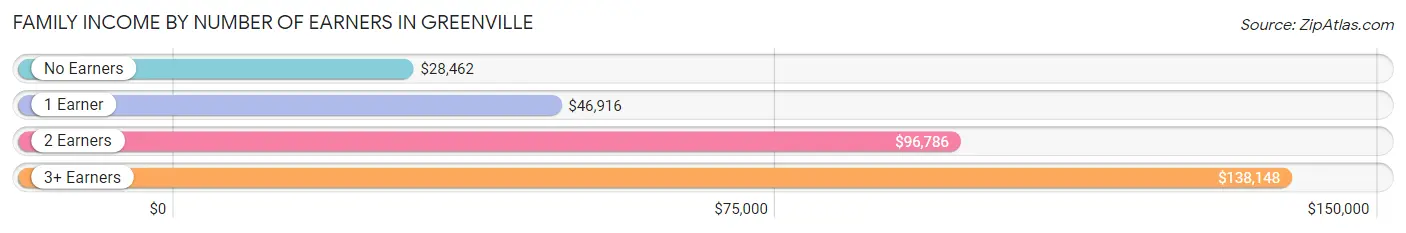
Family Income by Number of Earners in Greenville
The median family income in Greenville is $69,496, with families comprising 3+ earners (798) having the highest median family income of $138,148, while families with no earners (2,010) have the lowest median family income of $28,462, accounting for 4.6% and 11.6% of families, respectively.
| Number of Earners | # Families | Median Income |
| No Earners | 2,010 (11.6%) | $28,462 |
| 1 Earner | 7,119 (41.0%) | $46,916 |
| 2 Earners | 7,450 (42.9%) | $96,786 |
| 3+ Earners | 798 (4.6%) | $138,148 |
| Total | 17,377 (100.0%) | $69,496 |
Household Income in Greenville
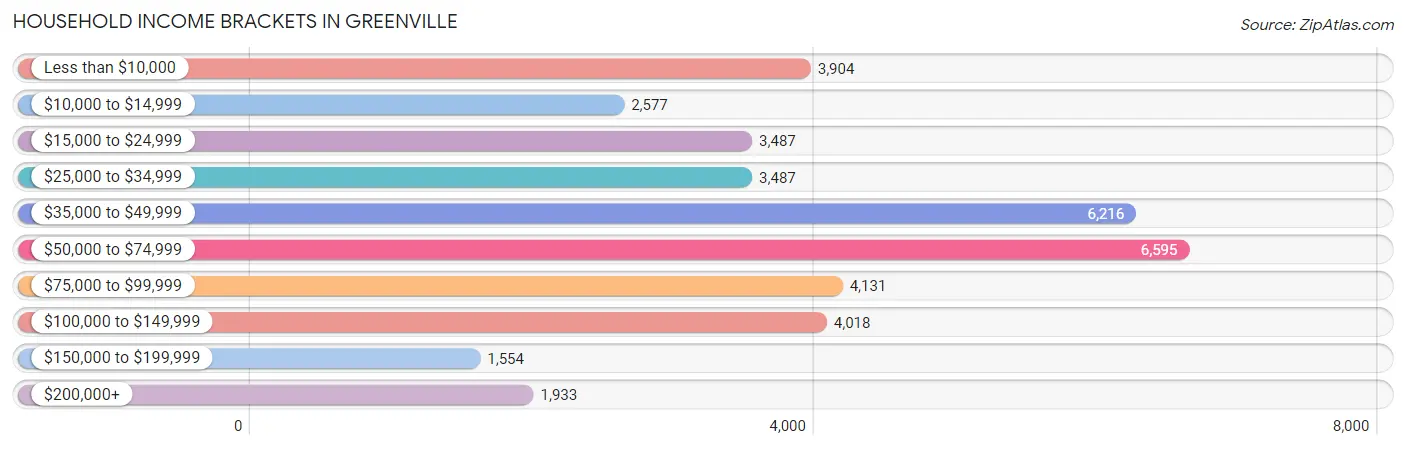
Household Income Brackets in Greenville
With 6,595 households falling in the category, the $50,000 to $74,999 income range is the most frequent in Greenville, accounting for 17.4% of all households. In contrast, only 1,554 households (4.1%) fall into the $150,000 to $199,999 income bracket, making it the least populous group.
| Income Bracket | # Households | % Households |
| Less than $10,000 | 3,904 | 10.3% |
| $10,000 to $14,999 | 2,577 | 6.8% |
| $15,000 to $24,999 | 3,487 | 9.2% |
| $25,000 to $34,999 | 3,487 | 9.2% |
| $35,000 to $49,999 | 6,216 | 16.4% |
| $50,000 to $74,999 | 6,595 | 17.4% |
| $75,000 to $99,999 | 4,131 | 10.9% |
| $100,000 to $149,999 | 4,018 | 10.6% |
| $150,000 to $199,999 | 1,554 | 4.1% |
| $200,000+ | 1,933 | 5.1% |
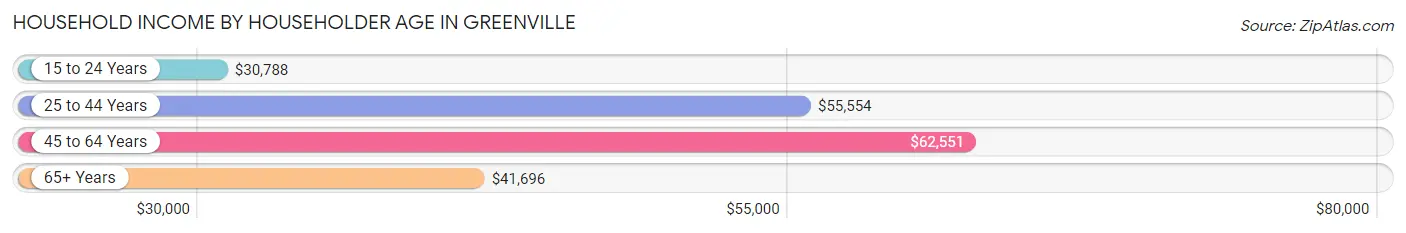
Household Income by Householder Age in Greenville
The median household income in Greenville is $47,485, with the highest median household income of $62,551 found in the 45 to 64 years age bracket for the primary householder. A total of 9,512 households (25.1%) fall into this category. Meanwhile, the 15 to 24 years age bracket for the primary householder has the lowest median household income of $30,788, with 7,760 households (20.5%) in this group.
| Income Bracket | # Households | Median Income |
| 15 to 24 Years | 7,760 (20.5%) | $30,788 |
| 25 to 44 Years | 14,726 (38.9%) | $55,554 |
| 45 to 64 Years | 9,512 (25.1%) | $62,551 |
| 65+ Years | 5,903 (15.6%) | $41,696 |
| Total | 37,901 (100.0%) | $47,485 |
Poverty in Greenville
Income Below Poverty by Sex and Age in Greenville
With 23.3% poverty level for males and 26.9% for females among the residents of Greenville, 18 to 24 year old males and 18 to 24 year old females are the most vulnerable to poverty, with 4,142 males (48.1%) and 5,547 females (55.9%) in their respective age groups living below the poverty level.
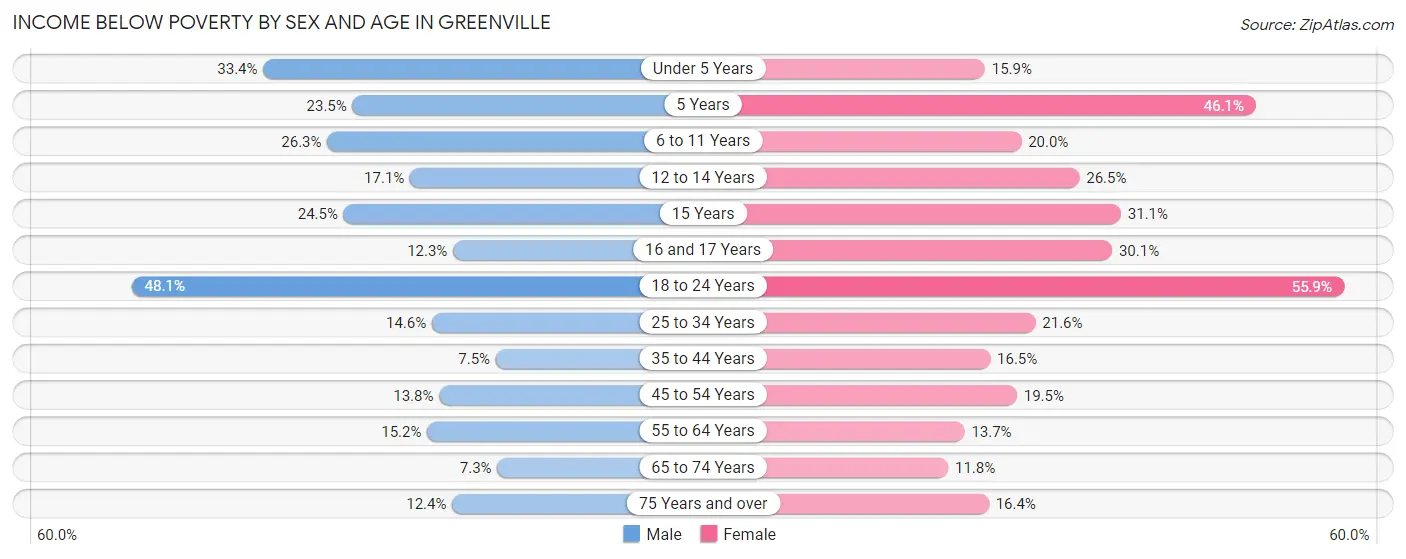
| Age Bracket | Male | Female |
| Under 5 Years | 854 (33.4%) | 435 (15.9%) |
| 5 Years | 150 (23.5%) | 154 (46.1%) |
| 6 to 11 Years | 659 (26.3%) | 476 (20.0%) |
| 12 to 14 Years | 287 (17.1%) | 346 (26.5%) |
| 15 Years | 89 (24.4%) | 161 (31.1%) |
| 16 and 17 Years | 106 (12.3%) | 226 (30.1%) |
| 18 to 24 Years | 4,142 (48.1%) | 5,547 (55.9%) |
| 25 to 34 Years | 864 (14.6%) | 1,625 (21.6%) |
| 35 to 44 Years | 330 (7.5%) | 907 (16.5%) |
| 45 to 54 Years | 492 (13.8%) | 896 (19.5%) |
| 55 to 64 Years | 462 (15.1%) | 565 (13.7%) |
| 65 to 74 Years | 159 (7.3%) | 377 (11.8%) |
| 75 Years and over | 149 (12.4%) | 300 (16.4%) |
| Total | 8,743 (23.3%) | 12,015 (26.9%) |
Income Above Poverty by Sex and Age in Greenville
According to the poverty statistics in Greenville, males aged 65 to 74 years and females aged 65 to 74 years are the age groups that are most secure financially, with 92.7% of males and 88.2% of females in these age groups living above the poverty line.
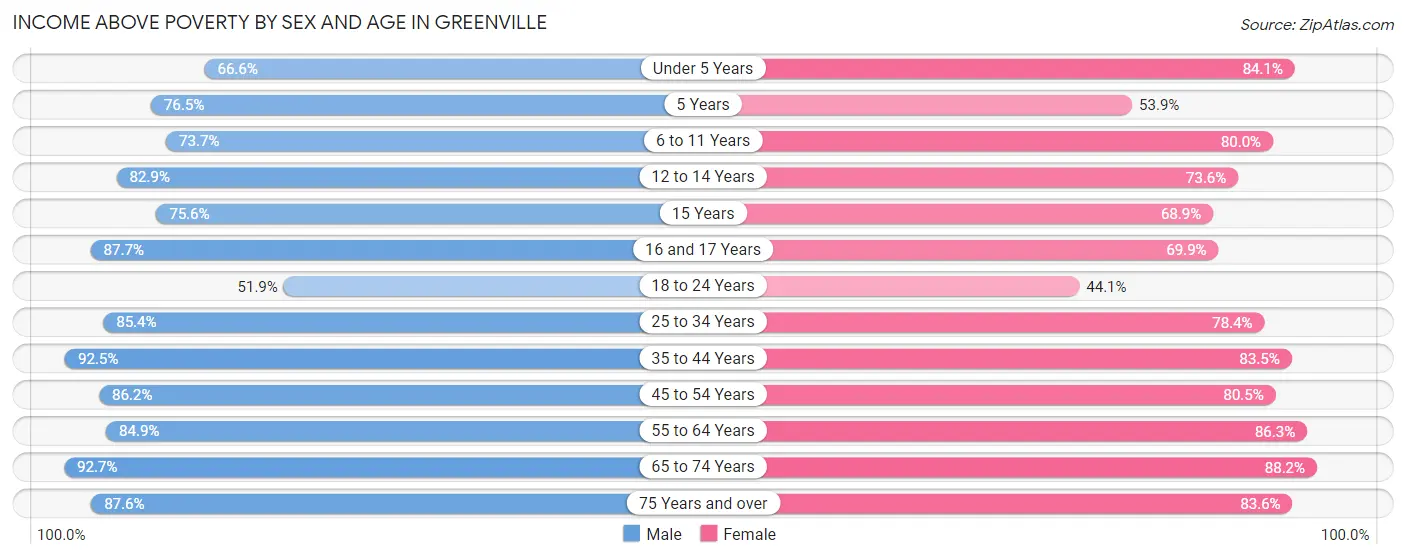
| Age Bracket | Male | Female |
| Under 5 Years | 1,702 (66.6%) | 2,295 (84.1%) |
| 5 Years | 489 (76.5%) | 180 (53.9%) |
| 6 to 11 Years | 1,849 (73.7%) | 1,906 (80.0%) |
| 12 to 14 Years | 1,395 (82.9%) | 962 (73.6%) |
| 15 Years | 275 (75.5%) | 357 (68.9%) |
| 16 and 17 Years | 758 (87.7%) | 525 (69.9%) |
| 18 to 24 Years | 4,473 (51.9%) | 4,376 (44.1%) |
| 25 to 34 Years | 5,045 (85.4%) | 5,912 (78.4%) |
| 35 to 44 Years | 4,062 (92.5%) | 4,582 (83.5%) |
| 45 to 54 Years | 3,069 (86.2%) | 3,701 (80.5%) |
| 55 to 64 Years | 2,587 (84.9%) | 3,570 (86.3%) |
| 65 to 74 Years | 2,006 (92.7%) | 2,811 (88.2%) |
| 75 Years and over | 1,056 (87.6%) | 1,534 (83.6%) |
| Total | 28,766 (76.7%) | 32,711 (73.1%) |
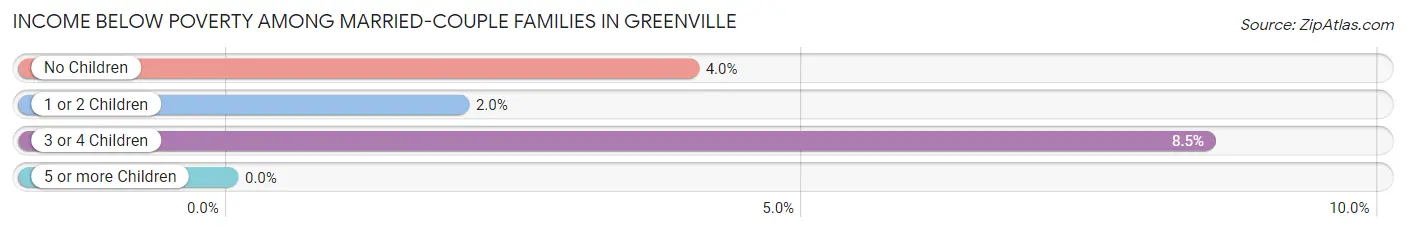
Income Below Poverty Among Married-Couple Families in Greenville
The poverty statistics for married-couple families in Greenville show that 3.6% or 346 of the total 9,727 families live below the poverty line. Families with 3 or 4 children have the highest poverty rate of 8.5%, comprising of 53 families. On the other hand, families with 5 or more children have the lowest poverty rate of 0.0%, which includes 0 families.
| Children | Above Poverty | Below Poverty |
| No Children | 5,332 (96.0%) | 223 (4.0%) |
| 1 or 2 Children | 3,410 (98.0%) | 70 (2.0%) |
| 3 or 4 Children | 570 (91.5%) | 53 (8.5%) |
| 5 or more Children | 69 (100.0%) | 0 (0.0%) |
| Total | 9,381 (96.4%) | 346 (3.6%) |
Income Below Poverty Among Single-Parent Households in Greenville
According to the poverty data in Greenville, 17.7% or 287 single-father households and 28.1% or 1,692 single-mother households are living below the poverty line. Among single-father households, those with 1 or 2 children have the highest poverty rate, with 173 households (34.7%) experiencing poverty. Likewise, among single-mother households, those with 5 or more children have the highest poverty rate, with 43 households (100.0%) falling below the poverty line.
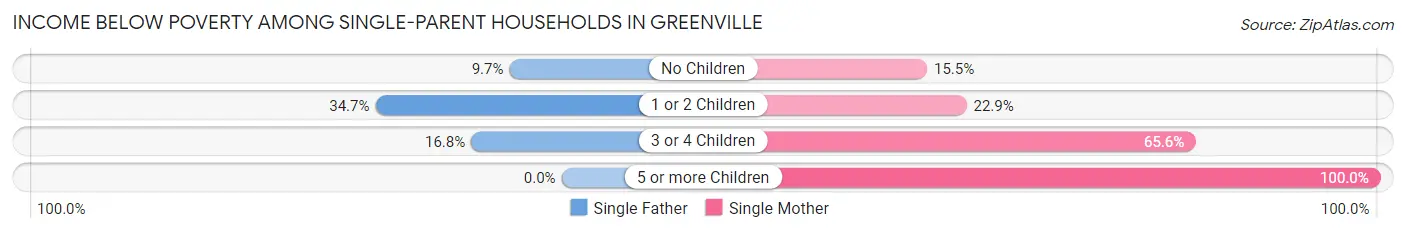
| Children | Single Father | Single Mother |
| No Children | 98 (9.7%) | 224 (15.5%) |
| 1 or 2 Children | 173 (34.7%) | 833 (22.9%) |
| 3 or 4 Children | 16 (16.8%) | 592 (65.6%) |
| 5 or more Children | 0 (0.0%) | 43 (100.0%) |
| Total | 287 (17.7%) | 1,692 (28.1%) |
Income Below Poverty Among Married-Couple vs Single-Parent Households in Greenville
The poverty data for Greenville shows that 346 of the married-couple family households (3.6%) and 1,979 of the single-parent households (25.9%) are living below the poverty level. Within the married-couple family households, those with 3 or 4 children have the highest poverty rate, with 53 households (8.5%) falling below the poverty line. Among the single-parent households, those with 5 or more children have the highest poverty rate, with 43 household (68.2%) living below poverty.
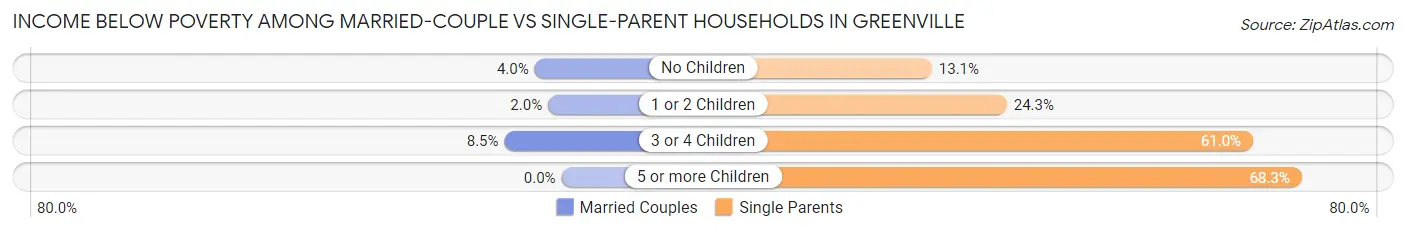
| Children | Married-Couple Families | Single-Parent Households |
| No Children | 223 (4.0%) | 322 (13.1%) |
| 1 or 2 Children | 70 (2.0%) | 1,006 (24.3%) |
| 3 or 4 Children | 53 (8.5%) | 608 (61.0%) |
| 5 or more Children | 0 (0.0%) | 43 (68.2%) |
| Total | 346 (3.6%) | 1,979 (25.9%) |
Race in Greenville
The most populous races in Greenville are White / Caucasian (44,217 | 50.3%), Black / African American (35,218 | 40.1%), and Two or more Races (3,755 | 4.3%).
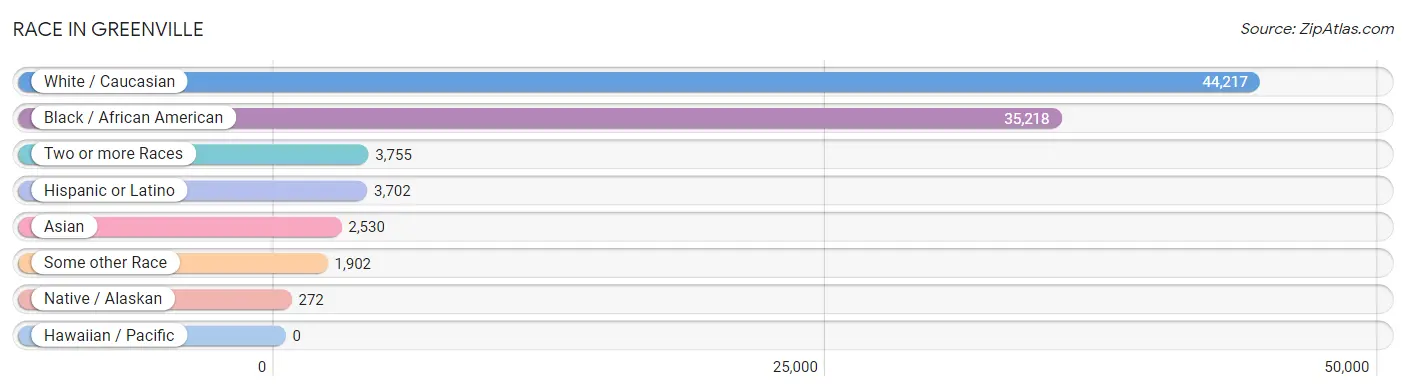
| Race | # Population | % Population |
| Asian | 2,530 | 2.9% |
| Black / African American | 35,218 | 40.1% |
| Hawaiian / Pacific | 0 | 0.0% |
| Hispanic or Latino | 3,702 | 4.2% |
| Native / Alaskan | 272 | 0.3% |
| White / Caucasian | 44,217 | 50.3% |
| Two or more Races | 3,755 | 4.3% |
| Some other Race | 1,902 | 2.2% |
| Total | 87,894 | 100.0% |
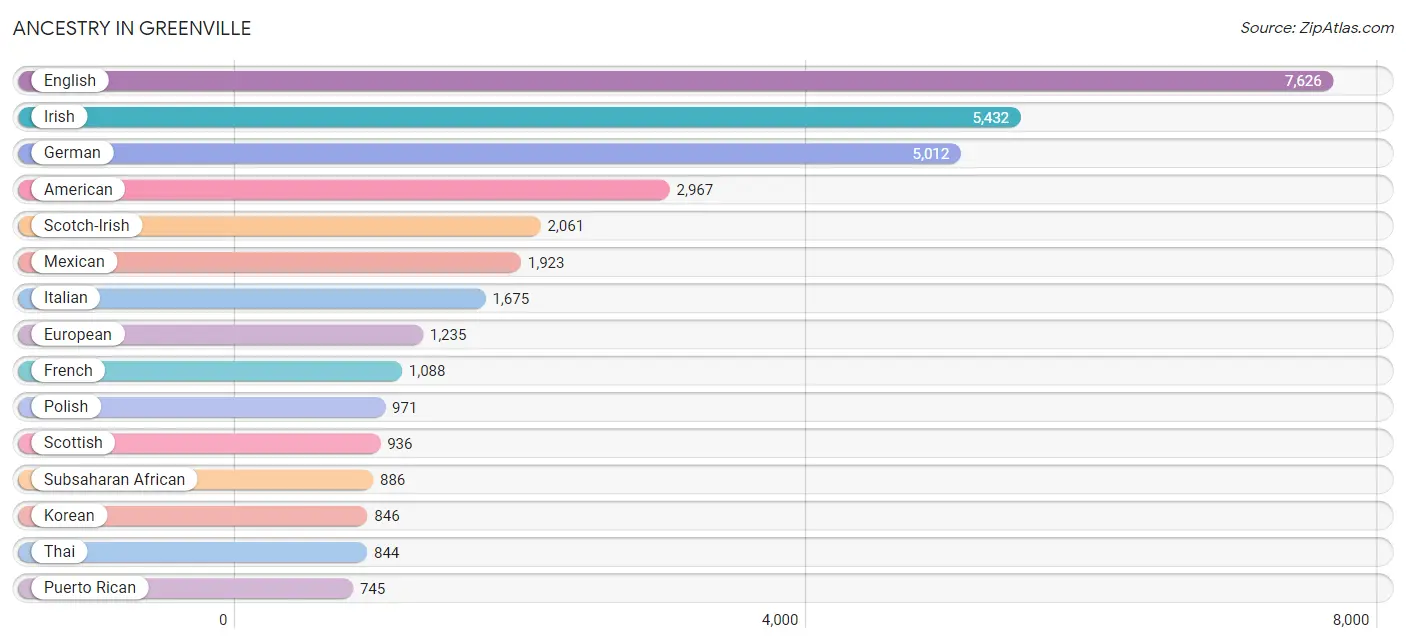
Ancestry in Greenville
The most populous ancestries reported in Greenville are English (7,626 | 8.7%), Irish (5,432 | 6.2%), German (5,012 | 5.7%), American (2,967 | 3.4%), and Scotch-Irish (2,061 | 2.3%), together accounting for 26.3% of all Greenville residents.
| Ancestry | # Population | % Population |
| African | 577 | 0.7% |
| Albanian | 18 | 0.0% |
| American | 2,967 | 3.4% |
| Arab | 455 | 0.5% |
| Armenian | 6 | 0.0% |
| Austrian | 82 | 0.1% |
| Bangladeshi | 67 | 0.1% |
| Barbadian | 13 | 0.0% |
| Basque | 6 | 0.0% |
| Belgian | 19 | 0.0% |
| Bhutanese | 497 | 0.6% |
| Brazilian | 70 | 0.1% |
| British | 354 | 0.4% |
| Burmese | 433 | 0.5% |
| Canadian | 150 | 0.2% |
| Central American | 143 | 0.2% |
| Central American Indian | 135 | 0.2% |
| Cherokee | 165 | 0.2% |
| Chilean | 45 | 0.1% |
| Colombian | 144 | 0.2% |
| Croatian | 3 | 0.0% |
| Cuban | 166 | 0.2% |
| Czech | 58 | 0.1% |
| Czechoslovakian | 15 | 0.0% |
| Danish | 78 | 0.1% |
| Dominican | 8 | 0.0% |
| Dutch | 252 | 0.3% |
| Eastern European | 368 | 0.4% |
| English | 7,626 | 8.7% |
| European | 1,235 | 1.4% |
| Finnish | 28 | 0.0% |
| French | 1,088 | 1.2% |
| French Canadian | 150 | 0.2% |
| German | 5,012 | 5.7% |
| Ghanaian | 10 | 0.0% |
| Greek | 173 | 0.2% |
| Guatemalan | 77 | 0.1% |
| Guyanese | 4 | 0.0% |
| Haitian | 124 | 0.1% |
| Honduran | 3 | 0.0% |
| Hungarian | 221 | 0.3% |
| Indian (Asian) | 562 | 0.6% |
| Indonesian | 43 | 0.1% |
| Iranian | 16 | 0.0% |
| Iraqi | 40 | 0.1% |
| Irish | 5,432 | 6.2% |
| Iroquois | 18 | 0.0% |
| Italian | 1,675 | 1.9% |
| Jamaican | 527 | 0.6% |
| Jordanian | 17 | 0.0% |
| Kenyan | 3 | 0.0% |
| Korean | 846 | 1.0% |
| Lebanese | 59 | 0.1% |
| Liberian | 84 | 0.1% |
| Lithuanian | 16 | 0.0% |
| Lumbee | 16 | 0.0% |
| Maltese | 14 | 0.0% |
| Mexican | 1,923 | 2.2% |
| Mexican American Indian | 19 | 0.0% |
| Native Hawaiian | 125 | 0.1% |
| New Zealander | 24 | 0.0% |
| Nigerian | 191 | 0.2% |
| Northern European | 60 | 0.1% |
| Norwegian | 227 | 0.3% |
| Pakistani | 42 | 0.1% |
| Palestinian | 192 | 0.2% |
| Peruvian | 73 | 0.1% |
| Polish | 971 | 1.1% |
| Portuguese | 75 | 0.1% |
| Potawatomi | 7 | 0.0% |
| Puerto Rican | 745 | 0.9% |
| Romanian | 92 | 0.1% |
| Russian | 214 | 0.2% |
| Salvadoran | 46 | 0.1% |
| Samoan | 153 | 0.2% |
| Scandinavian | 174 | 0.2% |
| Scotch-Irish | 2,061 | 2.3% |
| Scottish | 936 | 1.1% |
| Serbian | 8 | 0.0% |
| Slavic | 6 | 0.0% |
| Slovak | 91 | 0.1% |
| South American | 565 | 0.6% |
| Spaniard | 71 | 0.1% |
| Spanish | 32 | 0.0% |
| Sri Lankan | 105 | 0.1% |
| Subsaharan African | 886 | 1.0% |
| Sudanese | 29 | 0.0% |
| Swedish | 259 | 0.3% |
| Swiss | 60 | 0.1% |
| Syrian | 48 | 0.1% |
| Thai | 844 | 1.0% |
| Trinidadian and Tobagonian | 73 | 0.1% |
| Turkish | 20 | 0.0% |
| U.S. Virgin Islander | 56 | 0.1% |
| Ukrainian | 109 | 0.1% |
| Venezuelan | 296 | 0.3% |
| Welsh | 409 | 0.5% |
| West Indian | 165 | 0.2% |
| Yugoslavian | 32 | 0.0% | View All 99 Rows |
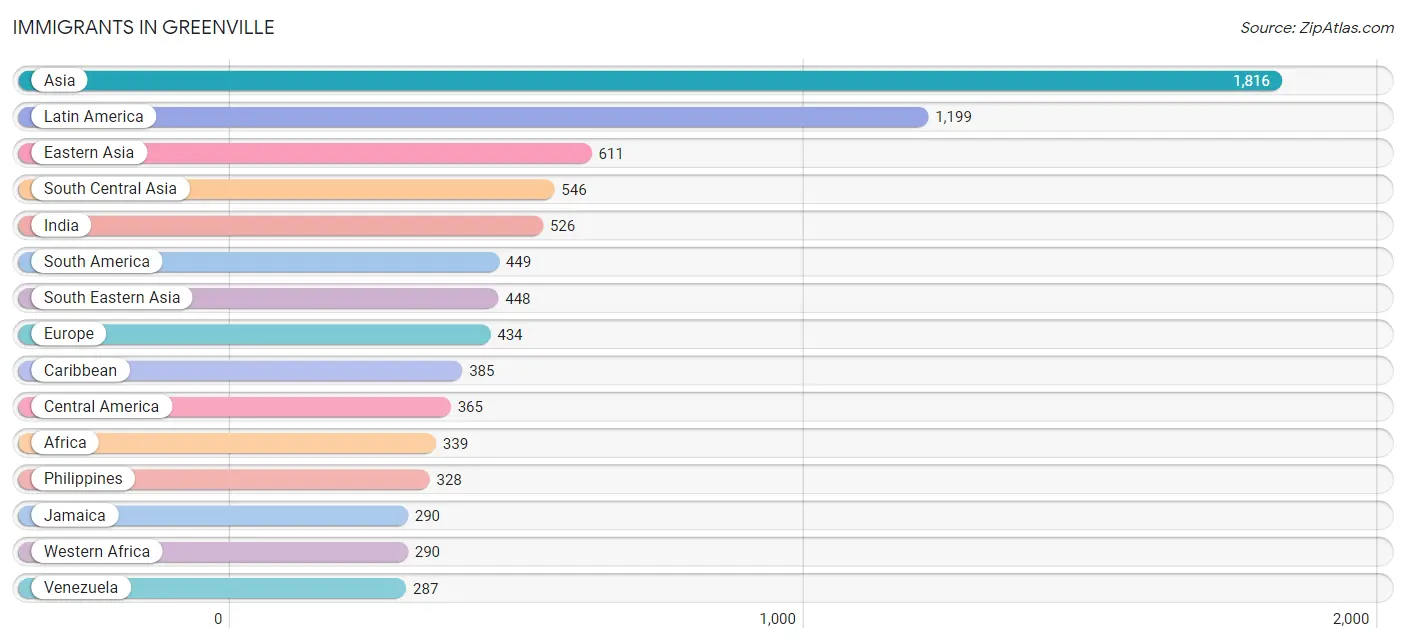
Immigrants in Greenville
The most numerous immigrant groups reported in Greenville came from Asia (1,816 | 2.1%), Latin America (1,199 | 1.4%), Eastern Asia (611 | 0.7%), South Central Asia (546 | 0.6%), and India (526 | 0.6%), together accounting for 5.3% of all Greenville residents.
| Immigration Origin | # Population | % Population |
| Africa | 339 | 0.4% |
| Albania | 18 | 0.0% |
| Asia | 1,816 | 2.1% |
| Australia | 20 | 0.0% |
| Belgium | 14 | 0.0% |
| Brazil | 29 | 0.0% |
| Bulgaria | 11 | 0.0% |
| Cameroon | 9 | 0.0% |
| Canada | 270 | 0.3% |
| Caribbean | 385 | 0.4% |
| Central America | 365 | 0.4% |
| Chile | 4 | 0.0% |
| China | 214 | 0.2% |
| Colombia | 67 | 0.1% |
| Cuba | 62 | 0.1% |
| Eastern Africa | 3 | 0.0% |
| Eastern Asia | 611 | 0.7% |
| Eastern Europe | 118 | 0.1% |
| England | 29 | 0.0% |
| Europe | 434 | 0.5% |
| France | 16 | 0.0% |
| Germany | 136 | 0.2% |
| Ghana | 74 | 0.1% |
| Guatemala | 58 | 0.1% |
| Haiti | 16 | 0.0% |
| Honduras | 42 | 0.1% |
| Hong Kong | 30 | 0.0% |
| India | 526 | 0.6% |
| Iran | 12 | 0.0% |
| Iraq | 87 | 0.1% |
| Ireland | 3 | 0.0% |
| Israel | 42 | 0.1% |
| Italy | 10 | 0.0% |
| Jamaica | 290 | 0.3% |
| Japan | 199 | 0.2% |
| Jordan | 17 | 0.0% |
| Kazakhstan | 8 | 0.0% |
| Kenya | 3 | 0.0% |
| Korea | 198 | 0.2% |
| Latin America | 1,199 | 1.4% |
| Liberia | 84 | 0.1% |
| Mexico | 265 | 0.3% |
| Middle Africa | 9 | 0.0% |
| Netherlands | 2 | 0.0% |
| Nigeria | 118 | 0.1% |
| Northern Europe | 138 | 0.2% |
| Oceania | 37 | 0.0% |
| Peru | 62 | 0.1% |
| Philippines | 328 | 0.4% |
| Poland | 9 | 0.0% |
| Russia | 34 | 0.0% |
| Saudi Arabia | 9 | 0.0% |
| South America | 449 | 0.5% |
| South Central Asia | 546 | 0.6% |
| South Eastern Asia | 448 | 0.5% |
| Southern Europe | 10 | 0.0% |
| Taiwan | 4 | 0.0% |
| Thailand | 25 | 0.0% |
| Turkey | 20 | 0.0% |
| Ukraine | 6 | 0.0% |
| Venezuela | 287 | 0.3% |
| Vietnam | 52 | 0.1% |
| Western Africa | 290 | 0.3% |
| Western Asia | 211 | 0.2% |
| Western Europe | 168 | 0.2% |
| Yemen | 27 | 0.0% | View All 66 Rows |
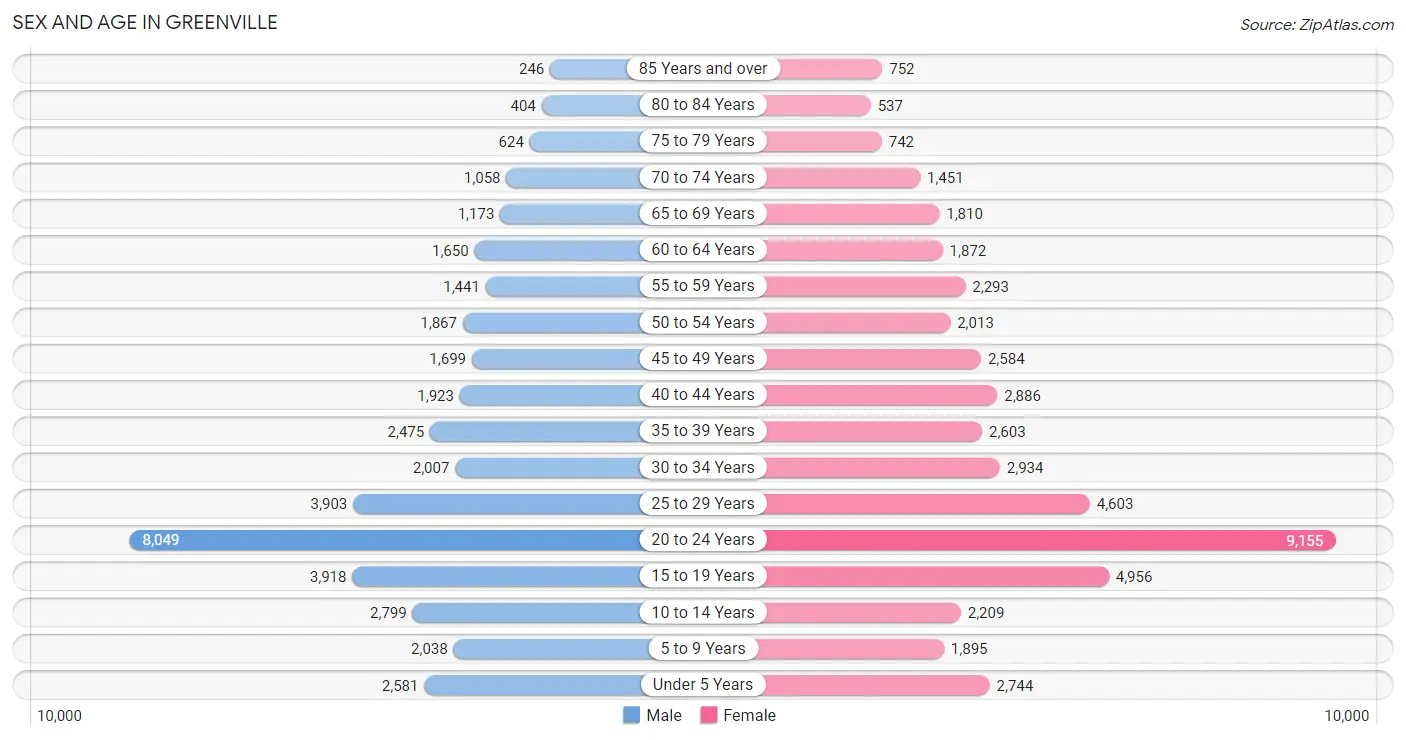
Sex and Age in Greenville
Sex and Age in Greenville
The most populous age groups in Greenville are 20 to 24 Years (8,049 | 20.2%) for men and 20 to 24 Years (9,155 | 19.1%) for women.
| Age Bracket | Male | Female |
| Under 5 Years | 2,581 (6.5%) | 2,744 (5.7%) |
| 5 to 9 Years | 2,038 (5.1%) | 1,895 (3.9%) |
| 10 to 14 Years | 2,799 (7.0%) | 2,209 (4.6%) |
| 15 to 19 Years | 3,918 (9.8%) | 4,956 (10.3%) |
| 20 to 24 Years | 8,049 (20.2%) | 9,155 (19.1%) |
| 25 to 29 Years | 3,903 (9.8%) | 4,603 (9.6%) |
| 30 to 34 Years | 2,007 (5.0%) | 2,934 (6.1%) |
| 35 to 39 Years | 2,475 (6.2%) | 2,603 (5.4%) |
| 40 to 44 Years | 1,923 (4.8%) | 2,886 (6.0%) |
| 45 to 49 Years | 1,699 (4.3%) | 2,584 (5.4%) |
| 50 to 54 Years | 1,867 (4.7%) | 2,013 (4.2%) |
| 55 to 59 Years | 1,441 (3.6%) | 2,293 (4.8%) |
| 60 to 64 Years | 1,650 (4.1%) | 1,872 (3.9%) |
| 65 to 69 Years | 1,173 (2.9%) | 1,810 (3.8%) |
| 70 to 74 Years | 1,058 (2.6%) | 1,451 (3.0%) |
| 75 to 79 Years | 624 (1.6%) | 742 (1.5%) |
| 80 to 84 Years | 404 (1.0%) | 537 (1.1%) |
| 85 Years and over | 246 (0.6%) | 752 (1.6%) |
| Total | 39,855 (100.0%) | 48,039 (100.0%) |
Families and Households in Greenville
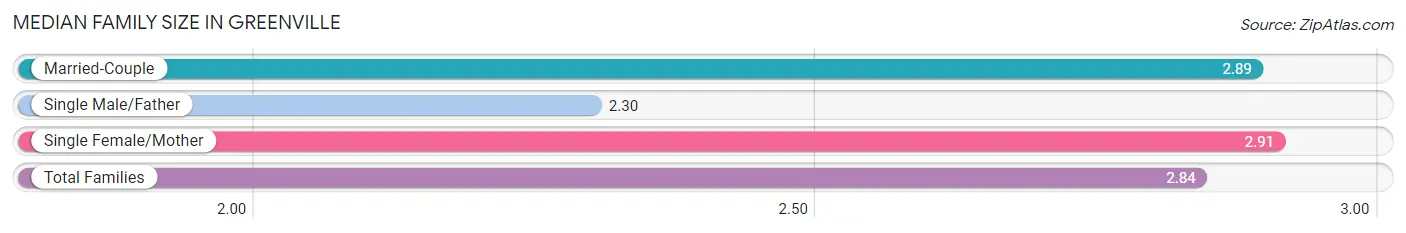
Median Family Size in Greenville
The median family size in Greenville is 2.84 persons per family, with single female/mother families (6,027 | 34.7%) accounting for the largest median family size of 2.91 persons per family. On the other hand, single male/father families (1,623 | 9.3%) represent the smallest median family size with 2.30 persons per family.
| Family Type | # Families | Family Size |
| Married-Couple | 9,727 (56.0%) | 2.89 |
| Single Male/Father | 1,623 (9.3%) | 2.30 |
| Single Female/Mother | 6,027 (34.7%) | 2.91 |
| Total Families | 17,377 (100.0%) | 2.84 |
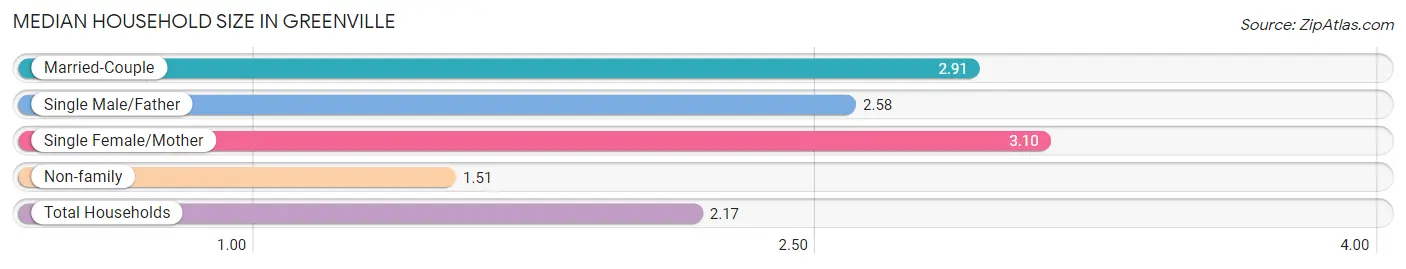
Median Household Size in Greenville
The median household size in Greenville is 2.17 persons per household, with single female/mother households (6,027 | 15.9%) accounting for the largest median household size of 3.1 persons per household. non-family households (20,524 | 54.1%) represent the smallest median household size with 1.51 persons per household.
| Household Type | # Households | Household Size |
| Married-Couple | 9,727 (25.7%) | 2.91 |
| Single Male/Father | 1,623 (4.3%) | 2.58 |
| Single Female/Mother | 6,027 (15.9%) | 3.10 |
| Non-family | 20,524 (54.1%) | 1.51 |
| Total Households | 37,901 (100.0%) | 2.17 |
Household Size by Marriage Status in Greenville
Out of a total of 37,901 households in Greenville, 17,377 (45.9%) are family households, while 20,524 (54.1%) are nonfamily households. The most numerous type of family households are 2-person households, comprising 8,228, and the most common type of nonfamily households are 1-person households, comprising 13,447.
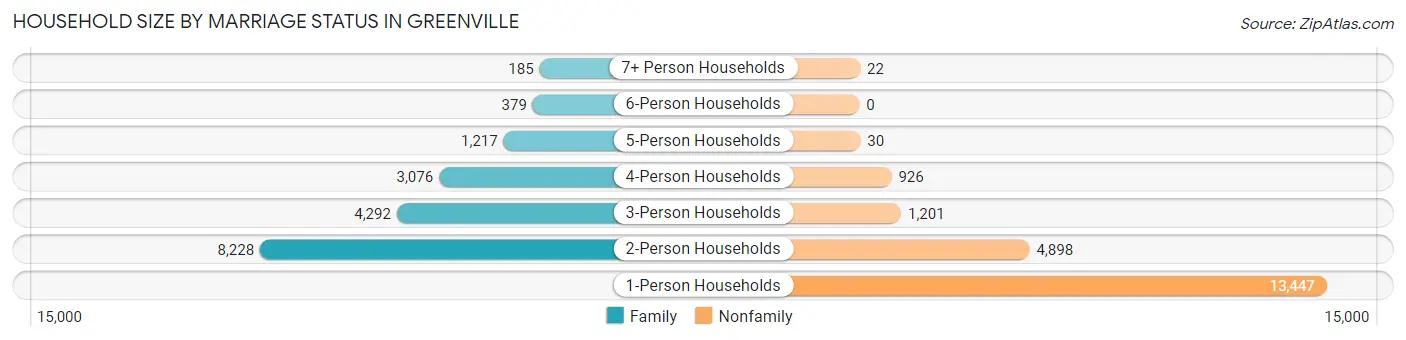
| Household Size | Family Households | Nonfamily Households |
| 1-Person Households | - | 13,447 (35.5%) |
| 2-Person Households | 8,228 (21.7%) | 4,898 (12.9%) |
| 3-Person Households | 4,292 (11.3%) | 1,201 (3.2%) |
| 4-Person Households | 3,076 (8.1%) | 926 (2.4%) |
| 5-Person Households | 1,217 (3.2%) | 30 (0.1%) |
| 6-Person Households | 379 (1.0%) | 0 (0.0%) |
| 7+ Person Households | 185 (0.5%) | 22 (0.1%) |
| Total | 17,377 (45.9%) | 20,524 (54.1%) |
Female Fertility in Greenville
Fertility by Age in Greenville
Average fertility rate in Greenville is 25.0 births per 1,000 women. Women in the age bracket of 20 to 34 years have the highest fertility rate with 32.0 births per 1,000 women. Women in the age bracket of 20 to 34 years acount for 71.7% of all women with births.
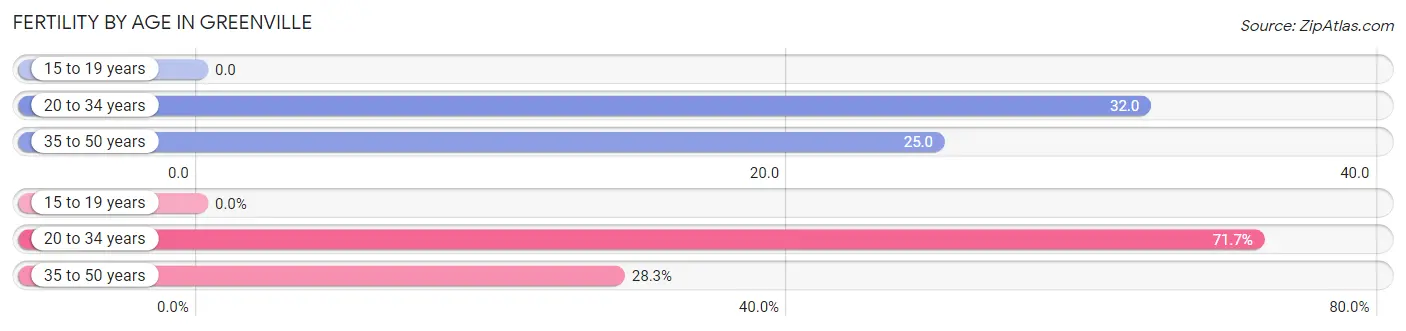
| Age Bracket | Women with Births | Births / 1,000 Women |
| 15 to 19 years | 0 (0.0%) | 0.0 |
| 20 to 34 years | 540 (71.7%) | 32.0 |
| 35 to 50 years | 213 (28.3%) | 25.0 |
| Total | 753 (100.0%) | 25.0 |
Fertility by Age by Marriage Status in Greenville
57.6% of women with births (753) in Greenville are married. The highest percentage of unmarried women with births falls into 20 to 34 years age bracket with 59.1% of them unmarried at the time of birth, while the lowest percentage of unmarried women with births belong to 35 to 50 years age bracket with 0.0% of them unmarried.
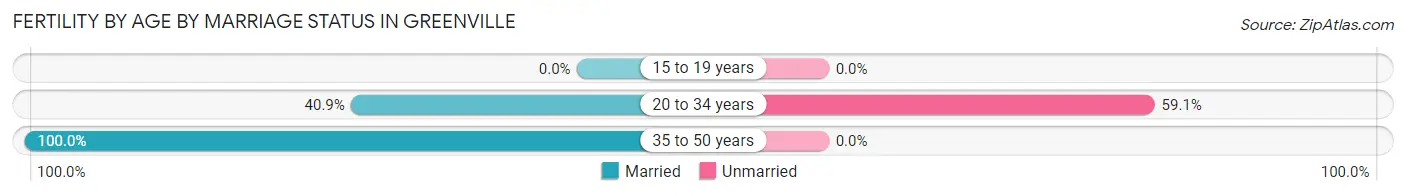
| Age Bracket | Married | Unmarried |
| 15 to 19 years | 0 (0.0%) | 0 (0.0%) |
| 20 to 34 years | 221 (40.9%) | 319 (59.1%) |
| 35 to 50 years | 213 (100.0%) | 0 (0.0%) |
| Total | 434 (57.6%) | 319 (42.4%) |
Fertility by Education in Greenville
Average fertility rate in Greenville is 25.0 births per 1,000 women. Women with the education attainment of graduate degree have the highest fertility rate of 46.0 births per 1,000 women, while women with the education attainment of less than high school have the lowest fertility at 2.0 births per 1,000 women. Women with the education attainment of college or associate's degree represent 32.5% of all women with births.
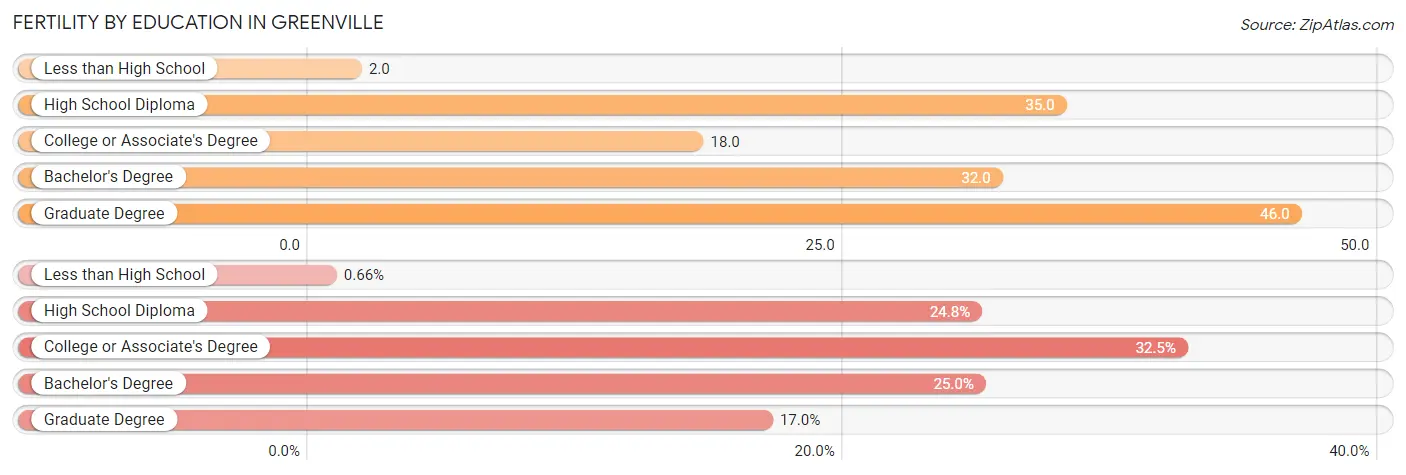
| Educational Attainment | Women with Births | Births / 1,000 Women |
| Less than High School | 5 (0.7%) | 2.0 |
| High School Diploma | 187 (24.8%) | 35.0 |
| College or Associate's Degree | 245 (32.5%) | 18.0 |
| Bachelor's Degree | 188 (25.0%) | 32.0 |
| Graduate Degree | 128 (17.0%) | 46.0 |
| Total | 753 (100.0%) | 25.0 |
Fertility by Education by Marriage Status in Greenville
42.4% of women with births in Greenville are unmarried. Women with the educational attainment of less than high school are most likely to be married with 100.0% of them married at childbirth, while women with the educational attainment of high school diploma are least likely to be married with 88.2% of them unmarried at childbirth.
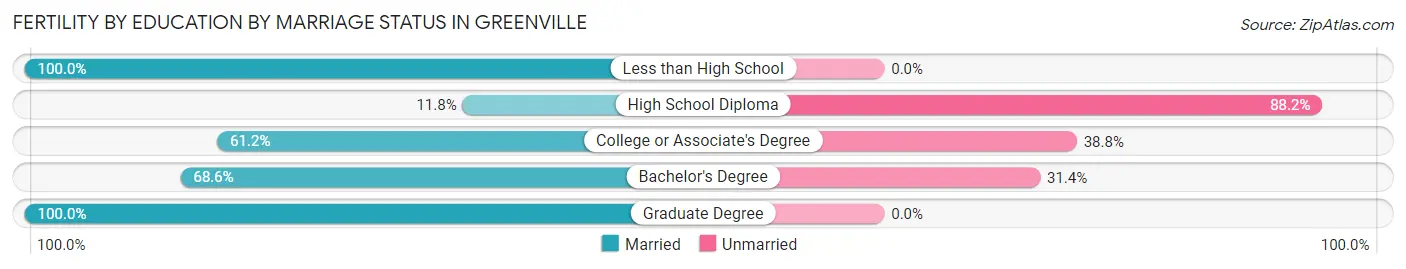
| Educational Attainment | Married | Unmarried |
| Less than High School | 5 (100.0%) | 0 (0.0%) |
| High School Diploma | 22 (11.8%) | 165 (88.2%) |
| College or Associate's Degree | 150 (61.2%) | 95 (38.8%) |
| Bachelor's Degree | 129 (68.6%) | 59 (31.4%) |
| Graduate Degree | 128 (100.0%) | 0 (0.0%) |
| Total | 434 (57.6%) | 319 (42.4%) |
Employment Characteristics in Greenville
Employment by Class of Employer in Greenville
Among the 42,488 employed individuals in Greenville, private company employees (27,074 | 63.7%), state government employees (4,710 | 11.1%), and not-for-profit organizations (4,463 | 10.5%) make up the most common classes of employment.
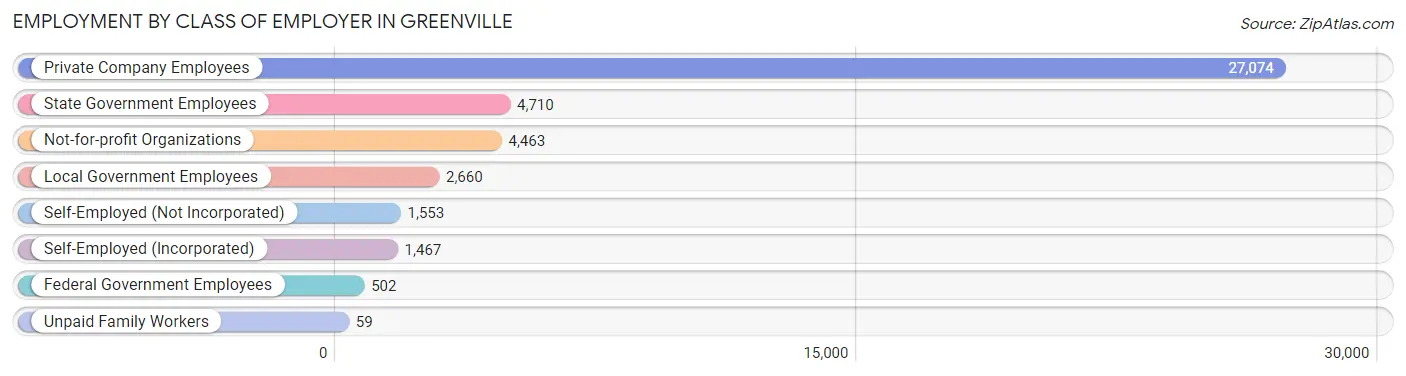
| Employer Class | # Employees | % Employees |
| Private Company Employees | 27,074 | 63.7% |
| Self-Employed (Incorporated) | 1,467 | 3.5% |
| Self-Employed (Not Incorporated) | 1,553 | 3.7% |
| Not-for-profit Organizations | 4,463 | 10.5% |
| Local Government Employees | 2,660 | 6.3% |
| State Government Employees | 4,710 | 11.1% |
| Federal Government Employees | 502 | 1.2% |
| Unpaid Family Workers | 59 | 0.1% |
| Total | 42,488 | 100.0% |
Employment Status by Age in Greenville
According to the labor force statistics for Greenville, out of the total population over 16 years of age (72,745), 64.5% or 46,921 individuals are in the labor force, with 8.7% or 4,082 of them unemployed. The age group with the highest labor force participation rate is 25 to 29 years, with 86.3% or 7,341 individuals in the labor force. Within the labor force, the 16 to 19 years age range has the highest percentage of unemployed individuals, with 16.7% or 262 of them being unemployed.
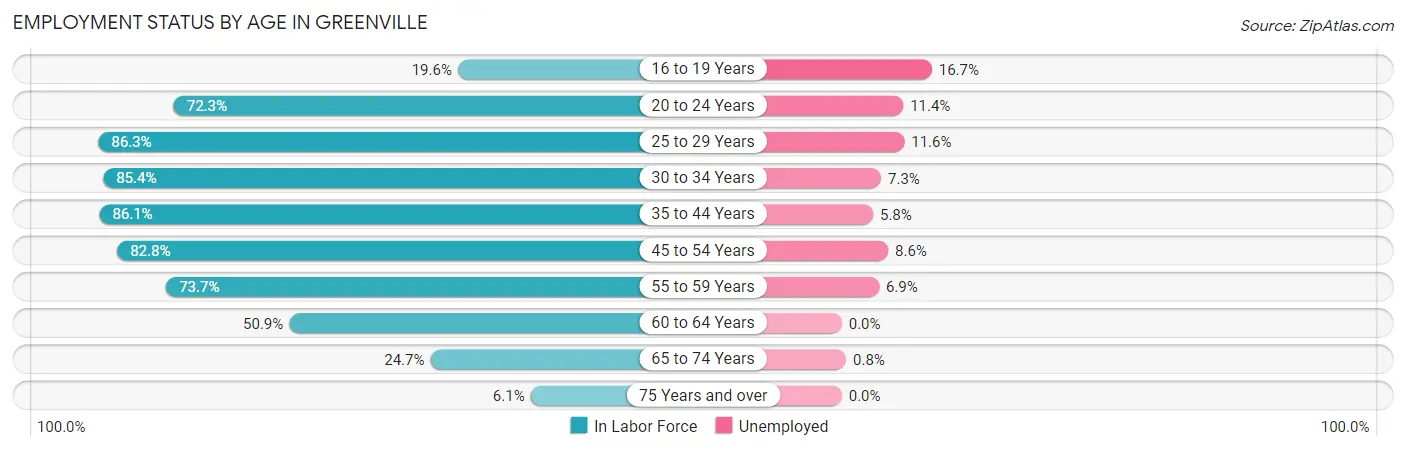
| Age Bracket | In Labor Force | Unemployed |
| 16 to 19 Years | 1,566 (19.6%) | 262 (16.7%) |
| 20 to 24 Years | 12,438 (72.3%) | 1,418 (11.4%) |
| 25 to 29 Years | 7,341 (86.3%) | 852 (11.6%) |
| 30 to 34 Years | 4,220 (85.4%) | 308 (7.3%) |
| 35 to 44 Years | 8,513 (86.1%) | 494 (5.8%) |
| 45 to 54 Years | 6,759 (82.8%) | 581 (8.6%) |
| 55 to 59 Years | 2,752 (73.7%) | 190 (6.9%) |
| 60 to 64 Years | 1,793 (50.9%) | 0 (0.0%) |
| 65 to 74 Years | 1,357 (24.7%) | 11 (0.8%) |
| 75 Years and over | 202 (6.1%) | 0 (0.0%) |
| Total | 46,921 (64.5%) | 4,082 (8.7%) |
Employment Status by Educational Attainment in Greenville
According to labor force statistics for Greenville, 81.0% of individuals (31,390) out of the total population between 25 and 64 years of age (38,753) are in the labor force, with 7.7% or 2,417 of them being unemployed. The group with the highest labor force participation rate are those with the educational attainment of bachelor's degree or higher, with 87.7% or 13,673 individuals in the labor force. Within the labor force, individuals with high school diploma education have the highest percentage of unemployment, with 15.0% or 947 of them being unemployed.
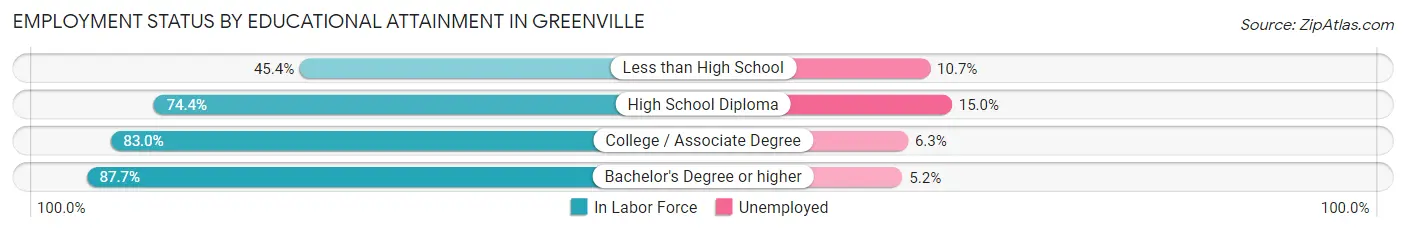
| Educational Attainment | In Labor Force | Unemployed |
| Less than High School | 962 (45.4%) | 227 (10.7%) |
| High School Diploma | 6,312 (74.4%) | 1,273 (15.0%) |
| College / Associate Degree | 10,425 (83.0%) | 791 (6.3%) |
| Bachelor's Degree or higher | 13,673 (87.7%) | 811 (5.2%) |
| Total | 31,390 (81.0%) | 2,984 (7.7%) |
Employment Occupations by Sex in Greenville
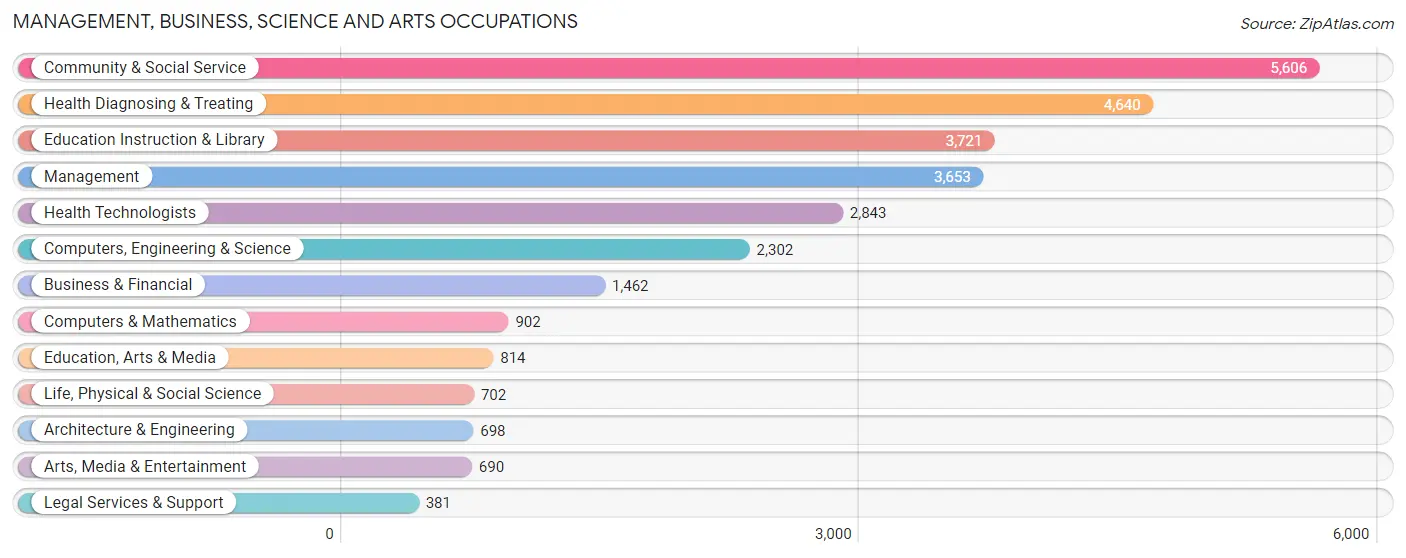
Management, Business, Science and Arts Occupations
The most common Management, Business, Science and Arts occupations in Greenville are Community & Social Service (5,606 | 13.2%), Health Diagnosing & Treating (4,640 | 10.9%), Education Instruction & Library (3,721 | 8.7%), Management (3,653 | 8.6%), and Health Technologists (2,843 | 6.7%).
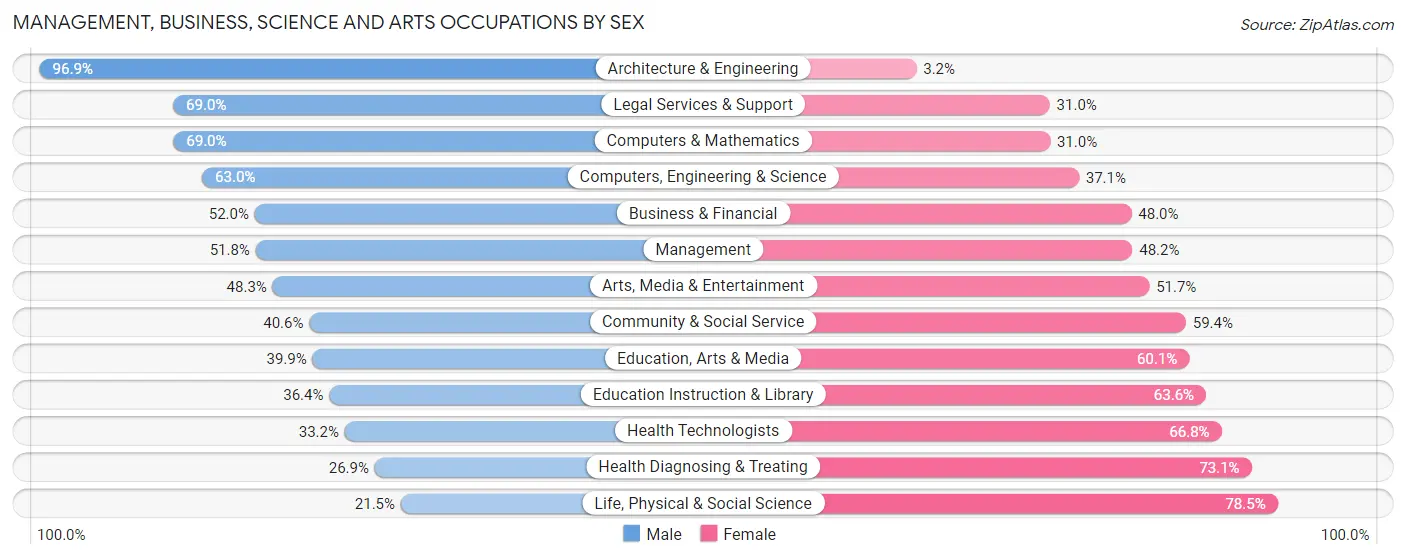
Management, Business, Science and Arts Occupations by Sex
Within the Management, Business, Science and Arts occupations in Greenville, the most male-oriented occupations are Architecture & Engineering (96.9%), Legal Services & Support (69.0%), and Computers & Mathematics (69.0%), while the most female-oriented occupations are Life, Physical & Social Science (78.5%), Health Diagnosing & Treating (73.1%), and Health Technologists (66.8%).
| Occupation | Male | Female |
| Management | 1,892 (51.8%) | 1,761 (48.2%) |
| Business & Financial | 760 (52.0%) | 702 (48.0%) |
| Computers, Engineering & Science | 1,449 (62.9%) | 853 (37.0%) |
| Computers & Mathematics | 622 (69.0%) | 280 (31.0%) |
| Architecture & Engineering | 676 (96.9%) | 22 (3.2%) |
| Life, Physical & Social Science | 151 (21.5%) | 551 (78.5%) |
| Community & Social Service | 2,277 (40.6%) | 3,329 (59.4%) |
| Education, Arts & Media | 325 (39.9%) | 489 (60.1%) |
| Legal Services & Support | 263 (69.0%) | 118 (31.0%) |
| Education Instruction & Library | 1,356 (36.4%) | 2,365 (63.6%) |
| Arts, Media & Entertainment | 333 (48.3%) | 357 (51.7%) |
| Health Diagnosing & Treating | 1,250 (26.9%) | 3,390 (73.1%) |
| Health Technologists | 944 (33.2%) | 1,899 (66.8%) |
| Total (Category) | 7,628 (43.2%) | 10,035 (56.8%) |
| Total (Overall) | 19,991 (46.9%) | 22,628 (53.1%) |
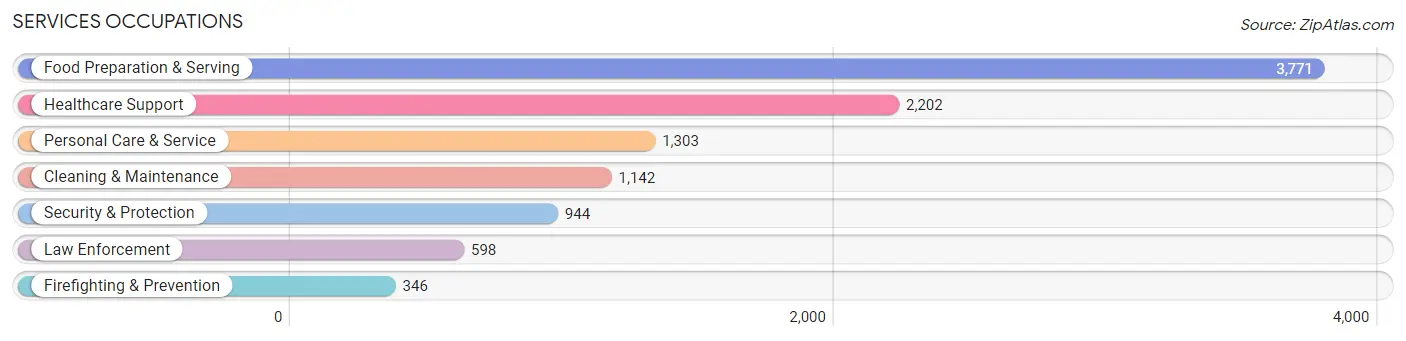
Services Occupations
The most common Services occupations in Greenville are Food Preparation & Serving (3,771 | 8.8%), Healthcare Support (2,202 | 5.2%), Personal Care & Service (1,303 | 3.1%), Cleaning & Maintenance (1,142 | 2.7%), and Security & Protection (944 | 2.2%).
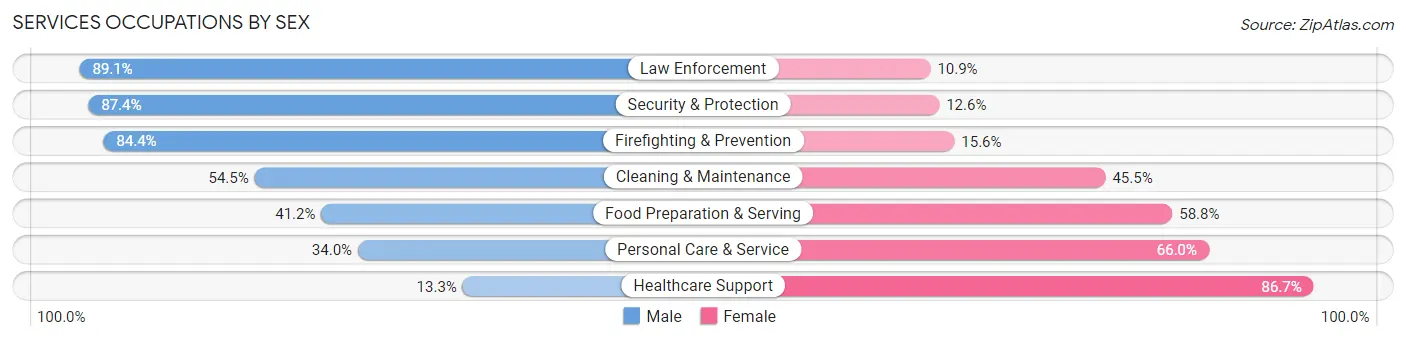
Services Occupations by Sex
Within the Services occupations in Greenville, the most male-oriented occupations are Law Enforcement (89.1%), Security & Protection (87.4%), and Firefighting & Prevention (84.4%), while the most female-oriented occupations are Healthcare Support (86.7%), Personal Care & Service (66.0%), and Food Preparation & Serving (58.8%).
| Occupation | Male | Female |
| Healthcare Support | 292 (13.3%) | 1,910 (86.7%) |
| Security & Protection | 825 (87.4%) | 119 (12.6%) |
| Firefighting & Prevention | 292 (84.4%) | 54 (15.6%) |
| Law Enforcement | 533 (89.1%) | 65 (10.9%) |
| Food Preparation & Serving | 1,555 (41.2%) | 2,216 (58.8%) |
| Cleaning & Maintenance | 622 (54.5%) | 520 (45.5%) |
| Personal Care & Service | 443 (34.0%) | 860 (66.0%) |
| Total (Category) | 3,737 (39.9%) | 5,625 (60.1%) |
| Total (Overall) | 19,991 (46.9%) | 22,628 (53.1%) |
Sales and Office Occupations
The most common Sales and Office occupations in Greenville are Sales & Related (4,725 | 11.1%), and Office & Administration (4,346 | 10.2%).

Sales and Office Occupations by Sex
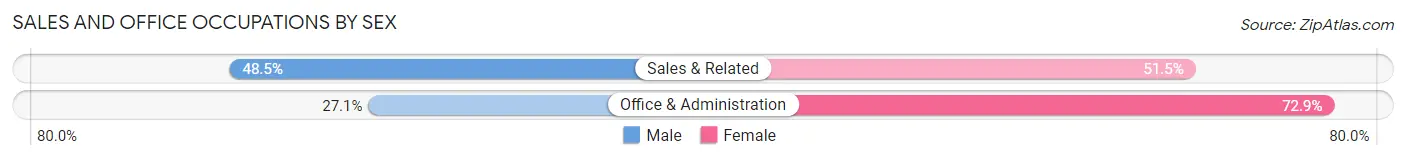
| Occupation | Male | Female |
| Sales & Related | 2,290 (48.5%) | 2,435 (51.5%) |
| Office & Administration | 1,179 (27.1%) | 3,167 (72.9%) |
| Total (Category) | 3,469 (38.2%) | 5,602 (61.8%) |
| Total (Overall) | 19,991 (46.9%) | 22,628 (53.1%) |
Natural Resources, Construction and Maintenance Occupations
The most common Natural Resources, Construction and Maintenance occupations in Greenville are Installation, Maintenance & Repair (810 | 1.9%), Construction & Extraction (514 | 1.2%), and Farming, Fishing & Forestry (98 | 0.2%).

Natural Resources, Construction and Maintenance Occupations by Sex
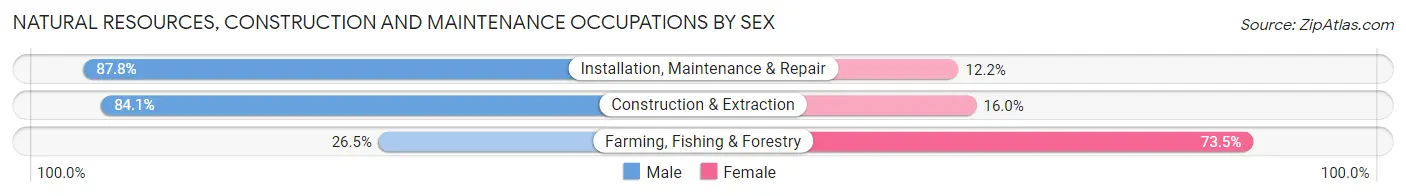
| Occupation | Male | Female |
| Farming, Fishing & Forestry | 26 (26.5%) | 72 (73.5%) |
| Construction & Extraction | 432 (84.1%) | 82 (16.0%) |
| Installation, Maintenance & Repair | 711 (87.8%) | 99 (12.2%) |
| Total (Category) | 1,169 (82.2%) | 253 (17.8%) |
| Total (Overall) | 19,991 (46.9%) | 22,628 (53.1%) |
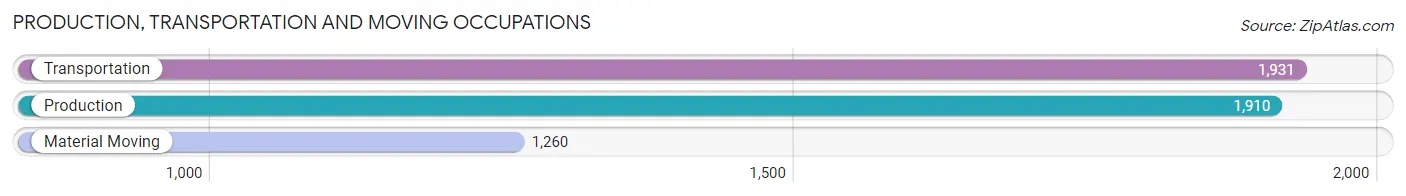
Production, Transportation and Moving Occupations
The most common Production, Transportation and Moving occupations in Greenville are Transportation (1,931 | 4.5%), Production (1,910 | 4.5%), and Material Moving (1,260 | 3.0%).
Production, Transportation and Moving Occupations by Sex
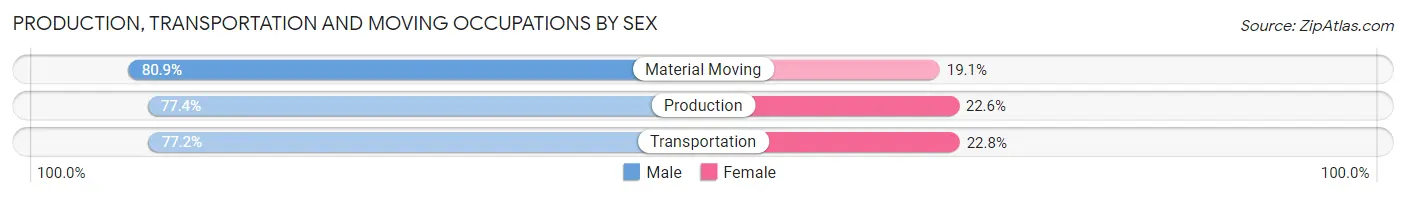
| Occupation | Male | Female |
| Production | 1,478 (77.4%) | 432 (22.6%) |
| Transportation | 1,491 (77.2%) | 440 (22.8%) |
| Material Moving | 1,019 (80.9%) | 241 (19.1%) |
| Total (Category) | 3,988 (78.2%) | 1,113 (21.8%) |
| Total (Overall) | 19,991 (46.9%) | 22,628 (53.1%) |
Employment Industries by Sex in Greenville
Employment Industries in Greenville
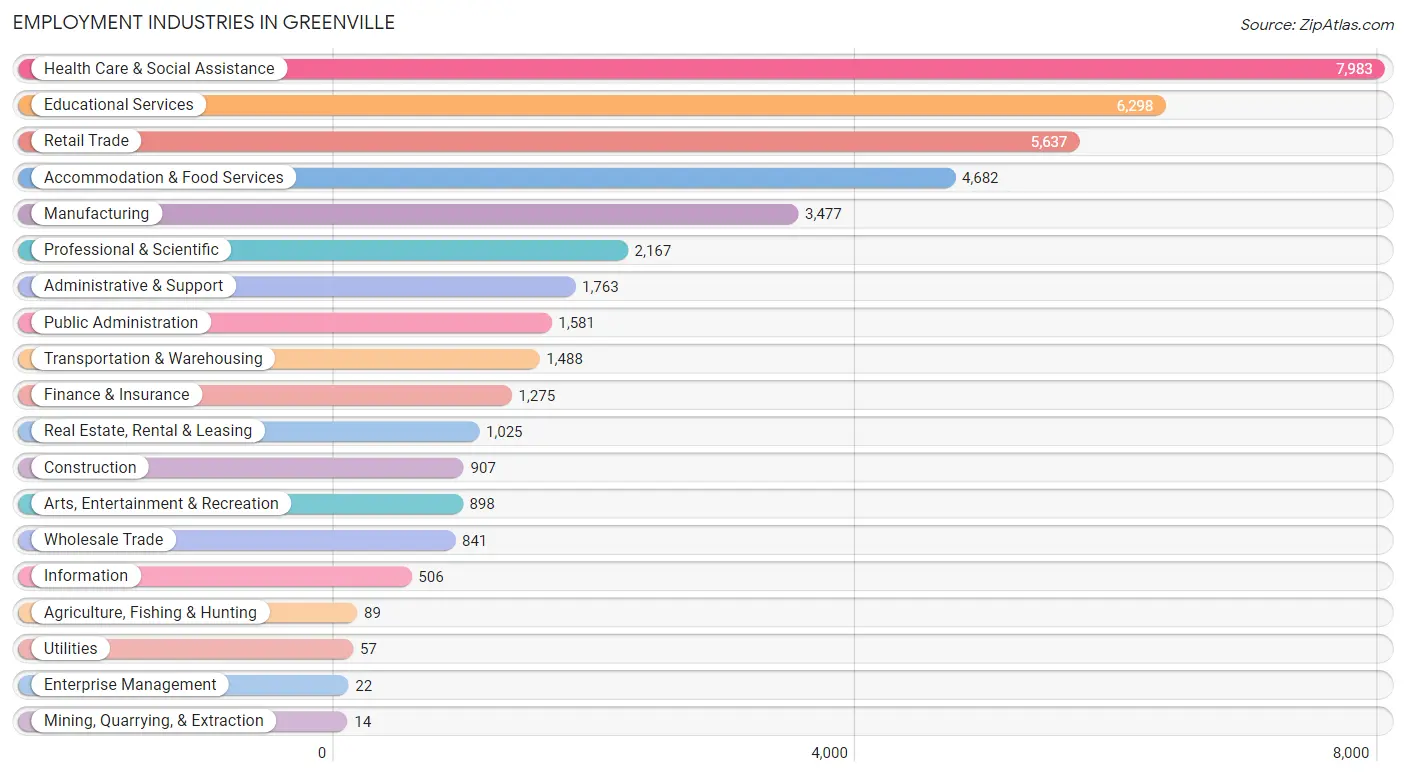
The major employment industries in Greenville include Health Care & Social Assistance (7,983 | 18.7%), Educational Services (6,298 | 14.8%), Retail Trade (5,637 | 13.2%), Accommodation & Food Services (4,682 | 11.0%), and Manufacturing (3,477 | 8.2%).
Employment Industries by Sex in Greenville
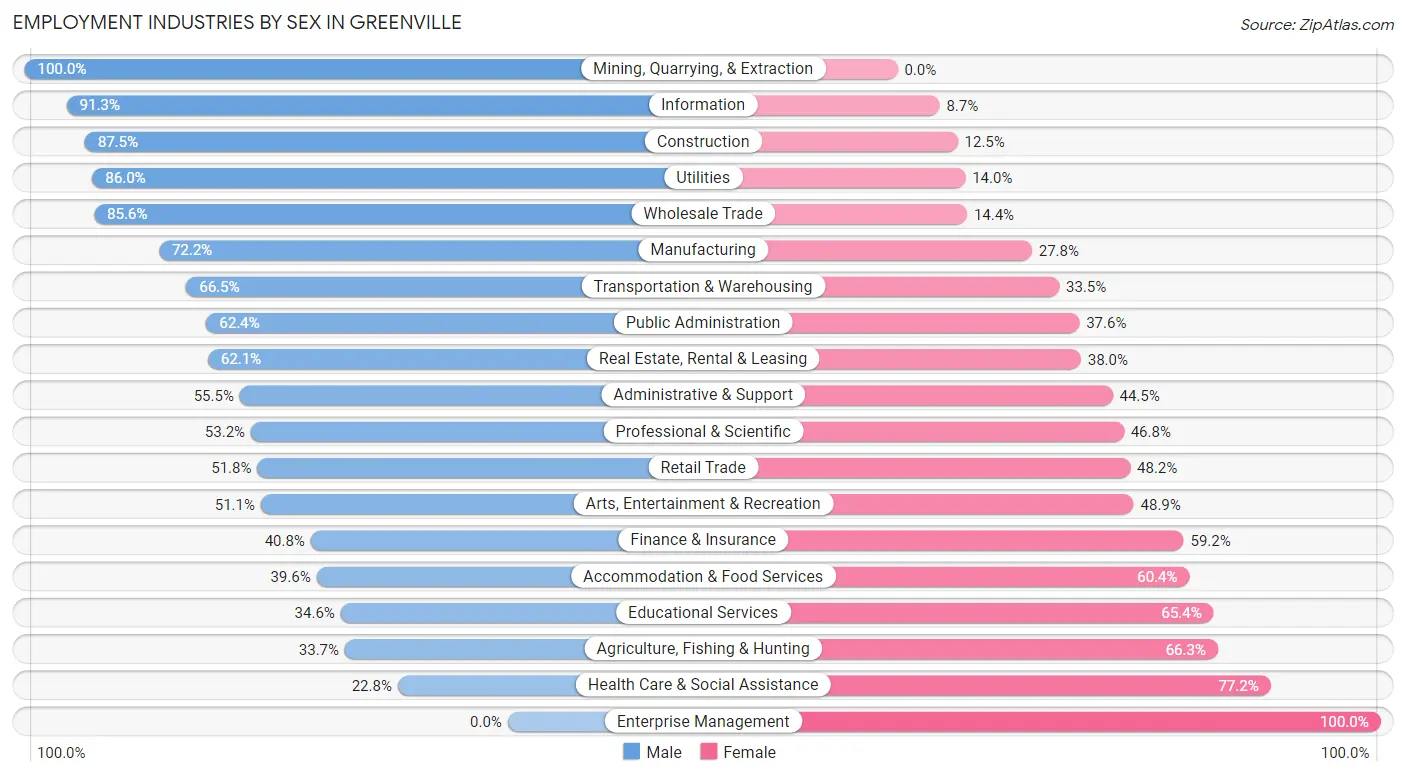
The Greenville industries that see more men than women are Mining, Quarrying, & Extraction (100.0%), Information (91.3%), and Construction (87.5%), whereas the industries that tend to have a higher number of women are Enterprise Management (100.0%), Health Care & Social Assistance (77.2%), and Agriculture, Fishing & Hunting (66.3%).
| Industry | Male | Female |
| Agriculture, Fishing & Hunting | 30 (33.7%) | 59 (66.3%) |
| Mining, Quarrying, & Extraction | 14 (100.0%) | 0 (0.0%) |
| Construction | 794 (87.5%) | 113 (12.5%) |
| Manufacturing | 2,510 (72.2%) | 967 (27.8%) |
| Wholesale Trade | 720 (85.6%) | 121 (14.4%) |
| Retail Trade | 2,922 (51.8%) | 2,715 (48.2%) |
| Transportation & Warehousing | 990 (66.5%) | 498 (33.5%) |
| Utilities | 49 (86.0%) | 8 (14.0%) |
| Information | 462 (91.3%) | 44 (8.7%) |
| Finance & Insurance | 520 (40.8%) | 755 (59.2%) |
| Real Estate, Rental & Leasing | 636 (62.1%) | 389 (38.0%) |
| Professional & Scientific | 1,152 (53.2%) | 1,015 (46.8%) |
| Enterprise Management | 0 (0.0%) | 22 (100.0%) |
| Administrative & Support | 978 (55.5%) | 785 (44.5%) |
| Educational Services | 2,178 (34.6%) | 4,120 (65.4%) |
| Health Care & Social Assistance | 1,818 (22.8%) | 6,165 (77.2%) |
| Arts, Entertainment & Recreation | 459 (51.1%) | 439 (48.9%) |
| Accommodation & Food Services | 1,853 (39.6%) | 2,829 (60.4%) |
| Public Administration | 986 (62.4%) | 595 (37.6%) |
| Total | 19,991 (46.9%) | 22,628 (53.1%) |
Education in Greenville
School Enrollment in Greenville
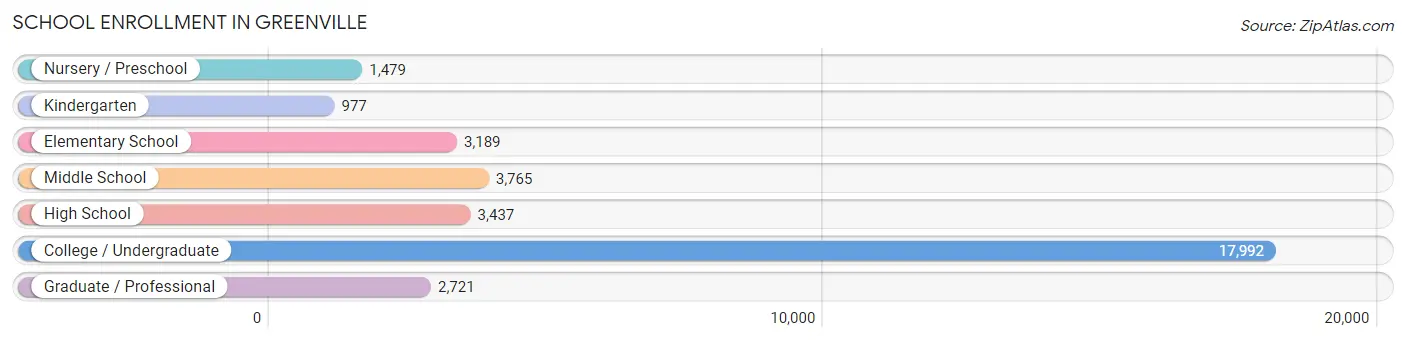
The most common levels of schooling among the 33,560 students in Greenville are college / undergraduate (17,992 | 53.6%), middle school (3,765 | 11.2%), and high school (3,437 | 10.2%).
| School Level | # Students | % Students |
| Nursery / Preschool | 1,479 | 4.4% |
| Kindergarten | 977 | 2.9% |
| Elementary School | 3,189 | 9.5% |
| Middle School | 3,765 | 11.2% |
| High School | 3,437 | 10.2% |
| College / Undergraduate | 17,992 | 53.6% |
| Graduate / Professional | 2,721 | 8.1% |
| Total | 33,560 | 100.0% |
School Enrollment by Age by Funding Source in Greenville
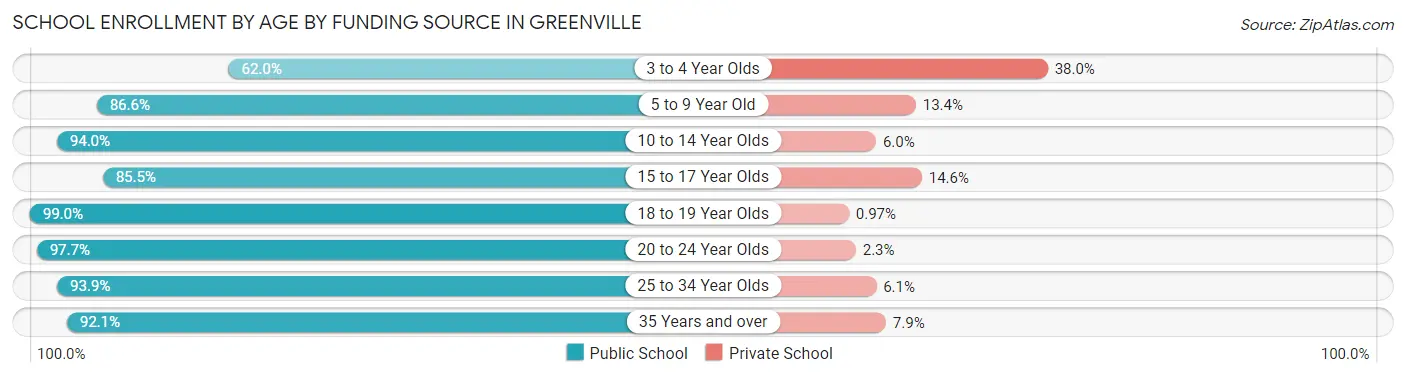
Out of a total of 33,560 students who are enrolled in schools in Greenville, 2,215 (6.6%) attend a private institution, while the remaining 31,345 (93.4%) are enrolled in public schools. The age group of 3 to 4 year olds has the highest likelihood of being enrolled in private schools, with 467 (38.0% in the age bracket) enrolled. Conversely, the age group of 18 to 19 year olds has the lowest likelihood of being enrolled in a private school, with 5,906 (99.0% in the age bracket) attending a public institution.
| Age Bracket | Public School | Private School |
| 3 to 4 Year Olds | 762 (62.0%) | 467 (38.0%) |
| 5 to 9 Year Old | 3,240 (86.6%) | 503 (13.4%) |
| 10 to 14 Year Olds | 4,648 (94.0%) | 297 (6.0%) |
| 15 to 17 Year Olds | 2,079 (85.5%) | 354 (14.5%) |
| 18 to 19 Year Olds | 5,906 (99.0%) | 58 (1.0%) |
| 20 to 24 Year Olds | 10,757 (97.7%) | 249 (2.3%) |
| 25 to 34 Year Olds | 2,574 (93.9%) | 166 (6.1%) |
| 35 Years and over | 1,382 (92.1%) | 118 (7.9%) |
| Total | 31,345 (93.4%) | 2,215 (6.6%) |
Educational Attainment by Field of Study in Greenville
Business (3,258 | 16.2%), science & technology (3,209 | 16.0%), education (2,079 | 10.4%), bio, nature & agricultural (1,931 | 9.6%), and arts & humanities (1,802 | 9.0%) are the most common fields of study among 20,070 individuals in Greenville who have obtained a bachelor's degree or higher.
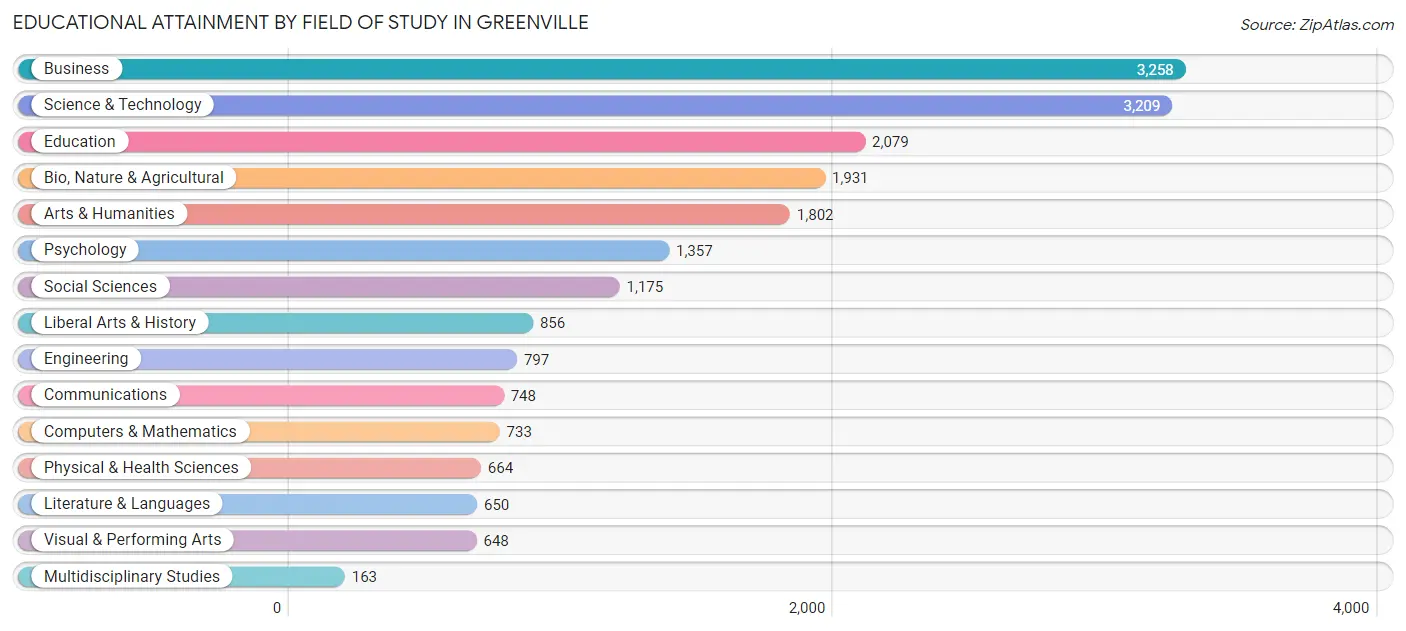
| Field of Study | # Graduates | % Graduates |
| Computers & Mathematics | 733 | 3.6% |
| Bio, Nature & Agricultural | 1,931 | 9.6% |
| Physical & Health Sciences | 664 | 3.3% |
| Psychology | 1,357 | 6.8% |
| Social Sciences | 1,175 | 5.9% |
| Engineering | 797 | 4.0% |
| Multidisciplinary Studies | 163 | 0.8% |
| Science & Technology | 3,209 | 16.0% |
| Business | 3,258 | 16.2% |
| Education | 2,079 | 10.4% |
| Literature & Languages | 650 | 3.2% |
| Liberal Arts & History | 856 | 4.3% |
| Visual & Performing Arts | 648 | 3.2% |
| Communications | 748 | 3.7% |
| Arts & Humanities | 1,802 | 9.0% |
| Total | 20,070 | 100.0% |
Transportation & Commute in Greenville
Vehicle Availability by Sex in Greenville
The most prevalent vehicle ownership categories in Greenville are males with 2 vehicles (8,638, accounting for 43.3%) and females with 2 vehicles (8,862, making up 38.4%).
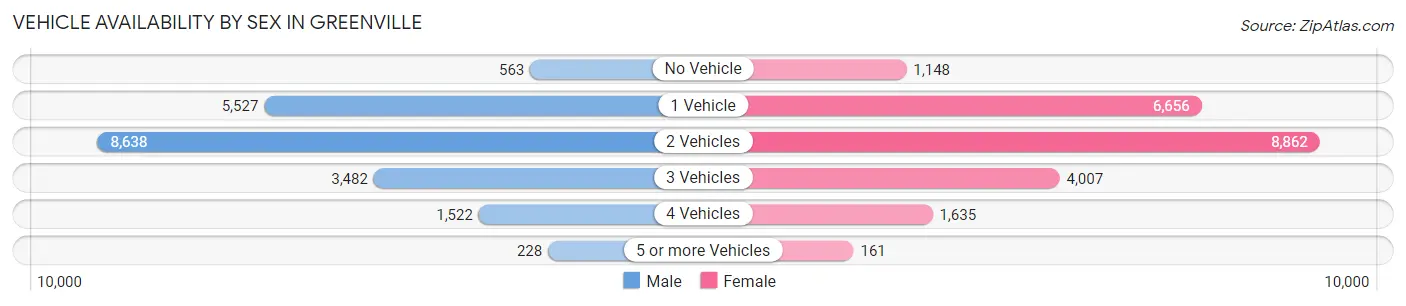
| Vehicles Available | Male | Female |
| No Vehicle | 563 (2.8%) | 1,148 (5.1%) |
| 1 Vehicle | 5,527 (27.7%) | 6,656 (29.6%) |
| 2 Vehicles | 8,638 (43.3%) | 8,862 (39.4%) |
| 3 Vehicles | 3,482 (17.4%) | 4,007 (17.8%) |
| 4 Vehicles | 1,522 (7.6%) | 1,635 (7.3%) |
| 5 or more Vehicles | 228 (1.1%) | 161 (0.7%) |
| Total | 19,960 (100.0%) | 22,469 (100.0%) |
Commute Time in Greenville
The most frequently occuring commute durations in Greenville are 10 to 14 minutes (10,355 commuters, 27.1%), 15 to 19 minutes (9,067 commuters, 23.7%), and 5 to 9 minutes (6,718 commuters, 17.5%).
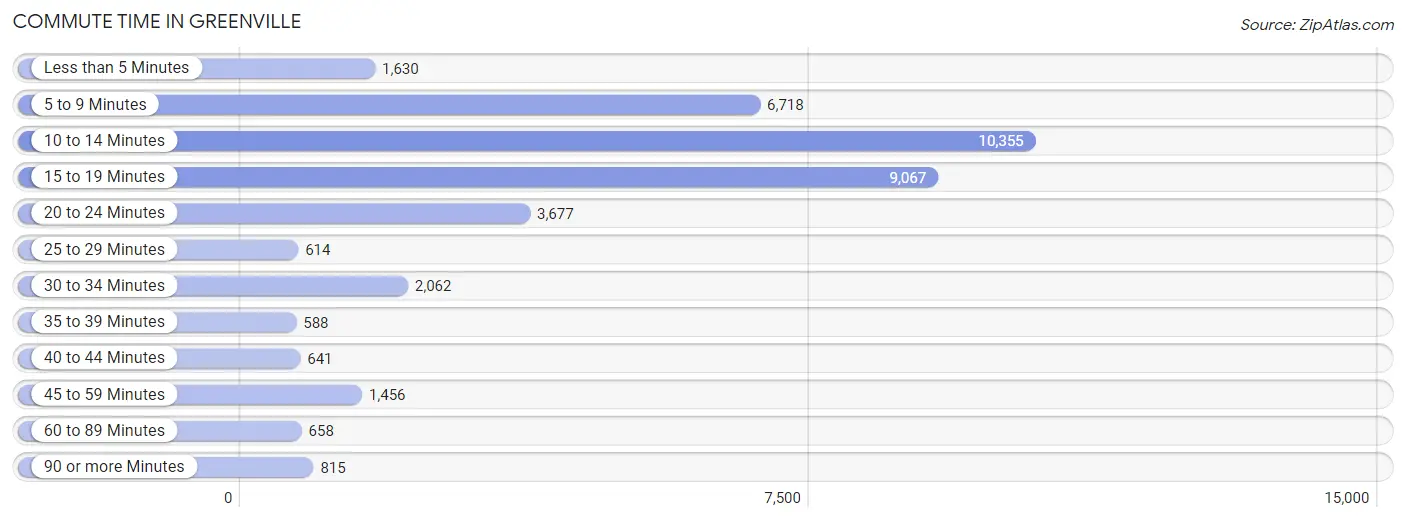
| Commute Time | # Commuters | % Commuters |
| Less than 5 Minutes | 1,630 | 4.3% |
| 5 to 9 Minutes | 6,718 | 17.5% |
| 10 to 14 Minutes | 10,355 | 27.1% |
| 15 to 19 Minutes | 9,067 | 23.7% |
| 20 to 24 Minutes | 3,677 | 9.6% |
| 25 to 29 Minutes | 614 | 1.6% |
| 30 to 34 Minutes | 2,062 | 5.4% |
| 35 to 39 Minutes | 588 | 1.5% |
| 40 to 44 Minutes | 641 | 1.7% |
| 45 to 59 Minutes | 1,456 | 3.8% |
| 60 to 89 Minutes | 658 | 1.7% |
| 90 or more Minutes | 815 | 2.1% |
Commute Time by Sex in Greenville
The most common commute times in Greenville are 15 to 19 minutes (4,524 commuters, 25.4%) for males and 10 to 14 minutes (6,378 commuters, 31.2%) for females.
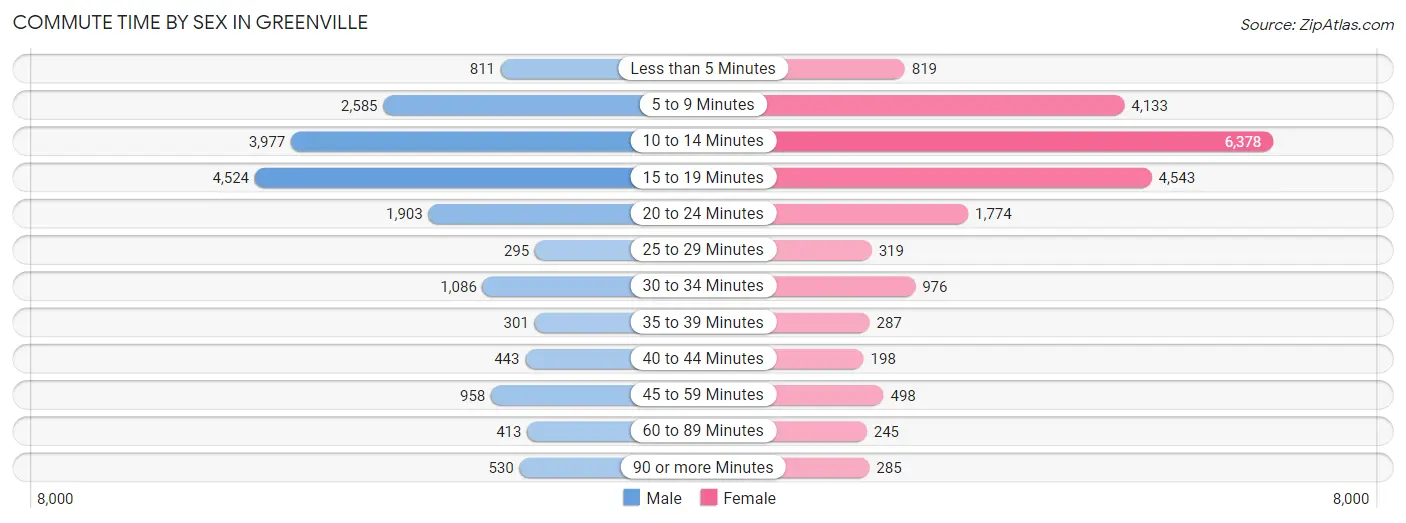
| Commute Time | Male | Female |
| Less than 5 Minutes | 811 (4.5%) | 819 (4.0%) |
| 5 to 9 Minutes | 2,585 (14.5%) | 4,133 (20.2%) |
| 10 to 14 Minutes | 3,977 (22.3%) | 6,378 (31.2%) |
| 15 to 19 Minutes | 4,524 (25.4%) | 4,543 (22.2%) |
| 20 to 24 Minutes | 1,903 (10.7%) | 1,774 (8.7%) |
| 25 to 29 Minutes | 295 (1.7%) | 319 (1.6%) |
| 30 to 34 Minutes | 1,086 (6.1%) | 976 (4.8%) |
| 35 to 39 Minutes | 301 (1.7%) | 287 (1.4%) |
| 40 to 44 Minutes | 443 (2.5%) | 198 (1.0%) |
| 45 to 59 Minutes | 958 (5.4%) | 498 (2.4%) |
| 60 to 89 Minutes | 413 (2.3%) | 245 (1.2%) |
| 90 or more Minutes | 530 (3.0%) | 285 (1.4%) |
Time of Departure to Work by Sex in Greenville
The most frequent times of departure to work in Greenville are 7:30 AM to 7:59 AM (2,854, 16.0%) for males and 7:30 AM to 7:59 AM (3,343, 16.3%) for females.
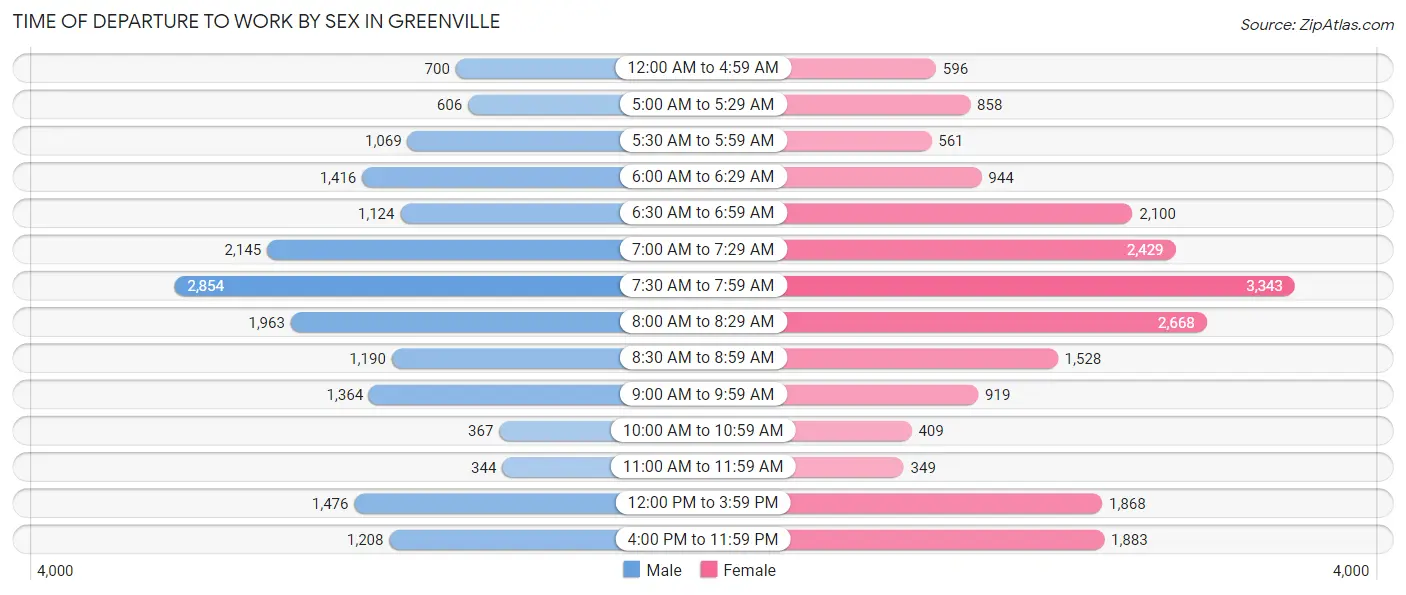
| Time of Departure | Male | Female |
| 12:00 AM to 4:59 AM | 700 (3.9%) | 596 (2.9%) |
| 5:00 AM to 5:29 AM | 606 (3.4%) | 858 (4.2%) |
| 5:30 AM to 5:59 AM | 1,069 (6.0%) | 561 (2.7%) |
| 6:00 AM to 6:29 AM | 1,416 (7.9%) | 944 (4.6%) |
| 6:30 AM to 6:59 AM | 1,124 (6.3%) | 2,100 (10.3%) |
| 7:00 AM to 7:29 AM | 2,145 (12.0%) | 2,429 (11.9%) |
| 7:30 AM to 7:59 AM | 2,854 (16.0%) | 3,343 (16.3%) |
| 8:00 AM to 8:29 AM | 1,963 (11.0%) | 2,668 (13.0%) |
| 8:30 AM to 8:59 AM | 1,190 (6.7%) | 1,528 (7.5%) |
| 9:00 AM to 9:59 AM | 1,364 (7.6%) | 919 (4.5%) |
| 10:00 AM to 10:59 AM | 367 (2.1%) | 409 (2.0%) |
| 11:00 AM to 11:59 AM | 344 (1.9%) | 349 (1.7%) |
| 12:00 PM to 3:59 PM | 1,476 (8.3%) | 1,868 (9.1%) |
| 4:00 PM to 11:59 PM | 1,208 (6.8%) | 1,883 (9.2%) |
| Total | 17,826 (100.0%) | 20,455 (100.0%) |
Housing Occupancy in Greenville
Occupancy by Ownership in Greenville
Of the total 37,901 dwellings in Greenville, owner-occupied units account for 12,466 (32.9%), while renter-occupied units make up 25,435 (67.1%).
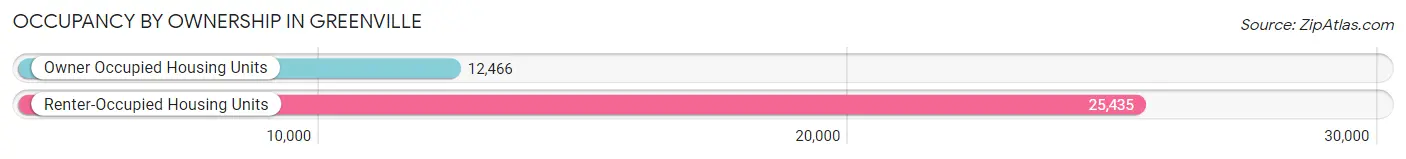
| Occupancy | # Housing Units | % Housing Units |
| Owner Occupied Housing Units | 12,466 | 32.9% |
| Renter-Occupied Housing Units | 25,435 | 67.1% |
| Total Occupied Housing Units | 37,901 | 100.0% |
Occupancy by Household Size in Greenville
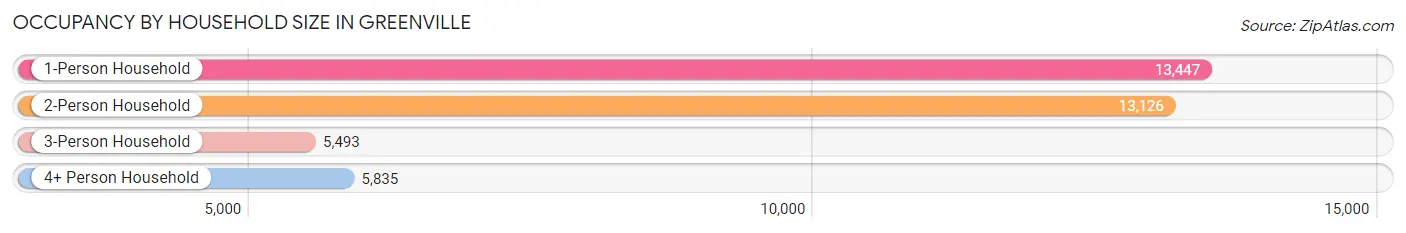
| Household Size | # Housing Units | % Housing Units |
| 1-Person Household | 13,447 | 35.5% |
| 2-Person Household | 13,126 | 34.6% |
| 3-Person Household | 5,493 | 14.5% |
| 4+ Person Household | 5,835 | 15.4% |
| Total Housing Units | 37,901 | 100.0% |
Occupancy by Ownership by Household Size in Greenville
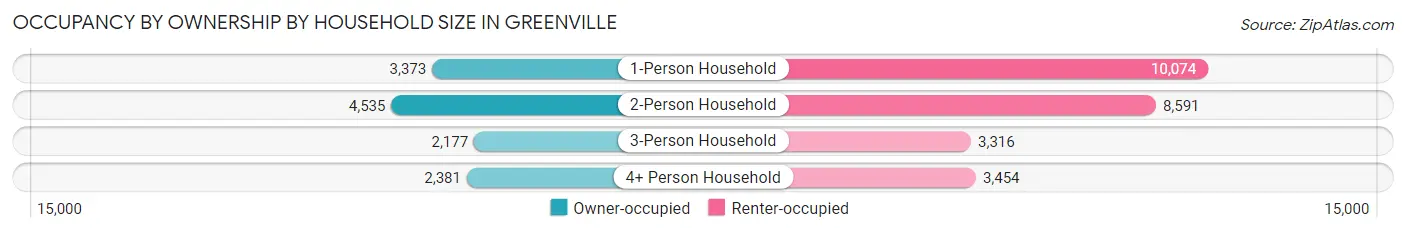
| Household Size | Owner-occupied | Renter-occupied |
| 1-Person Household | 3,373 (25.1%) | 10,074 (74.9%) |
| 2-Person Household | 4,535 (34.5%) | 8,591 (65.4%) |
| 3-Person Household | 2,177 (39.6%) | 3,316 (60.4%) |
| 4+ Person Household | 2,381 (40.8%) | 3,454 (59.2%) |
| Total Housing Units | 12,466 (32.9%) | 25,435 (67.1%) |
Occupancy by Educational Attainment in Greenville
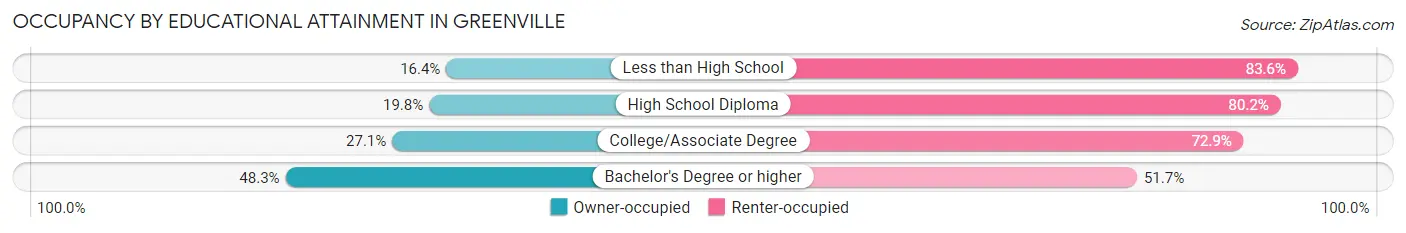
| Household Size | Owner-occupied | Renter-occupied |
| Less than High School | 326 (16.4%) | 1,661 (83.6%) |
| High School Diploma | 1,455 (19.8%) | 5,889 (80.2%) |
| College/Associate Degree | 3,993 (27.1%) | 10,720 (72.9%) |
| Bachelor's Degree or higher | 6,692 (48.3%) | 7,165 (51.7%) |
Occupancy by Age of Householder in Greenville
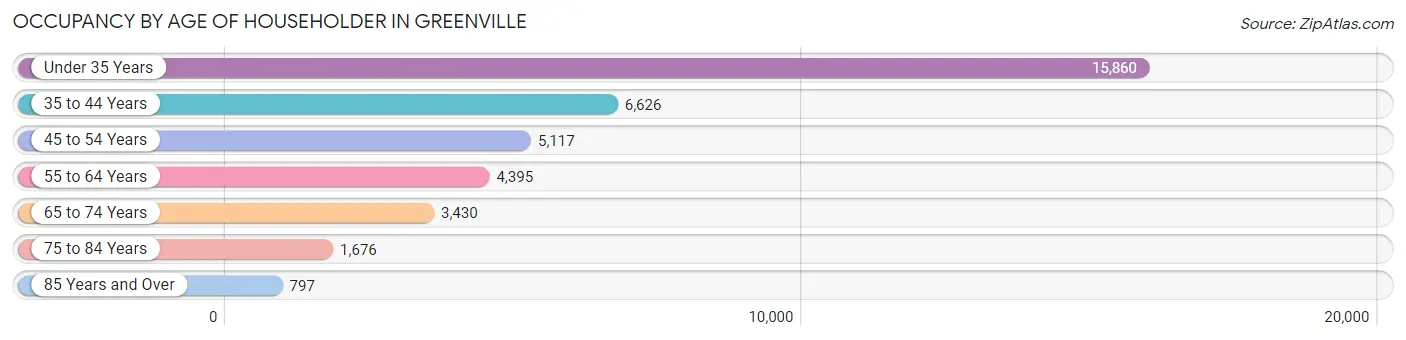
| Age Bracket | # Households | % Households |
| Under 35 Years | 15,860 | 41.8% |
| 35 to 44 Years | 6,626 | 17.5% |
| 45 to 54 Years | 5,117 | 13.5% |
| 55 to 64 Years | 4,395 | 11.6% |
| 65 to 74 Years | 3,430 | 9.0% |
| 75 to 84 Years | 1,676 | 4.4% |
| 85 Years and Over | 797 | 2.1% |
| Total | 37,901 | 100.0% |
Housing Finances in Greenville
Median Income by Occupancy in Greenville
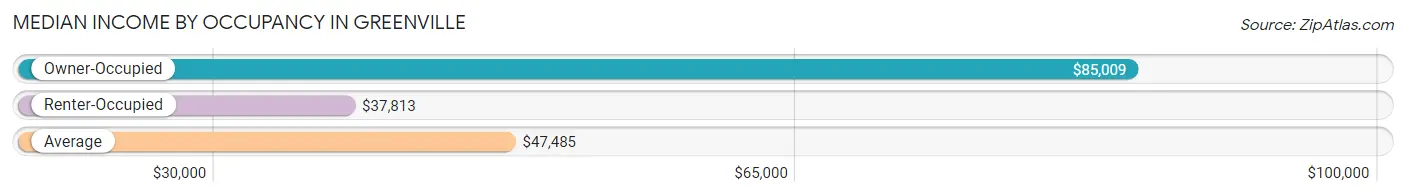
| Occupancy Type | # Households | Median Income |
| Owner-Occupied | 12,466 (32.9%) | $85,009 |
| Renter-Occupied | 25,435 (67.1%) | $37,813 |
| Average | 37,901 (100.0%) | $47,485 |
Occupancy by Householder Income Bracket in Greenville
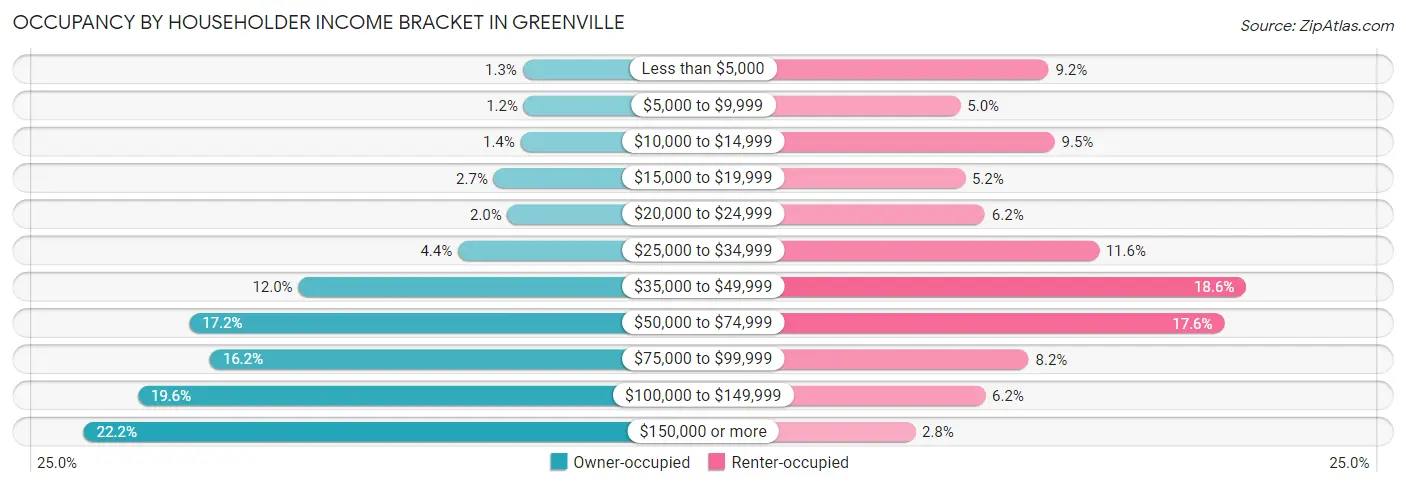
| Income Bracket | Owner-occupied | Renter-occupied |
| Less than $5,000 | 159 (1.3%) | 2,338 (9.2%) |
| $5,000 to $9,999 | 153 (1.2%) | 1,268 (5.0%) |
| $10,000 to $14,999 | 172 (1.4%) | 2,410 (9.5%) |
| $15,000 to $19,999 | 331 (2.7%) | 1,325 (5.2%) |
| $20,000 to $24,999 | 249 (2.0%) | 1,566 (6.2%) |
| $25,000 to $34,999 | 544 (4.4%) | 2,945 (11.6%) |
| $35,000 to $49,999 | 1,491 (12.0%) | 4,730 (18.6%) |
| $50,000 to $74,999 | 2,139 (17.2%) | 4,467 (17.6%) |
| $75,000 to $99,999 | 2,017 (16.2%) | 2,097 (8.2%) |
| $100,000 to $149,999 | 2,445 (19.6%) | 1,569 (6.2%) |
| $150,000 or more | 2,766 (22.2%) | 720 (2.8%) |
| Total | 12,466 (100.0%) | 25,435 (100.0%) |
Monthly Housing Cost Tiers in Greenville
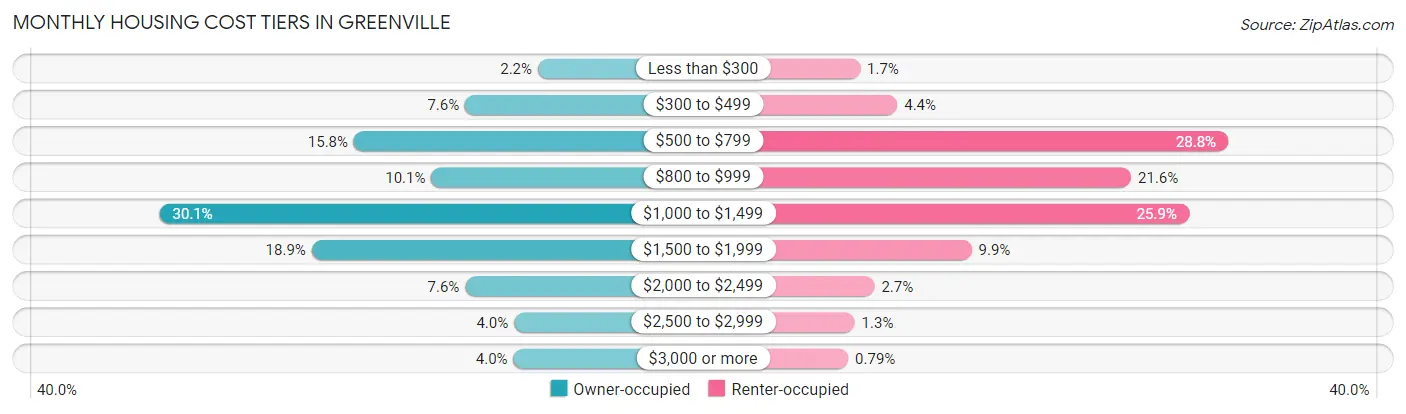
| Monthly Cost | Owner-occupied | Renter-occupied |
| Less than $300 | 274 (2.2%) | 426 (1.7%) |
| $300 to $499 | 943 (7.6%) | 1,122 (4.4%) |
| $500 to $799 | 1,964 (15.8%) | 7,316 (28.8%) |
| $800 to $999 | 1,253 (10.1%) | 5,501 (21.6%) |
| $1,000 to $1,499 | 3,748 (30.1%) | 6,579 (25.9%) |
| $1,500 to $1,999 | 2,351 (18.9%) | 2,513 (9.9%) |
| $2,000 to $2,499 | 941 (7.5%) | 694 (2.7%) |
| $2,500 to $2,999 | 493 (4.0%) | 323 (1.3%) |
| $3,000 or more | 499 (4.0%) | 202 (0.8%) |
| Total | 12,466 (100.0%) | 25,435 (100.0%) |
Physical Housing Characteristics in Greenville
Housing Structures in Greenville
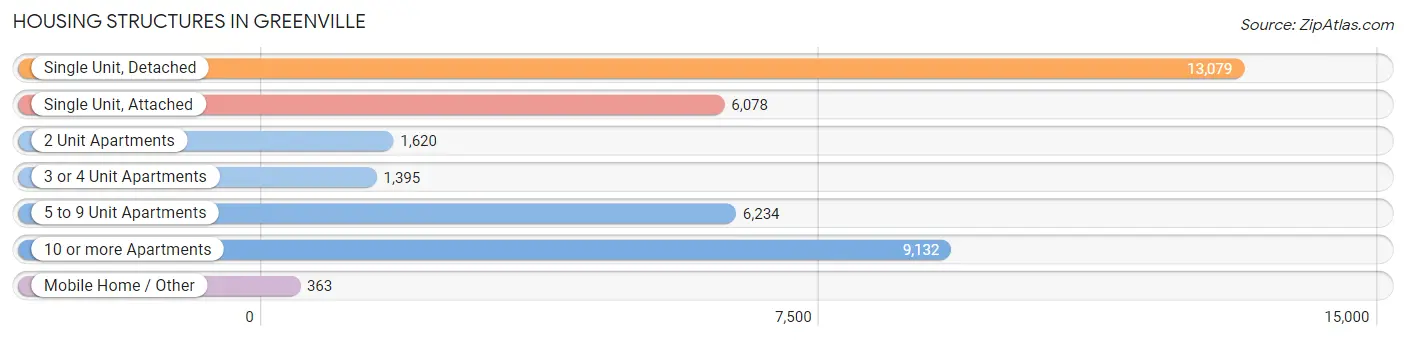
| Structure Type | # Housing Units | % Housing Units |
| Single Unit, Detached | 13,079 | 34.5% |
| Single Unit, Attached | 6,078 | 16.0% |
| 2 Unit Apartments | 1,620 | 4.3% |
| 3 or 4 Unit Apartments | 1,395 | 3.7% |
| 5 to 9 Unit Apartments | 6,234 | 16.5% |
| 10 or more Apartments | 9,132 | 24.1% |
| Mobile Home / Other | 363 | 1.0% |
| Total | 37,901 | 100.0% |
Housing Structures by Occupancy in Greenville
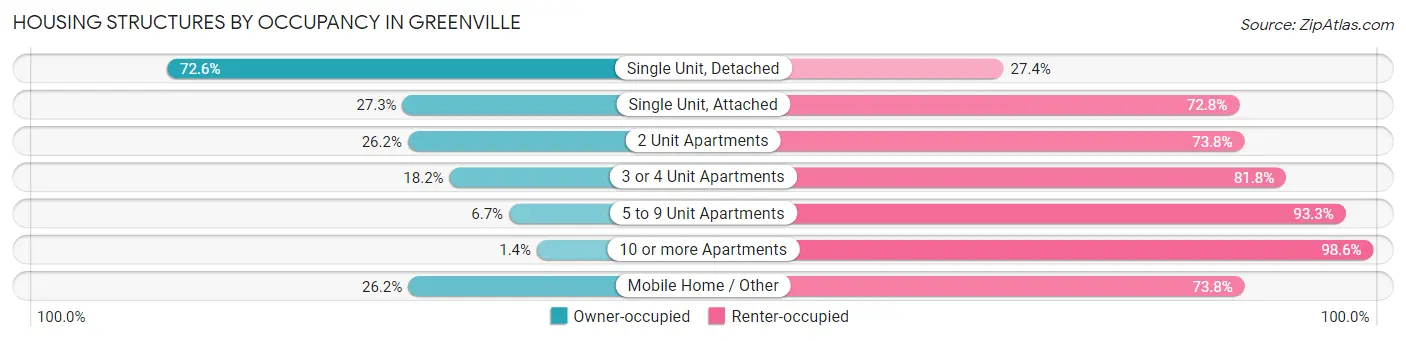
| Structure Type | Owner-occupied | Renter-occupied |
| Single Unit, Detached | 9,491 (72.6%) | 3,588 (27.4%) |
| Single Unit, Attached | 1,656 (27.3%) | 4,422 (72.8%) |
| 2 Unit Apartments | 425 (26.2%) | 1,195 (73.8%) |
| 3 or 4 Unit Apartments | 254 (18.2%) | 1,141 (81.8%) |
| 5 to 9 Unit Apartments | 420 (6.7%) | 5,814 (93.3%) |
| 10 or more Apartments | 125 (1.4%) | 9,007 (98.6%) |
| Mobile Home / Other | 95 (26.2%) | 268 (73.8%) |
| Total | 12,466 (32.9%) | 25,435 (67.1%) |
Housing Structures by Number of Rooms in Greenville
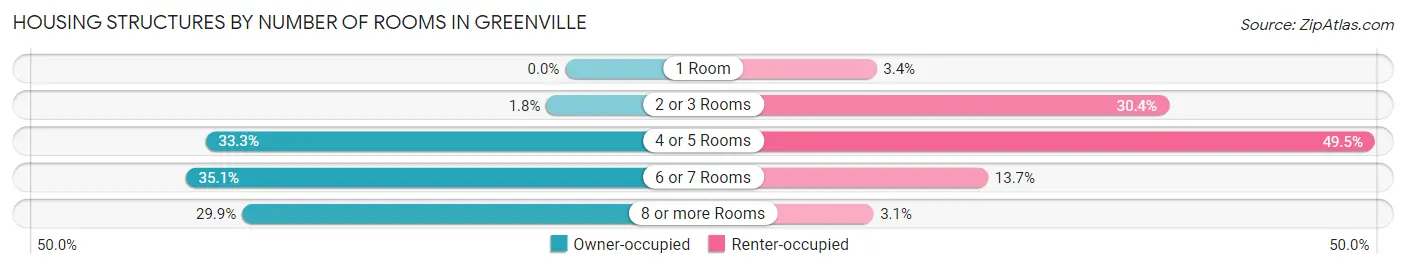
| Number of Rooms | Owner-occupied | Renter-occupied |
| 1 Room | 0 (0.0%) | 856 (3.4%) |
| 2 or 3 Rooms | 218 (1.8%) | 7,738 (30.4%) |
| 4 or 5 Rooms | 4,146 (33.3%) | 12,579 (49.5%) |
| 6 or 7 Rooms | 4,376 (35.1%) | 3,479 (13.7%) |
| 8 or more Rooms | 3,726 (29.9%) | 783 (3.1%) |
| Total | 12,466 (100.0%) | 25,435 (100.0%) |
Housing Structure by Heating Type in Greenville
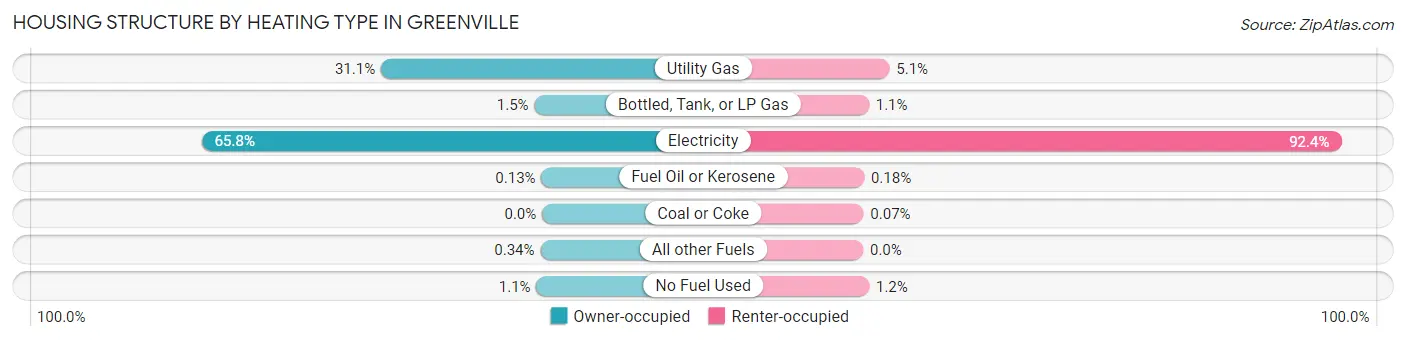
| Heating Type | Owner-occupied | Renter-occupied |
| Utility Gas | 3,881 (31.1%) | 1,291 (5.1%) |
| Bottled, Tank, or LP Gas | 185 (1.5%) | 282 (1.1%) |
| Electricity | 8,204 (65.8%) | 23,502 (92.4%) |
| Fuel Oil or Kerosene | 16 (0.1%) | 46 (0.2%) |
| Coal or Coke | 0 (0.0%) | 18 (0.1%) |
| All other Fuels | 43 (0.3%) | 0 (0.0%) |
| No Fuel Used | 137 (1.1%) | 296 (1.2%) |
| Total | 12,466 (100.0%) | 25,435 (100.0%) |
Household Vehicle Usage in Greenville
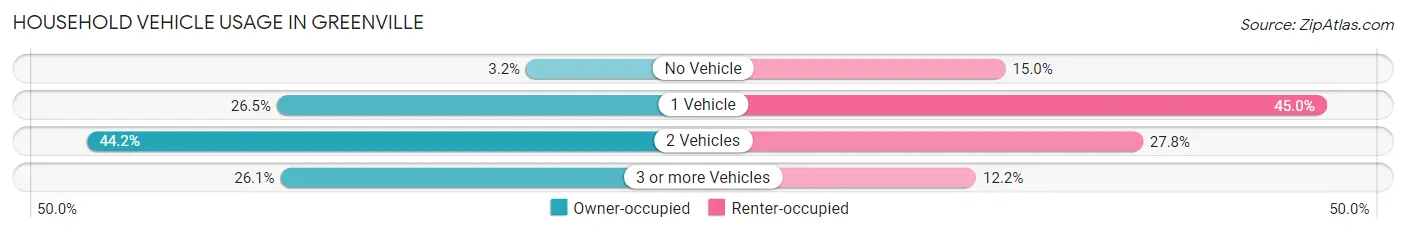
| Vehicles per Household | Owner-occupied | Renter-occupied |
| No Vehicle | 399 (3.2%) | 3,815 (15.0%) |
| 1 Vehicle | 3,298 (26.5%) | 11,432 (45.0%) |
| 2 Vehicles | 5,512 (44.2%) | 7,074 (27.8%) |
| 3 or more Vehicles | 3,257 (26.1%) | 3,114 (12.2%) |
| Total | 12,466 (100.0%) | 25,435 (100.0%) |
Real Estate & Mortgages in Greenville
Real Estate and Mortgage Overview in Greenville
| Characteristic | Without Mortgage | With Mortgage |
| Housing Units | 3,410 | 9,056 |
| Median Property Value | $198,200 | $190,600 |
| Median Household Income | $63,276 | $2,028 |
| Monthly Housing Costs | $581 | $499 |
| Real Estate Taxes | $2,099 | $77 |
Property Value by Mortgage Status in Greenville
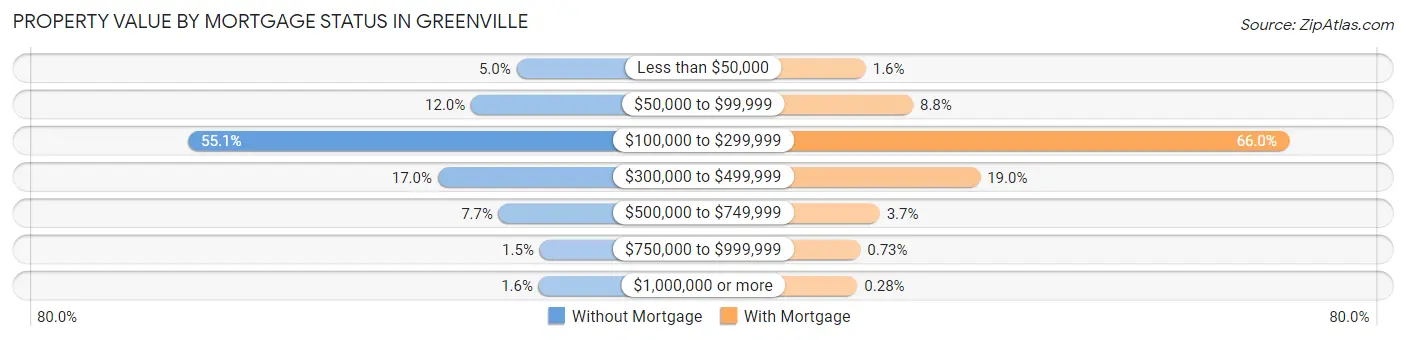
| Property Value | Without Mortgage | With Mortgage |
| Less than $50,000 | 172 (5.0%) | 141 (1.6%) |
| $50,000 to $99,999 | 408 (12.0%) | 793 (8.8%) |
| $100,000 to $299,999 | 1,878 (55.1%) | 5,977 (66.0%) |
| $300,000 to $499,999 | 581 (17.0%) | 1,721 (19.0%) |
| $500,000 to $749,999 | 264 (7.7%) | 333 (3.7%) |
| $750,000 to $999,999 | 51 (1.5%) | 66 (0.7%) |
| $1,000,000 or more | 56 (1.6%) | 25 (0.3%) |
| Total | 3,410 (100.0%) | 9,056 (100.0%) |
Household Income by Mortgage Status in Greenville
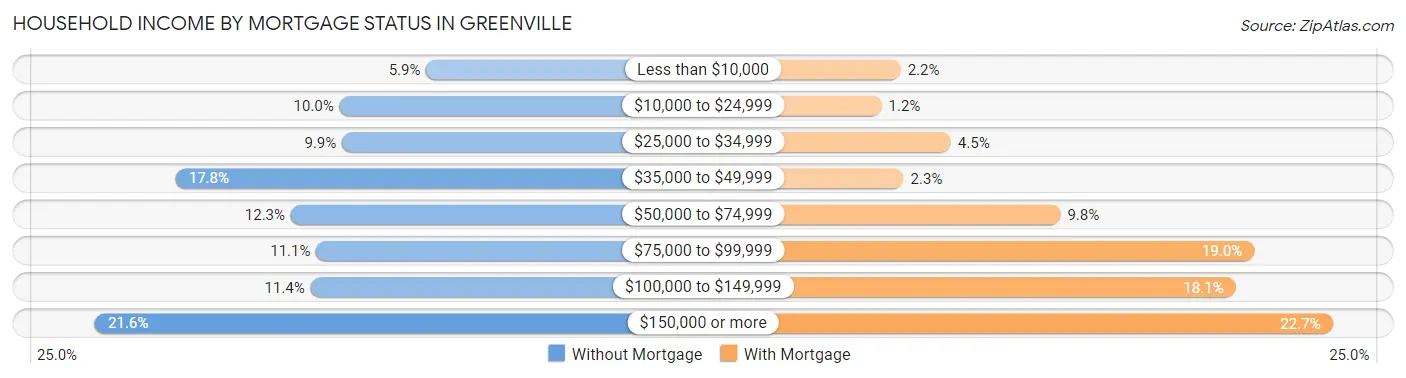
| Household Income | Without Mortgage | With Mortgage |
| Less than $10,000 | 200 (5.9%) | 195 (2.1%) |
| $10,000 to $24,999 | 341 (10.0%) | 112 (1.2%) |
| $25,000 to $34,999 | 337 (9.9%) | 411 (4.5%) |
| $35,000 to $49,999 | 607 (17.8%) | 207 (2.3%) |
| $50,000 to $74,999 | 420 (12.3%) | 884 (9.8%) |
| $75,000 to $99,999 | 379 (11.1%) | 1,719 (19.0%) |
| $100,000 to $149,999 | 388 (11.4%) | 1,638 (18.1%) |
| $150,000 or more | 738 (21.6%) | 2,057 (22.7%) |
| Total | 3,410 (100.0%) | 9,056 (100.0%) |
Property Value to Household Income Ratio in Greenville
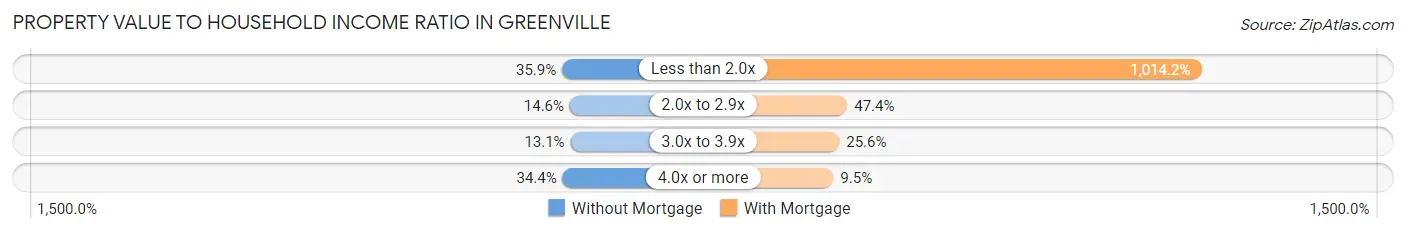
| Value-to-Income Ratio | Without Mortgage | With Mortgage |
| Less than 2.0x | 1,225 (35.9%) | 91,846 (1,014.2%) |
| 2.0x to 2.9x | 498 (14.6%) | 4,288 (47.3%) |
| 3.0x to 3.9x | 445 (13.1%) | 2,322 (25.6%) |
| 4.0x or more | 1,174 (34.4%) | 861 (9.5%) |
| Total | 3,410 (100.0%) | 9,056 (100.0%) |
Real Estate Taxes by Mortgage Status in Greenville
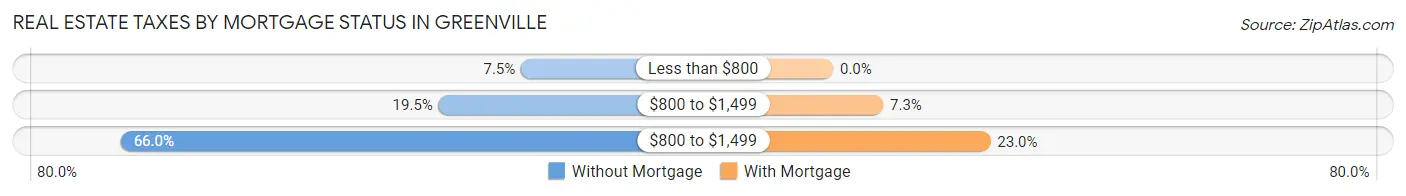
| Property Taxes | Without Mortgage | With Mortgage |
| Less than $800 | 254 (7.4%) | 0 (0.0%) |
| $800 to $1,499 | 665 (19.5%) | 663 (7.3%) |
| $800 to $1,499 | 2,249 (65.9%) | 2,082 (23.0%) |
| Total | 3,410 (100.0%) | 9,056 (100.0%) |
Health & Disability in Greenville
Health Insurance Coverage by Age in Greenville
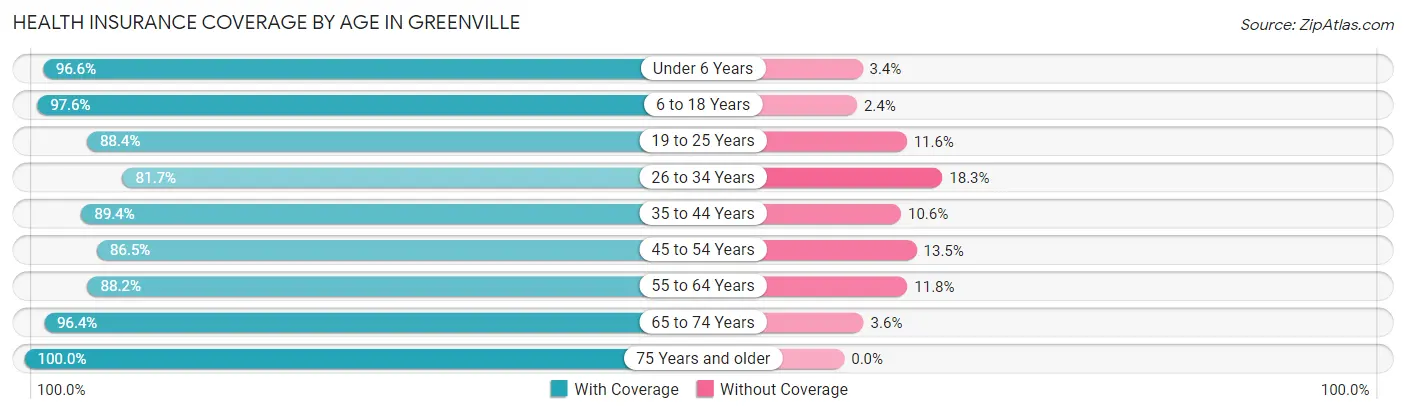
| Age Bracket | With Coverage | Without Coverage |
| Under 6 Years | 6,084 (96.6%) | 214 (3.4%) |
| 6 to 18 Years | 13,321 (97.6%) | 322 (2.4%) |
| 19 to 25 Years | 19,679 (88.4%) | 2,592 (11.6%) |
| 26 to 34 Years | 9,309 (81.7%) | 2,084 (18.3%) |
| 35 to 44 Years | 8,817 (89.4%) | 1,044 (10.6%) |
| 45 to 54 Years | 7,009 (86.5%) | 1,093 (13.5%) |
| 55 to 64 Years | 6,339 (88.2%) | 845 (11.8%) |
| 65 to 74 Years | 5,160 (96.4%) | 193 (3.6%) |
| 75 Years and older | 3,039 (100.0%) | 0 (0.0%) |
| Total | 78,757 (90.4%) | 8,387 (9.6%) |
Health Insurance Coverage by Citizenship Status in Greenville
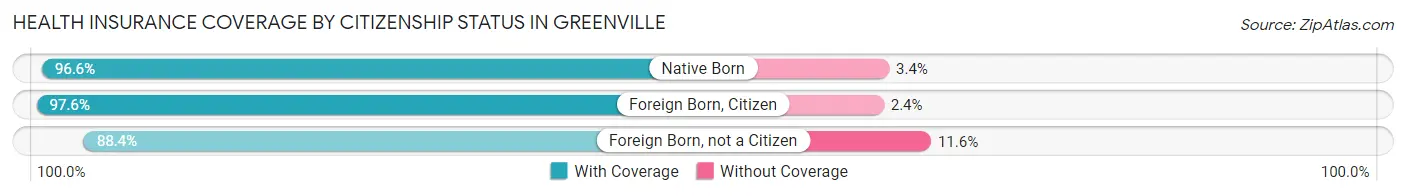
| Citizenship Status | With Coverage | Without Coverage |
| Native Born | 6,084 (96.6%) | 214 (3.4%) |
| Foreign Born, Citizen | 13,321 (97.6%) | 322 (2.4%) |
| Foreign Born, not a Citizen | 19,679 (88.4%) | 2,592 (11.6%) |
Health Insurance Coverage by Household Income in Greenville
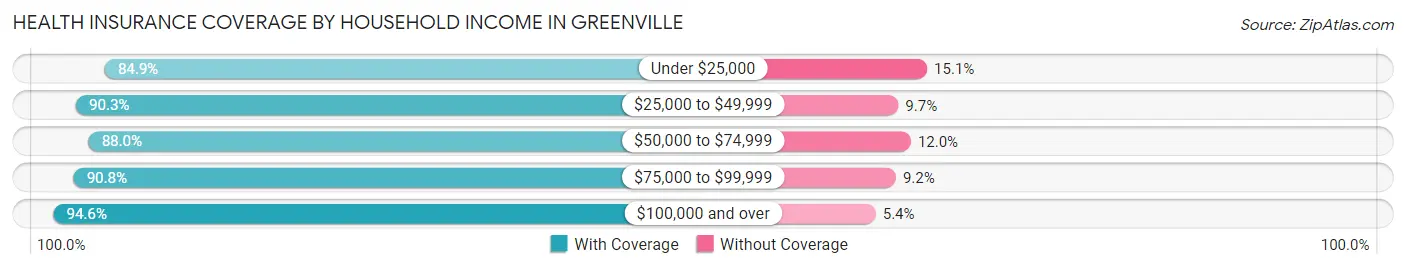
| Household Income | With Coverage | Without Coverage |
| Under $25,000 | 15,078 (84.9%) | 2,674 (15.1%) |
| $25,000 to $49,999 | 17,765 (90.3%) | 1,901 (9.7%) |
| $50,000 to $74,999 | 11,995 (88.0%) | 1,639 (12.0%) |
| $75,000 to $99,999 | 8,915 (90.8%) | 904 (9.2%) |
| $100,000 and over | 19,820 (94.6%) | 1,138 (5.4%) |
Public vs Private Health Insurance Coverage by Age in Greenville
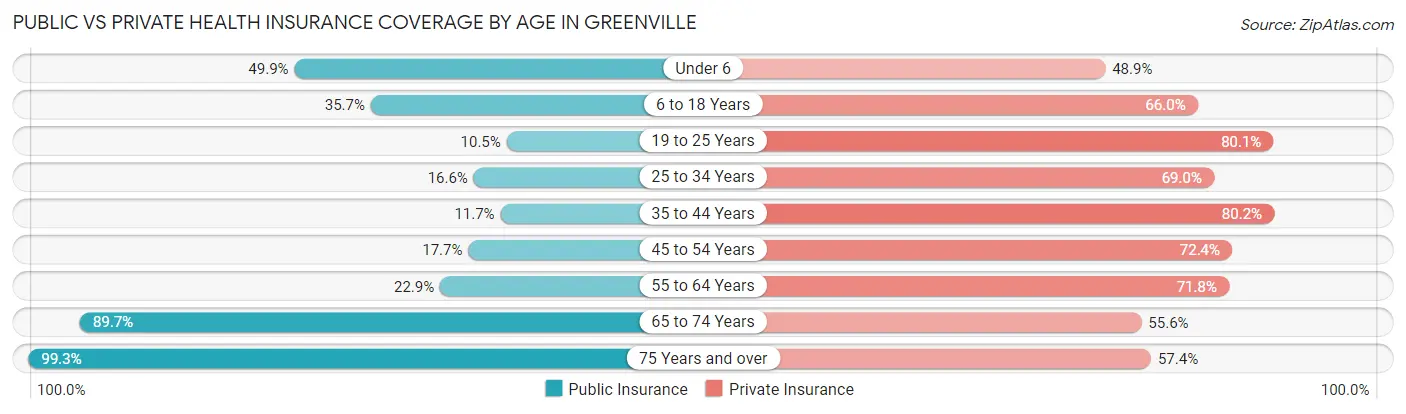
| Age Bracket | Public Insurance | Private Insurance |
| Under 6 | 3,144 (49.9%) | 3,080 (48.9%) |
| 6 to 18 Years | 4,876 (35.7%) | 9,007 (66.0%) |
| 19 to 25 Years | 2,346 (10.5%) | 17,832 (80.1%) |
| 25 to 34 Years | 1,896 (16.6%) | 7,865 (69.0%) |
| 35 to 44 Years | 1,152 (11.7%) | 7,909 (80.2%) |
| 45 to 54 Years | 1,430 (17.6%) | 5,865 (72.4%) |
| 55 to 64 Years | 1,644 (22.9%) | 5,159 (71.8%) |
| 65 to 74 Years | 4,803 (89.7%) | 2,977 (55.6%) |
| 75 Years and over | 3,018 (99.3%) | 1,744 (57.4%) |
| Total | 24,309 (27.9%) | 61,438 (70.5%) |
Disability Status by Sex by Age in Greenville
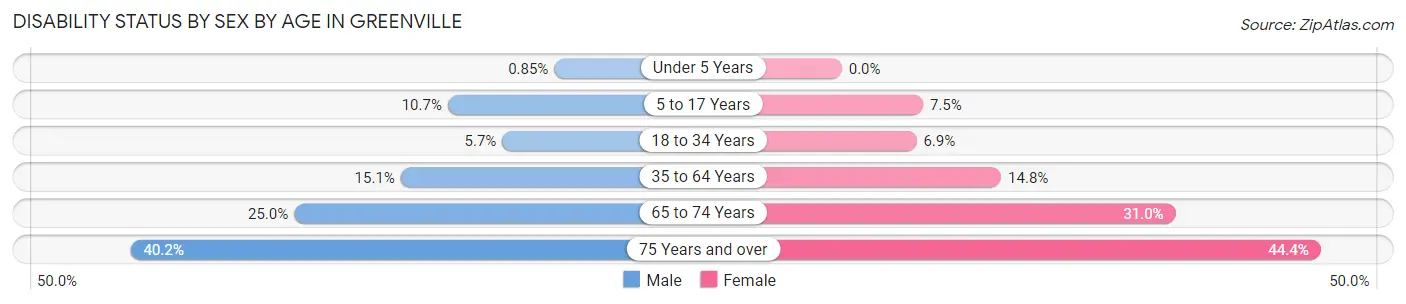
| Age Bracket | Male | Female |
| Under 5 Years | 22 (0.9%) | 0 (0.0%) |
| 5 to 17 Years | 650 (10.7%) | 406 (7.5%) |
| 18 to 34 Years | 938 (5.7%) | 1,406 (6.9%) |
| 35 to 64 Years | 1,650 (15.1%) | 2,102 (14.8%) |
| 65 to 74 Years | 541 (25.0%) | 987 (31.0%) |
| 75 Years and over | 484 (40.2%) | 815 (44.4%) |
Disability Class by Sex by Age in Greenville
Disability Class: Hearing Difficulty
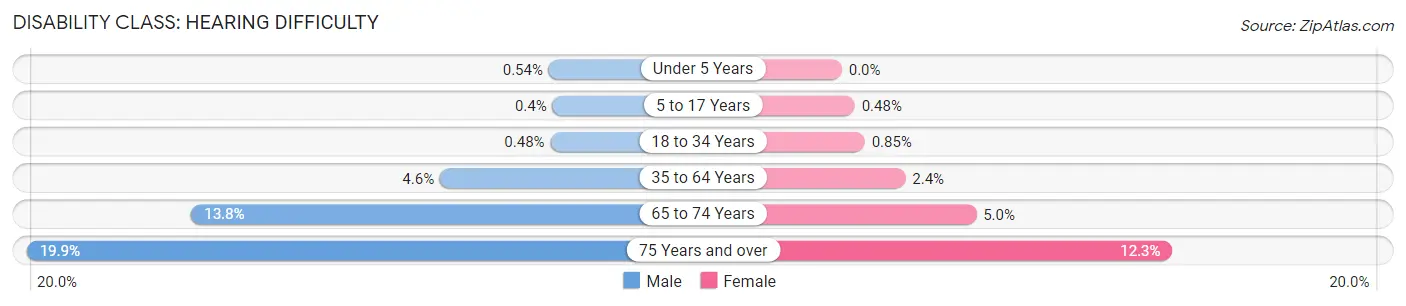
| Age Bracket | Male | Female |
| Under 5 Years | 14 (0.5%) | 0 (0.0%) |
| 5 to 17 Years | 24 (0.4%) | 26 (0.5%) |
| 18 to 34 Years | 80 (0.5%) | 172 (0.9%) |
| 35 to 64 Years | 501 (4.6%) | 336 (2.4%) |
| 65 to 74 Years | 299 (13.8%) | 159 (5.0%) |
| 75 Years and over | 240 (19.9%) | 225 (12.3%) |
Disability Class: Vision Difficulty
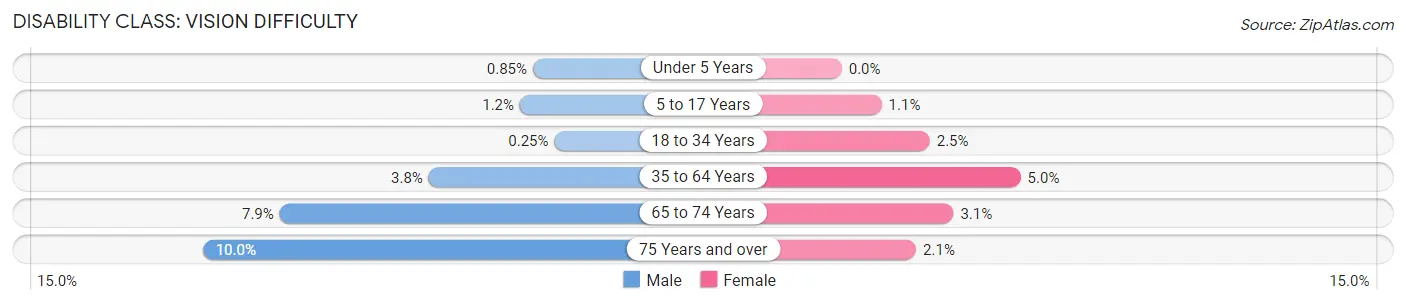
| Age Bracket | Male | Female |
| Under 5 Years | 22 (0.9%) | 0 (0.0%) |
| 5 to 17 Years | 73 (1.2%) | 60 (1.1%) |
| 18 to 34 Years | 41 (0.3%) | 498 (2.5%) |
| 35 to 64 Years | 410 (3.7%) | 708 (5.0%) |
| 65 to 74 Years | 171 (7.9%) | 99 (3.1%) |
| 75 Years and over | 121 (10.0%) | 38 (2.1%) |
Disability Class: Cognitive Difficulty
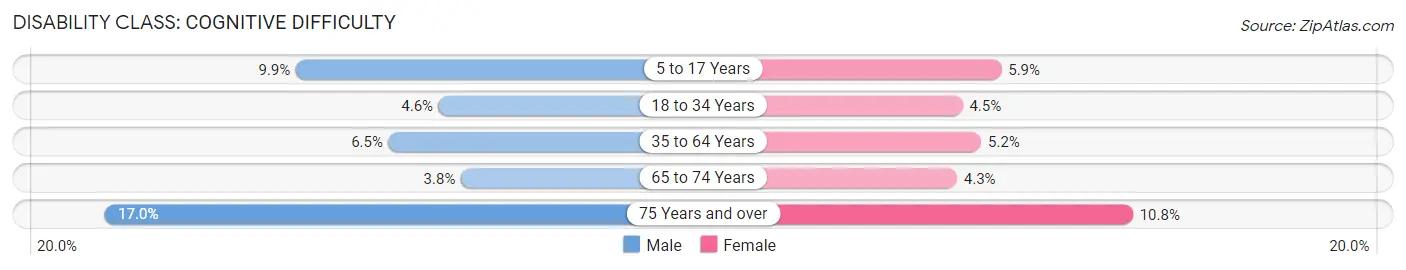
| Age Bracket | Male | Female |
| 5 to 17 Years | 601 (9.9%) | 319 (5.9%) |
| 18 to 34 Years | 763 (4.6%) | 910 (4.5%) |
| 35 to 64 Years | 708 (6.5%) | 735 (5.2%) |
| 65 to 74 Years | 82 (3.8%) | 136 (4.3%) |
| 75 Years and over | 205 (17.0%) | 198 (10.8%) |
Disability Class: Ambulatory Difficulty
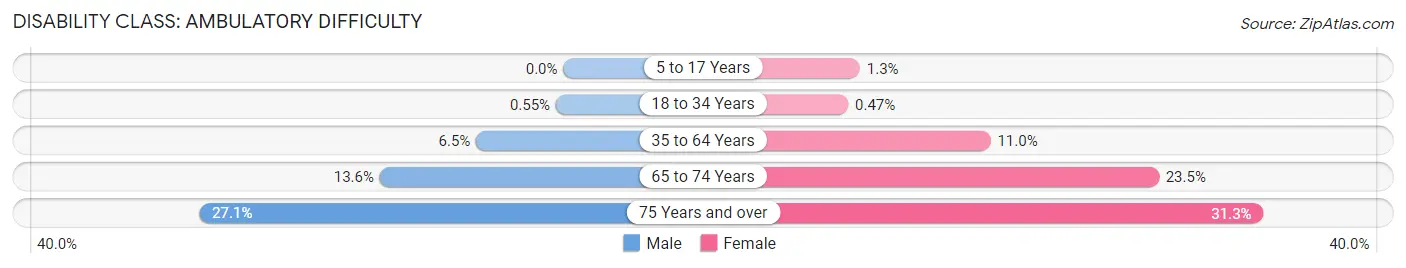
| Age Bracket | Male | Female |
| 5 to 17 Years | 0 (0.0%) | 72 (1.3%) |
| 18 to 34 Years | 91 (0.5%) | 96 (0.5%) |
| 35 to 64 Years | 707 (6.5%) | 1,569 (11.0%) |
| 65 to 74 Years | 295 (13.6%) | 750 (23.5%) |
| 75 Years and over | 326 (27.1%) | 574 (31.3%) |
Disability Class: Self-Care Difficulty
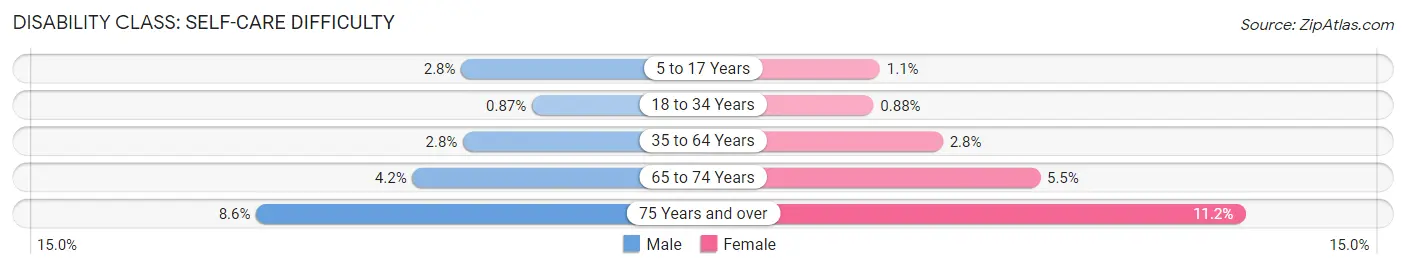
| Age Bracket | Male | Female |
| 5 to 17 Years | 172 (2.8%) | 57 (1.1%) |
| 18 to 34 Years | 144 (0.9%) | 178 (0.9%) |
| 35 to 64 Years | 305 (2.8%) | 399 (2.8%) |
| 65 to 74 Years | 91 (4.2%) | 176 (5.5%) |
| 75 Years and over | 103 (8.6%) | 206 (11.2%) |
Technology Access in Greenville
Computing Device Access in Greenville
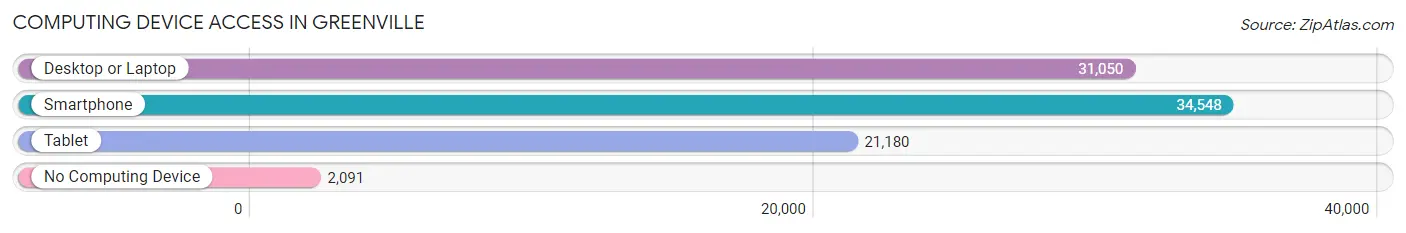
| Device Type | # Households | % Households |
| Desktop or Laptop | 31,050 | 81.9% |
| Smartphone | 34,548 | 91.1% |
| Tablet | 21,180 | 55.9% |
| No Computing Device | 2,091 | 5.5% |
| Total | 37,901 | 100.0% |
Internet Access in Greenville
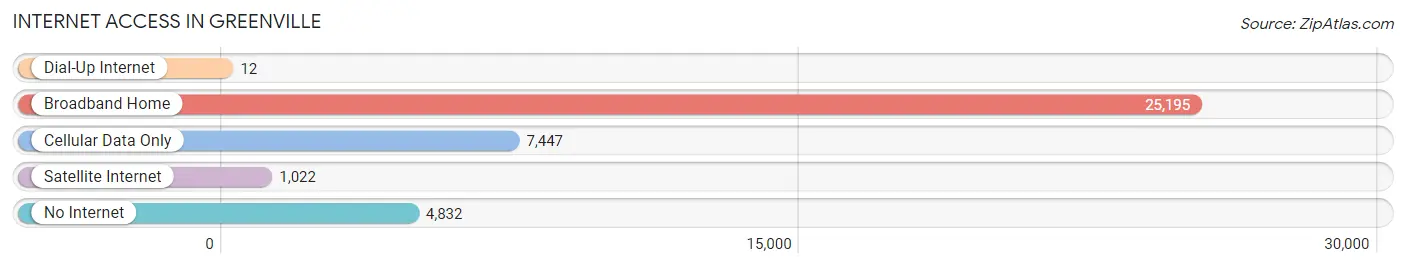
| Internet Type | # Households | % Households |
| Dial-Up Internet | 12 | 0.0% |
| Broadband Home | 25,195 | 66.5% |
| Cellular Data Only | 7,447 | 19.7% |
| Satellite Internet | 1,022 | 2.7% |
| No Internet | 4,832 | 12.8% |
| Total | 37,901 | 100.0% |
Greenville Summary
Greenville, North Carolina is a city located in Pitt County, in the eastern part of the state. It is the county seat and the largest city in the county. The city is situated on the Tar River, which is a tributary of the Neuse River. Greenville is part of the Greenville Metropolitan Statistical Area, which includes all of Pitt County and the surrounding counties. The city has a population of approximately 91,495 people, according to the 2020 U.S. Census.
Geography
Greenville is located in the Coastal Plain region of North Carolina, which is characterized by flat terrain and sandy soils. The city is situated on the Tar River, which is a tributary of the Neuse River. The city is located approximately 85 miles east of Raleigh, the state capital, and approximately 75 miles west of the Atlantic Ocean. The city is located in the humid subtropical climate zone, which is characterized by hot, humid summers and mild winters.
Economy
Greenville is the economic hub of Pitt County and the surrounding region. The city is home to several major employers, including East Carolina University, Vidant Medical Center, and the Greenville-Pitt County Chamber of Commerce. The city is also home to several large manufacturing companies, such as Grady-White Boats, Inc., and the Greenville-Pitt County Industrial Park. The city is also home to several retail stores, restaurants, and other businesses.
Demographics
According to the 2020 U.S. Census, the population of Greenville is 91,495. The city has a population that is approximately 57.3% White, 33.2% African American, 5.2% Hispanic or Latino, 2.2% Asian, and 1.3% Native American. The median household income in the city is $41,945, and the median home value is $164,400.
History
Greenville was founded in 1771 by Richard Evans, a Quaker from Pennsylvania. The city was named after General Nathanael Greene, who served in the American Revolutionary War. The city was incorporated in 1791 and became the county seat of Pitt County in 1799. The city was a major trading center during the 19th century, and it was also a major center for the production of tobacco and cotton. During the Civil War, the city was occupied by Union forces and was the site of several battles. After the war, the city experienced a period of economic growth and development. In the late 19th and early 20th centuries, the city was home to several large manufacturing companies, such as the Greenville Cotton Mill and the Greenville Tobacco Company. The city also became a major center for education, with the establishment of East Carolina University in 1907. The city continued to grow and develop throughout the 20th century, and today it is a major economic and cultural center in eastern North Carolina.
Common Questions
What is Per Capita Income in Greenville?
Per Capita income in Greenville is $30,605.
What is the Median Family Income in Greenville?
Median Family Income in Greenville is $69,496.
What is the Median Household income in Greenville?
Median Household Income in Greenville is $47,485.
What is Income or Wage Gap in Greenville?
Income or Wage Gap in Greenville is 22.0%.
Women in Greenville earn 78.0 cents for every dollar earned by a man.
What is Family Income Deficit in Greenville?
Family Income Deficit in Greenville is $14,004.
Families that are below poverty line in Greenville earn $14,004 less on average than the poverty threshold level.
What is Inequality or Gini Index in Greenville?
Inequality or Gini Index in Greenville is 0.50.
What is the Total Population of Greenville?
Total Population of Greenville is 87,894.
What is the Total Male Population of Greenville?
Total Male Population of Greenville is 39,855.
What is the Total Female Population of Greenville?
Total Female Population of Greenville is 48,039.
What is the Ratio of Males per 100 Females in Greenville?
There are 82.96 Males per 100 Females in Greenville.
What is the Ratio of Females per 100 Males in Greenville?
There are 120.53 Females per 100 Males in Greenville.
What is the Median Population Age in Greenville?
Median Population Age in Greenville is 26.9 Years.
What is the Average Family Size in Greenville
Average Family Size in Greenville is 2.8 People.
What is the Average Household Size in Greenville
Average Household Size in Greenville is 2.2 People.
How Large is the Labor Force in Greenville?
There are 46,921 People in the Labor Forcein in Greenville.
What is the Percentage of People in the Labor Force in Greenville?
64.5% of People are in the Labor Force in Greenville.
What is the Unemployment Rate in Greenville?
Unemployment Rate in Greenville is 8.7%.