Summerfield, NC Map & Demographics
Summerfield Map
Summerfield Overview
$65,001
PER CAPITA INCOME
$169,597
AVG FAMILY INCOME
$148,182
AVG HOUSEHOLD INCOME
64.8%
WAGE / INCOME GAP [ % ]
35.2¢/ $1
WAGE / INCOME GAP [ $ ]
$8,614
FAMILY INCOME DEFICIT
0.47
INEQUALITY / GINI INDEX
10,986
TOTAL POPULATION
5,197
MALE POPULATION
5,789
FEMALE POPULATION
89.77
MALES / 100 FEMALES
111.39
FEMALES / 100 MALES
45.1
MEDIAN AGE
3.2
AVG FAMILY SIZE
2.8
AVG HOUSEHOLD SIZE
5,524
LABOR FORCE [ PEOPLE ]
62.6%
PERCENT IN LABOR FORCE
2.9%
UNEMPLOYMENT RATE
Summerfield Zip Codes
Summerfield Area Codes
Income in Summerfield
Income Overview in Summerfield
Per Capita Income in Summerfield is $65,001, while median incomes of families and households are $169,597 and $148,182 respectively.
| Characteristic | Number | Measure |
| Per Capita Income | 10,986 | $65,001 |
| Median Family Income | 3,126 | $169,597 |
| Mean Family Income | 3,126 | $199,152 |
| Median Household Income | 3,910 | $148,182 |
| Mean Household Income | 3,910 | $176,248 |
| Income Deficit | 3,126 | $8,614 |
| Wage / Income Gap (%) | 10,986 | 64.85% |
| Wage / Income Gap ($) | 10,986 | 35.15¢ per $1 |
| Gini / Inequality Index | 10,986 | 0.47 |
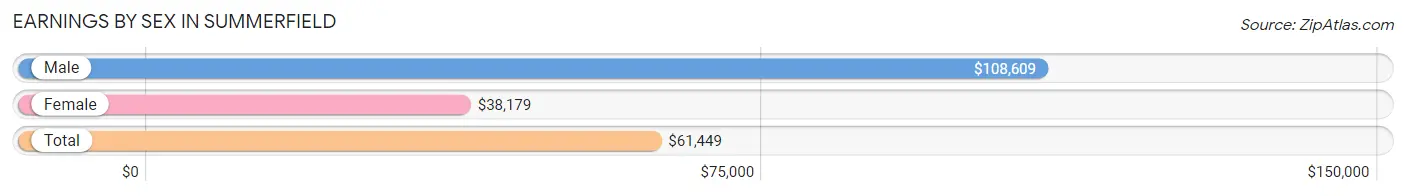
Earnings by Sex in Summerfield
Average Earnings in Summerfield are $61,449, $108,609 for men and $38,179 for women, a difference of 64.8%.
| Sex | Number | Average Earnings |
| Male | 2,891 (48.9%) | $108,609 |
| Female | 3,019 (51.1%) | $38,179 |
| Total | 5,910 (100.0%) | $61,449 |
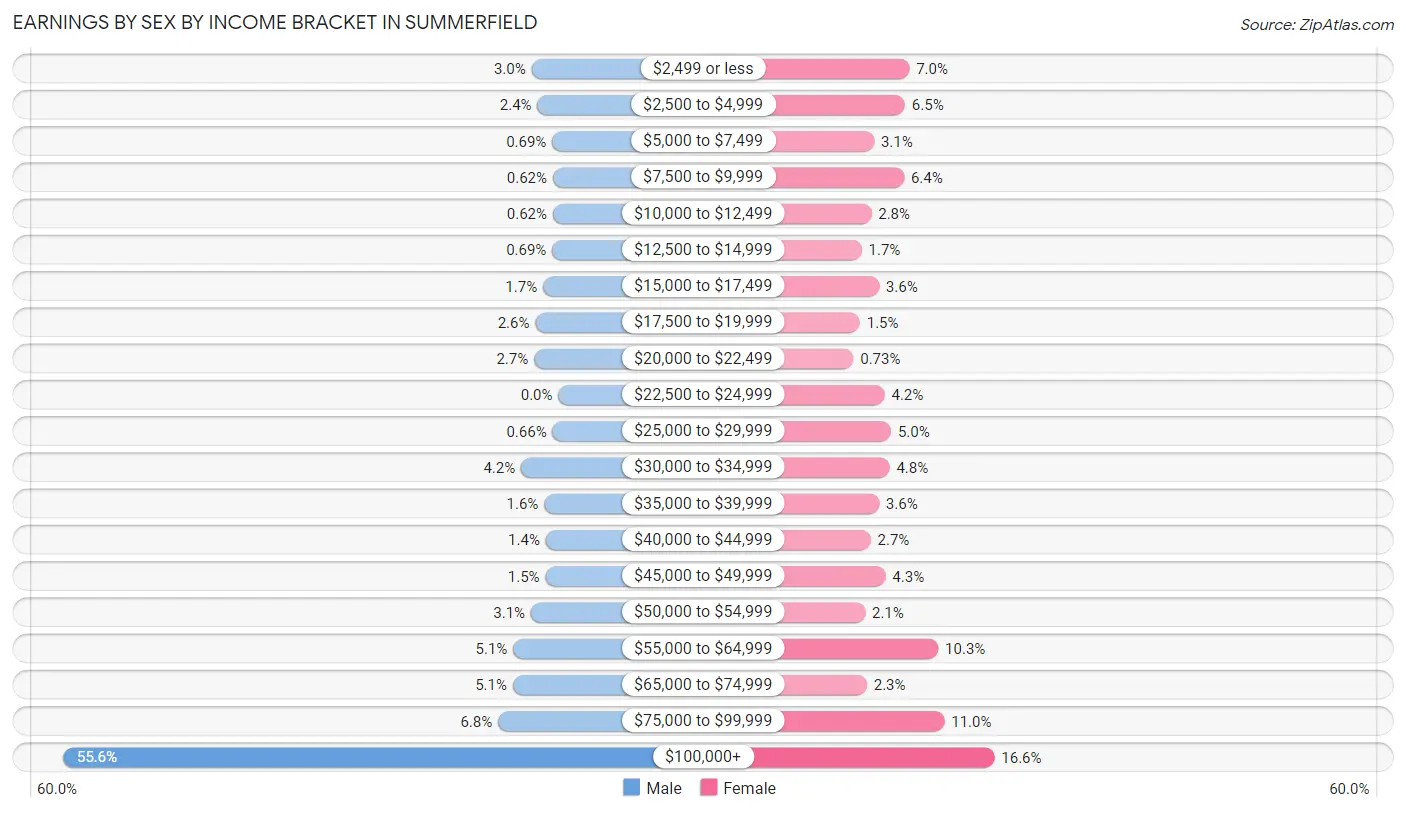
Earnings by Sex by Income Bracket in Summerfield
The most common earnings brackets in Summerfield are $100,000+ for men (1,607 | 55.6%) and $100,000+ for women (501 | 16.6%).
| Income | Male | Female |
| $2,499 or less | 87 (3.0%) | 212 (7.0%) |
| $2,500 to $4,999 | 68 (2.4%) | 197 (6.5%) |
| $5,000 to $7,499 | 20 (0.7%) | 92 (3.0%) |
| $7,500 to $9,999 | 18 (0.6%) | 194 (6.4%) |
| $10,000 to $12,499 | 18 (0.6%) | 83 (2.8%) |
| $12,500 to $14,999 | 20 (0.7%) | 50 (1.7%) |
| $15,000 to $17,499 | 50 (1.7%) | 109 (3.6%) |
| $17,500 to $19,999 | 75 (2.6%) | 44 (1.5%) |
| $20,000 to $22,499 | 79 (2.7%) | 22 (0.7%) |
| $22,500 to $24,999 | 0 (0.0%) | 128 (4.2%) |
| $25,000 to $29,999 | 19 (0.7%) | 150 (5.0%) |
| $30,000 to $34,999 | 121 (4.2%) | 145 (4.8%) |
| $35,000 to $39,999 | 46 (1.6%) | 109 (3.6%) |
| $40,000 to $44,999 | 41 (1.4%) | 81 (2.7%) |
| $45,000 to $49,999 | 42 (1.5%) | 131 (4.3%) |
| $50,000 to $54,999 | 89 (3.1%) | 62 (2.1%) |
| $55,000 to $64,999 | 147 (5.1%) | 310 (10.3%) |
| $65,000 to $74,999 | 148 (5.1%) | 68 (2.2%) |
| $75,000 to $99,999 | 196 (6.8%) | 331 (11.0%) |
| $100,000+ | 1,607 (55.6%) | 501 (16.6%) |
| Total | 2,891 (100.0%) | 3,019 (100.0%) |
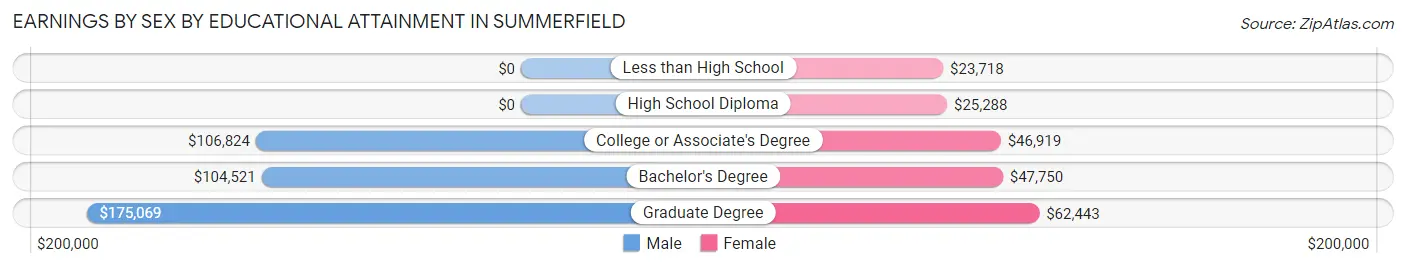
Earnings by Sex by Educational Attainment in Summerfield
Average earnings in Summerfield are $115,417 for men and $52,782 for women, a difference of 54.3%. Men with an educational attainment of graduate degree enjoy the highest average annual earnings of $175,069, while those with bachelor's degree education earn the least with $104,521. Women with an educational attainment of graduate degree earn the most with the average annual earnings of $62,443, while those with less than high school education have the smallest earnings of $23,718.
| Educational Attainment | Male Income | Female Income |
| Less than High School | - | - |
| High School Diploma | - | - |
| College or Associate's Degree | $106,824 | $46,919 |
| Bachelor's Degree | $104,521 | $47,750 |
| Graduate Degree | $175,069 | $62,443 |
| Total | $115,417 | $52,782 |
Family Income in Summerfield
Family Income Brackets in Summerfield
According to the Summerfield family income data, there are 1,235 families falling into the $200,000+ income range, which is the most common income bracket and makes up 39.5% of all families. Conversely, the $10,000 to $14,999 income bracket is the least frequent group with only 34 families (1.1%) belonging to this category.
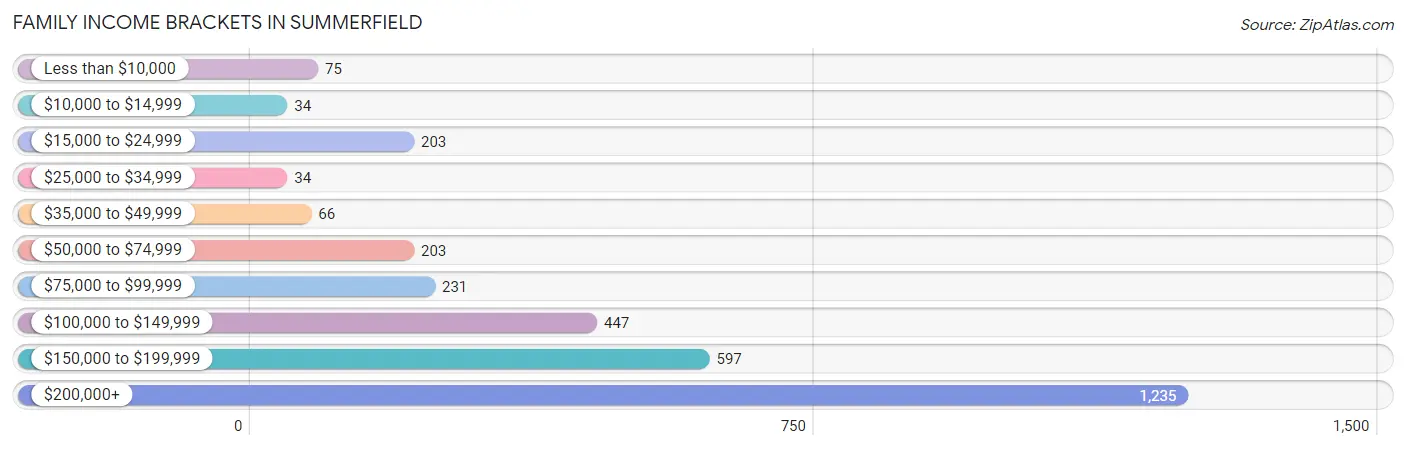
| Income Bracket | # Families | % Families |
| Less than $10,000 | 75 | 2.4% |
| $10,000 to $14,999 | 34 | 1.1% |
| $15,000 to $24,999 | 203 | 6.5% |
| $25,000 to $34,999 | 34 | 1.1% |
| $35,000 to $49,999 | 66 | 2.1% |
| $50,000 to $74,999 | 203 | 6.5% |
| $75,000 to $99,999 | 231 | 7.4% |
| $100,000 to $149,999 | 447 | 14.3% |
| $150,000 to $199,999 | 597 | 19.1% |
| $200,000+ | 1,235 | 39.5% |
Family Income by Famaliy Size in Summerfield
7+ person families (16 | 0.5%) account for the highest median family income in Summerfield with $250,001 per family, while 3-person families (653 | 20.9%) have the highest median income of $73,324 per family member.
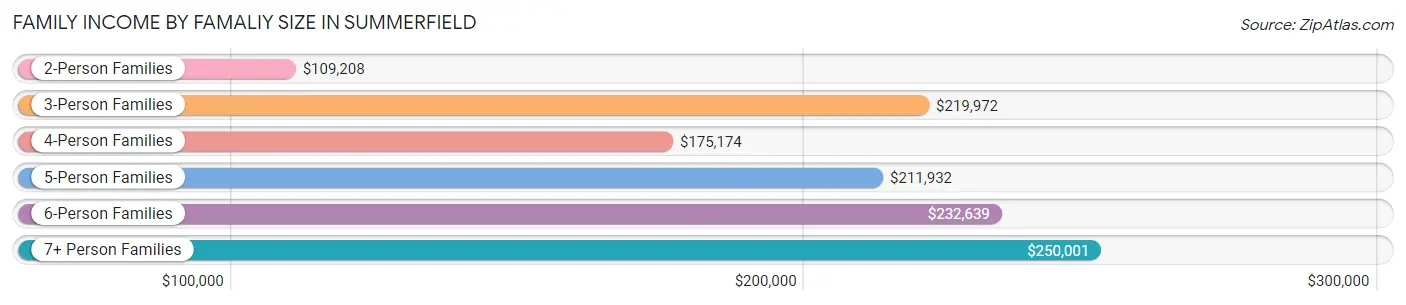
| Income Bracket | # Families | Median Income |
| 2-Person Families | 1,489 (47.6%) | $109,208 |
| 3-Person Families | 653 (20.9%) | $219,972 |
| 4-Person Families | 640 (20.5%) | $175,174 |
| 5-Person Families | 287 (9.2%) | $211,932 |
| 6-Person Families | 41 (1.3%) | $232,639 |
| 7+ Person Families | 16 (0.5%) | $250,001 |
| Total | 3,126 (100.0%) | $169,597 |
Family Income by Number of Earners in Summerfield
The median family income in Summerfield is $169,597, with families comprising 3+ earners (469) having the highest median family income of $224,353, while families with no earners (506) have the lowest median family income of $88,426, accounting for 15.0% and 16.2% of families, respectively.
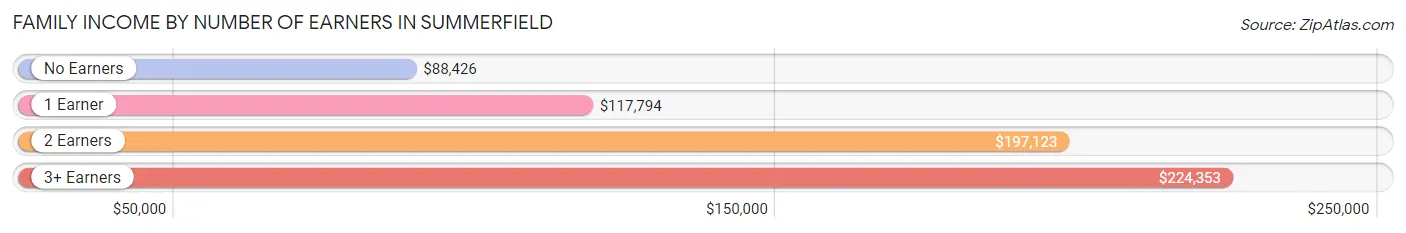
| Number of Earners | # Families | Median Income |
| No Earners | 506 (16.2%) | $88,426 |
| 1 Earner | 814 (26.0%) | $117,794 |
| 2 Earners | 1,337 (42.8%) | $197,123 |
| 3+ Earners | 469 (15.0%) | $224,353 |
| Total | 3,126 (100.0%) | $169,597 |
Household Income in Summerfield
Household Income Brackets in Summerfield
With 1,306 households falling in the category, the $200,000+ income range is the most frequent in Summerfield, accounting for 33.4% of all households. In contrast, only 98 households (2.5%) fall into the $10,000 to $14,999 income bracket, making it the least populous group.
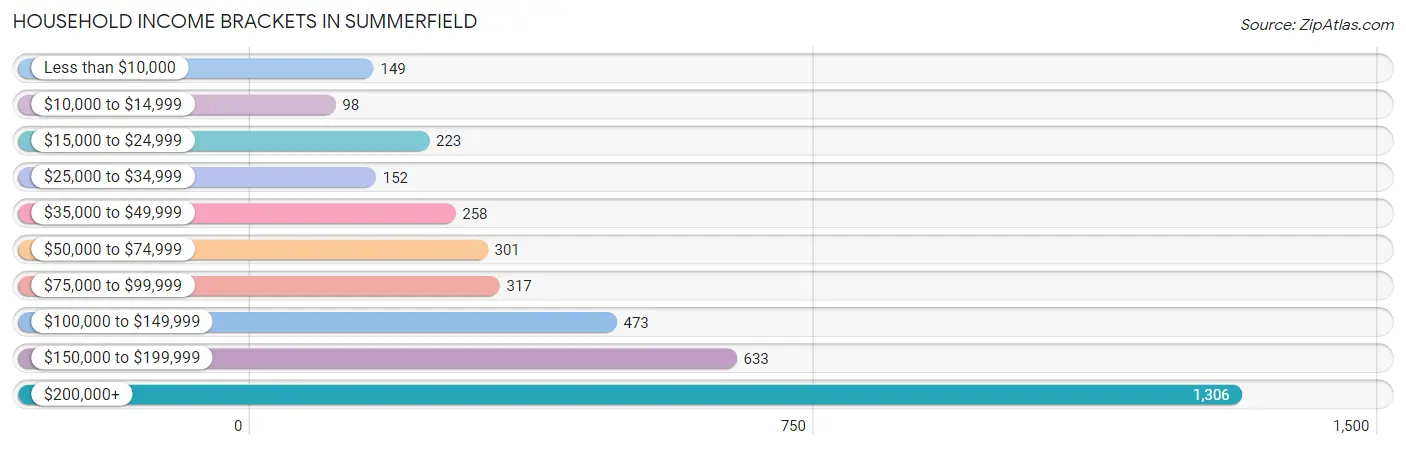
| Income Bracket | # Households | % Households |
| Less than $10,000 | 149 | 3.8% |
| $10,000 to $14,999 | 98 | 2.5% |
| $15,000 to $24,999 | 223 | 5.7% |
| $25,000 to $34,999 | 152 | 3.9% |
| $35,000 to $49,999 | 258 | 6.6% |
| $50,000 to $74,999 | 301 | 7.7% |
| $75,000 to $99,999 | 317 | 8.1% |
| $100,000 to $149,999 | 473 | 12.1% |
| $150,000 to $199,999 | 633 | 16.2% |
| $200,000+ | 1,306 | 33.4% |
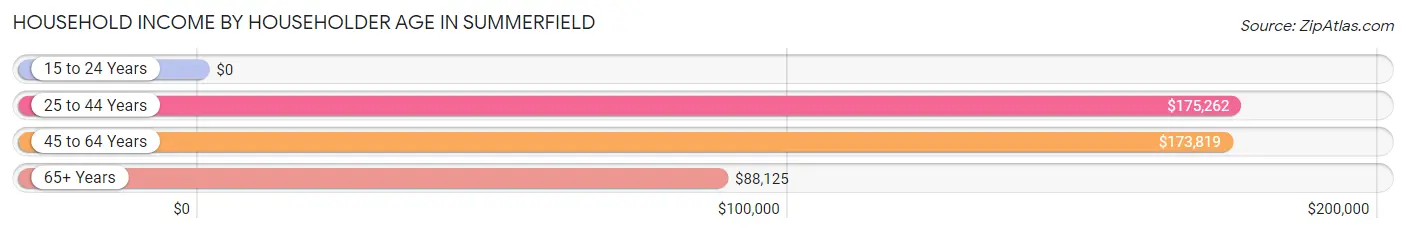
Household Income by Householder Age in Summerfield
The median household income in Summerfield is $148,182, with the highest median household income of $175,262 found in the 25 to 44 years age bracket for the primary householder. A total of 857 households (21.9%) fall into this category.
| Income Bracket | # Households | Median Income |
| 15 to 24 Years | 0 (0.0%) | $0 |
| 25 to 44 Years | 857 (21.9%) | $175,262 |
| 45 to 64 Years | 2,053 (52.5%) | $173,819 |
| 65+ Years | 1,000 (25.6%) | $88,125 |
| Total | 3,910 (100.0%) | $148,182 |
Poverty in Summerfield
Income Below Poverty by Sex and Age in Summerfield
With 6.6% poverty level for males and 11.5% for females among the residents of Summerfield, 12 to 14 year old males and under 5 year old females are the most vulnerable to poverty, with 59 males (30.9%) and 185 females (48.8%) in their respective age groups living below the poverty level.
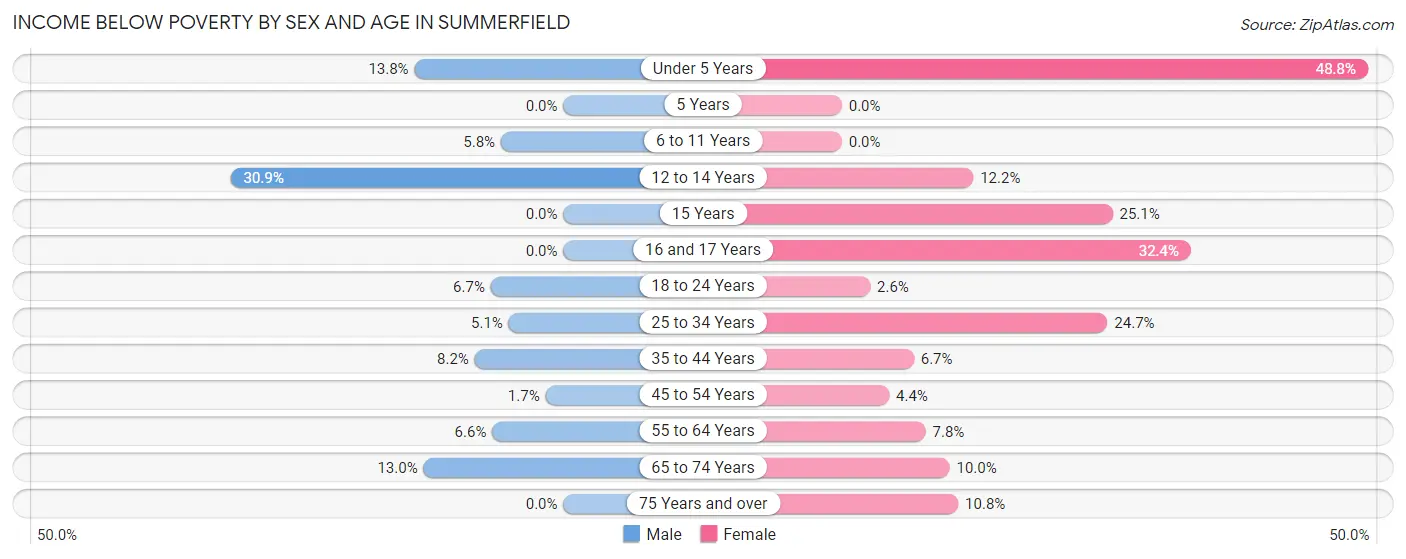
| Age Bracket | Male | Female |
| Under 5 Years | 30 (13.8%) | 185 (48.8%) |
| 5 Years | 0 (0.0%) | 0 (0.0%) |
| 6 to 11 Years | 27 (5.8%) | 0 (0.0%) |
| 12 to 14 Years | 59 (30.9%) | 35 (12.2%) |
| 15 Years | 0 (0.0%) | 48 (25.1%) |
| 16 and 17 Years | 0 (0.0%) | 23 (32.4%) |
| 18 to 24 Years | 26 (6.7%) | 15 (2.6%) |
| 25 to 34 Years | 17 (5.1%) | 106 (24.6%) |
| 35 to 44 Years | 46 (8.2%) | 50 (6.7%) |
| 45 to 54 Years | 16 (1.7%) | 50 (4.4%) |
| 55 to 64 Years | 65 (6.6%) | 61 (7.8%) |
| 65 to 74 Years | 58 (13.0%) | 52 (10.0%) |
| 75 Years and over | 0 (0.0%) | 43 (10.8%) |
| Total | 344 (6.6%) | 668 (11.5%) |
Income Above Poverty by Sex and Age in Summerfield
According to the poverty statistics in Summerfield, males aged 5 years and females aged 5 years are the age groups that are most secure financially, with 100.0% of males and 100.0% of females in these age groups living above the poverty line.
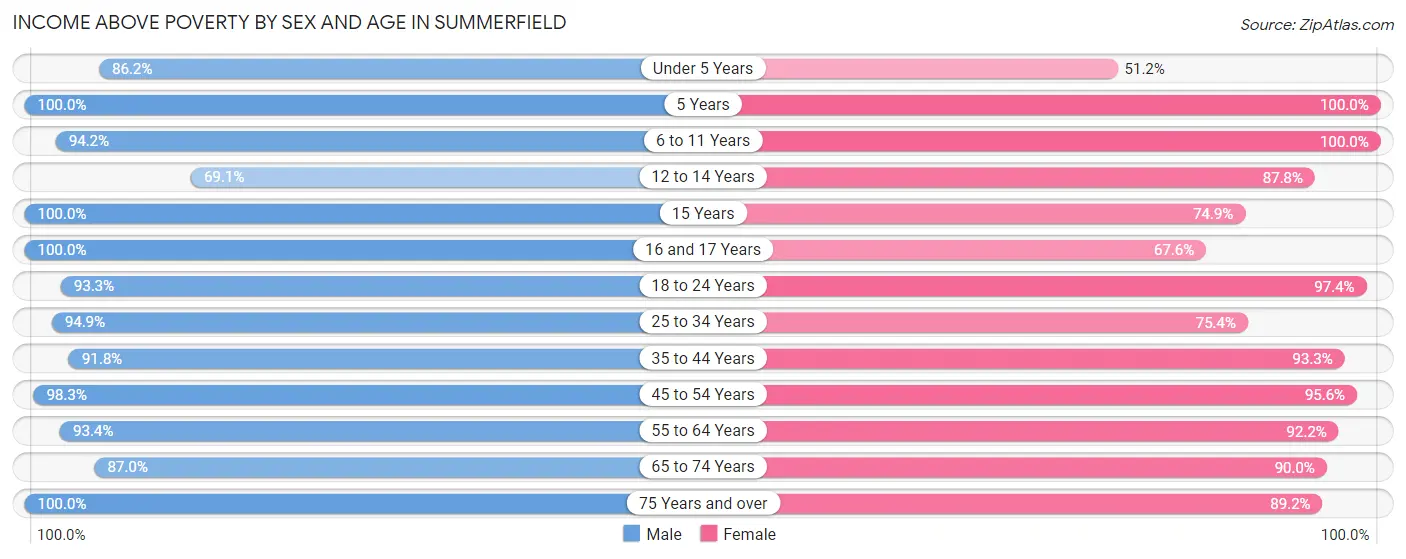
| Age Bracket | Male | Female |
| Under 5 Years | 187 (86.2%) | 194 (51.2%) |
| 5 Years | 36 (100.0%) | 12 (100.0%) |
| 6 to 11 Years | 439 (94.2%) | 260 (100.0%) |
| 12 to 14 Years | 132 (69.1%) | 252 (87.8%) |
| 15 Years | 121 (100.0%) | 143 (74.9%) |
| 16 and 17 Years | 220 (100.0%) | 48 (67.6%) |
| 18 to 24 Years | 360 (93.3%) | 555 (97.4%) |
| 25 to 34 Years | 318 (94.9%) | 324 (75.3%) |
| 35 to 44 Years | 513 (91.8%) | 698 (93.3%) |
| 45 to 54 Years | 947 (98.3%) | 1,089 (95.6%) |
| 55 to 64 Years | 920 (93.4%) | 723 (92.2%) |
| 65 to 74 Years | 389 (87.0%) | 468 (90.0%) |
| 75 Years and over | 267 (100.0%) | 355 (89.2%) |
| Total | 4,849 (93.4%) | 5,121 (88.5%) |
Income Below Poverty Among Married-Couple Families in Summerfield
The poverty statistics for married-couple families in Summerfield show that 4.1% or 110 of the total 2,703 families live below the poverty line. Families with 3 or 4 children have the highest poverty rate of 19.2%, comprising of 36 families. On the other hand, families with 5 or more children have the lowest poverty rate of 0.0%, which includes 0 families.
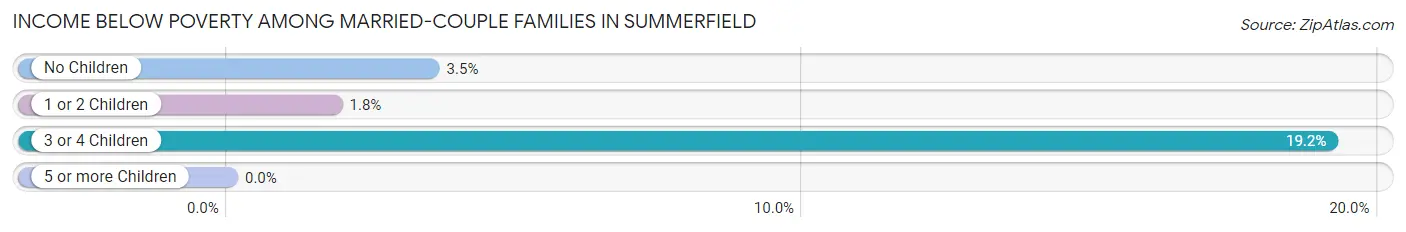
| Children | Above Poverty | Below Poverty |
| No Children | 1,622 (96.5%) | 59 (3.5%) |
| 1 or 2 Children | 807 (98.2%) | 15 (1.8%) |
| 3 or 4 Children | 152 (80.8%) | 36 (19.2%) |
| 5 or more Children | 12 (100.0%) | 0 (0.0%) |
| Total | 2,593 (95.9%) | 110 (4.1%) |
Income Below Poverty Among Single-Parent Households in Summerfield
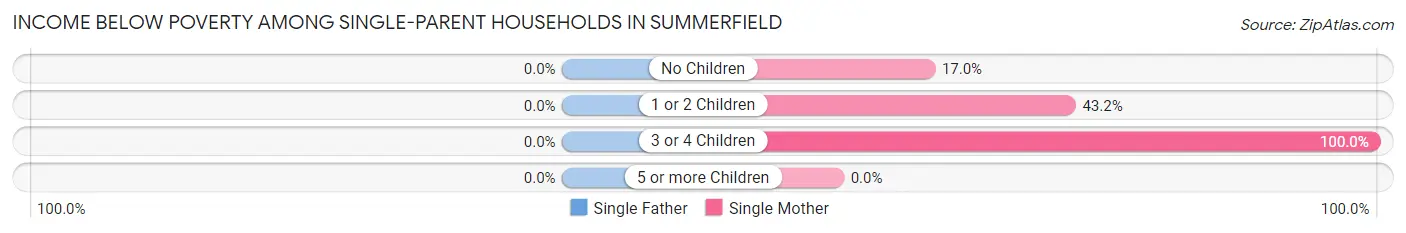
| Children | Single Father | Single Mother |
| No Children | 0 (0.0%) | 17 (17.0%) |
| 1 or 2 Children | 0 (0.0%) | 95 (43.2%) |
| 3 or 4 Children | 0 (0.0%) | 39 (100.0%) |
| 5 or more Children | 0 (0.0%) | 0 (0.0%) |
| Total | 0 (0.0%) | 151 (42.1%) |
Income Below Poverty Among Married-Couple vs Single-Parent Households in Summerfield
The poverty data for Summerfield shows that 110 of the married-couple family households (4.1%) and 151 of the single-parent households (35.7%) are living below the poverty level. Within the married-couple family households, those with 3 or 4 children have the highest poverty rate, with 36 households (19.2%) falling below the poverty line. Among the single-parent households, those with 3 or 4 children have the highest poverty rate, with 39 household (100.0%) living below poverty.
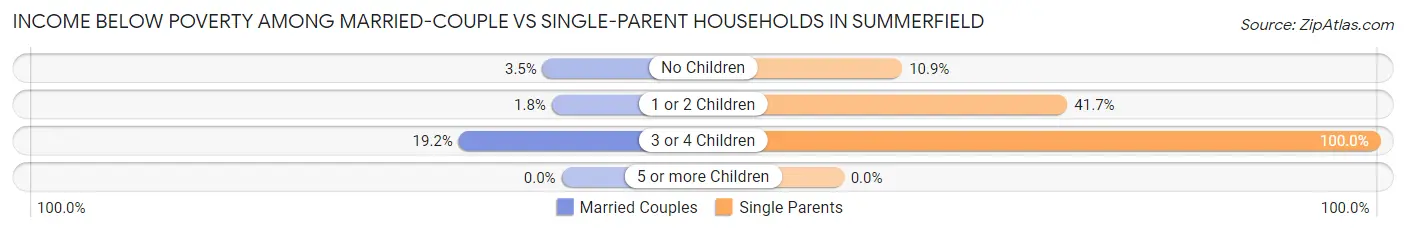
| Children | Married-Couple Families | Single-Parent Households |
| No Children | 59 (3.5%) | 17 (10.9%) |
| 1 or 2 Children | 15 (1.8%) | 95 (41.7%) |
| 3 or 4 Children | 36 (19.2%) | 39 (100.0%) |
| 5 or more Children | 0 (0.0%) | 0 (0.0%) |
| Total | 110 (4.1%) | 151 (35.7%) |
Race in Summerfield
The most populous races in Summerfield are White / Caucasian (9,262 | 84.3%), Hispanic or Latino (577 | 5.2%), and Black / African American (560 | 5.1%).
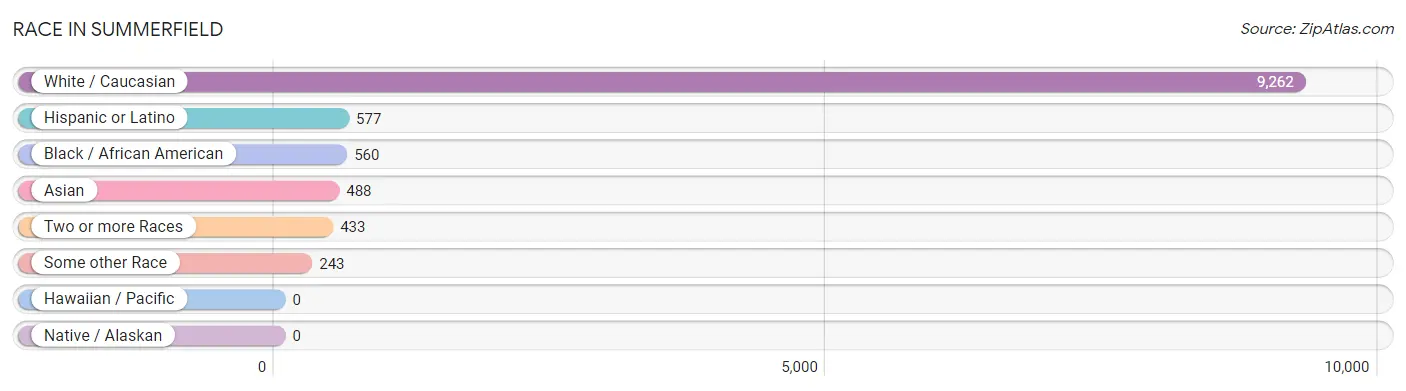
| Race | # Population | % Population |
| Asian | 488 | 4.4% |
| Black / African American | 560 | 5.1% |
| Hawaiian / Pacific | 0 | 0.0% |
| Hispanic or Latino | 577 | 5.2% |
| Native / Alaskan | 0 | 0.0% |
| White / Caucasian | 9,262 | 84.3% |
| Two or more Races | 433 | 3.9% |
| Some other Race | 243 | 2.2% |
| Total | 10,986 | 100.0% |
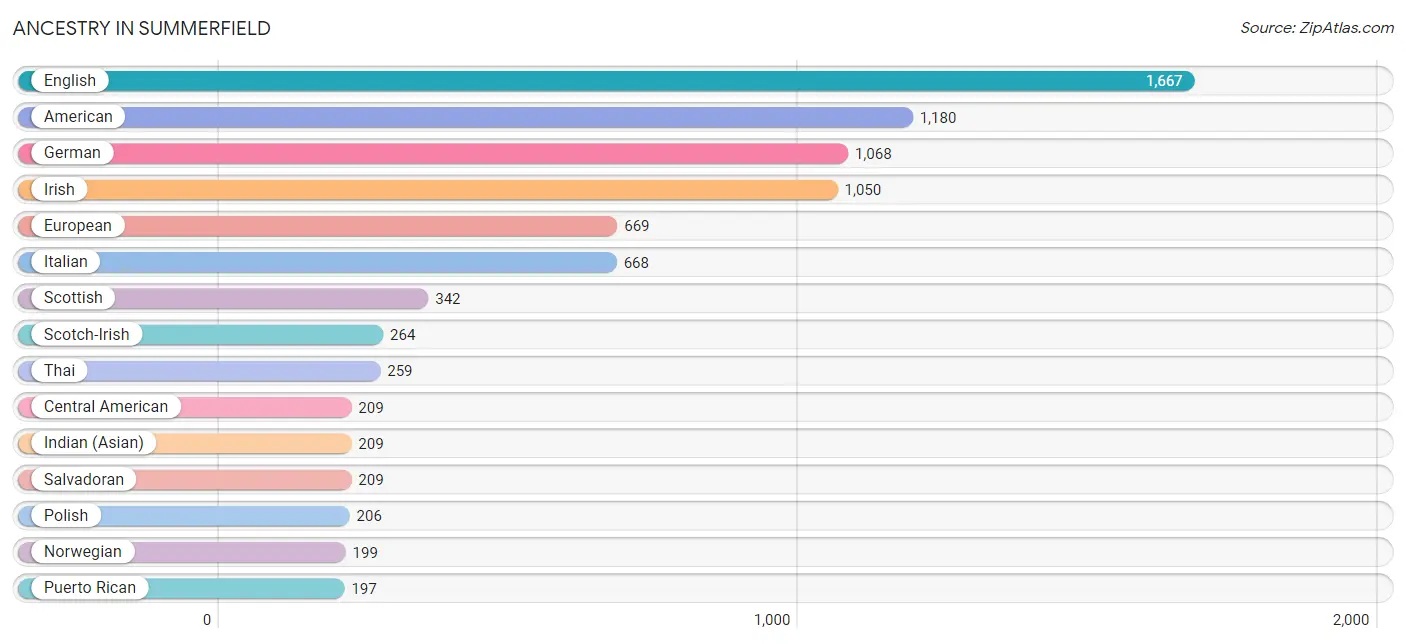
Ancestry in Summerfield
The most populous ancestries reported in Summerfield are English (1,667 | 15.2%), American (1,180 | 10.7%), German (1,068 | 9.7%), Irish (1,050 | 9.6%), and European (669 | 6.1%), together accounting for 51.3% of all Summerfield residents.
| Ancestry | # Population | % Population |
| African | 90 | 0.8% |
| Alsatian | 19 | 0.2% |
| American | 1,180 | 10.7% |
| Arab | 107 | 1.0% |
| Austrian | 9 | 0.1% |
| Belgian | 5 | 0.1% |
| Blackfeet | 52 | 0.5% |
| British | 92 | 0.8% |
| Canadian | 16 | 0.2% |
| Central American | 209 | 1.9% |
| Cherokee | 59 | 0.5% |
| Czech | 42 | 0.4% |
| Czechoslovakian | 13 | 0.1% |
| Danish | 22 | 0.2% |
| Dutch | 167 | 1.5% |
| Eastern European | 152 | 1.4% |
| English | 1,667 | 15.2% |
| European | 669 | 6.1% |
| French | 149 | 1.4% |
| French Canadian | 111 | 1.0% |
| German | 1,068 | 9.7% |
| Hungarian | 105 | 1.0% |
| Indian (Asian) | 209 | 1.9% |
| Irish | 1,050 | 9.6% |
| Italian | 668 | 6.1% |
| Latvian | 6 | 0.1% |
| Lebanese | 95 | 0.9% |
| Lithuanian | 16 | 0.2% |
| Malaysian | 14 | 0.1% |
| Mexican | 119 | 1.1% |
| Norwegian | 199 | 1.8% |
| Palestinian | 12 | 0.1% |
| Polish | 206 | 1.9% |
| Portuguese | 40 | 0.4% |
| Puerto Rican | 197 | 1.8% |
| Romanian | 33 | 0.3% |
| Russian | 43 | 0.4% |
| Salvadoran | 209 | 1.9% |
| Scandinavian | 36 | 0.3% |
| Scotch-Irish | 264 | 2.4% |
| Scottish | 342 | 3.1% |
| Serbian | 14 | 0.1% |
| Slovak | 38 | 0.4% |
| Slovene | 37 | 0.3% |
| South American | 23 | 0.2% |
| Spaniard | 29 | 0.3% |
| Sri Lankan | 77 | 0.7% |
| Subsaharan African | 90 | 0.8% |
| Swedish | 48 | 0.4% |
| Swiss | 24 | 0.2% |
| Thai | 259 | 2.4% |
| Turkish | 10 | 0.1% |
| Welsh | 23 | 0.2% | View All 53 Rows |
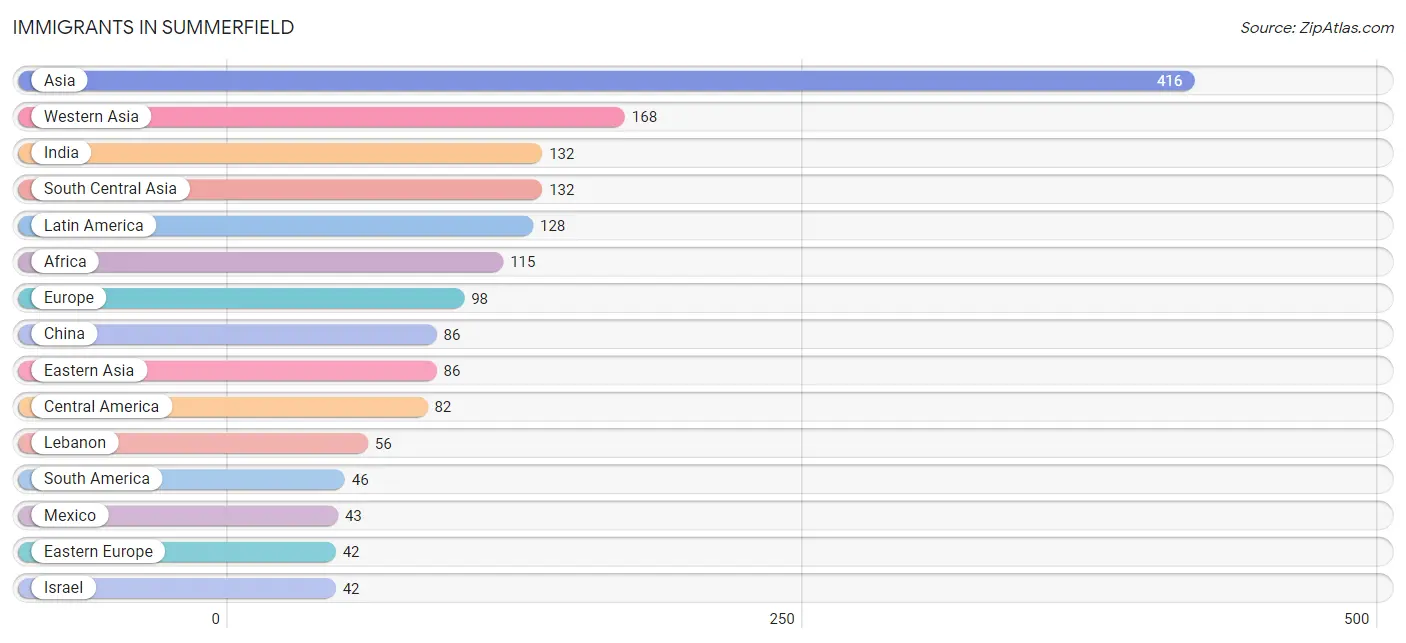
Immigrants in Summerfield
The most numerous immigrant groups reported in Summerfield came from Asia (416 | 3.8%), Western Asia (168 | 1.5%), India (132 | 1.2%), South Central Asia (132 | 1.2%), and Latin America (128 | 1.2%), together accounting for 8.9% of all Summerfield residents.
| Immigration Origin | # Population | % Population |
| Africa | 115 | 1.1% |
| Asia | 416 | 3.8% |
| Brazil | 23 | 0.2% |
| Canada | 35 | 0.3% |
| Central America | 82 | 0.7% |
| China | 86 | 0.8% |
| Eastern Asia | 86 | 0.8% |
| Eastern Europe | 42 | 0.4% |
| El Salvador | 39 | 0.4% |
| Europe | 98 | 0.9% |
| Germany | 6 | 0.1% |
| Guyana | 23 | 0.2% |
| India | 132 | 1.2% |
| Israel | 42 | 0.4% |
| Italy | 10 | 0.1% |
| Kuwait | 13 | 0.1% |
| Laos | 14 | 0.1% |
| Latin America | 128 | 1.2% |
| Lebanon | 56 | 0.5% |
| Mexico | 43 | 0.4% |
| Northern Europe | 26 | 0.2% |
| Romania | 22 | 0.2% |
| Russia | 20 | 0.2% |
| Saudi Arabia | 13 | 0.1% |
| South America | 46 | 0.4% |
| South Central Asia | 132 | 1.2% |
| South Eastern Asia | 30 | 0.3% |
| Southern Europe | 24 | 0.2% |
| Spain | 14 | 0.1% |
| Turkey | 32 | 0.3% |
| Vietnam | 16 | 0.2% |
| Western Asia | 168 | 1.5% |
| Western Europe | 6 | 0.1% | View All 33 Rows |
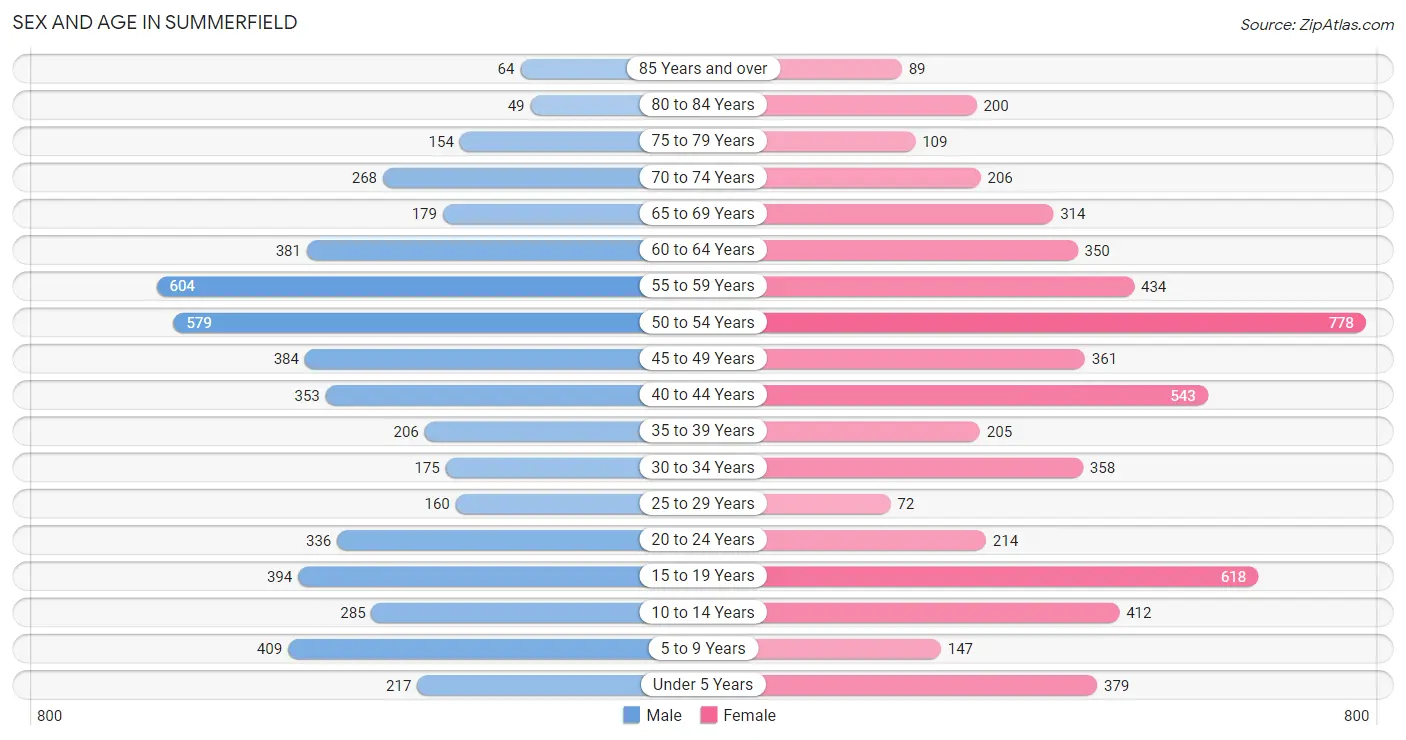
Sex and Age in Summerfield
Sex and Age in Summerfield
The most populous age groups in Summerfield are 55 to 59 Years (604 | 11.6%) for men and 50 to 54 Years (778 | 13.4%) for women.
| Age Bracket | Male | Female |
| Under 5 Years | 217 (4.2%) | 379 (6.6%) |
| 5 to 9 Years | 409 (7.9%) | 147 (2.5%) |
| 10 to 14 Years | 285 (5.5%) | 412 (7.1%) |
| 15 to 19 Years | 394 (7.6%) | 618 (10.7%) |
| 20 to 24 Years | 336 (6.5%) | 214 (3.7%) |
| 25 to 29 Years | 160 (3.1%) | 72 (1.2%) |
| 30 to 34 Years | 175 (3.4%) | 358 (6.2%) |
| 35 to 39 Years | 206 (4.0%) | 205 (3.5%) |
| 40 to 44 Years | 353 (6.8%) | 543 (9.4%) |
| 45 to 49 Years | 384 (7.4%) | 361 (6.2%) |
| 50 to 54 Years | 579 (11.1%) | 778 (13.4%) |
| 55 to 59 Years | 604 (11.6%) | 434 (7.5%) |
| 60 to 64 Years | 381 (7.3%) | 350 (6.0%) |
| 65 to 69 Years | 179 (3.4%) | 314 (5.4%) |
| 70 to 74 Years | 268 (5.2%) | 206 (3.6%) |
| 75 to 79 Years | 154 (3.0%) | 109 (1.9%) |
| 80 to 84 Years | 49 (0.9%) | 200 (3.5%) |
| 85 Years and over | 64 (1.2%) | 89 (1.5%) |
| Total | 5,197 (100.0%) | 5,789 (100.0%) |
Families and Households in Summerfield
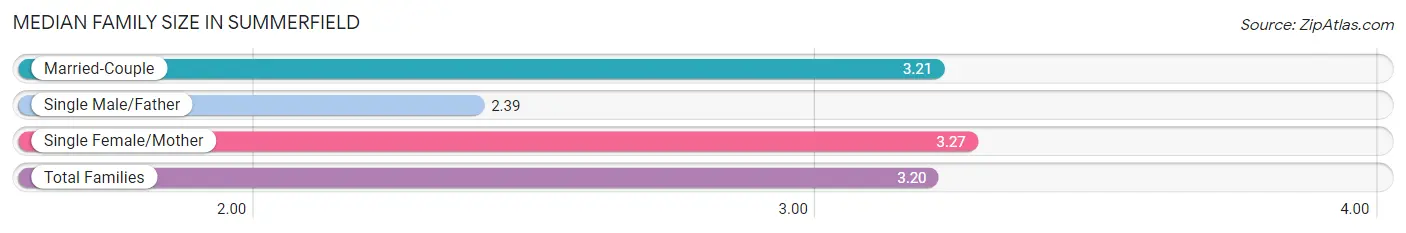
Median Family Size in Summerfield
The median family size in Summerfield is 3.20 persons per family, with single female/mother families (359 | 11.5%) accounting for the largest median family size of 3.27 persons per family. On the other hand, single male/father families (64 | 2.1%) represent the smallest median family size with 2.39 persons per family.
| Family Type | # Families | Family Size |
| Married-Couple | 2,703 (86.5%) | 3.21 |
| Single Male/Father | 64 (2.1%) | 2.39 |
| Single Female/Mother | 359 (11.5%) | 3.27 |
| Total Families | 3,126 (100.0%) | 3.20 |
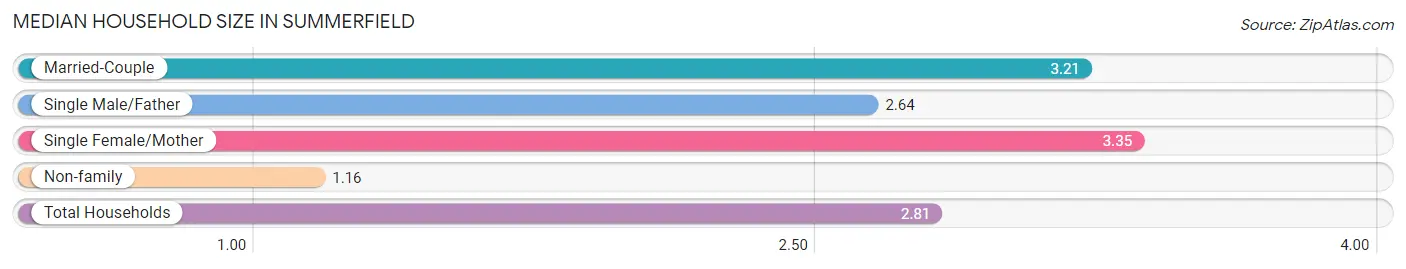
Median Household Size in Summerfield
The median household size in Summerfield is 2.81 persons per household, with single female/mother households (359 | 9.2%) accounting for the largest median household size of 3.35 persons per household. non-family households (784 | 20.1%) represent the smallest median household size with 1.16 persons per household.
| Household Type | # Households | Household Size |
| Married-Couple | 2,703 (69.1%) | 3.21 |
| Single Male/Father | 64 (1.6%) | 2.64 |
| Single Female/Mother | 359 (9.2%) | 3.35 |
| Non-family | 784 (20.1%) | 1.16 |
| Total Households | 3,910 (100.0%) | 2.81 |
Household Size by Marriage Status in Summerfield
Out of a total of 3,910 households in Summerfield, 3,126 (79.9%) are family households, while 784 (20.1%) are nonfamily households. The most numerous type of family households are 2-person households, comprising 1,476, and the most common type of nonfamily households are 1-person households, comprising 654.
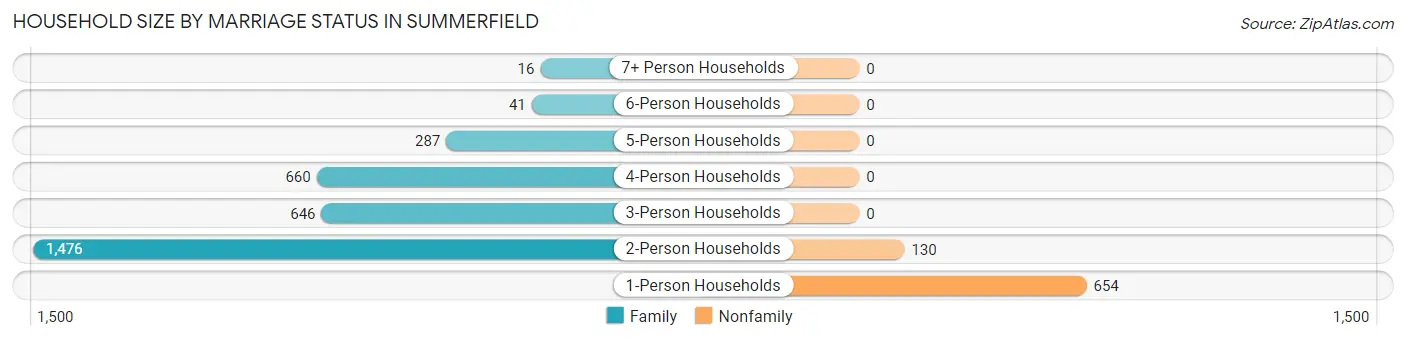
| Household Size | Family Households | Nonfamily Households |
| 1-Person Households | - | 654 (16.7%) |
| 2-Person Households | 1,476 (37.8%) | 130 (3.3%) |
| 3-Person Households | 646 (16.5%) | 0 (0.0%) |
| 4-Person Households | 660 (16.9%) | 0 (0.0%) |
| 5-Person Households | 287 (7.3%) | 0 (0.0%) |
| 6-Person Households | 41 (1.1%) | 0 (0.0%) |
| 7+ Person Households | 16 (0.4%) | 0 (0.0%) |
| Total | 3,126 (79.9%) | 784 (20.1%) |
Female Fertility in Summerfield
Fertility by Age in Summerfield
Average fertility rate in Summerfield is 43.0 births per 1,000 women. Women in the age bracket of 20 to 34 years have the highest fertility rate with 101.0 births per 1,000 women. Women in the age bracket of 20 to 34 years acount for 59.1% of all women with births.
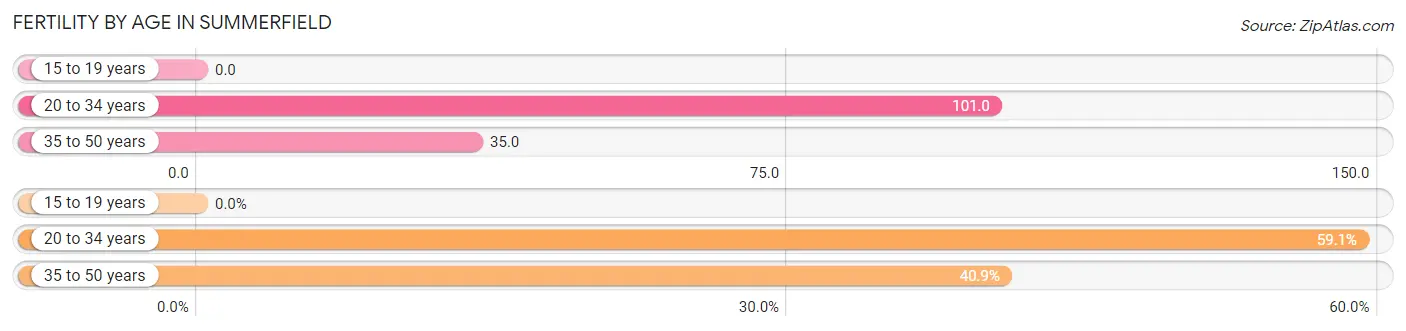
| Age Bracket | Women with Births | Births / 1,000 Women |
| 15 to 19 years | 0 (0.0%) | 0.0 |
| 20 to 34 years | 65 (59.1%) | 101.0 |
| 35 to 50 years | 45 (40.9%) | 35.0 |
| Total | 110 (100.0%) | 43.0 |
Fertility by Age by Marriage Status in Summerfield
64.5% of women with births (110) in Summerfield are married. The highest percentage of unmarried women with births falls into 20 to 34 years age bracket with 60.0% of them unmarried at the time of birth, while the lowest percentage of unmarried women with births belong to 35 to 50 years age bracket with 0.0% of them unmarried.
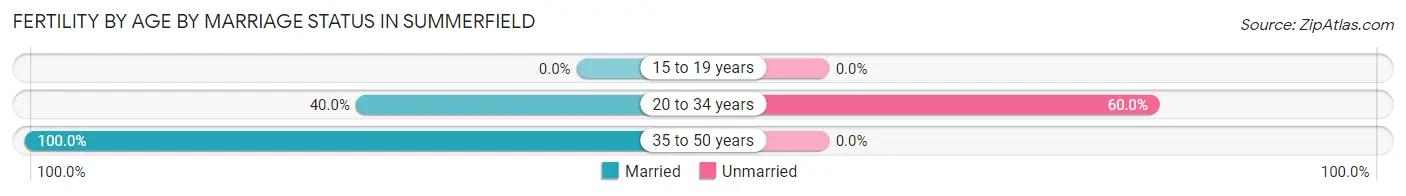
| Age Bracket | Married | Unmarried |
| 15 to 19 years | 0 (0.0%) | 0 (0.0%) |
| 20 to 34 years | 26 (40.0%) | 39 (60.0%) |
| 35 to 50 years | 45 (100.0%) | 0 (0.0%) |
| Total | 71 (64.5%) | 39 (35.4%) |
Fertility by Education in Summerfield
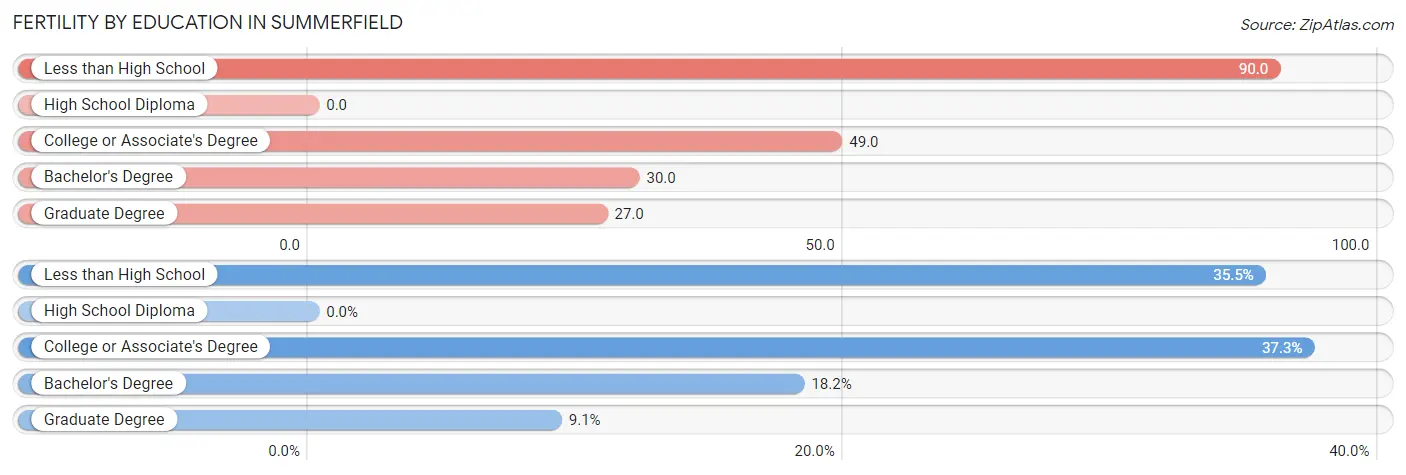
| Educational Attainment | Women with Births | Births / 1,000 Women |
| Less than High School | 39 (35.4%) | 90.0 |
| High School Diploma | 0 (0.0%) | 0.0 |
| College or Associate's Degree | 41 (37.3%) | 49.0 |
| Bachelor's Degree | 20 (18.2%) | 30.0 |
| Graduate Degree | 10 (9.1%) | 27.0 |
| Total | 110 (100.0%) | 43.0 |
Fertility by Education by Marriage Status in Summerfield
35.4% of women with births in Summerfield are unmarried. Women with the educational attainment of college or associate's degree are most likely to be married with 100.0% of them married at childbirth, while women with the educational attainment of less than high school are least likely to be married with 100.0% of them unmarried at childbirth.
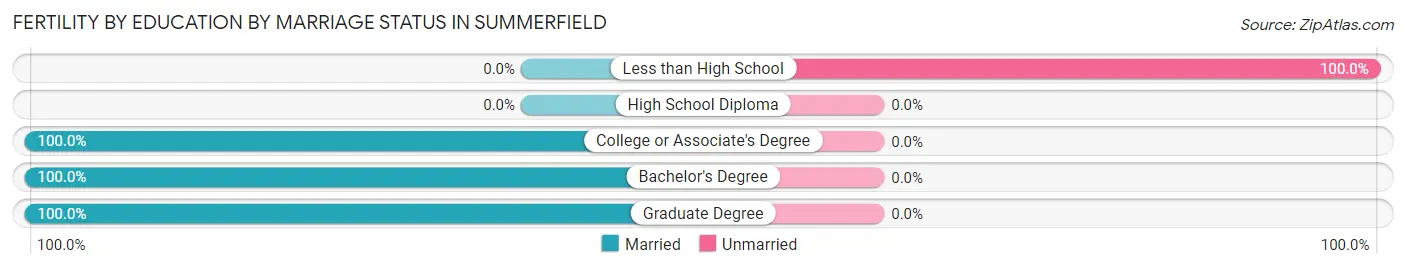
| Educational Attainment | Married | Unmarried |
| Less than High School | 0 (0.0%) | 39 (100.0%) |
| High School Diploma | 0 (0.0%) | 0 (0.0%) |
| College or Associate's Degree | 41 (100.0%) | 0 (0.0%) |
| Bachelor's Degree | 20 (100.0%) | 0 (0.0%) |
| Graduate Degree | 10 (100.0%) | 0 (0.0%) |
| Total | 71 (64.5%) | 39 (35.4%) |
Employment Characteristics in Summerfield
Employment by Class of Employer in Summerfield
Among the 5,233 employed individuals in Summerfield, private company employees (3,531 | 67.5%), self-employed (incorporated) (389 | 7.4%), and not-for-profit organizations (377 | 7.2%) make up the most common classes of employment.
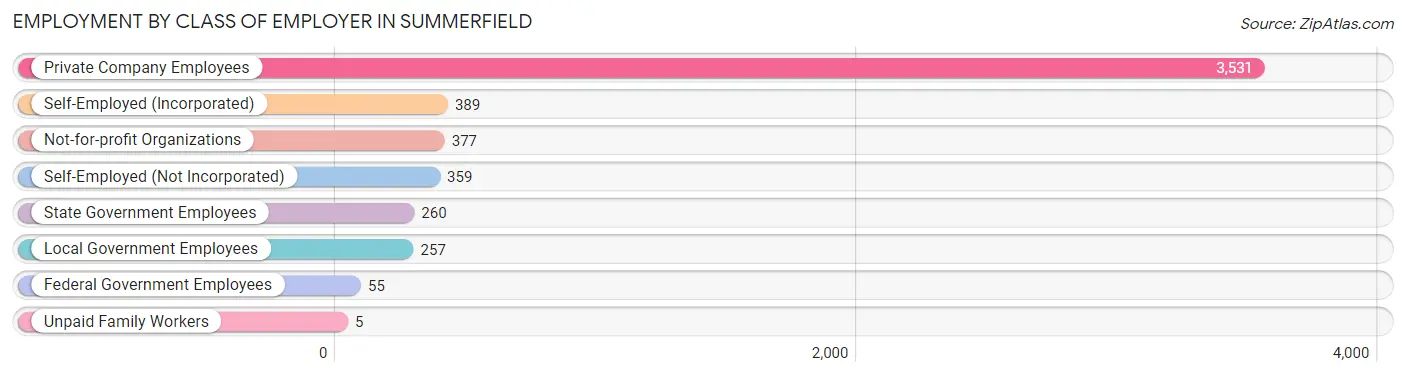
| Employer Class | # Employees | % Employees |
| Private Company Employees | 3,531 | 67.5% |
| Self-Employed (Incorporated) | 389 | 7.4% |
| Self-Employed (Not Incorporated) | 359 | 6.9% |
| Not-for-profit Organizations | 377 | 7.2% |
| Local Government Employees | 257 | 4.9% |
| State Government Employees | 260 | 5.0% |
| Federal Government Employees | 55 | 1.1% |
| Unpaid Family Workers | 5 | 0.1% |
| Total | 5,233 | 100.0% |
Employment Status by Age in Summerfield
According to the labor force statistics for Summerfield, out of the total population over 16 years of age (8,824), 62.6% or 5,524 individuals are in the labor force, with 2.9% or 160 of them unemployed. The age group with the highest labor force participation rate is 25 to 29 years, with 100.0% or 232 individuals in the labor force. Within the labor force, the 25 to 29 years age range has the highest percentage of unemployed individuals, with 10.3% or 24 of them being unemployed.
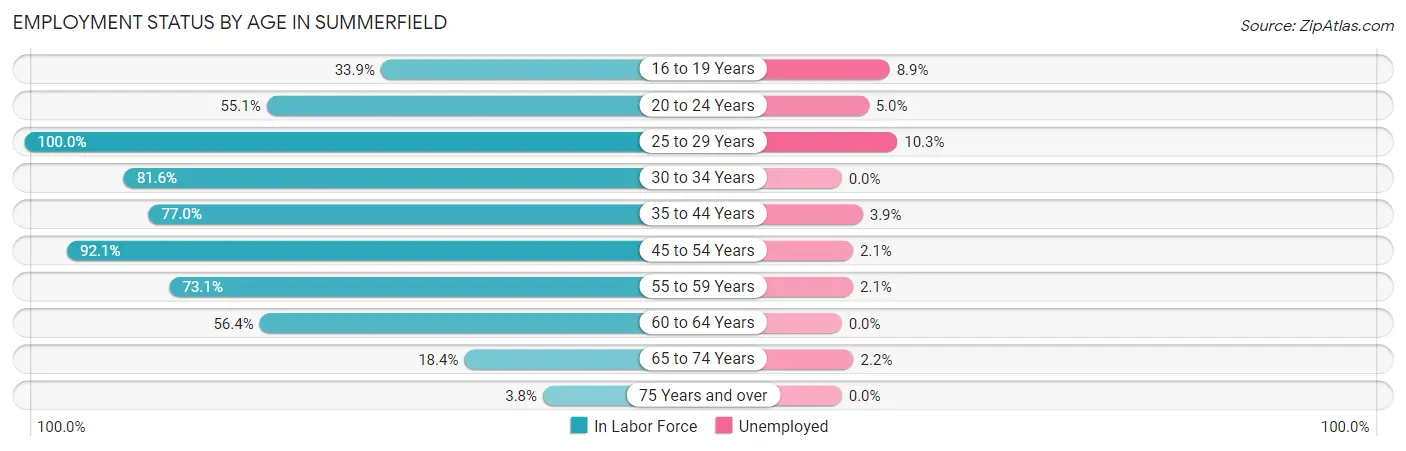
| Age Bracket | In Labor Force | Unemployed |
| 16 to 19 Years | 237 (33.9%) | 21 (8.9%) |
| 20 to 24 Years | 303 (55.1%) | 15 (5.0%) |
| 25 to 29 Years | 232 (100.0%) | 24 (10.3%) |
| 30 to 34 Years | 435 (81.6%) | 0 (0.0%) |
| 35 to 44 Years | 1,006 (77.0%) | 39 (3.9%) |
| 45 to 54 Years | 1,936 (92.1%) | 41 (2.1%) |
| 55 to 59 Years | 759 (73.1%) | 16 (2.1%) |
| 60 to 64 Years | 412 (56.4%) | 0 (0.0%) |
| 65 to 74 Years | 178 (18.4%) | 4 (2.2%) |
| 75 Years and over | 25 (3.8%) | 0 (0.0%) |
| Total | 5,524 (62.6%) | 160 (2.9%) |
Employment Status by Educational Attainment in Summerfield
According to labor force statistics for Summerfield, 80.4% of individuals (4,778) out of the total population between 25 and 64 years of age (5,943) are in the labor force, with 2.5% or 119 of them being unemployed. The group with the highest labor force participation rate are those with the educational attainment of bachelor's degree or higher, with 85.7% or 3,068 individuals in the labor force. Within the labor force, individuals with bachelor's degree or higher education have the highest percentage of unemployment, with 2.9% or 89 of them being unemployed.
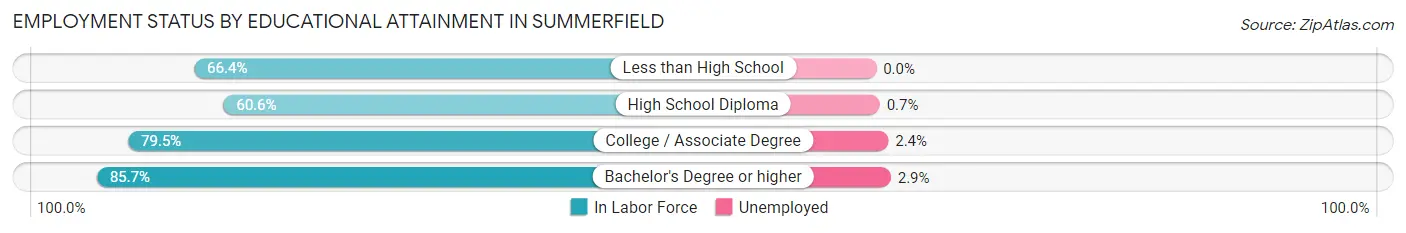
| Educational Attainment | In Labor Force | Unemployed |
| Less than High School | 160 (66.4%) | 0 (0.0%) |
| High School Diploma | 436 (60.6%) | 5 (0.7%) |
| College / Associate Degree | 1,115 (79.5%) | 34 (2.4%) |
| Bachelor's Degree or higher | 3,068 (85.7%) | 104 (2.9%) |
| Total | 4,778 (80.4%) | 149 (2.5%) |
Employment Occupations by Sex in Summerfield
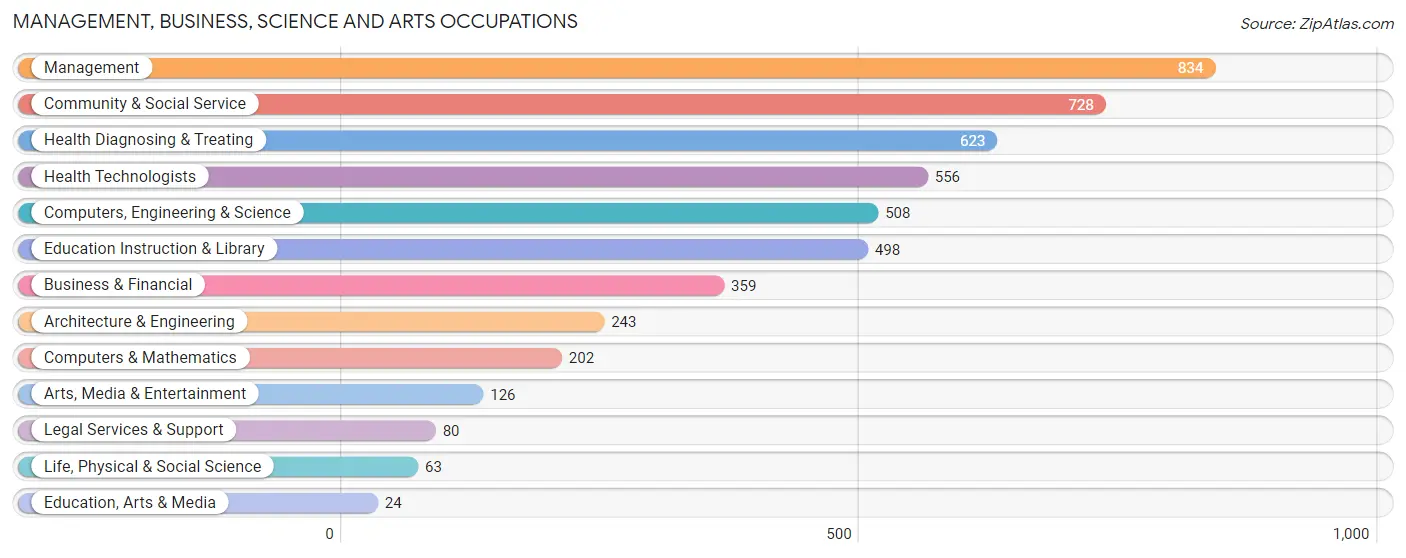
Management, Business, Science and Arts Occupations
The most common Management, Business, Science and Arts occupations in Summerfield are Management (834 | 15.5%), Community & Social Service (728 | 13.6%), Health Diagnosing & Treating (623 | 11.6%), Health Technologists (556 | 10.4%), and Computers, Engineering & Science (508 | 9.5%).
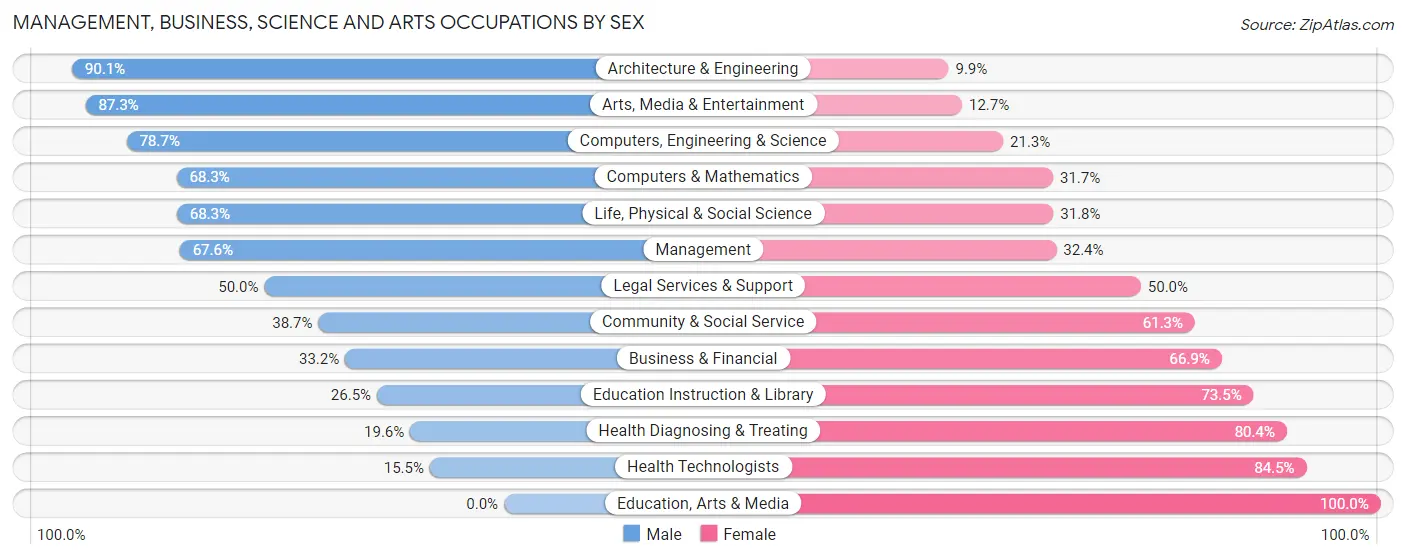
Management, Business, Science and Arts Occupations by Sex
Within the Management, Business, Science and Arts occupations in Summerfield, the most male-oriented occupations are Architecture & Engineering (90.1%), Arts, Media & Entertainment (87.3%), and Computers, Engineering & Science (78.7%), while the most female-oriented occupations are Education, Arts & Media (100.0%), Health Technologists (84.5%), and Health Diagnosing & Treating (80.4%).
| Occupation | Male | Female |
| Management | 564 (67.6%) | 270 (32.4%) |
| Business & Financial | 119 (33.2%) | 240 (66.8%) |
| Computers, Engineering & Science | 400 (78.7%) | 108 (21.3%) |
| Computers & Mathematics | 138 (68.3%) | 64 (31.7%) |
| Architecture & Engineering | 219 (90.1%) | 24 (9.9%) |
| Life, Physical & Social Science | 43 (68.2%) | 20 (31.8%) |
| Community & Social Service | 282 (38.7%) | 446 (61.3%) |
| Education, Arts & Media | 0 (0.0%) | 24 (100.0%) |
| Legal Services & Support | 40 (50.0%) | 40 (50.0%) |
| Education Instruction & Library | 132 (26.5%) | 366 (73.5%) |
| Arts, Media & Entertainment | 110 (87.3%) | 16 (12.7%) |
| Health Diagnosing & Treating | 122 (19.6%) | 501 (80.4%) |
| Health Technologists | 86 (15.5%) | 470 (84.5%) |
| Total (Category) | 1,487 (48.7%) | 1,565 (51.3%) |
| Total (Overall) | 2,744 (51.2%) | 2,620 (48.8%) |
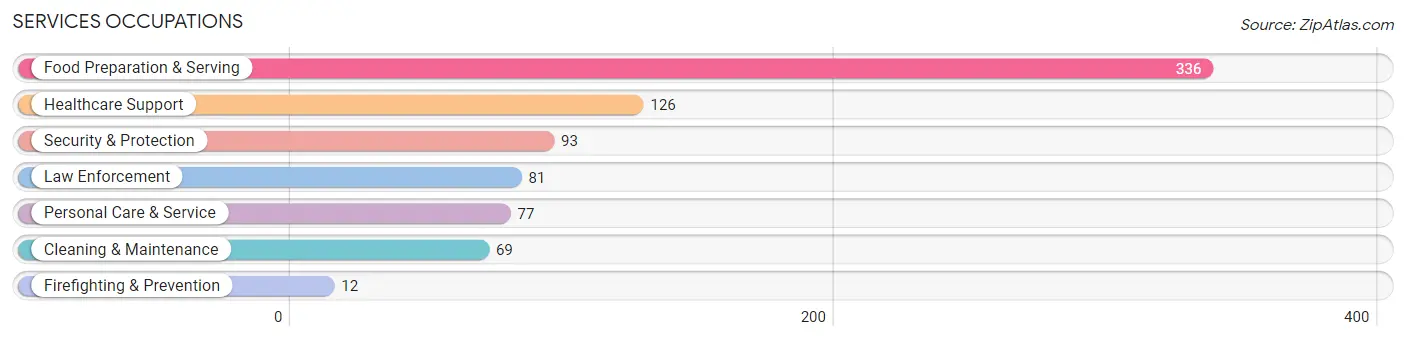
Services Occupations
The most common Services occupations in Summerfield are Food Preparation & Serving (336 | 6.3%), Healthcare Support (126 | 2.4%), Security & Protection (93 | 1.7%), Law Enforcement (81 | 1.5%), and Personal Care & Service (77 | 1.4%).
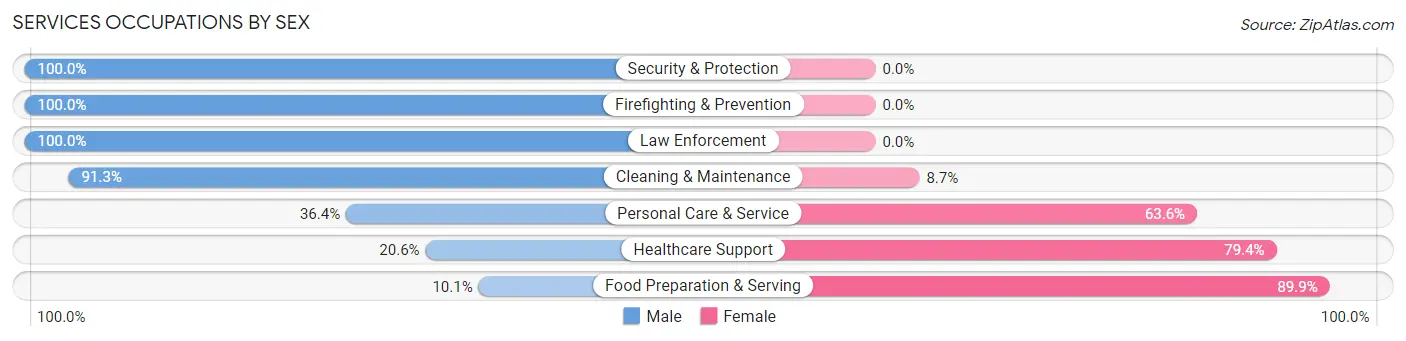
Services Occupations by Sex
Within the Services occupations in Summerfield, the most male-oriented occupations are Security & Protection (100.0%), Firefighting & Prevention (100.0%), and Law Enforcement (100.0%), while the most female-oriented occupations are Food Preparation & Serving (89.9%), Healthcare Support (79.4%), and Personal Care & Service (63.6%).
| Occupation | Male | Female |
| Healthcare Support | 26 (20.6%) | 100 (79.4%) |
| Security & Protection | 93 (100.0%) | 0 (0.0%) |
| Firefighting & Prevention | 12 (100.0%) | 0 (0.0%) |
| Law Enforcement | 81 (100.0%) | 0 (0.0%) |
| Food Preparation & Serving | 34 (10.1%) | 302 (89.9%) |
| Cleaning & Maintenance | 63 (91.3%) | 6 (8.7%) |
| Personal Care & Service | 28 (36.4%) | 49 (63.6%) |
| Total (Category) | 244 (34.8%) | 457 (65.2%) |
| Total (Overall) | 2,744 (51.2%) | 2,620 (48.8%) |
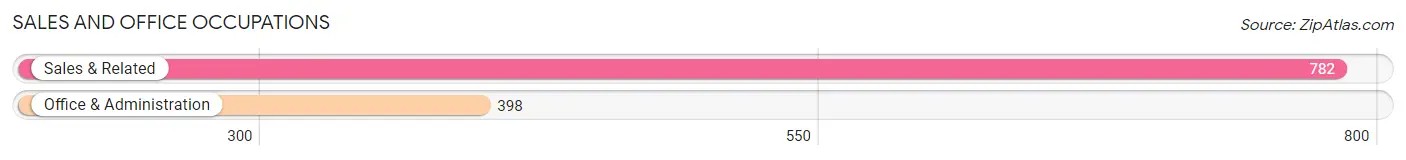
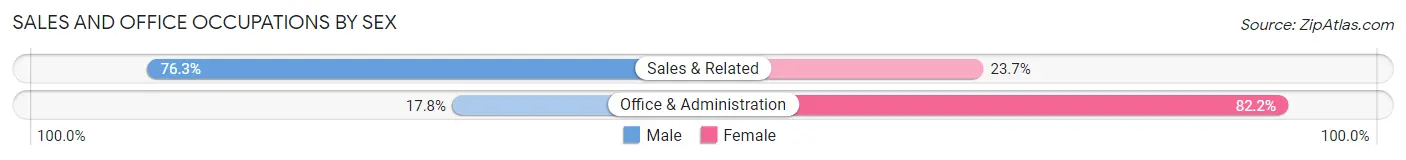
Sales and Office Occupations
The most common Sales and Office occupations in Summerfield are Sales & Related (782 | 14.6%), and Office & Administration (398 | 7.4%).
Sales and Office Occupations by Sex
| Occupation | Male | Female |
| Sales & Related | 597 (76.3%) | 185 (23.7%) |
| Office & Administration | 71 (17.8%) | 327 (82.2%) |
| Total (Category) | 668 (56.6%) | 512 (43.4%) |
| Total (Overall) | 2,744 (51.2%) | 2,620 (48.8%) |
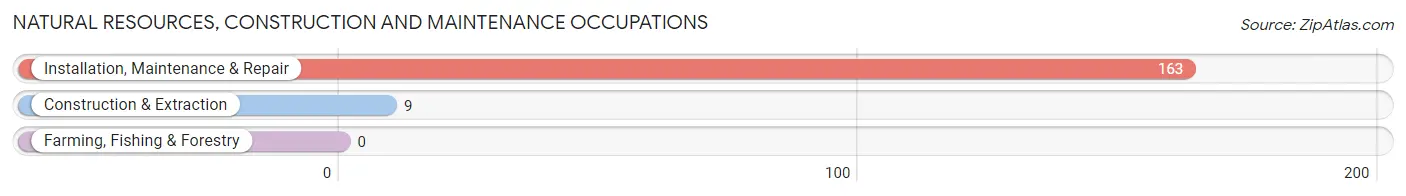
Natural Resources, Construction and Maintenance Occupations
The most common Natural Resources, Construction and Maintenance occupations in Summerfield are Installation, Maintenance & Repair (163 | 3.0%), and Construction & Extraction (9 | 0.2%).
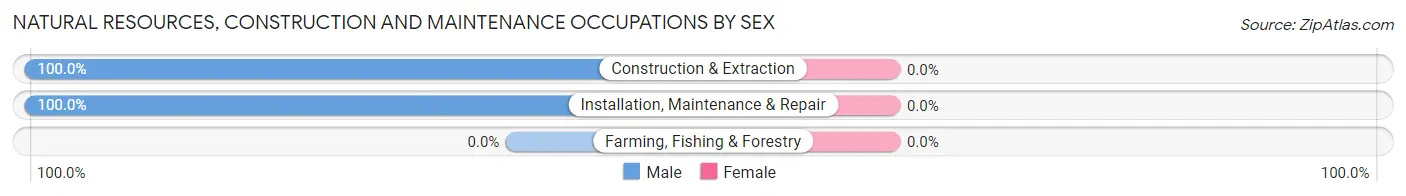
Natural Resources, Construction and Maintenance Occupations by Sex
| Occupation | Male | Female |
| Farming, Fishing & Forestry | 0 (0.0%) | 0 (0.0%) |
| Construction & Extraction | 9 (100.0%) | 0 (0.0%) |
| Installation, Maintenance & Repair | 163 (100.0%) | 0 (0.0%) |
| Total (Category) | 172 (100.0%) | 0 (0.0%) |
| Total (Overall) | 2,744 (51.2%) | 2,620 (48.8%) |
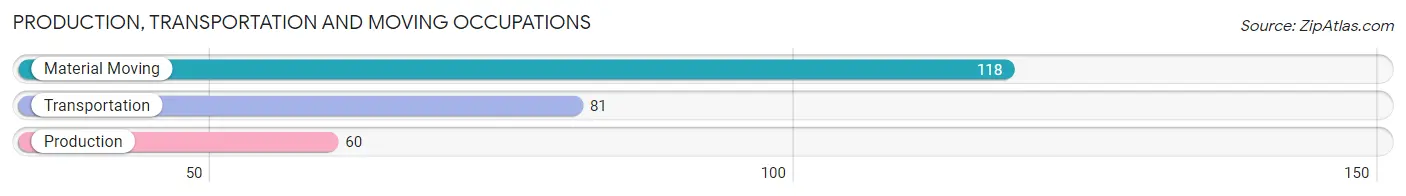
Production, Transportation and Moving Occupations
The most common Production, Transportation and Moving occupations in Summerfield are Material Moving (118 | 2.2%), Transportation (81 | 1.5%), and Production (60 | 1.1%).
Production, Transportation and Moving Occupations by Sex
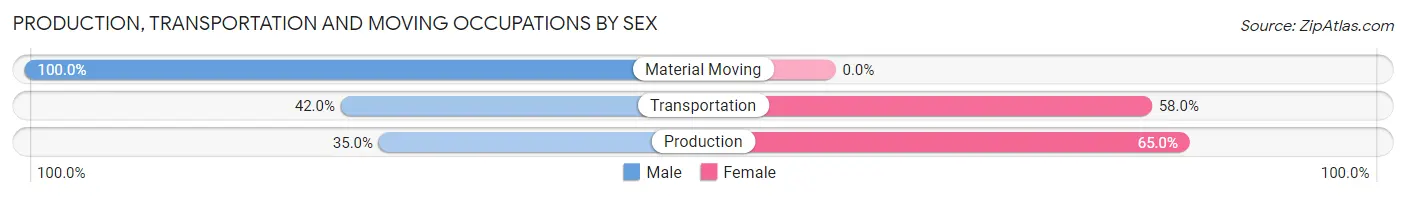
| Occupation | Male | Female |
| Production | 21 (35.0%) | 39 (65.0%) |
| Transportation | 34 (42.0%) | 47 (58.0%) |
| Material Moving | 118 (100.0%) | 0 (0.0%) |
| Total (Category) | 173 (66.8%) | 86 (33.2%) |
| Total (Overall) | 2,744 (51.2%) | 2,620 (48.8%) |
Employment Industries by Sex in Summerfield
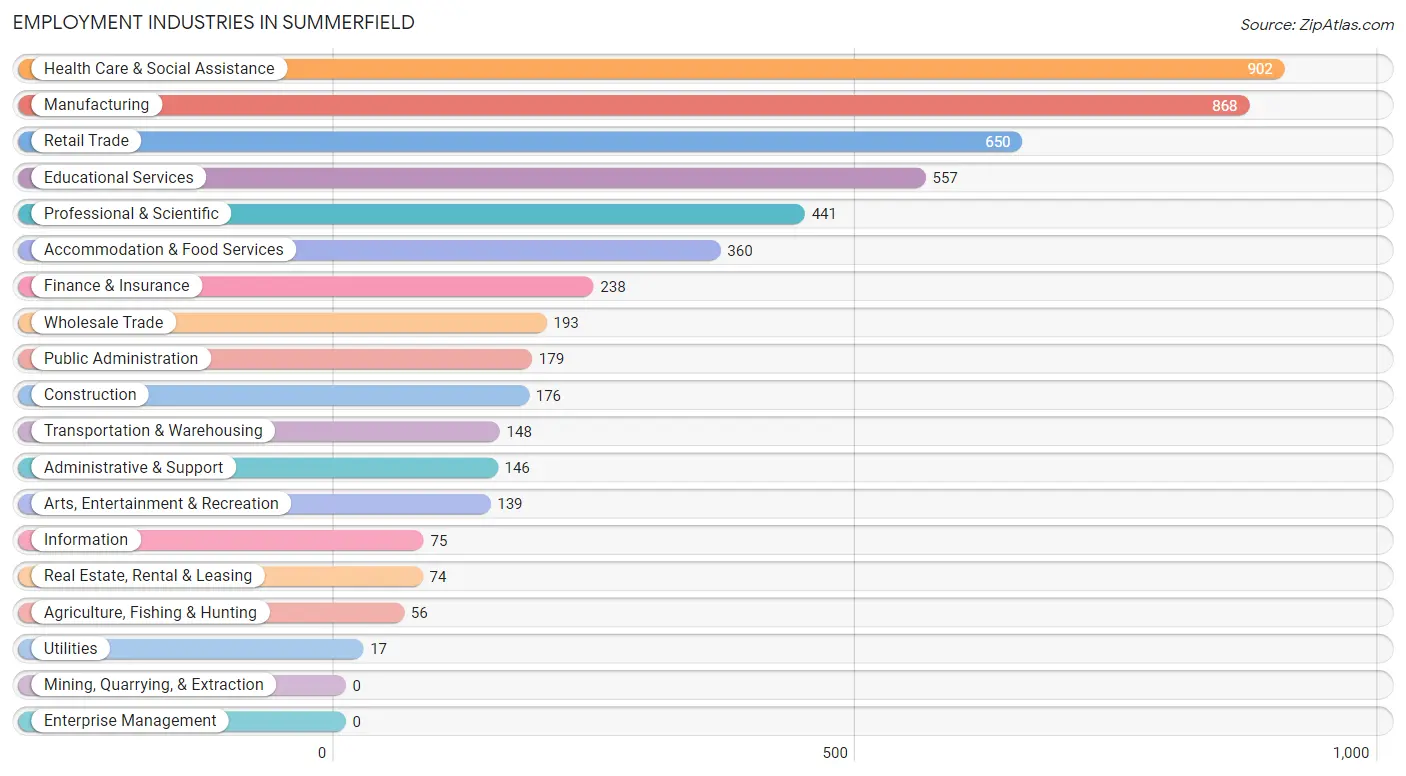
Employment Industries in Summerfield
The major employment industries in Summerfield include Health Care & Social Assistance (902 | 16.8%), Manufacturing (868 | 16.2%), Retail Trade (650 | 12.1%), Educational Services (557 | 10.4%), and Professional & Scientific (441 | 8.2%).
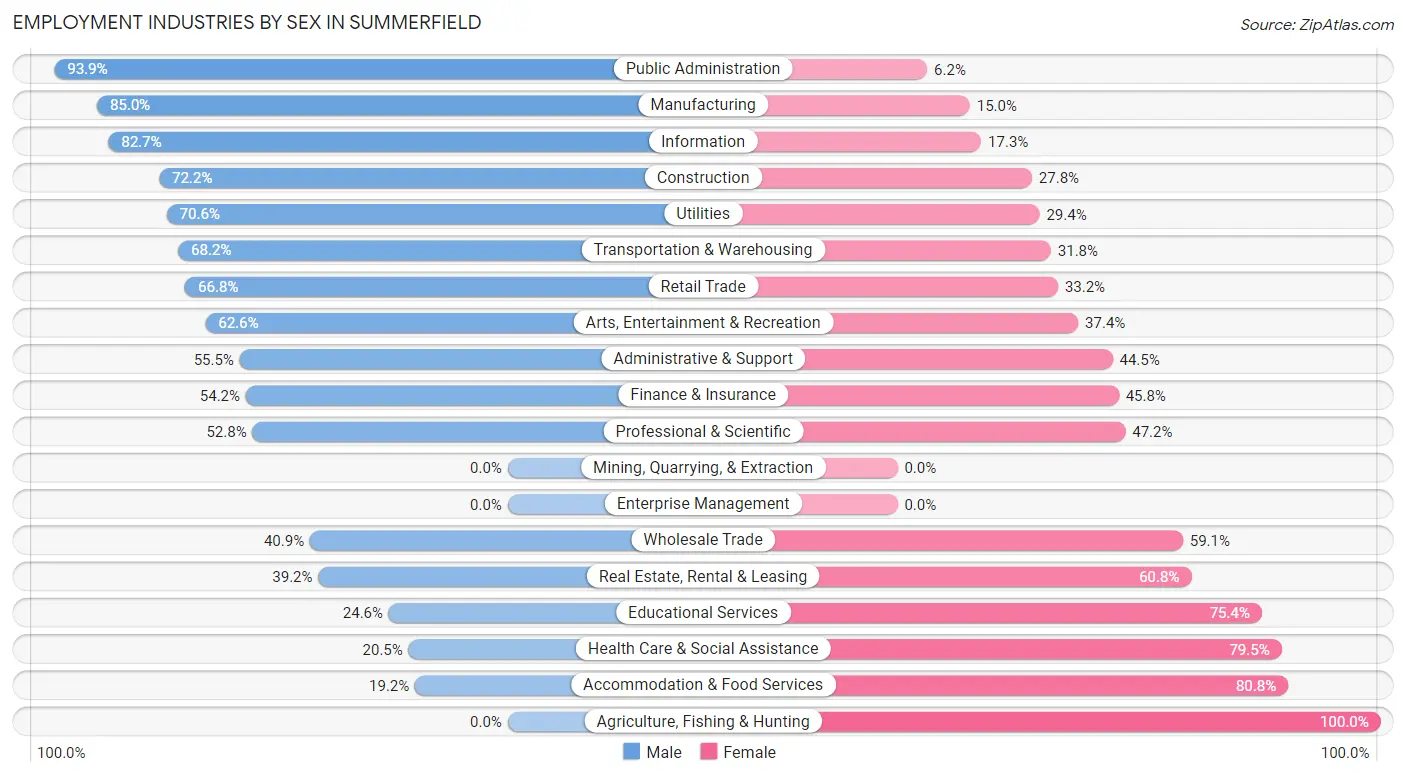
Employment Industries by Sex in Summerfield
The Summerfield industries that see more men than women are Public Administration (93.9%), Manufacturing (85.0%), and Information (82.7%), whereas the industries that tend to have a higher number of women are Agriculture, Fishing & Hunting (100.0%), Accommodation & Food Services (80.8%), and Health Care & Social Assistance (79.5%).
| Industry | Male | Female |
| Agriculture, Fishing & Hunting | 0 (0.0%) | 56 (100.0%) |
| Mining, Quarrying, & Extraction | 0 (0.0%) | 0 (0.0%) |
| Construction | 127 (72.2%) | 49 (27.8%) |
| Manufacturing | 738 (85.0%) | 130 (15.0%) |
| Wholesale Trade | 79 (40.9%) | 114 (59.1%) |
| Retail Trade | 434 (66.8%) | 216 (33.2%) |
| Transportation & Warehousing | 101 (68.2%) | 47 (31.8%) |
| Utilities | 12 (70.6%) | 5 (29.4%) |
| Information | 62 (82.7%) | 13 (17.3%) |
| Finance & Insurance | 129 (54.2%) | 109 (45.8%) |
| Real Estate, Rental & Leasing | 29 (39.2%) | 45 (60.8%) |
| Professional & Scientific | 233 (52.8%) | 208 (47.2%) |
| Enterprise Management | 0 (0.0%) | 0 (0.0%) |
| Administrative & Support | 81 (55.5%) | 65 (44.5%) |
| Educational Services | 137 (24.6%) | 420 (75.4%) |
| Health Care & Social Assistance | 185 (20.5%) | 717 (79.5%) |
| Arts, Entertainment & Recreation | 87 (62.6%) | 52 (37.4%) |
| Accommodation & Food Services | 69 (19.2%) | 291 (80.8%) |
| Public Administration | 168 (93.9%) | 11 (6.1%) |
| Total | 2,744 (51.2%) | 2,620 (48.8%) |
Education in Summerfield
School Enrollment in Summerfield
The most common levels of schooling among the 2,806 students in Summerfield are high school (682 | 24.3%), college / undergraduate (622 | 22.2%), and middle school (599 | 21.3%).
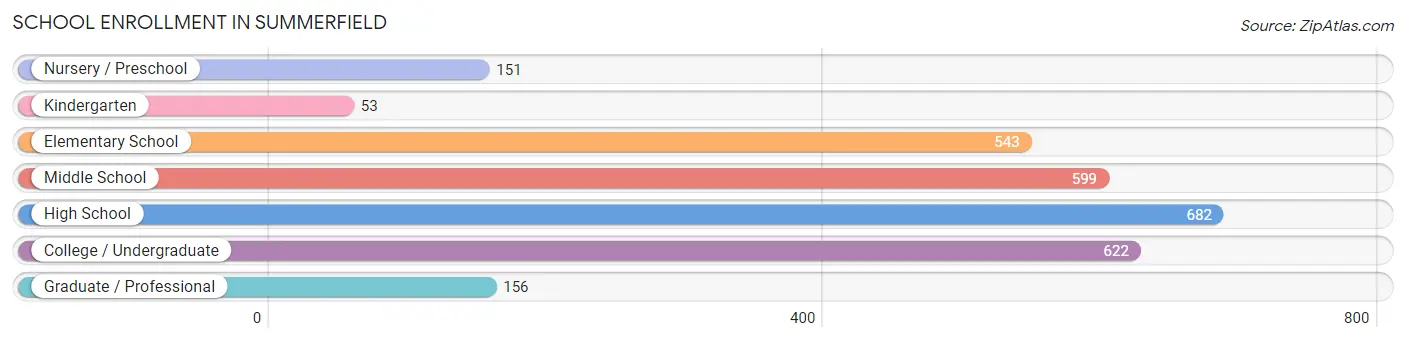
| School Level | # Students | % Students |
| Nursery / Preschool | 151 | 5.4% |
| Kindergarten | 53 | 1.9% |
| Elementary School | 543 | 19.4% |
| Middle School | 599 | 21.3% |
| High School | 682 | 24.3% |
| College / Undergraduate | 622 | 22.2% |
| Graduate / Professional | 156 | 5.6% |
| Total | 2,806 | 100.0% |
School Enrollment by Age by Funding Source in Summerfield
Out of a total of 2,806 students who are enrolled in schools in Summerfield, 803 (28.6%) attend a private institution, while the remaining 2,003 (71.4%) are enrolled in public schools. The age group of 3 to 4 year olds has the highest likelihood of being enrolled in private schools, with 74 (53.2% in the age bracket) enrolled. Conversely, the age group of 35 years and over has the lowest likelihood of being enrolled in a private school, with 63 (100.0% in the age bracket) attending a public institution.
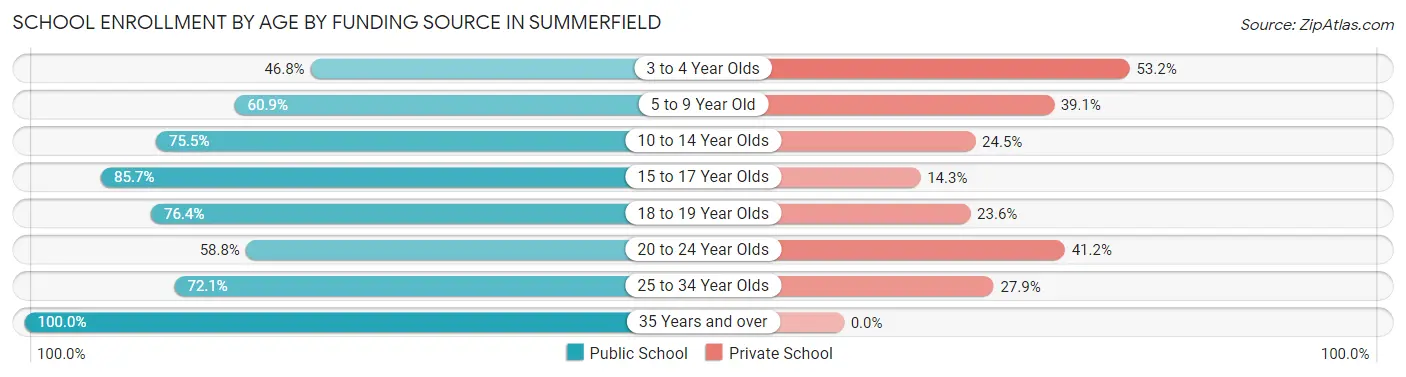
| Age Bracket | Public School | Private School |
| 3 to 4 Year Olds | 65 (46.8%) | 74 (53.2%) |
| 5 to 9 Year Old | 333 (60.9%) | 214 (39.1%) |
| 10 to 14 Year Olds | 515 (75.5%) | 167 (24.5%) |
| 15 to 17 Year Olds | 457 (85.7%) | 76 (14.3%) |
| 18 to 19 Year Olds | 279 (76.4%) | 86 (23.6%) |
| 20 to 24 Year Olds | 230 (58.8%) | 161 (41.2%) |
| 25 to 34 Year Olds | 62 (72.1%) | 24 (27.9%) |
| 35 Years and over | 63 (100.0%) | 0 (0.0%) |
| Total | 2,003 (71.4%) | 803 (28.6%) |
Educational Attainment by Field of Study in Summerfield
Business (1,199 | 25.8%), education (561 | 12.1%), engineering (490 | 10.5%), science & technology (422 | 9.1%), and communications (323 | 6.9%) are the most common fields of study among 4,653 individuals in Summerfield who have obtained a bachelor's degree or higher.
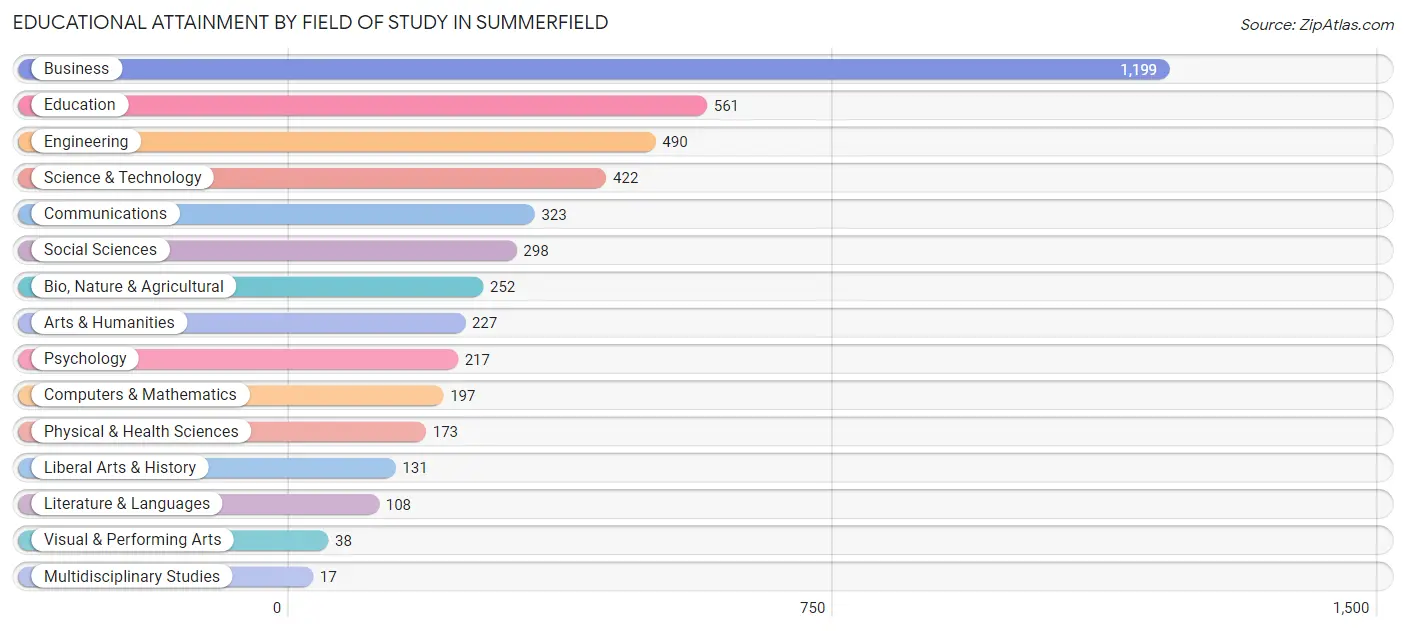
| Field of Study | # Graduates | % Graduates |
| Computers & Mathematics | 197 | 4.2% |
| Bio, Nature & Agricultural | 252 | 5.4% |
| Physical & Health Sciences | 173 | 3.7% |
| Psychology | 217 | 4.7% |
| Social Sciences | 298 | 6.4% |
| Engineering | 490 | 10.5% |
| Multidisciplinary Studies | 17 | 0.4% |
| Science & Technology | 422 | 9.1% |
| Business | 1,199 | 25.8% |
| Education | 561 | 12.1% |
| Literature & Languages | 108 | 2.3% |
| Liberal Arts & History | 131 | 2.8% |
| Visual & Performing Arts | 38 | 0.8% |
| Communications | 323 | 6.9% |
| Arts & Humanities | 227 | 4.9% |
| Total | 4,653 | 100.0% |
Transportation & Commute in Summerfield
Vehicle Availability by Sex in Summerfield
The most prevalent vehicle ownership categories in Summerfield are males with 3 vehicles (1,044, accounting for 39.6%) and females with 3 vehicles (988, making up 40.2%).
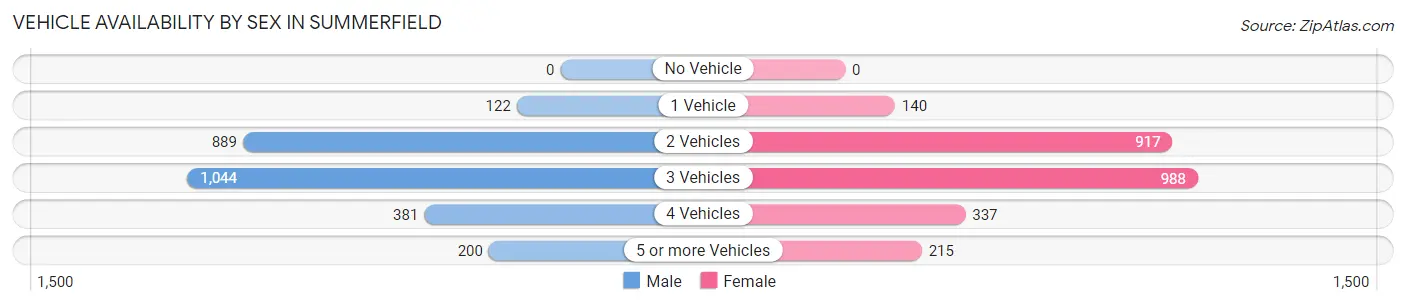
| Vehicles Available | Male | Female |
| No Vehicle | 0 (0.0%) | 0 (0.0%) |
| 1 Vehicle | 122 (4.6%) | 140 (5.4%) |
| 2 Vehicles | 889 (33.7%) | 917 (35.3%) |
| 3 Vehicles | 1,044 (39.6%) | 988 (38.0%) |
| 4 Vehicles | 381 (14.4%) | 337 (13.0%) |
| 5 or more Vehicles | 200 (7.6%) | 215 (8.3%) |
| Total | 2,636 (100.0%) | 2,597 (100.0%) |
Commute Time in Summerfield
The most frequently occuring commute durations in Summerfield are 20 to 24 minutes (1,085 commuters, 25.8%), 30 to 34 minutes (766 commuters, 18.2%), and 15 to 19 minutes (681 commuters, 16.2%).
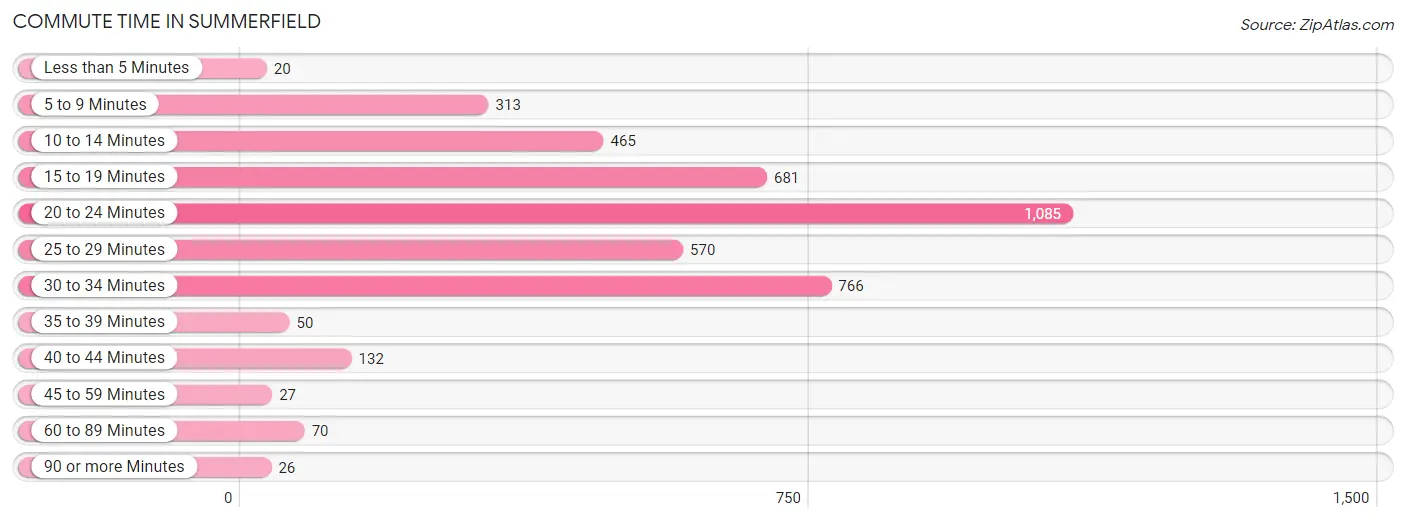
| Commute Time | # Commuters | % Commuters |
| Less than 5 Minutes | 20 | 0.5% |
| 5 to 9 Minutes | 313 | 7.4% |
| 10 to 14 Minutes | 465 | 11.1% |
| 15 to 19 Minutes | 681 | 16.2% |
| 20 to 24 Minutes | 1,085 | 25.8% |
| 25 to 29 Minutes | 570 | 13.6% |
| 30 to 34 Minutes | 766 | 18.2% |
| 35 to 39 Minutes | 50 | 1.2% |
| 40 to 44 Minutes | 132 | 3.1% |
| 45 to 59 Minutes | 27 | 0.6% |
| 60 to 89 Minutes | 70 | 1.7% |
| 90 or more Minutes | 26 | 0.6% |
Commute Time by Sex in Summerfield
The most common commute times in Summerfield are 20 to 24 minutes (525 commuters, 25.1%) for males and 20 to 24 minutes (560 commuters, 26.6%) for females.
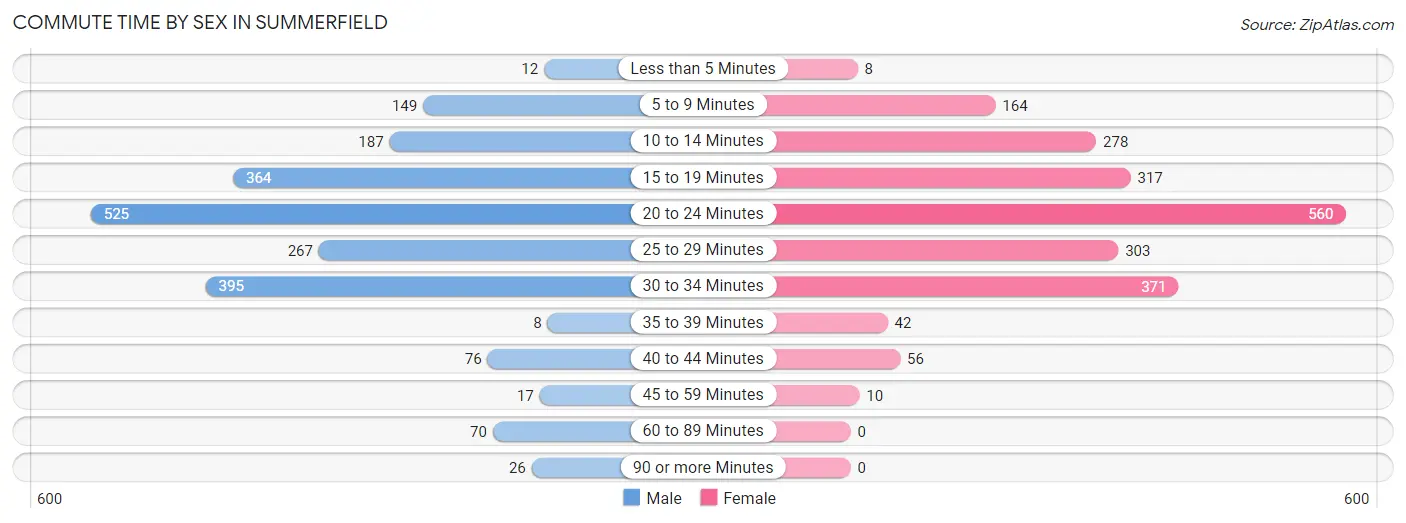
| Commute Time | Male | Female |
| Less than 5 Minutes | 12 (0.6%) | 8 (0.4%) |
| 5 to 9 Minutes | 149 (7.1%) | 164 (7.8%) |
| 10 to 14 Minutes | 187 (8.9%) | 278 (13.2%) |
| 15 to 19 Minutes | 364 (17.4%) | 317 (15.0%) |
| 20 to 24 Minutes | 525 (25.1%) | 560 (26.6%) |
| 25 to 29 Minutes | 267 (12.7%) | 303 (14.4%) |
| 30 to 34 Minutes | 395 (18.9%) | 371 (17.6%) |
| 35 to 39 Minutes | 8 (0.4%) | 42 (2.0%) |
| 40 to 44 Minutes | 76 (3.6%) | 56 (2.7%) |
| 45 to 59 Minutes | 17 (0.8%) | 10 (0.5%) |
| 60 to 89 Minutes | 70 (3.3%) | 0 (0.0%) |
| 90 or more Minutes | 26 (1.2%) | 0 (0.0%) |
Time of Departure to Work by Sex in Summerfield
The most frequent times of departure to work in Summerfield are 7:30 AM to 7:59 AM (460, 22.0%) for males and 7:30 AM to 7:59 AM (483, 22.9%) for females.
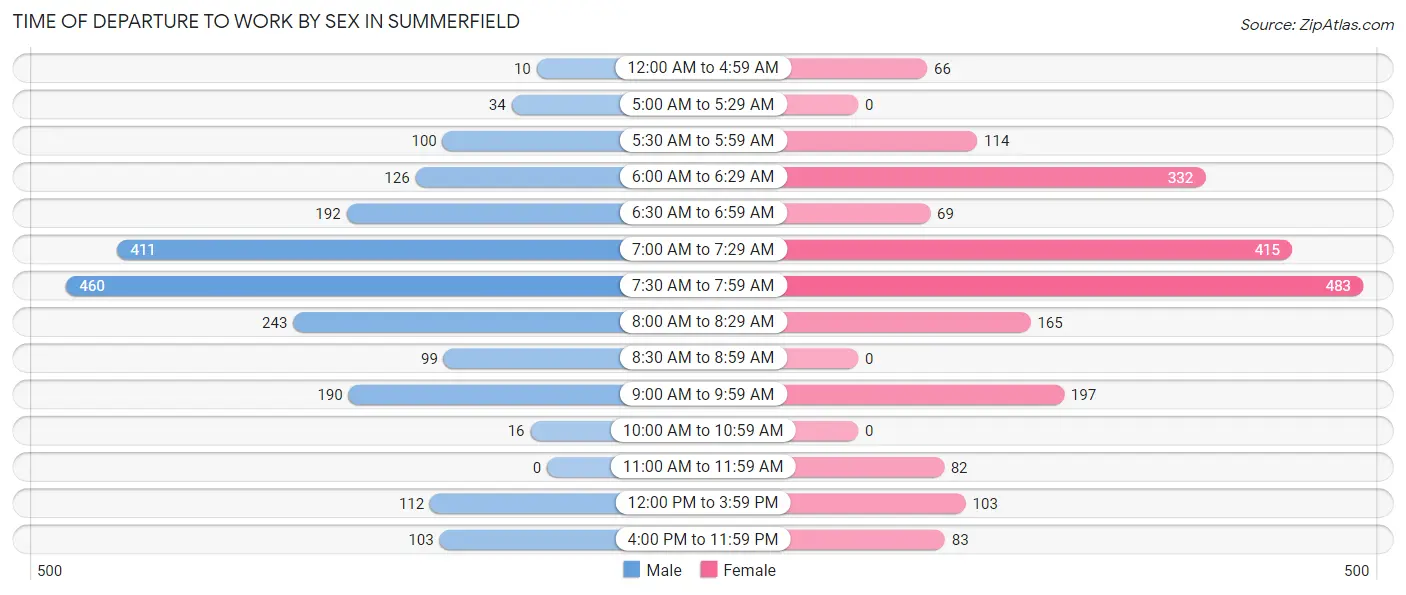
| Time of Departure | Male | Female |
| 12:00 AM to 4:59 AM | 10 (0.5%) | 66 (3.1%) |
| 5:00 AM to 5:29 AM | 34 (1.6%) | 0 (0.0%) |
| 5:30 AM to 5:59 AM | 100 (4.8%) | 114 (5.4%) |
| 6:00 AM to 6:29 AM | 126 (6.0%) | 332 (15.7%) |
| 6:30 AM to 6:59 AM | 192 (9.2%) | 69 (3.3%) |
| 7:00 AM to 7:29 AM | 411 (19.6%) | 415 (19.7%) |
| 7:30 AM to 7:59 AM | 460 (22.0%) | 483 (22.9%) |
| 8:00 AM to 8:29 AM | 243 (11.6%) | 165 (7.8%) |
| 8:30 AM to 8:59 AM | 99 (4.7%) | 0 (0.0%) |
| 9:00 AM to 9:59 AM | 190 (9.1%) | 197 (9.3%) |
| 10:00 AM to 10:59 AM | 16 (0.8%) | 0 (0.0%) |
| 11:00 AM to 11:59 AM | 0 (0.0%) | 82 (3.9%) |
| 12:00 PM to 3:59 PM | 112 (5.3%) | 103 (4.9%) |
| 4:00 PM to 11:59 PM | 103 (4.9%) | 83 (3.9%) |
| Total | 2,096 (100.0%) | 2,109 (100.0%) |
Housing Occupancy in Summerfield
Occupancy by Ownership in Summerfield
Of the total 3,910 dwellings in Summerfield, owner-occupied units account for 3,440 (88.0%), while renter-occupied units make up 470 (12.0%).
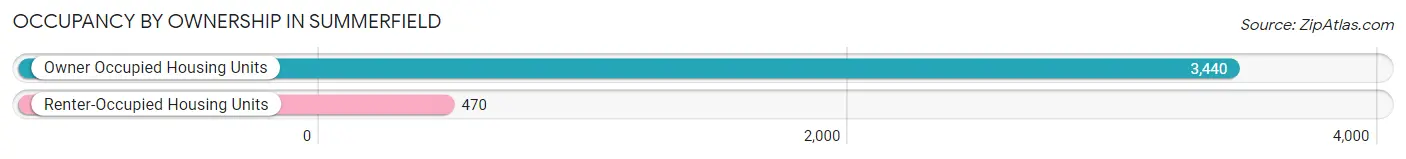
| Occupancy | # Housing Units | % Housing Units |
| Owner Occupied Housing Units | 3,440 | 88.0% |
| Renter-Occupied Housing Units | 470 | 12.0% |
| Total Occupied Housing Units | 3,910 | 100.0% |
Occupancy by Household Size in Summerfield
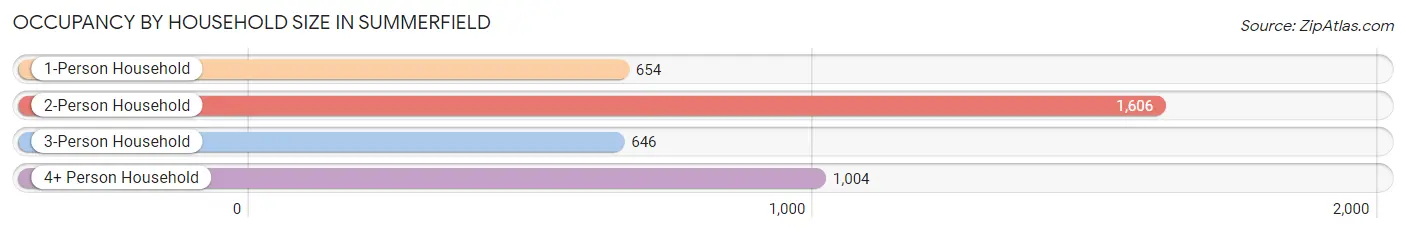
| Household Size | # Housing Units | % Housing Units |
| 1-Person Household | 654 | 16.7% |
| 2-Person Household | 1,606 | 41.1% |
| 3-Person Household | 646 | 16.5% |
| 4+ Person Household | 1,004 | 25.7% |
| Total Housing Units | 3,910 | 100.0% |
Occupancy by Ownership by Household Size in Summerfield
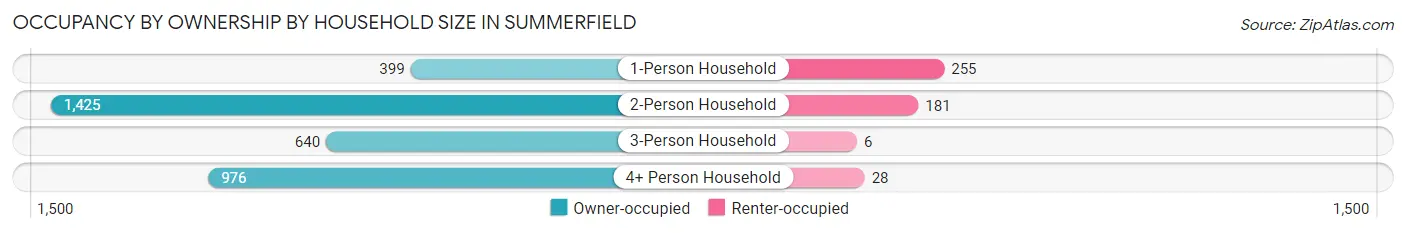
| Household Size | Owner-occupied | Renter-occupied |
| 1-Person Household | 399 (61.0%) | 255 (39.0%) |
| 2-Person Household | 1,425 (88.7%) | 181 (11.3%) |
| 3-Person Household | 640 (99.1%) | 6 (0.9%) |
| 4+ Person Household | 976 (97.2%) | 28 (2.8%) |
| Total Housing Units | 3,440 (88.0%) | 470 (12.0%) |
Occupancy by Educational Attainment in Summerfield
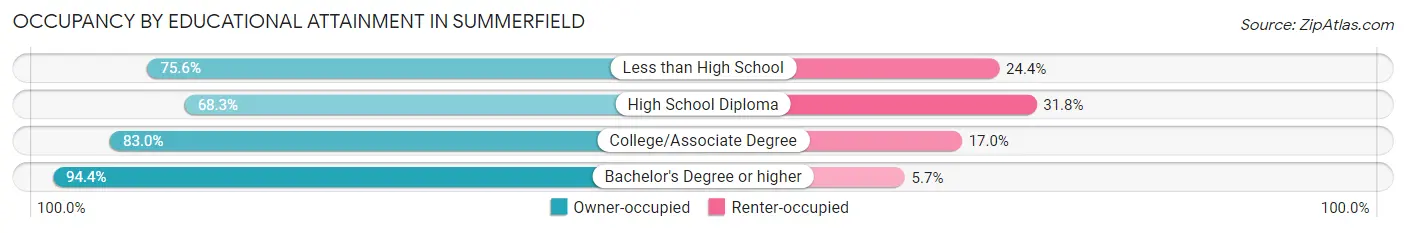
| Household Size | Owner-occupied | Renter-occupied |
| Less than High School | 149 (75.6%) | 48 (24.4%) |
| High School Diploma | 316 (68.2%) | 147 (31.8%) |
| College/Associate Degree | 671 (83.0%) | 137 (17.0%) |
| Bachelor's Degree or higher | 2,304 (94.4%) | 138 (5.7%) |
Occupancy by Age of Householder in Summerfield
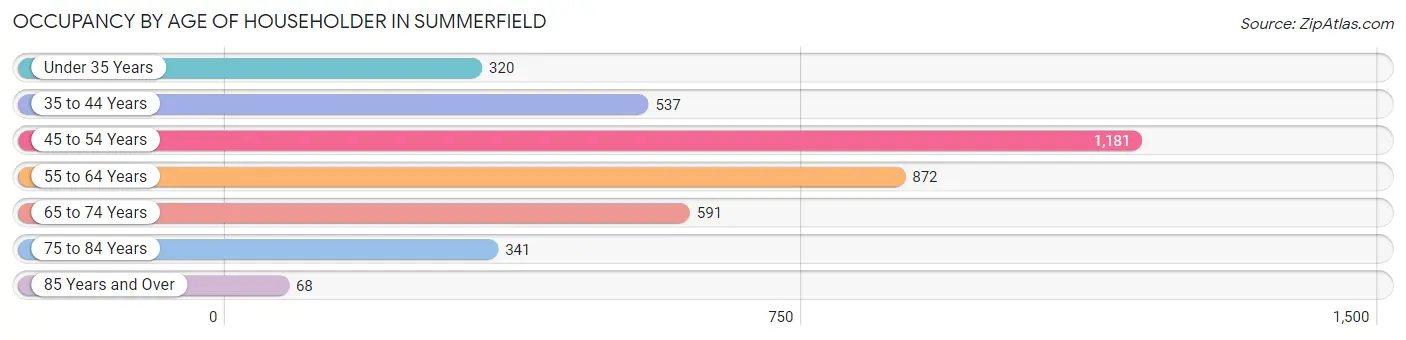
| Age Bracket | # Households | % Households |
| Under 35 Years | 320 | 8.2% |
| 35 to 44 Years | 537 | 13.7% |
| 45 to 54 Years | 1,181 | 30.2% |
| 55 to 64 Years | 872 | 22.3% |
| 65 to 74 Years | 591 | 15.1% |
| 75 to 84 Years | 341 | 8.7% |
| 85 Years and Over | 68 | 1.7% |
| Total | 3,910 | 100.0% |
Housing Finances in Summerfield
Median Income by Occupancy in Summerfield
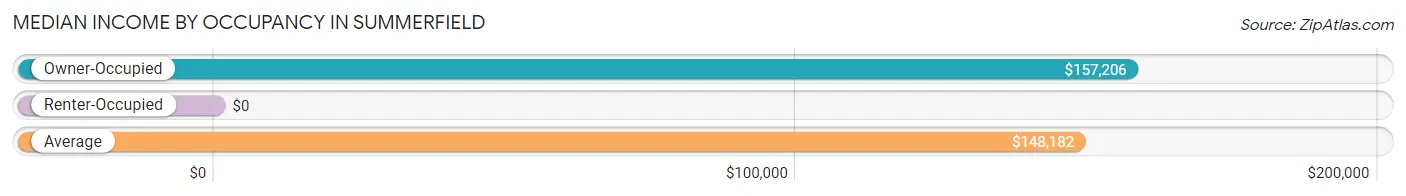
| Occupancy Type | # Households | Median Income |
| Owner-Occupied | 3,440 (88.0%) | $157,206 |
| Renter-Occupied | 470 (12.0%) | $0 |
| Average | 3,910 (100.0%) | $148,182 |
Occupancy by Householder Income Bracket in Summerfield
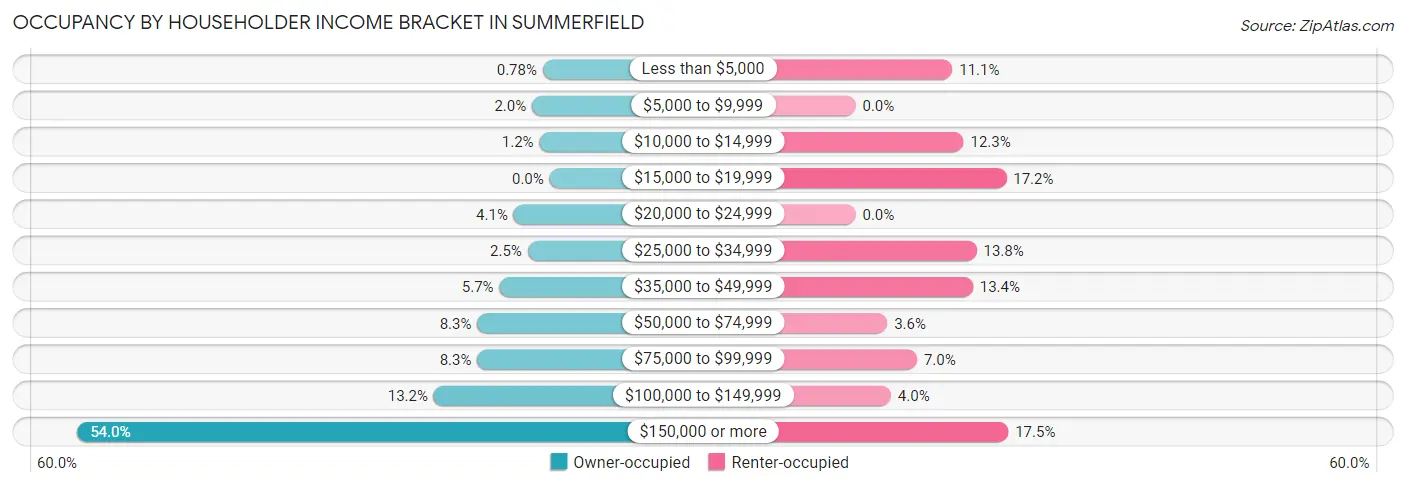
| Income Bracket | Owner-occupied | Renter-occupied |
| Less than $5,000 | 27 (0.8%) | 52 (11.1%) |
| $5,000 to $9,999 | 69 (2.0%) | 0 (0.0%) |
| $10,000 to $14,999 | 40 (1.2%) | 58 (12.3%) |
| $15,000 to $19,999 | 0 (0.0%) | 81 (17.2%) |
| $20,000 to $24,999 | 141 (4.1%) | 0 (0.0%) |
| $25,000 to $34,999 | 86 (2.5%) | 65 (13.8%) |
| $35,000 to $49,999 | 197 (5.7%) | 63 (13.4%) |
| $50,000 to $74,999 | 284 (8.3%) | 17 (3.6%) |
| $75,000 to $99,999 | 284 (8.3%) | 33 (7.0%) |
| $100,000 to $149,999 | 455 (13.2%) | 19 (4.0%) |
| $150,000 or more | 1,857 (54.0%) | 82 (17.4%) |
| Total | 3,440 (100.0%) | 470 (100.0%) |
Monthly Housing Cost Tiers in Summerfield
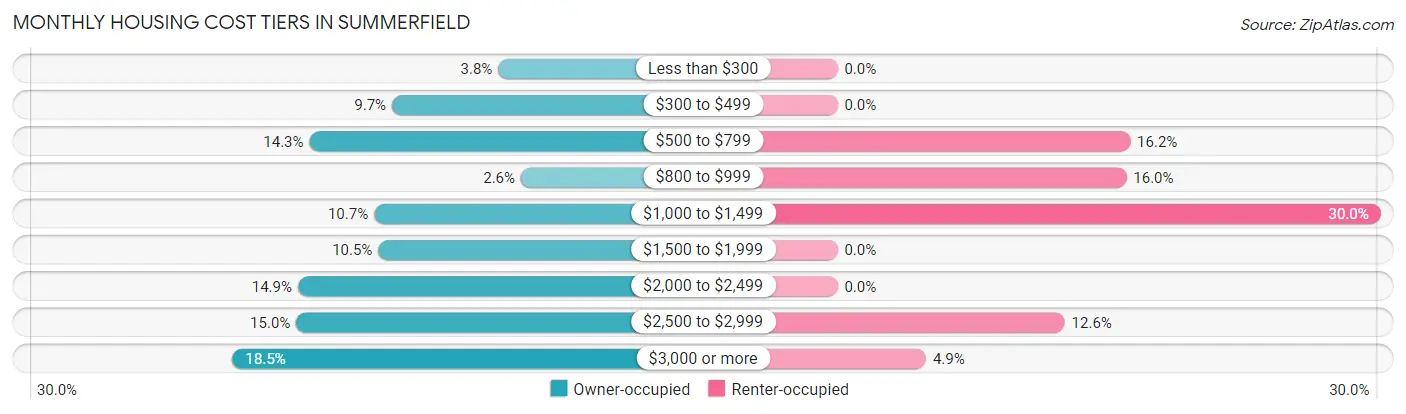
| Monthly Cost | Owner-occupied | Renter-occupied |
| Less than $300 | 132 (3.8%) | 0 (0.0%) |
| $300 to $499 | 334 (9.7%) | 0 (0.0%) |
| $500 to $799 | 491 (14.3%) | 76 (16.2%) |
| $800 to $999 | 89 (2.6%) | 75 (16.0%) |
| $1,000 to $1,499 | 368 (10.7%) | 141 (30.0%) |
| $1,500 to $1,999 | 360 (10.5%) | 0 (0.0%) |
| $2,000 to $2,499 | 513 (14.9%) | 0 (0.0%) |
| $2,500 to $2,999 | 516 (15.0%) | 59 (12.6%) |
| $3,000 or more | 637 (18.5%) | 23 (4.9%) |
| Total | 3,440 (100.0%) | 470 (100.0%) |
Physical Housing Characteristics in Summerfield
Housing Structures in Summerfield
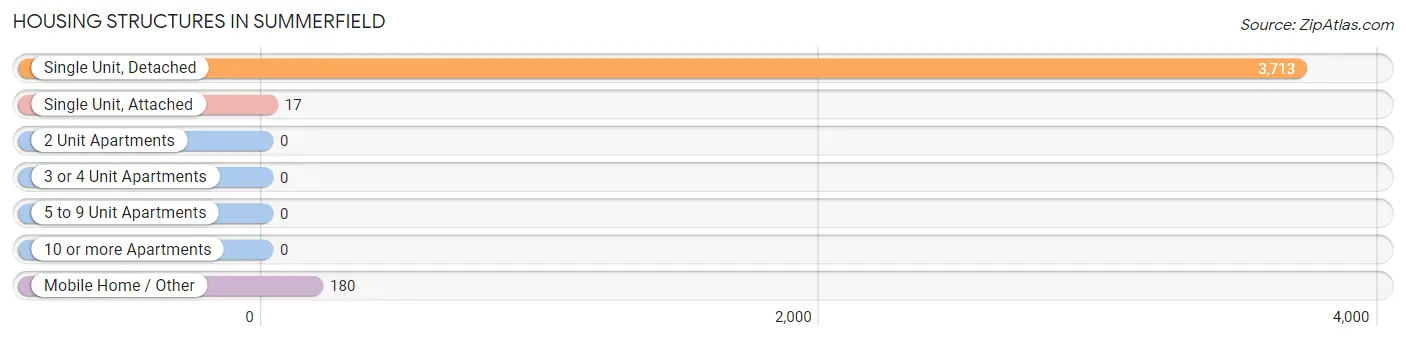
| Structure Type | # Housing Units | % Housing Units |
| Single Unit, Detached | 3,713 | 95.0% |
| Single Unit, Attached | 17 | 0.4% |
| 2 Unit Apartments | 0 | 0.0% |
| 3 or 4 Unit Apartments | 0 | 0.0% |
| 5 to 9 Unit Apartments | 0 | 0.0% |
| 10 or more Apartments | 0 | 0.0% |
| Mobile Home / Other | 180 | 4.6% |
| Total | 3,910 | 100.0% |
Housing Structures by Occupancy in Summerfield
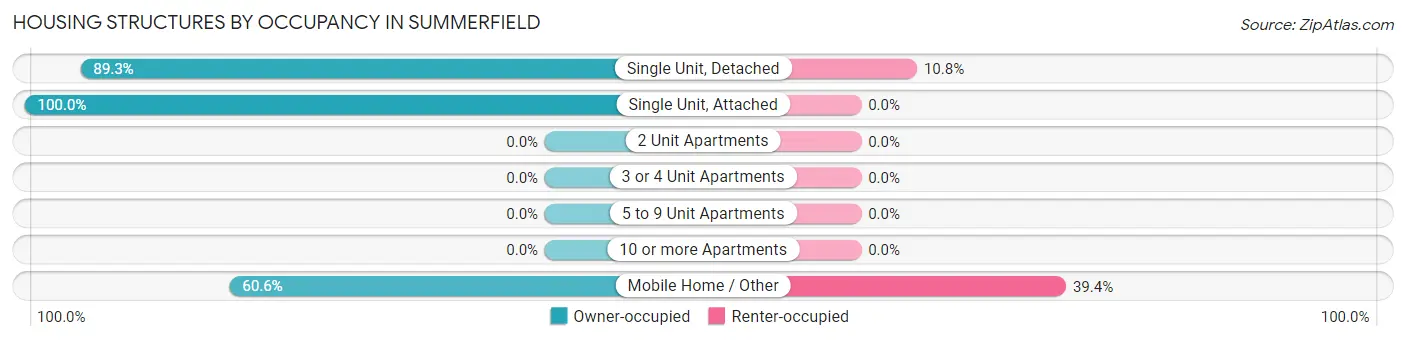
| Structure Type | Owner-occupied | Renter-occupied |
| Single Unit, Detached | 3,314 (89.2%) | 399 (10.7%) |
| Single Unit, Attached | 17 (100.0%) | 0 (0.0%) |
| 2 Unit Apartments | 0 (0.0%) | 0 (0.0%) |
| 3 or 4 Unit Apartments | 0 (0.0%) | 0 (0.0%) |
| 5 to 9 Unit Apartments | 0 (0.0%) | 0 (0.0%) |
| 10 or more Apartments | 0 (0.0%) | 0 (0.0%) |
| Mobile Home / Other | 109 (60.6%) | 71 (39.4%) |
| Total | 3,440 (88.0%) | 470 (12.0%) |
Housing Structures by Number of Rooms in Summerfield
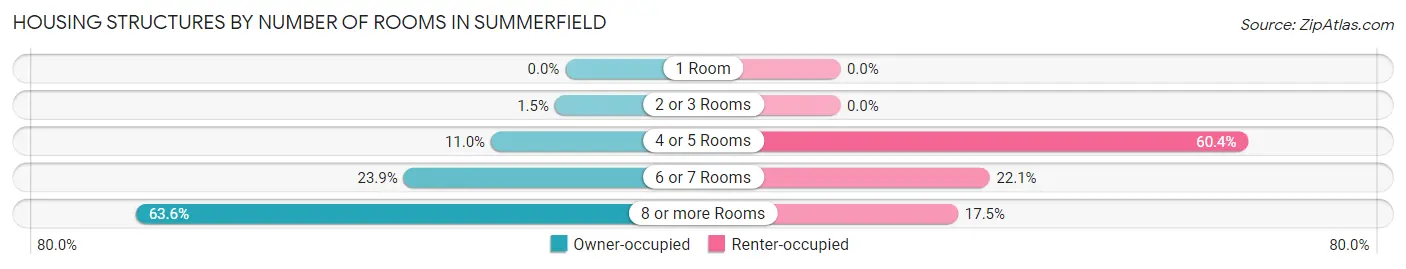
| Number of Rooms | Owner-occupied | Renter-occupied |
| 1 Room | 0 (0.0%) | 0 (0.0%) |
| 2 or 3 Rooms | 53 (1.5%) | 0 (0.0%) |
| 4 or 5 Rooms | 378 (11.0%) | 284 (60.4%) |
| 6 or 7 Rooms | 823 (23.9%) | 104 (22.1%) |
| 8 or more Rooms | 2,186 (63.5%) | 82 (17.4%) |
| Total | 3,440 (100.0%) | 470 (100.0%) |
Housing Structure by Heating Type in Summerfield
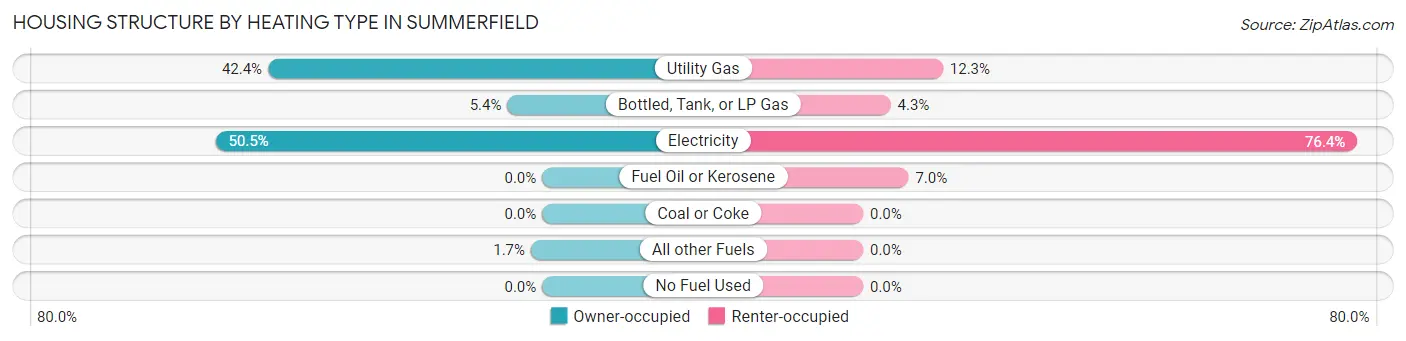
| Heating Type | Owner-occupied | Renter-occupied |
| Utility Gas | 1,458 (42.4%) | 58 (12.3%) |
| Bottled, Tank, or LP Gas | 185 (5.4%) | 20 (4.3%) |
| Electricity | 1,737 (50.5%) | 359 (76.4%) |
| Fuel Oil or Kerosene | 0 (0.0%) | 33 (7.0%) |
| Coal or Coke | 0 (0.0%) | 0 (0.0%) |
| All other Fuels | 60 (1.7%) | 0 (0.0%) |
| No Fuel Used | 0 (0.0%) | 0 (0.0%) |
| Total | 3,440 (100.0%) | 470 (100.0%) |
Household Vehicle Usage in Summerfield
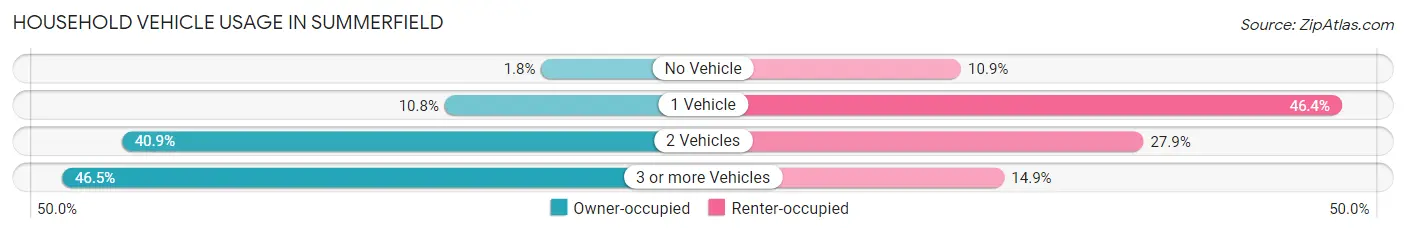
| Vehicles per Household | Owner-occupied | Renter-occupied |
| No Vehicle | 61 (1.8%) | 51 (10.8%) |
| 1 Vehicle | 371 (10.8%) | 218 (46.4%) |
| 2 Vehicles | 1,408 (40.9%) | 131 (27.9%) |
| 3 or more Vehicles | 1,600 (46.5%) | 70 (14.9%) |
| Total | 3,440 (100.0%) | 470 (100.0%) |
Real Estate & Mortgages in Summerfield
Real Estate and Mortgage Overview in Summerfield
| Characteristic | Without Mortgage | With Mortgage |
| Housing Units | 1,070 | 2,370 |
| Median Property Value | $356,900 | $477,700 |
| Median Household Income | $103,325 | $1,461 |
| Monthly Housing Costs | $546 | $637 |
| Real Estate Taxes | $2,443 | $21 |
Property Value by Mortgage Status in Summerfield
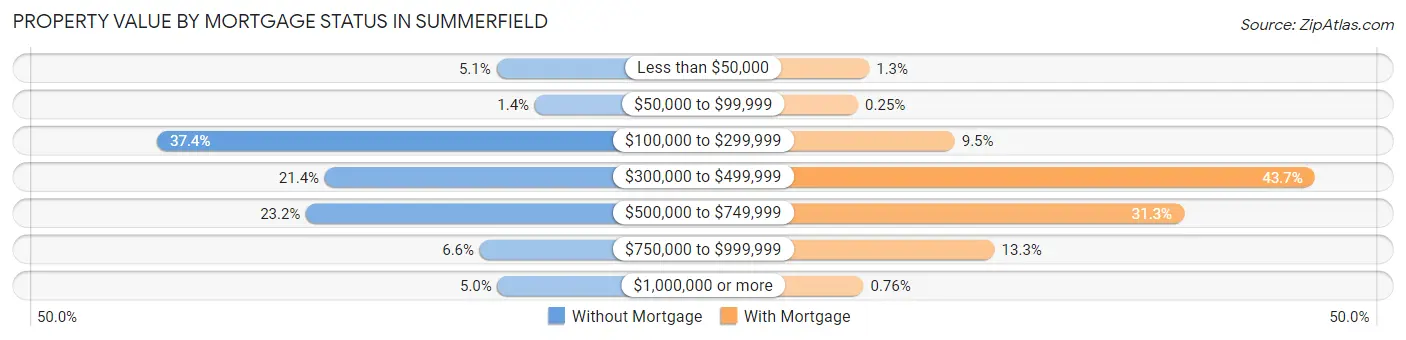
| Property Value | Without Mortgage | With Mortgage |
| Less than $50,000 | 54 (5.1%) | 31 (1.3%) |
| $50,000 to $99,999 | 15 (1.4%) | 6 (0.3%) |
| $100,000 to $299,999 | 400 (37.4%) | 224 (9.5%) |
| $300,000 to $499,999 | 229 (21.4%) | 1,036 (43.7%) |
| $500,000 to $749,999 | 248 (23.2%) | 741 (31.3%) |
| $750,000 to $999,999 | 71 (6.6%) | 314 (13.3%) |
| $1,000,000 or more | 53 (5.0%) | 18 (0.8%) |
| Total | 1,070 (100.0%) | 2,370 (100.0%) |
Household Income by Mortgage Status in Summerfield
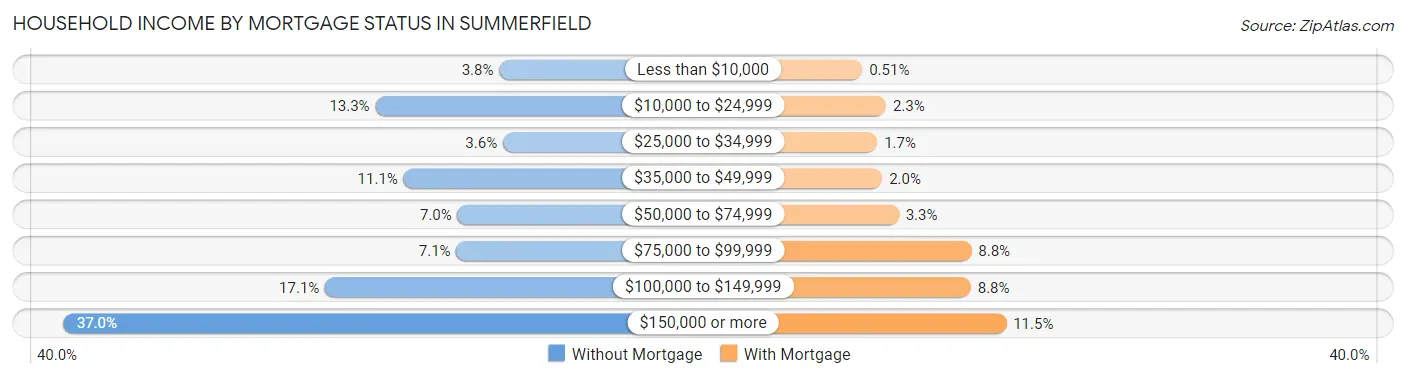
| Household Income | Without Mortgage | With Mortgage |
| Less than $10,000 | 41 (3.8%) | 12 (0.5%) |
| $10,000 to $24,999 | 142 (13.3%) | 55 (2.3%) |
| $25,000 to $34,999 | 38 (3.5%) | 39 (1.7%) |
| $35,000 to $49,999 | 119 (11.1%) | 48 (2.0%) |
| $50,000 to $74,999 | 75 (7.0%) | 78 (3.3%) |
| $75,000 to $99,999 | 76 (7.1%) | 209 (8.8%) |
| $100,000 to $149,999 | 183 (17.1%) | 208 (8.8%) |
| $150,000 or more | 396 (37.0%) | 272 (11.5%) |
| Total | 1,070 (100.0%) | 2,370 (100.0%) |
Property Value to Household Income Ratio in Summerfield
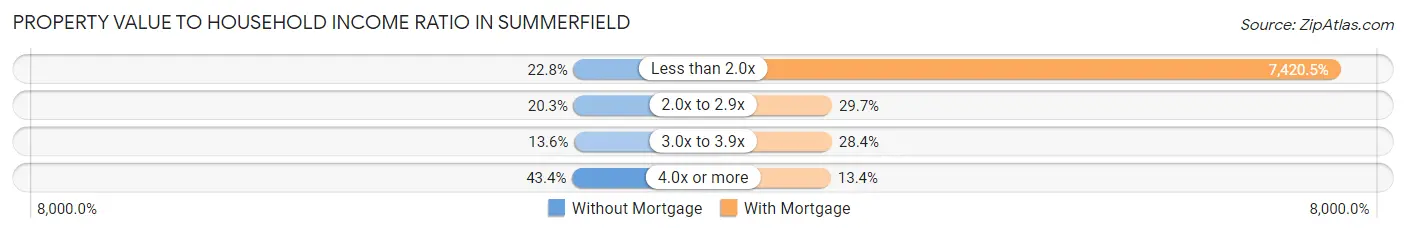
| Value-to-Income Ratio | Without Mortgage | With Mortgage |
| Less than 2.0x | 244 (22.8%) | 175,865 (7,420.5%) |
| 2.0x to 2.9x | 217 (20.3%) | 704 (29.7%) |
| 3.0x to 3.9x | 145 (13.6%) | 674 (28.4%) |
| 4.0x or more | 464 (43.4%) | 318 (13.4%) |
| Total | 1,070 (100.0%) | 2,370 (100.0%) |
Real Estate Taxes by Mortgage Status in Summerfield
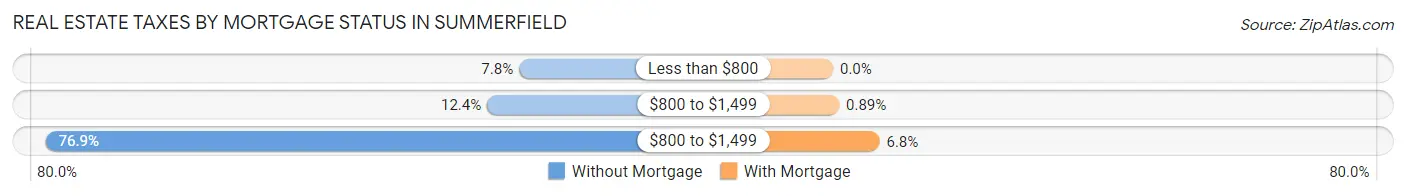
| Property Taxes | Without Mortgage | With Mortgage |
| Less than $800 | 83 (7.8%) | 0 (0.0%) |
| $800 to $1,499 | 133 (12.4%) | 21 (0.9%) |
| $800 to $1,499 | 823 (76.9%) | 161 (6.8%) |
| Total | 1,070 (100.0%) | 2,370 (100.0%) |
Health & Disability in Summerfield
Health Insurance Coverage by Age in Summerfield
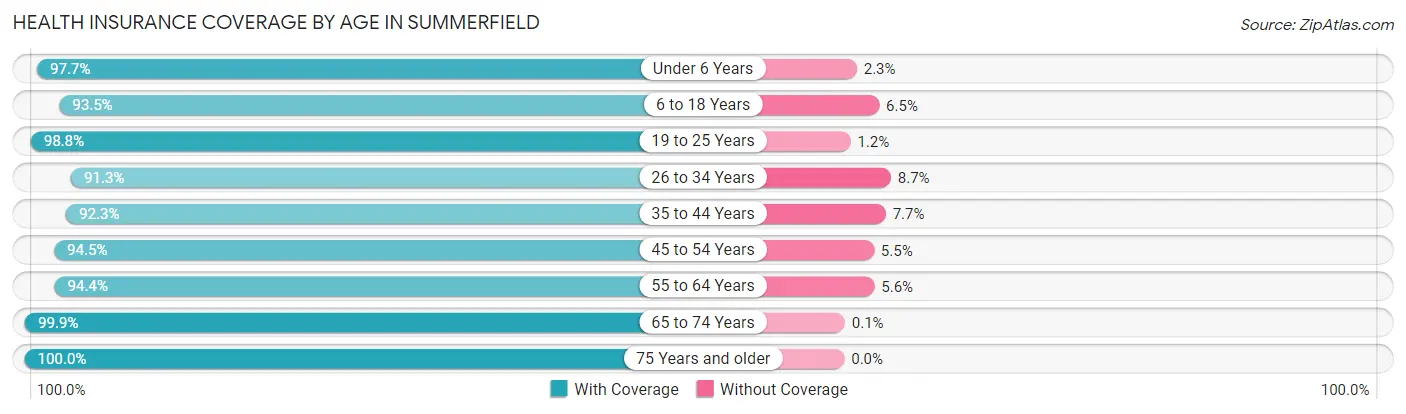
| Age Bracket | With Coverage | Without Coverage |
| Under 6 Years | 629 (97.7%) | 15 (2.3%) |
| 6 to 18 Years | 1,999 (93.5%) | 139 (6.5%) |
| 19 to 25 Years | 679 (98.8%) | 8 (1.2%) |
| 26 to 34 Years | 642 (91.3%) | 61 (8.7%) |
| 35 to 44 Years | 1,206 (92.3%) | 101 (7.7%) |
| 45 to 54 Years | 1,986 (94.5%) | 116 (5.5%) |
| 55 to 64 Years | 1,670 (94.4%) | 99 (5.6%) |
| 65 to 74 Years | 966 (99.9%) | 1 (0.1%) |
| 75 Years and older | 665 (100.0%) | 0 (0.0%) |
| Total | 10,442 (95.1%) | 540 (4.9%) |
Health Insurance Coverage by Citizenship Status in Summerfield
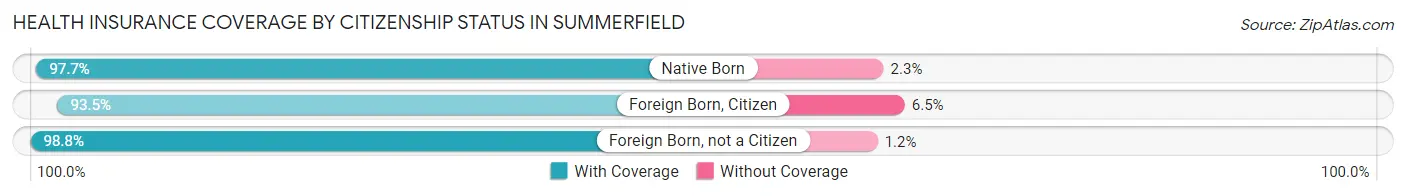
| Citizenship Status | With Coverage | Without Coverage |
| Native Born | 629 (97.7%) | 15 (2.3%) |
| Foreign Born, Citizen | 1,999 (93.5%) | 139 (6.5%) |
| Foreign Born, not a Citizen | 679 (98.8%) | 8 (1.2%) |
Health Insurance Coverage by Household Income in Summerfield
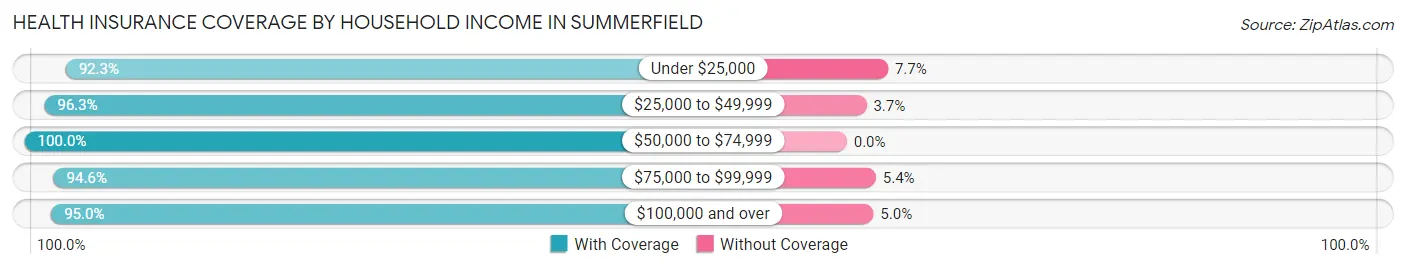
| Household Income | With Coverage | Without Coverage |
| Under $25,000 | 970 (92.3%) | 81 (7.7%) |
| $25,000 to $49,999 | 601 (96.3%) | 23 (3.7%) |
| $50,000 to $74,999 | 667 (100.0%) | 0 (0.0%) |
| $75,000 to $99,999 | 661 (94.6%) | 38 (5.4%) |
| $100,000 and over | 7,534 (95.0%) | 396 (5.0%) |
Public vs Private Health Insurance Coverage by Age in Summerfield
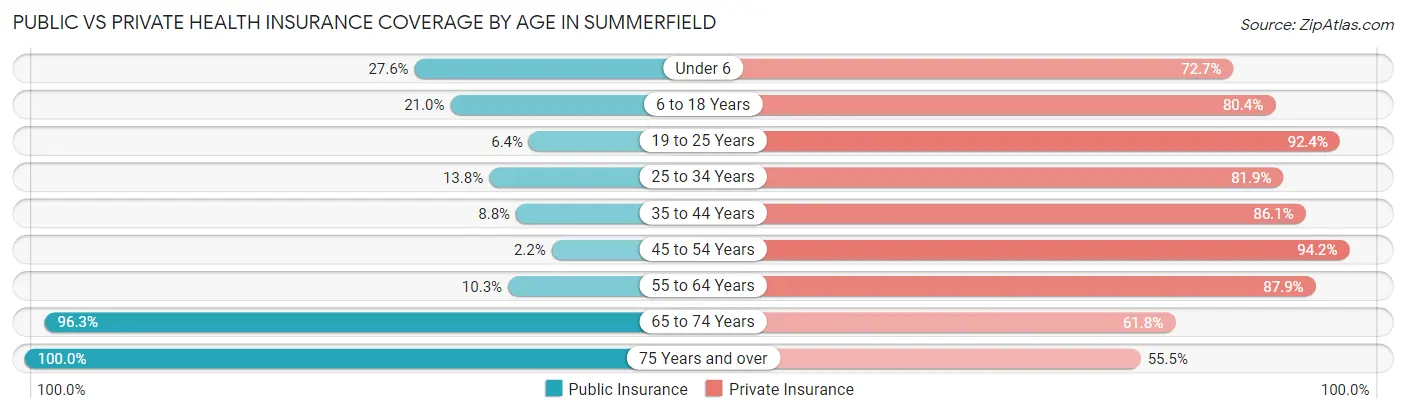
| Age Bracket | Public Insurance | Private Insurance |
| Under 6 | 178 (27.6%) | 468 (72.7%) |
| 6 to 18 Years | 449 (21.0%) | 1,719 (80.4%) |
| 19 to 25 Years | 44 (6.4%) | 635 (92.4%) |
| 25 to 34 Years | 97 (13.8%) | 576 (81.9%) |
| 35 to 44 Years | 115 (8.8%) | 1,125 (86.1%) |
| 45 to 54 Years | 46 (2.2%) | 1,980 (94.2%) |
| 55 to 64 Years | 182 (10.3%) | 1,555 (87.9%) |
| 65 to 74 Years | 931 (96.3%) | 598 (61.8%) |
| 75 Years and over | 665 (100.0%) | 369 (55.5%) |
| Total | 2,707 (24.6%) | 9,025 (82.2%) |
Disability Status by Sex by Age in Summerfield
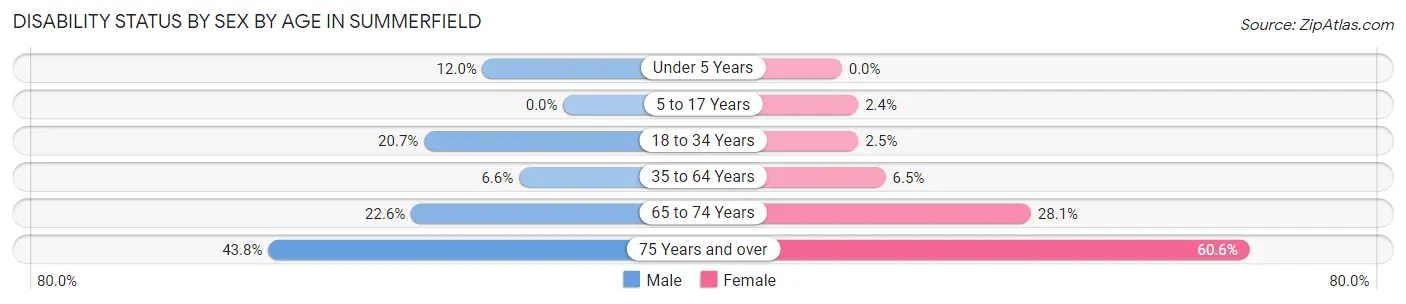
| Age Bracket | Male | Female |
| Under 5 Years | 26 (12.0%) | 0 (0.0%) |
| 5 to 17 Years | 0 (0.0%) | 20 (2.4%) |
| 18 to 34 Years | 149 (20.7%) | 25 (2.5%) |
| 35 to 64 Years | 165 (6.6%) | 174 (6.5%) |
| 65 to 74 Years | 101 (22.6%) | 146 (28.1%) |
| 75 Years and over | 117 (43.8%) | 241 (60.6%) |
Disability Class by Sex by Age in Summerfield
Disability Class: Hearing Difficulty
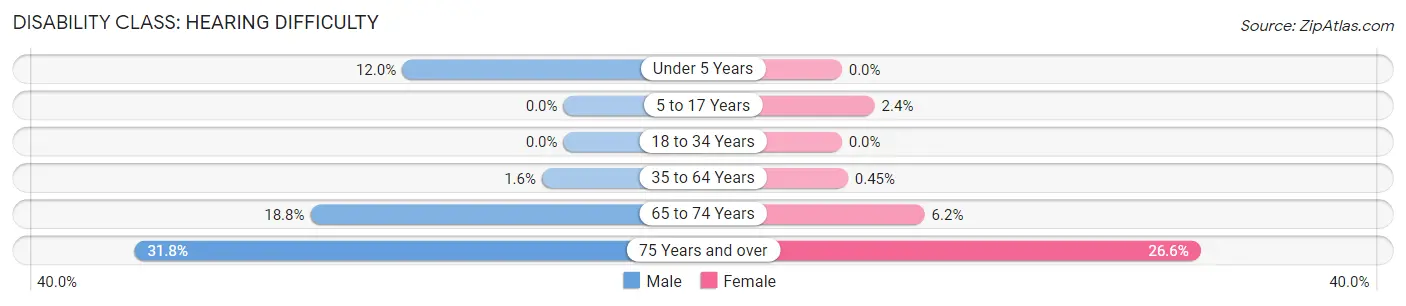
| Age Bracket | Male | Female |
| Under 5 Years | 26 (12.0%) | 0 (0.0%) |
| 5 to 17 Years | 0 (0.0%) | 20 (2.4%) |
| 18 to 34 Years | 0 (0.0%) | 0 (0.0%) |
| 35 to 64 Years | 40 (1.6%) | 12 (0.4%) |
| 65 to 74 Years | 84 (18.8%) | 32 (6.1%) |
| 75 Years and over | 85 (31.8%) | 106 (26.6%) |
Disability Class: Vision Difficulty
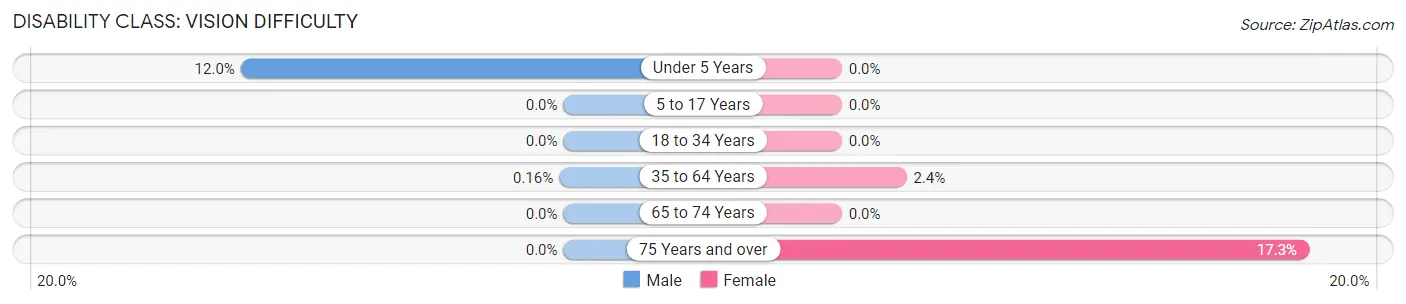
| Age Bracket | Male | Female |
| Under 5 Years | 26 (12.0%) | 0 (0.0%) |
| 5 to 17 Years | 0 (0.0%) | 0 (0.0%) |
| 18 to 34 Years | 0 (0.0%) | 0 (0.0%) |
| 35 to 64 Years | 4 (0.2%) | 64 (2.4%) |
| 65 to 74 Years | 0 (0.0%) | 0 (0.0%) |
| 75 Years and over | 0 (0.0%) | 69 (17.3%) |
Disability Class: Cognitive Difficulty
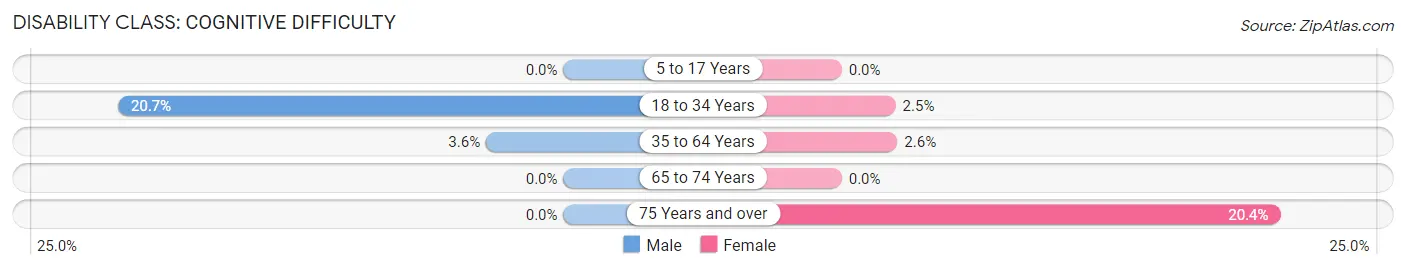
| Age Bracket | Male | Female |
| 5 to 17 Years | 0 (0.0%) | 0 (0.0%) |
| 18 to 34 Years | 149 (20.7%) | 25 (2.5%) |
| 35 to 64 Years | 90 (3.6%) | 69 (2.6%) |
| 65 to 74 Years | 0 (0.0%) | 0 (0.0%) |
| 75 Years and over | 0 (0.0%) | 81 (20.3%) |
Disability Class: Ambulatory Difficulty
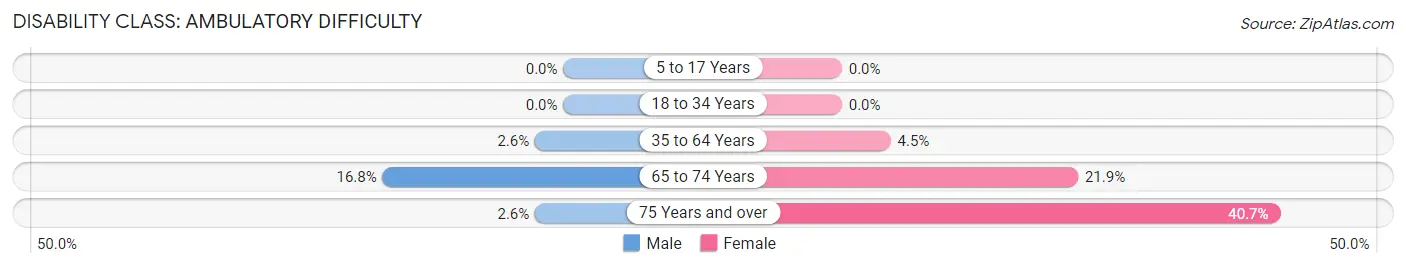
| Age Bracket | Male | Female |
| 5 to 17 Years | 0 (0.0%) | 0 (0.0%) |
| 18 to 34 Years | 0 (0.0%) | 0 (0.0%) |
| 35 to 64 Years | 66 (2.6%) | 121 (4.5%) |
| 65 to 74 Years | 75 (16.8%) | 114 (21.9%) |
| 75 Years and over | 7 (2.6%) | 162 (40.7%) |
Disability Class: Self-Care Difficulty
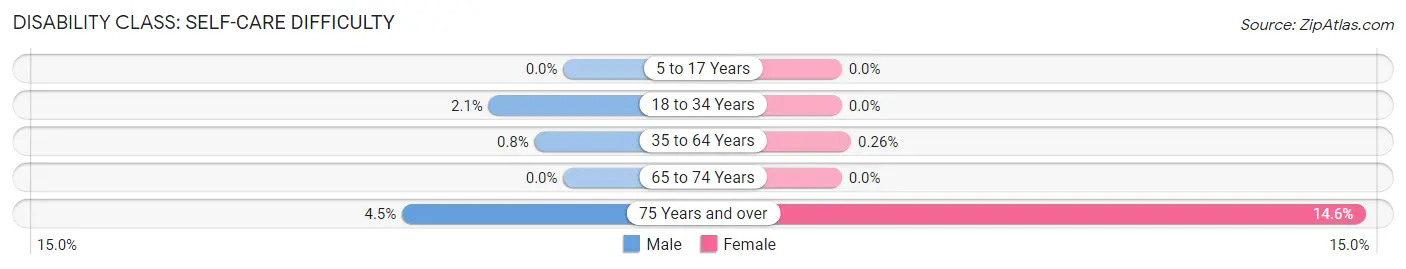
| Age Bracket | Male | Female |
| 5 to 17 Years | 0 (0.0%) | 0 (0.0%) |
| 18 to 34 Years | 15 (2.1%) | 0 (0.0%) |
| 35 to 64 Years | 20 (0.8%) | 7 (0.3%) |
| 65 to 74 Years | 0 (0.0%) | 0 (0.0%) |
| 75 Years and over | 12 (4.5%) | 58 (14.6%) |
Technology Access in Summerfield
Computing Device Access in Summerfield
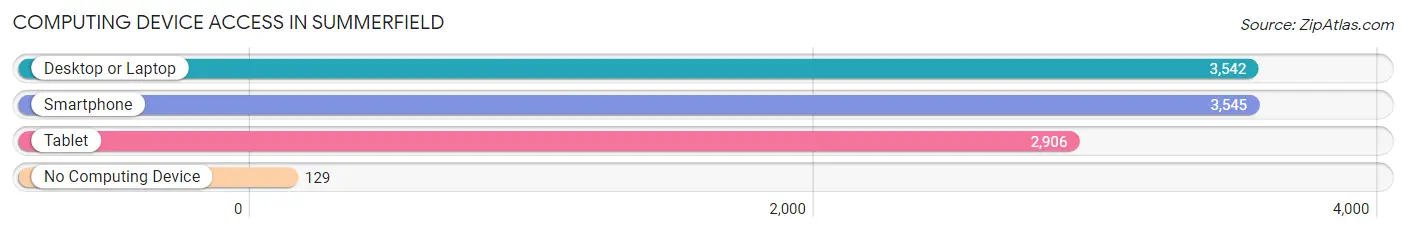
| Device Type | # Households | % Households |
| Desktop or Laptop | 3,542 | 90.6% |
| Smartphone | 3,545 | 90.7% |
| Tablet | 2,906 | 74.3% |
| No Computing Device | 129 | 3.3% |
| Total | 3,910 | 100.0% |
Internet Access in Summerfield
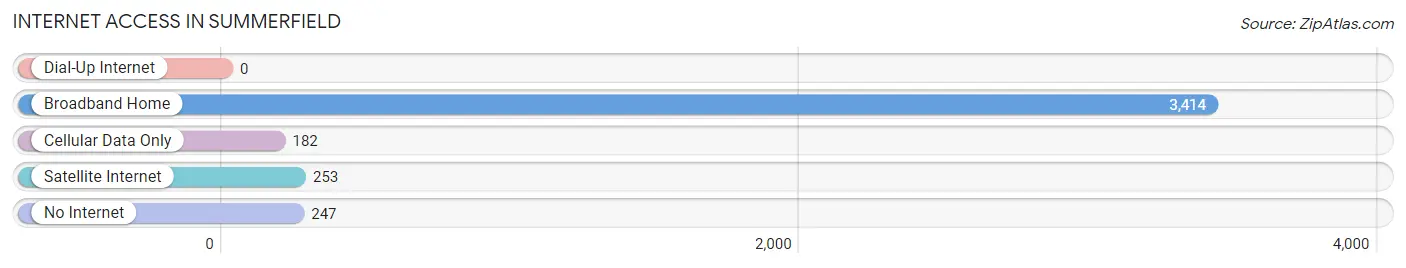
| Internet Type | # Households | % Households |
| Dial-Up Internet | 0 | 0.0% |
| Broadband Home | 3,414 | 87.3% |
| Cellular Data Only | 182 | 4.6% |
| Satellite Internet | 253 | 6.5% |
| No Internet | 247 | 6.3% |
| Total | 3,910 | 100.0% |
Summerfield Summary
Introduction
Summerfield is a small town located in Guilford County, North Carolina. It is situated in the Piedmont region of the state, approximately 20 miles northeast of Greensboro. The town was founded in 1874 and has a population of approximately 5,000 people. Summerfield is known for its rural charm and small-town atmosphere, and is a popular destination for those looking to escape the hustle and bustle of city life.
History
Summerfield was founded in 1874 by a group of settlers from the nearby town of Jamestown. The town was named after the nearby Summerfield Methodist Church, which was built in 1871. The town quickly grew and by the early 1900s, it had become a thriving agricultural community. The town was home to several cotton mills, a sawmill, and a gristmill.
In the 1950s, Summerfield began to experience a period of growth and development. The town was incorporated in 1956 and the population began to increase. In the 1960s, the town was home to several new businesses, including a grocery store, a hardware store, and a bank.
Geography
Summerfield is located in the Piedmont region of North Carolina, approximately 20 miles northeast of Greensboro. The town is situated in a rural area, surrounded by rolling hills and farmland. The town is located near the Haw River, which provides a scenic backdrop for the town.
The climate in Summerfield is mild and temperate, with hot summers and cool winters. The average temperature in the summer is around 80 degrees Fahrenheit, while the average temperature in the winter is around 40 degrees Fahrenheit.
Economy
The economy of Summerfield is largely based on agriculture. The town is home to several farms, which produce a variety of crops, including corn, soybeans, and tobacco. The town is also home to several small businesses, including restaurants, retail stores, and service providers.
Demographics
As of the 2010 census, the population of Summerfield was 5,000. The town is predominantly white, with approximately 90% of the population identifying as Caucasian. The remaining 10% of the population is made up of African Americans, Hispanics, and other ethnicities. The median household income in Summerfield is $50,000, and the median home value is $150,000.
Conclusion
Summerfield is a small town located in Guilford County, North Carolina. It is situated in the Piedmont region of the state, approximately 20 miles northeast of Greensboro. The town was founded in 1874 and has a population of approximately 5,000 people. Summerfield is known for its rural charm and small-town atmosphere, and is a popular destination for those looking to escape the hustle and bustle of city life. The economy of Summerfield is largely based on agriculture, and the town is home to several small businesses. The population of Summerfield is predominantly white, with approximately 90% of the population identifying as Caucasian. The median household income in Summerfield is $50,000, and the median home value is $150,000.
Common Questions
What is Per Capita Income in Summerfield?
Per Capita income in Summerfield is $65,001.
What is the Median Family Income in Summerfield?
Median Family Income in Summerfield is $169,597.
What is the Median Household income in Summerfield?
Median Household Income in Summerfield is $148,182.
What is Income or Wage Gap in Summerfield?
Income or Wage Gap in Summerfield is 64.8%.
Women in Summerfield earn 35.2 cents for every dollar earned by a man.
What is Family Income Deficit in Summerfield?
Family Income Deficit in Summerfield is $8,614.
Families that are below poverty line in Summerfield earn $8,614 less on average than the poverty threshold level.
What is Inequality or Gini Index in Summerfield?
Inequality or Gini Index in Summerfield is 0.47.
What is the Total Population of Summerfield?
Total Population of Summerfield is 10,986.
What is the Total Male Population of Summerfield?
Total Male Population of Summerfield is 5,197.
What is the Total Female Population of Summerfield?
Total Female Population of Summerfield is 5,789.
What is the Ratio of Males per 100 Females in Summerfield?
There are 89.77 Males per 100 Females in Summerfield.
What is the Ratio of Females per 100 Males in Summerfield?
There are 111.39 Females per 100 Males in Summerfield.
What is the Median Population Age in Summerfield?
Median Population Age in Summerfield is 45.1 Years.
What is the Average Family Size in Summerfield
Average Family Size in Summerfield is 3.2 People.
What is the Average Household Size in Summerfield
Average Household Size in Summerfield is 2.8 People.
How Large is the Labor Force in Summerfield?
There are 5,524 People in the Labor Forcein in Summerfield.
What is the Percentage of People in the Labor Force in Summerfield?
62.6% of People are in the Labor Force in Summerfield.
What is the Unemployment Rate in Summerfield?
Unemployment Rate in Summerfield is 2.9%.