Cities with the Most Immigrants from China in Nevada
RELATED REPORTS & OPTIONS
China
Nevada
Compare Cities
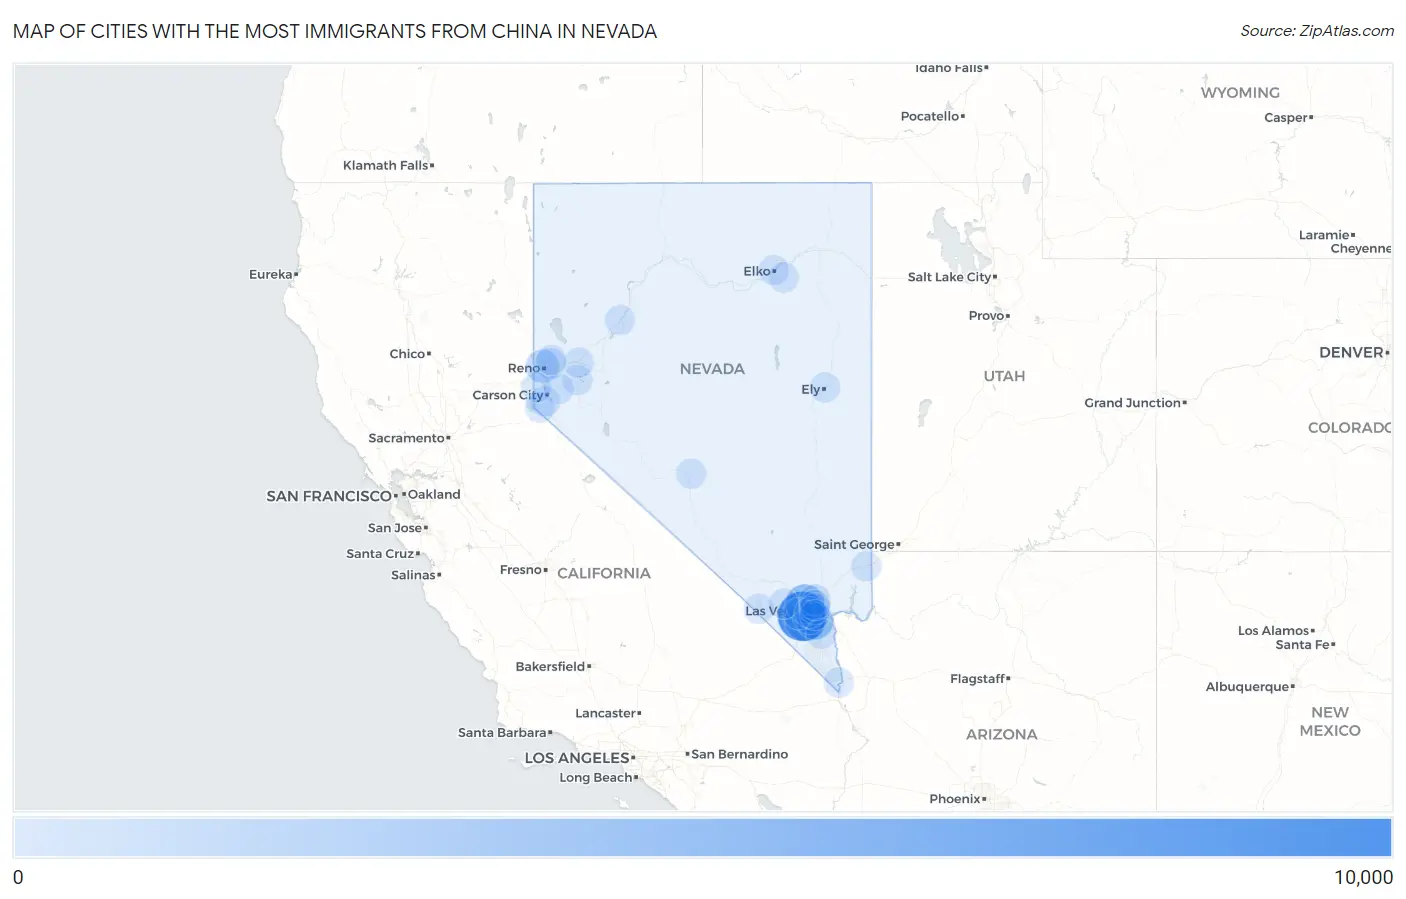
Map of Cities with the Most Immigrants from China in Nevada
0
10,000
Cities with the Most Immigrants from China in Nevada
| City | China | vs State | vs National | |
| 1. | Spring Valley | 9,654 | 27,436(35.19%)#1 | 2,829,008(0.34%)#34 |
| 2. | Enterprise | 4,835 | 27,436(17.62%)#2 | 2,829,008(0.17%)#72 |
| 3. | Las Vegas | 4,230 | 27,436(15.42%)#3 | 2,829,008(0.15%)#84 |
| 4. | Henderson | 3,076 | 27,436(11.21%)#4 | 2,829,008(0.11%)#116 |
| 5. | Paradise | 1,469 | 27,436(5.35%)#5 | 2,829,008(0.05%)#234 |
| 6. | Reno | 1,451 | 27,436(5.29%)#6 | 2,829,008(0.05%)#239 |
| 7. | Summerlin South | 573 | 27,436(2.09%)#7 | 2,829,008(0.02%)#563 |
| 8. | North Las Vegas | 512 | 27,436(1.87%)#8 | 2,829,008(0.02%)#623 |
| 9. | Winchester | 345 | 27,436(1.26%)#9 | 2,829,008(0.01%)#830 |
| 10. | Sparks | 341 | 27,436(1.24%)#10 | 2,829,008(0.01%)#838 |
| 11. | Sunrise Manor | 231 | 27,436(0.84%)#11 | 2,829,008(0.01%)#1,139 |
| 12. | Carson | 97 | 27,436(0.35%)#12 | 2,829,008(0.00%)#2,051 |
| 13. | Silver Springs | 69 | 27,436(0.25%)#13 | 2,829,008(0.00%)#2,501 |
| 14. | Boulder City | 61 | 27,436(0.22%)#14 | 2,829,008(0.00%)#2,662 |
| 15. | Lovelock | 48 | 27,436(0.17%)#15 | 2,829,008(0.00%)#3,030 |
| 16. | Pahrump | 45 | 27,436(0.16%)#16 | 2,829,008(0.00%)#3,096 |
| 17. | Mesquite | 41 | 27,436(0.15%)#17 | 2,829,008(0.00%)#3,232 |
| 18. | Dayton | 36 | 27,436(0.13%)#18 | 2,829,008(0.00%)#3,424 |
| 19. | Spring Creek | 27 | 27,436(0.10%)#19 | 2,829,008(0.00%)#3,874 |
| 20. | Indian Hills | 26 | 27,436(0.09%)#20 | 2,829,008(0.00%)#3,953 |
| 21. | Fernley | 22 | 27,436(0.08%)#21 | 2,829,008(0.00%)#4,162 |
| 22. | Whitney | 20 | 27,436(0.07%)#22 | 2,829,008(0.00%)#4,265 |
| 23. | Spanish Springs | 18 | 27,436(0.07%)#23 | 2,829,008(0.00%)#4,438 |
| 24. | Kingsbury | 18 | 27,436(0.07%)#24 | 2,829,008(0.00%)#4,484 |
| 25. | Ely | 13 | 27,436(0.05%)#25 | 2,829,008(0.00%)#4,914 |
| 26. | Incline Village | 10 | 27,436(0.04%)#26 | 2,829,008(0.00%)#5,197 |
| 27. | Tonopah | 10 | 27,436(0.04%)#27 | 2,829,008(0.00%)#5,262 |
| 28. | Laughlin | 8 | 27,436(0.03%)#28 | 2,829,008(0.00%)#5,441 |
| 29. | Mount Charleston | 6 | 27,436(0.02%)#29 | 2,829,008(0.00%)#5,814 |
| 30. | Elko | 5 | 27,436(0.02%)#30 | 2,829,008(0.00%)#5,837 |
| 31. | Nellis Afb | 1 | 27,436(0.00%)#31 | 2,829,008(0.00%)#6,473 |
1
Common Questions
What are the Top 10 Cities with the Most Immigrants from China in Nevada?
Top 10 Cities with the Most Immigrants from China in Nevada are:
#1
9,654
#2
4,835
#3
4,230
#4
3,076
#5
1,469
#6
1,451
#7
573
#8
512
#9
345
#10
341
What city has the Most Immigrants from China in Nevada?
Spring Valley has the Most Immigrants from China in Nevada with 9,654.
What is the Total Immigrants from China in the State of Nevada?
Total Immigrants from China in Nevada is 27,436.
What is the Total Immigrants from China in the United States?
Total Immigrants from China in the United States is 2,829,008.