Kingsville, MD Map & Demographics
Kingsville Map
Kingsville Overview
$56,735
PER CAPITA INCOME
$136,546
AVG FAMILY INCOME
$120,481
AVG HOUSEHOLD INCOME
28.2%
WAGE / INCOME GAP [ % ]
71.8¢/ $1
WAGE / INCOME GAP [ $ ]
0.44
INEQUALITY / GINI INDEX
4,652
TOTAL POPULATION
2,321
MALE POPULATION
2,331
FEMALE POPULATION
99.57
MALES / 100 FEMALES
100.43
FEMALES / 100 MALES
51.0
MEDIAN AGE
3.0
AVG FAMILY SIZE
2.7
AVG HOUSEHOLD SIZE
2,328
LABOR FORCE [ PEOPLE ]
60.1%
PERCENT IN LABOR FORCE
0.6%
UNEMPLOYMENT RATE
Kingsville Zip Codes
Income in Kingsville
Income Overview in Kingsville
Per Capita Income in Kingsville is $56,735, while median incomes of families and households are $136,546 and $120,481 respectively.
| Characteristic | Number | Measure |
| Per Capita Income | 4,652 | $56,735 |
| Median Family Income | 1,407 | $136,546 |
| Mean Family Income | 1,407 | $167,035 |
| Median Household Income | 1,711 | $120,481 |
| Mean Household Income | 1,711 | $149,833 |
| Income Deficit | 1,407 | $0 |
| Wage / Income Gap (%) | 4,652 | 28.24% |
| Wage / Income Gap ($) | 4,652 | 71.76¢ per $1 |
| Gini / Inequality Index | 4,652 | 0.44 |
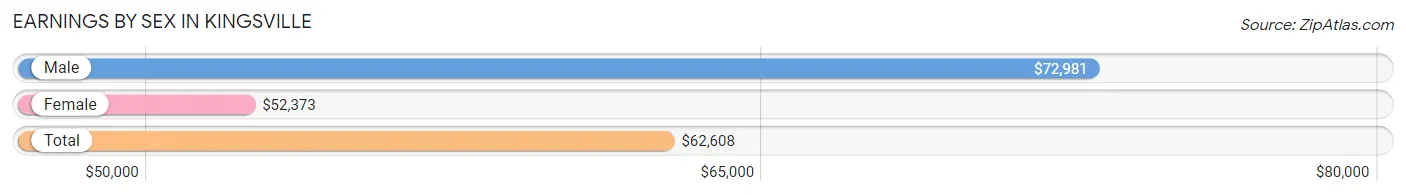
Earnings by Sex in Kingsville
Average Earnings in Kingsville are $62,608, $72,981 for men and $52,373 for women, a difference of 28.2%.
| Sex | Number | Average Earnings |
| Male | 1,401 (55.8%) | $72,981 |
| Female | 1,110 (44.2%) | $52,373 |
| Total | 2,511 (100.0%) | $62,608 |
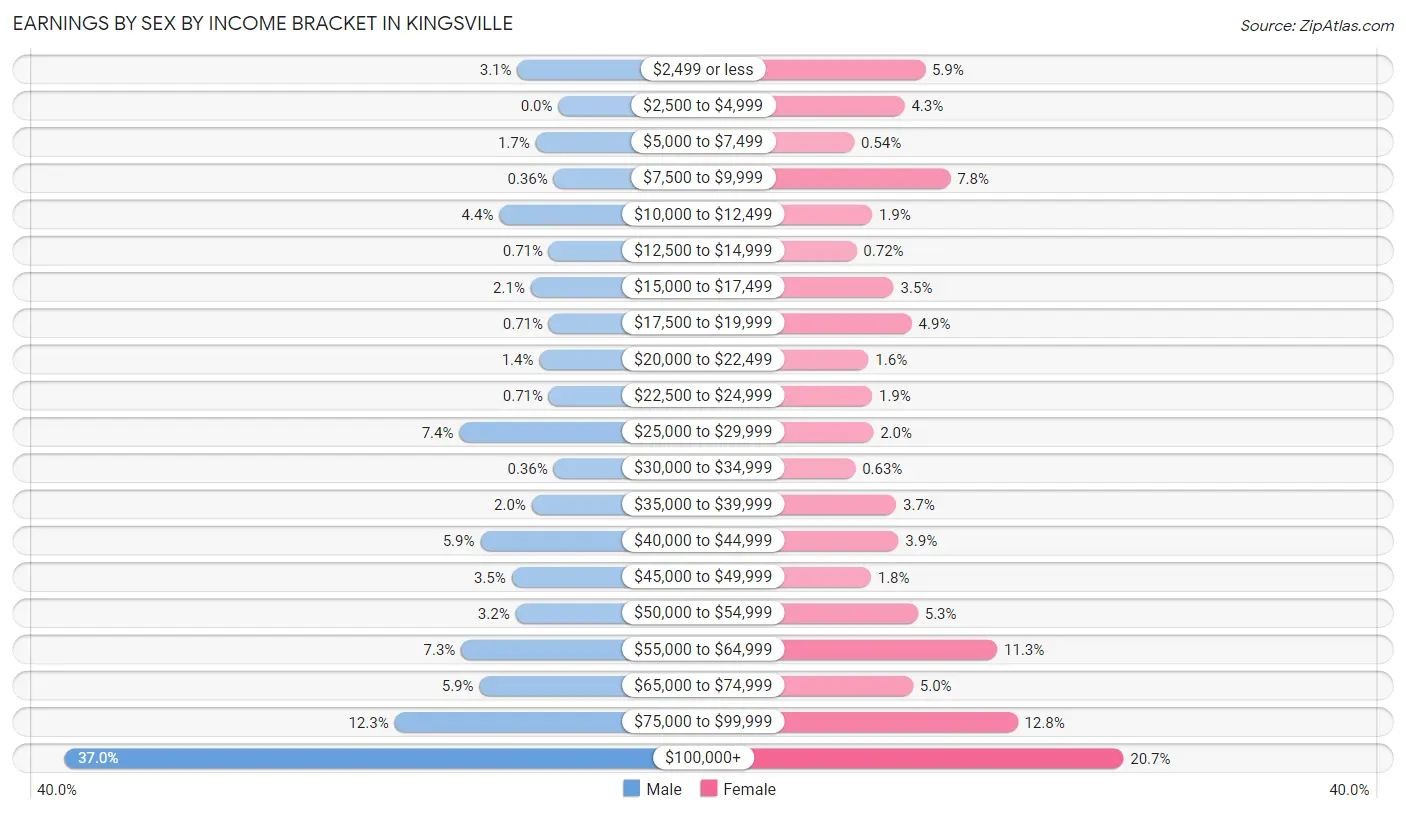
Earnings by Sex by Income Bracket in Kingsville
The most common earnings brackets in Kingsville are $100,000+ for men (518 | 37.0%) and $100,000+ for women (230 | 20.7%).
| Income | Male | Female |
| $2,499 or less | 43 (3.1%) | 65 (5.9%) |
| $2,500 to $4,999 | 0 (0.0%) | 48 (4.3%) |
| $5,000 to $7,499 | 24 (1.7%) | 6 (0.5%) |
| $7,500 to $9,999 | 5 (0.4%) | 86 (7.7%) |
| $10,000 to $12,499 | 62 (4.4%) | 21 (1.9%) |
| $12,500 to $14,999 | 10 (0.7%) | 8 (0.7%) |
| $15,000 to $17,499 | 29 (2.1%) | 39 (3.5%) |
| $17,500 to $19,999 | 10 (0.7%) | 54 (4.9%) |
| $20,000 to $22,499 | 20 (1.4%) | 18 (1.6%) |
| $22,500 to $24,999 | 10 (0.7%) | 21 (1.9%) |
| $25,000 to $29,999 | 104 (7.4%) | 22 (2.0%) |
| $30,000 to $34,999 | 5 (0.4%) | 7 (0.6%) |
| $35,000 to $39,999 | 28 (2.0%) | 41 (3.7%) |
| $40,000 to $44,999 | 82 (5.9%) | 43 (3.9%) |
| $45,000 to $49,999 | 49 (3.5%) | 20 (1.8%) |
| $50,000 to $54,999 | 45 (3.2%) | 59 (5.3%) |
| $55,000 to $64,999 | 102 (7.3%) | 125 (11.3%) |
| $65,000 to $74,999 | 83 (5.9%) | 55 (5.0%) |
| $75,000 to $99,999 | 172 (12.3%) | 142 (12.8%) |
| $100,000+ | 518 (37.0%) | 230 (20.7%) |
| Total | 1,401 (100.0%) | 1,110 (100.0%) |
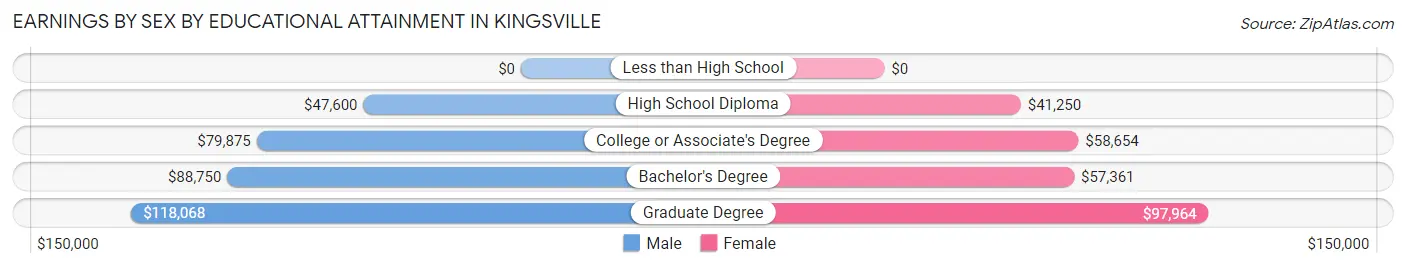
Earnings by Sex by Educational Attainment in Kingsville
Average earnings in Kingsville are $76,806 for men and $60,938 for women, a difference of 20.7%. Men with an educational attainment of graduate degree enjoy the highest average annual earnings of $118,068, while those with high school diploma education earn the least with $47,600. Women with an educational attainment of graduate degree earn the most with the average annual earnings of $97,964, while those with high school diploma education have the smallest earnings of $41,250.
| Educational Attainment | Male Income | Female Income |
| Less than High School | - | - |
| High School Diploma | $47,600 | $41,250 |
| College or Associate's Degree | $79,875 | $58,654 |
| Bachelor's Degree | $88,750 | $57,361 |
| Graduate Degree | $118,068 | $97,964 |
| Total | $76,806 | $60,938 |
Family Income in Kingsville
Family Income Brackets in Kingsville
According to the Kingsville family income data, there are 419 families falling into the $200,000+ income range, which is the most common income bracket and makes up 29.8% of all families.
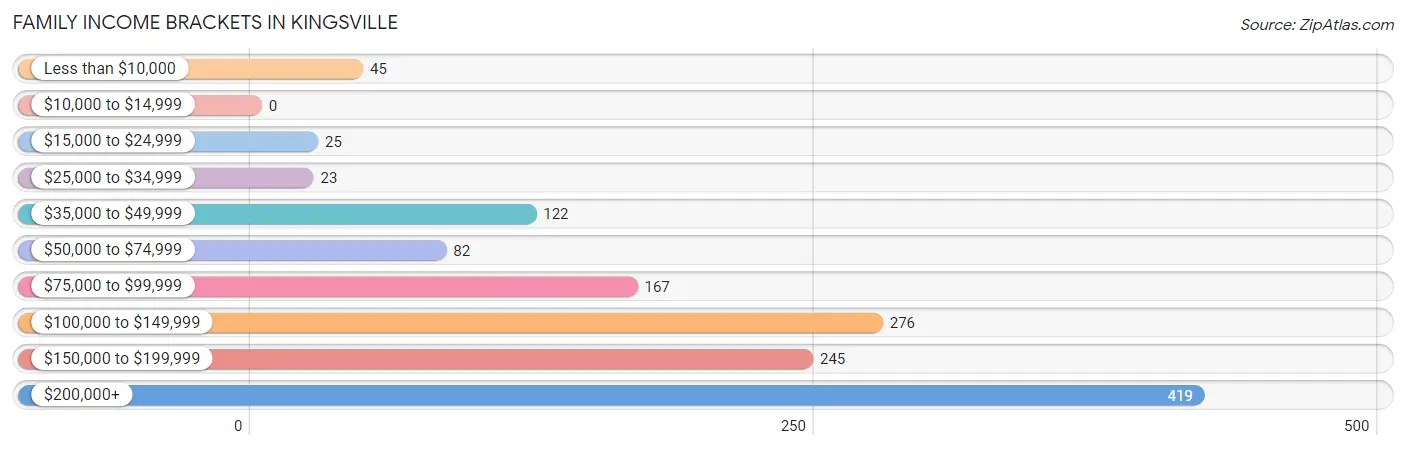
| Income Bracket | # Families | % Families |
| Less than $10,000 | 45 | 3.2% |
| $10,000 to $14,999 | 0 | 0.0% |
| $15,000 to $24,999 | 25 | 1.8% |
| $25,000 to $34,999 | 23 | 1.6% |
| $35,000 to $49,999 | 122 | 8.7% |
| $50,000 to $74,999 | 82 | 5.8% |
| $75,000 to $99,999 | 167 | 11.9% |
| $100,000 to $149,999 | 276 | 19.6% |
| $150,000 to $199,999 | 245 | 17.4% |
| $200,000+ | 419 | 29.8% |
Family Income by Famaliy Size in Kingsville
6-person families (58 | 4.1%) account for the highest median family income in Kingsville with $250,001 per family, while 2-person families (779 | 55.4%) have the highest median income of $53,211 per family member.
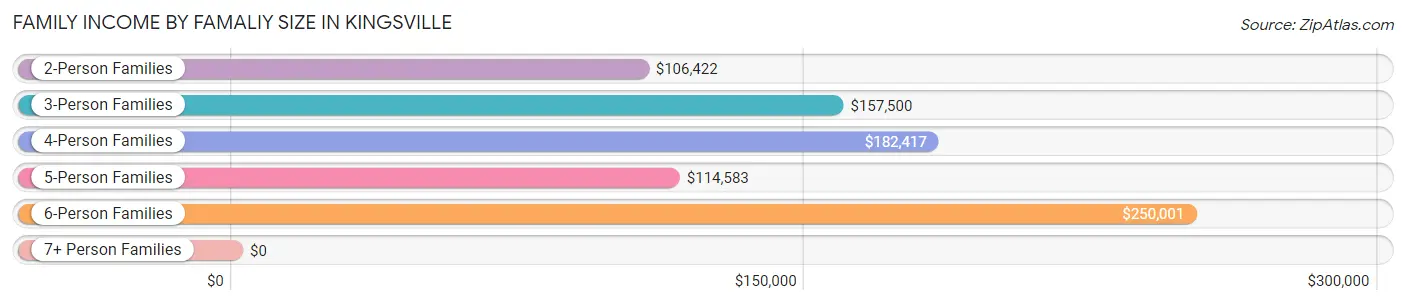
| Income Bracket | # Families | Median Income |
| 2-Person Families | 779 (55.4%) | $106,422 |
| 3-Person Families | 192 (13.7%) | $157,500 |
| 4-Person Families | 307 (21.8%) | $182,417 |
| 5-Person Families | 71 (5.1%) | $114,583 |
| 6-Person Families | 58 (4.1%) | $250,001 |
| 7+ Person Families | 0 (0.0%) | $0 |
| Total | 1,407 (100.0%) | $136,546 |
Family Income by Number of Earners in Kingsville
The median family income in Kingsville is $136,546, with families comprising 3+ earners (184) having the highest median family income of $203,077, while families with no earners (207) have the lowest median family income of $76,736, accounting for 13.1% and 14.7% of families, respectively.
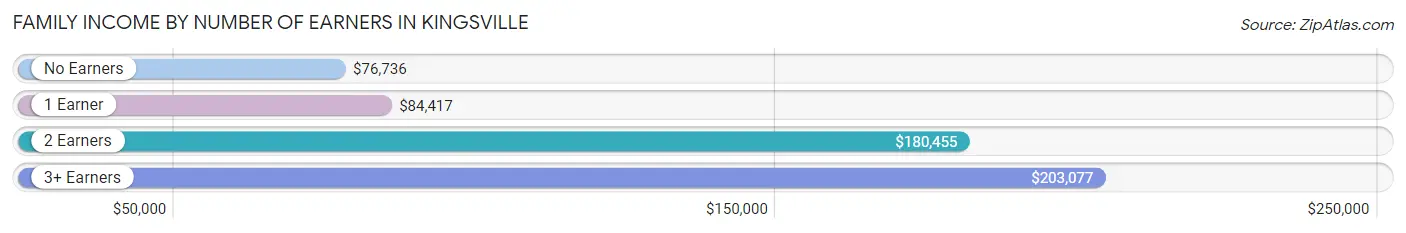
| Number of Earners | # Families | Median Income |
| No Earners | 207 (14.7%) | $76,736 |
| 1 Earner | 390 (27.7%) | $84,417 |
| 2 Earners | 626 (44.5%) | $180,455 |
| 3+ Earners | 184 (13.1%) | $203,077 |
| Total | 1,407 (100.0%) | $136,546 |
Household Income in Kingsville
Household Income Brackets in Kingsville
With 455 households falling in the category, the $200,000+ income range is the most frequent in Kingsville, accounting for 26.6% of all households. In contrast, only 29 households (1.7%) fall into the $25,000 to $34,999 income bracket, making it the least populous group.
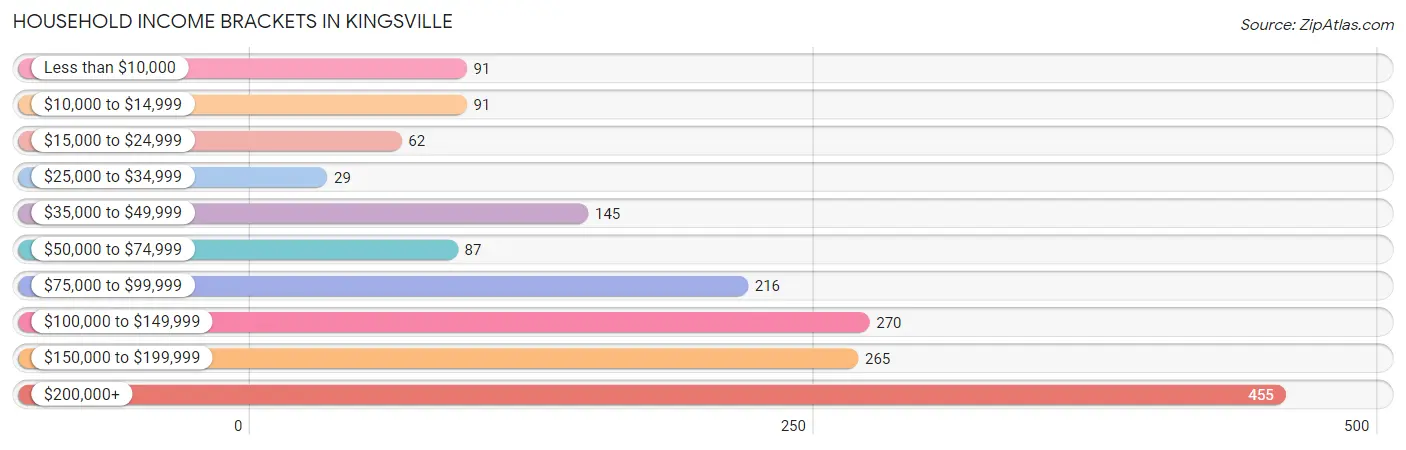
| Income Bracket | # Households | % Households |
| Less than $10,000 | 91 | 5.3% |
| $10,000 to $14,999 | 91 | 5.3% |
| $15,000 to $24,999 | 62 | 3.6% |
| $25,000 to $34,999 | 29 | 1.7% |
| $35,000 to $49,999 | 145 | 8.5% |
| $50,000 to $74,999 | 87 | 5.1% |
| $75,000 to $99,999 | 216 | 12.6% |
| $100,000 to $149,999 | 270 | 15.8% |
| $150,000 to $199,999 | 265 | 15.5% |
| $200,000+ | 455 | 26.6% |
Household Income by Householder Age in Kingsville
The median household income in Kingsville is $120,481, with the highest median household income of $182,176 found in the 25 to 44 years age bracket for the primary householder. A total of 287 households (16.8%) fall into this category. Meanwhile, the 15 to 24 years age bracket for the primary householder has the lowest median household income of $0, with 17 households (1.0%) in this group.
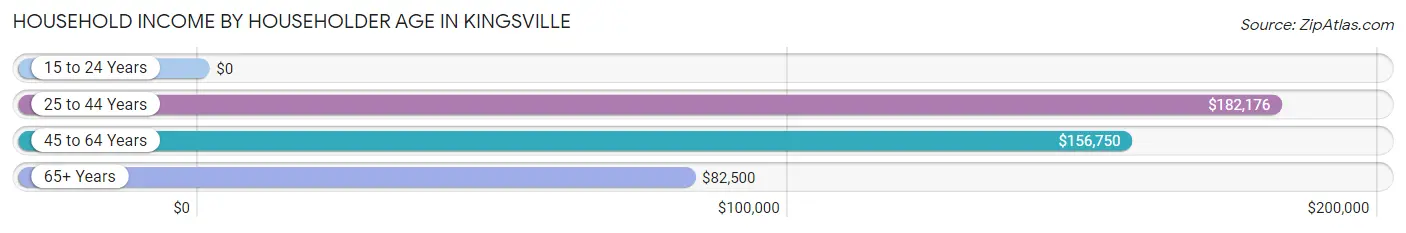
| Income Bracket | # Households | Median Income |
| 15 to 24 Years | 17 (1.0%) | $0 |
| 25 to 44 Years | 287 (16.8%) | $182,176 |
| 45 to 64 Years | 773 (45.2%) | $156,750 |
| 65+ Years | 634 (37.0%) | $82,500 |
| Total | 1,711 (100.0%) | $120,481 |
Poverty in Kingsville
Income Below Poverty by Sex and Age in Kingsville
With 8.5% poverty level for males and 3.9% for females among the residents of Kingsville, 75 year old and over males and 75 year old and over females are the most vulnerable to poverty, with 59 males (29.9%) and 56 females (23.9%) in their respective age groups living below the poverty level.
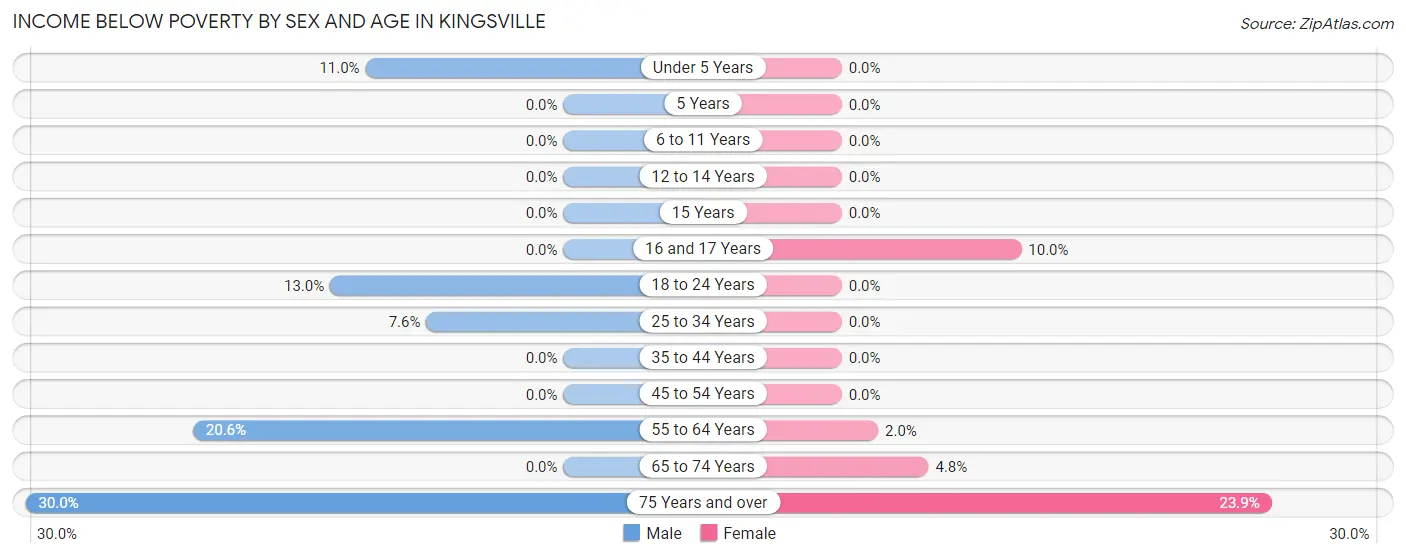
| Age Bracket | Male | Female |
| Under 5 Years | 14 (11.0%) | 0 (0.0%) |
| 5 Years | 0 (0.0%) | 0 (0.0%) |
| 6 to 11 Years | 0 (0.0%) | 0 (0.0%) |
| 12 to 14 Years | 0 (0.0%) | 0 (0.0%) |
| 15 Years | 0 (0.0%) | 0 (0.0%) |
| 16 and 17 Years | 0 (0.0%) | 7 (10.0%) |
| 18 to 24 Years | 10 (13.0%) | 0 (0.0%) |
| 25 to 34 Years | 9 (7.6%) | 0 (0.0%) |
| 35 to 44 Years | 0 (0.0%) | 0 (0.0%) |
| 45 to 54 Years | 0 (0.0%) | 0 (0.0%) |
| 55 to 64 Years | 105 (20.6%) | 8 (2.0%) |
| 65 to 74 Years | 0 (0.0%) | 19 (4.8%) |
| 75 Years and over | 59 (29.9%) | 56 (23.9%) |
| Total | 197 (8.5%) | 90 (3.9%) |
Income Above Poverty by Sex and Age in Kingsville
According to the poverty statistics in Kingsville, males aged 5 years and females aged under 5 years are the age groups that are most secure financially, with 100.0% of males and 100.0% of females in these age groups living above the poverty line.
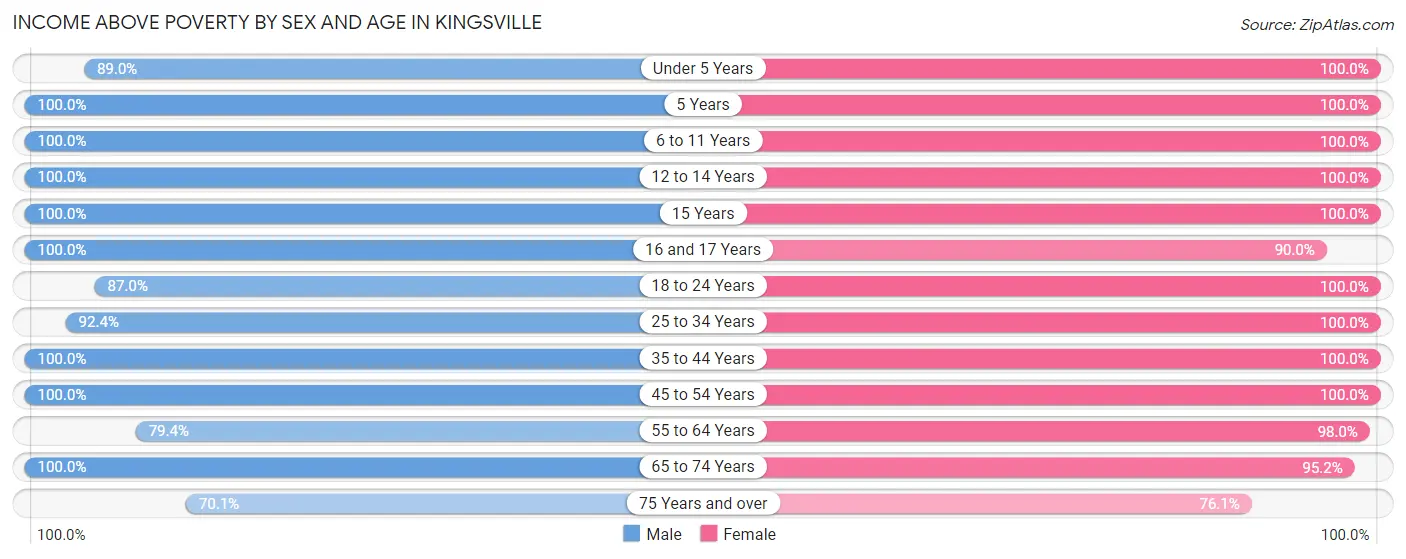
| Age Bracket | Male | Female |
| Under 5 Years | 113 (89.0%) | 133 (100.0%) |
| 5 Years | 51 (100.0%) | 31 (100.0%) |
| 6 to 11 Years | 100 (100.0%) | 174 (100.0%) |
| 12 to 14 Years | 50 (100.0%) | 48 (100.0%) |
| 15 Years | 39 (100.0%) | 8 (100.0%) |
| 16 and 17 Years | 45 (100.0%) | 63 (90.0%) |
| 18 to 24 Years | 67 (87.0%) | 175 (100.0%) |
| 25 to 34 Years | 109 (92.4%) | 146 (100.0%) |
| 35 to 44 Years | 270 (100.0%) | 323 (100.0%) |
| 45 to 54 Years | 304 (100.0%) | 190 (100.0%) |
| 55 to 64 Years | 404 (79.4%) | 389 (98.0%) |
| 65 to 74 Years | 425 (100.0%) | 374 (95.2%) |
| 75 Years and over | 138 (70.1%) | 178 (76.1%) |
| Total | 2,115 (91.5%) | 2,232 (96.1%) |
Income Below Poverty Among Married-Couple Families in Kingsville
The poverty statistics for married-couple families in Kingsville show that 3.1% or 38 of the total 1,242 families live below the poverty line. Families with no children have the highest poverty rate of 4.5%, comprising of 38 families. On the other hand, families with 1 or 2 children have the lowest poverty rate of 0.0%, which includes 0 families.
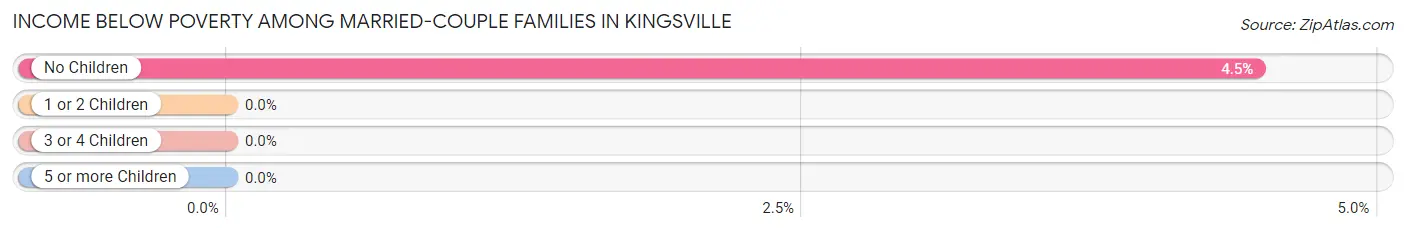
| Children | Above Poverty | Below Poverty |
| No Children | 813 (95.5%) | 38 (4.5%) |
| 1 or 2 Children | 345 (100.0%) | 0 (0.0%) |
| 3 or 4 Children | 46 (100.0%) | 0 (0.0%) |
| 5 or more Children | 0 (0.0%) | 0 (0.0%) |
| Total | 1,204 (96.9%) | 38 (3.1%) |
Income Below Poverty Among Single-Parent Households in Kingsville
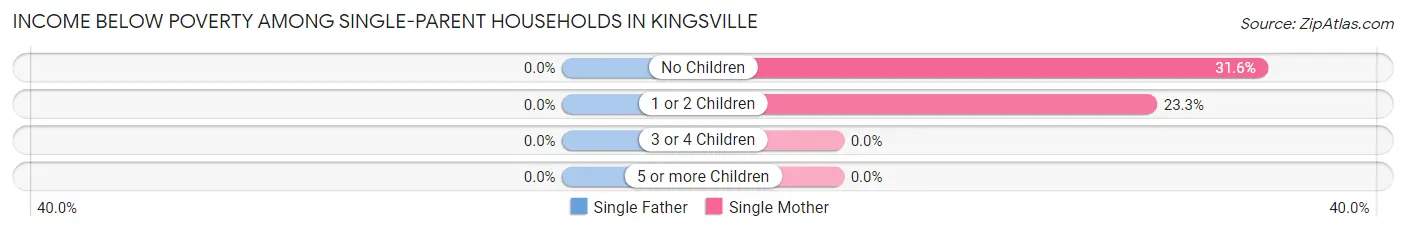
| Children | Single Father | Single Mother |
| No Children | 0 (0.0%) | 6 (31.6%) |
| 1 or 2 Children | 0 (0.0%) | 7 (23.3%) |
| 3 or 4 Children | 0 (0.0%) | 0 (0.0%) |
| 5 or more Children | 0 (0.0%) | 0 (0.0%) |
| Total | 0 (0.0%) | 13 (26.5%) |
Income Below Poverty Among Married-Couple vs Single-Parent Households in Kingsville
The poverty data for Kingsville shows that 38 of the married-couple family households (3.1%) and 13 of the single-parent households (7.9%) are living below the poverty level. Within the married-couple family households, those with no children have the highest poverty rate, with 38 households (4.5%) falling below the poverty line. Among the single-parent households, those with 1 or 2 children have the highest poverty rate, with 7 household (9.2%) living below poverty.
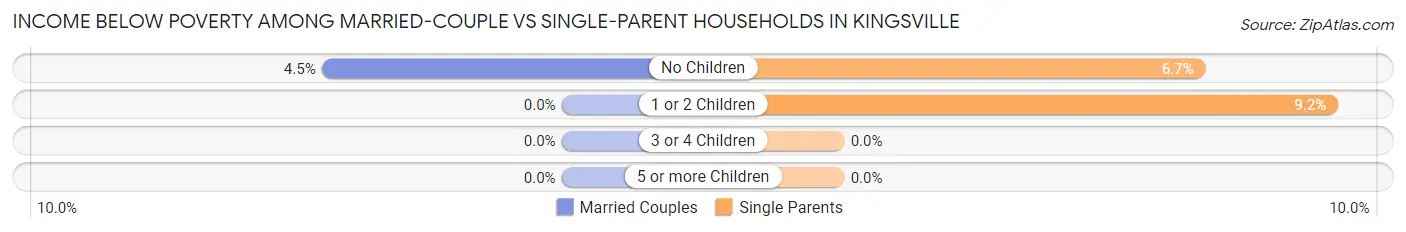
| Children | Married-Couple Families | Single-Parent Households |
| No Children | 38 (4.5%) | 6 (6.7%) |
| 1 or 2 Children | 0 (0.0%) | 7 (9.2%) |
| 3 or 4 Children | 0 (0.0%) | 0 (0.0%) |
| 5 or more Children | 0 (0.0%) | 0 (0.0%) |
| Total | 38 (3.1%) | 13 (7.9%) |
Race in Kingsville
The most populous races in Kingsville are White / Caucasian (4,517 | 97.1%), Two or more Races (86 | 1.8%), and Hispanic or Latino (38 | 0.8%).
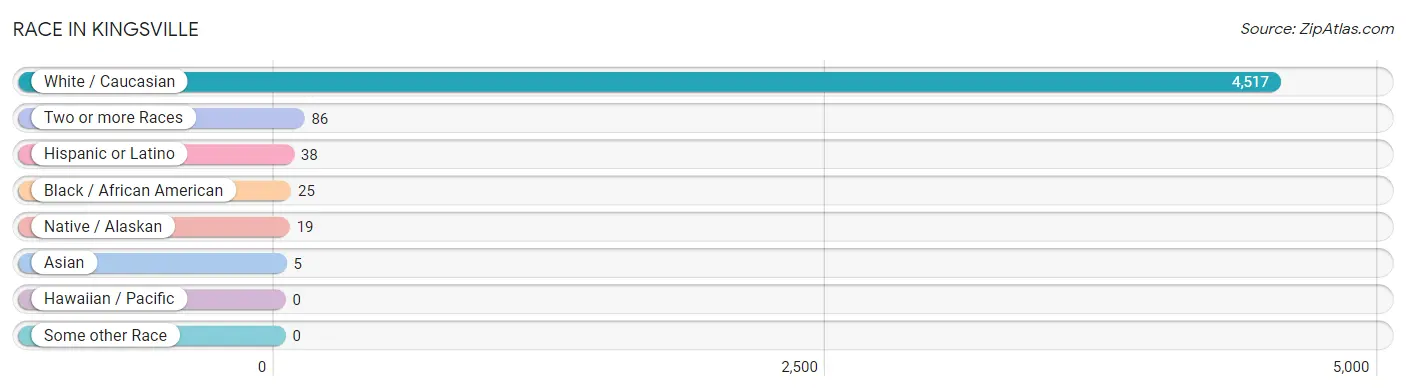
| Race | # Population | % Population |
| Asian | 5 | 0.1% |
| Black / African American | 25 | 0.5% |
| Hawaiian / Pacific | 0 | 0.0% |
| Hispanic or Latino | 38 | 0.8% |
| Native / Alaskan | 19 | 0.4% |
| White / Caucasian | 4,517 | 97.1% |
| Two or more Races | 86 | 1.8% |
| Some other Race | 0 | 0.0% |
| Total | 4,652 | 100.0% |
Ancestry in Kingsville
The most populous ancestries reported in Kingsville are German (1,568 | 33.7%), Irish (863 | 18.5%), English (569 | 12.2%), Italian (405 | 8.7%), and Polish (400 | 8.6%), together accounting for 81.8% of all Kingsville residents.
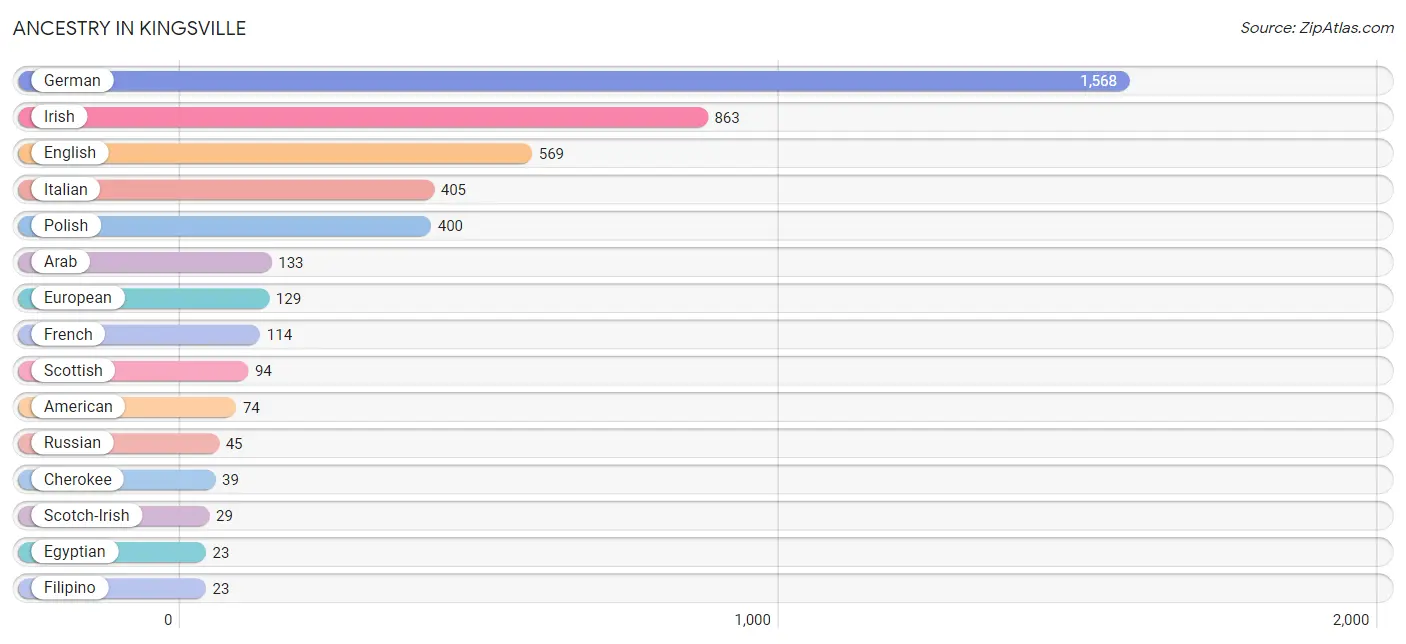
| Ancestry | # Population | % Population |
| American | 74 | 1.6% |
| Arab | 133 | 2.9% |
| Austrian | 10 | 0.2% |
| Belgian | 4 | 0.1% |
| British West Indian | 15 | 0.3% |
| Canadian | 6 | 0.1% |
| Cherokee | 39 | 0.8% |
| Choctaw | 5 | 0.1% |
| Cuban | 21 | 0.4% |
| Czech | 14 | 0.3% |
| Egyptian | 23 | 0.5% |
| English | 569 | 12.2% |
| European | 129 | 2.8% |
| Filipino | 23 | 0.5% |
| French | 114 | 2.5% |
| German | 1,568 | 33.7% |
| Greek | 12 | 0.3% |
| Irish | 863 | 18.5% |
| Italian | 405 | 8.7% |
| Jordanian | 5 | 0.1% |
| Korean | 7 | 0.2% |
| Lithuanian | 7 | 0.2% |
| Mexican | 17 | 0.4% |
| Navajo | 6 | 0.1% |
| Norwegian | 3 | 0.1% |
| Polish | 400 | 8.6% |
| Romanian | 5 | 0.1% |
| Russian | 45 | 1.0% |
| Scandinavian | 6 | 0.1% |
| Scotch-Irish | 29 | 0.6% |
| Scottish | 94 | 2.0% |
| Slovak | 13 | 0.3% |
| Swiss | 22 | 0.5% |
| Thai | 5 | 0.1% |
| Welsh | 21 | 0.4% | View All 35 Rows |
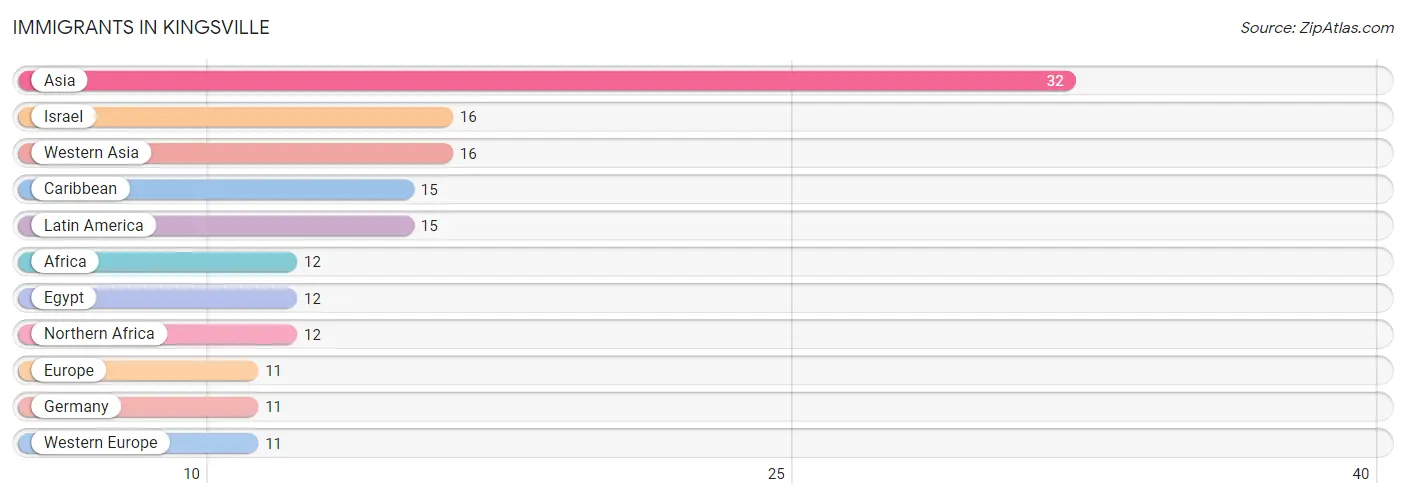
Immigrants in Kingsville
The most numerous immigrant groups reported in Kingsville came from Asia (32 | 0.7%), Israel (16 | 0.3%), Western Asia (16 | 0.3%), Caribbean (15 | 0.3%), and Latin America (15 | 0.3%), together accounting for 2.0% of all Kingsville residents.
| Immigration Origin | # Population | % Population |
| Africa | 12 | 0.3% |
| Asia | 32 | 0.7% |
| Caribbean | 15 | 0.3% |
| Egypt | 12 | 0.3% |
| Europe | 11 | 0.2% |
| Germany | 11 | 0.2% |
| Israel | 16 | 0.3% |
| Latin America | 15 | 0.3% |
| Northern Africa | 12 | 0.3% |
| Western Asia | 16 | 0.3% |
| Western Europe | 11 | 0.2% | View All 11 Rows |
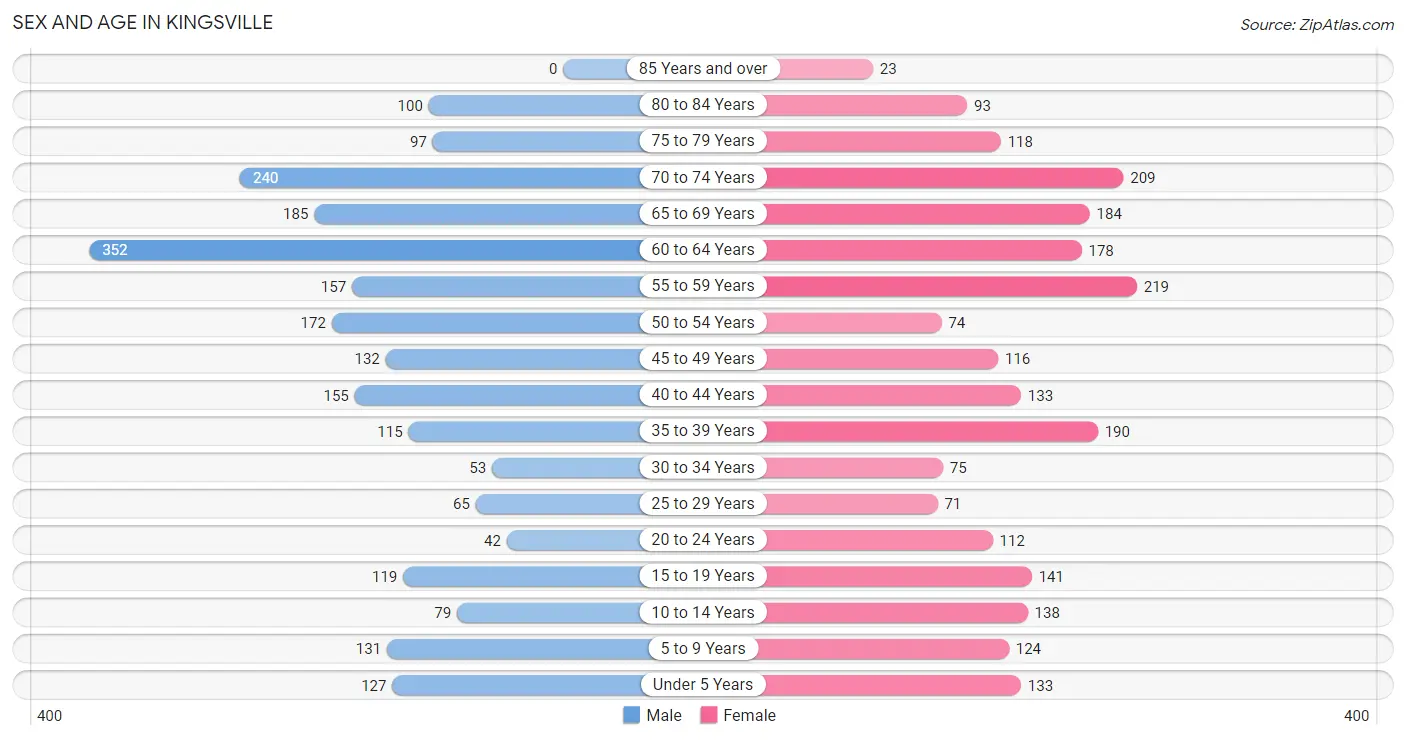
Sex and Age in Kingsville
Sex and Age in Kingsville
The most populous age groups in Kingsville are 60 to 64 Years (352 | 15.2%) for men and 55 to 59 Years (219 | 9.4%) for women.
| Age Bracket | Male | Female |
| Under 5 Years | 127 (5.5%) | 133 (5.7%) |
| 5 to 9 Years | 131 (5.6%) | 124 (5.3%) |
| 10 to 14 Years | 79 (3.4%) | 138 (5.9%) |
| 15 to 19 Years | 119 (5.1%) | 141 (6.0%) |
| 20 to 24 Years | 42 (1.8%) | 112 (4.8%) |
| 25 to 29 Years | 65 (2.8%) | 71 (3.0%) |
| 30 to 34 Years | 53 (2.3%) | 75 (3.2%) |
| 35 to 39 Years | 115 (5.0%) | 190 (8.2%) |
| 40 to 44 Years | 155 (6.7%) | 133 (5.7%) |
| 45 to 49 Years | 132 (5.7%) | 116 (5.0%) |
| 50 to 54 Years | 172 (7.4%) | 74 (3.2%) |
| 55 to 59 Years | 157 (6.8%) | 219 (9.4%) |
| 60 to 64 Years | 352 (15.2%) | 178 (7.6%) |
| 65 to 69 Years | 185 (8.0%) | 184 (7.9%) |
| 70 to 74 Years | 240 (10.3%) | 209 (9.0%) |
| 75 to 79 Years | 97 (4.2%) | 118 (5.1%) |
| 80 to 84 Years | 100 (4.3%) | 93 (4.0%) |
| 85 Years and over | 0 (0.0%) | 23 (1.0%) |
| Total | 2,321 (100.0%) | 2,331 (100.0%) |
Families and Households in Kingsville
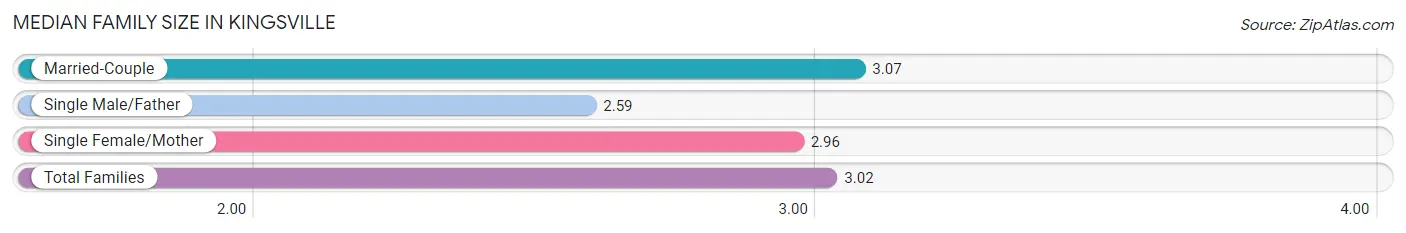
Median Family Size in Kingsville
The median family size in Kingsville is 3.02 persons per family, with married-couple families (1,242 | 88.3%) accounting for the largest median family size of 3.07 persons per family. On the other hand, single male/father families (116 | 8.2%) represent the smallest median family size with 2.59 persons per family.
| Family Type | # Families | Family Size |
| Married-Couple | 1,242 (88.3%) | 3.07 |
| Single Male/Father | 116 (8.2%) | 2.59 |
| Single Female/Mother | 49 (3.5%) | 2.96 |
| Total Families | 1,407 (100.0%) | 3.02 |
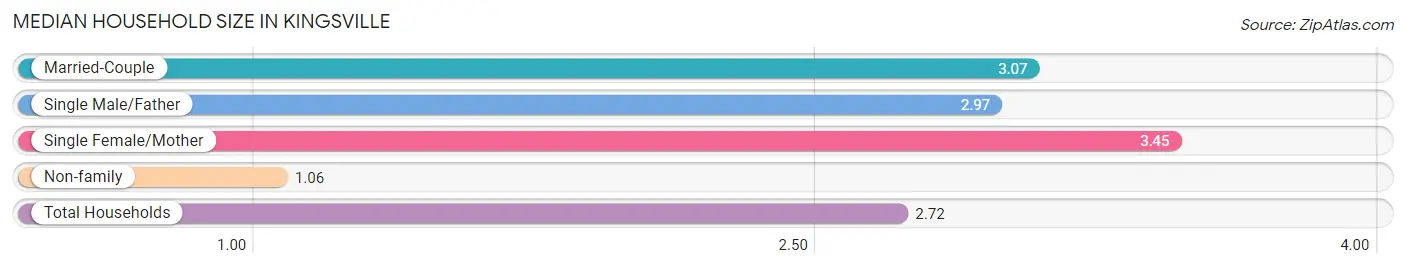
Median Household Size in Kingsville
The median household size in Kingsville is 2.72 persons per household, with single female/mother households (49 | 2.9%) accounting for the largest median household size of 3.45 persons per household. non-family households (304 | 17.8%) represent the smallest median household size with 1.06 persons per household.
| Household Type | # Households | Household Size |
| Married-Couple | 1,242 (72.6%) | 3.07 |
| Single Male/Father | 116 (6.8%) | 2.97 |
| Single Female/Mother | 49 (2.9%) | 3.45 |
| Non-family | 304 (17.8%) | 1.06 |
| Total Households | 1,711 (100.0%) | 2.72 |
Household Size by Marriage Status in Kingsville
Out of a total of 1,711 households in Kingsville, 1,407 (82.2%) are family households, while 304 (17.8%) are nonfamily households. The most numerous type of family households are 2-person households, comprising 748, and the most common type of nonfamily households are 1-person households, comprising 285.
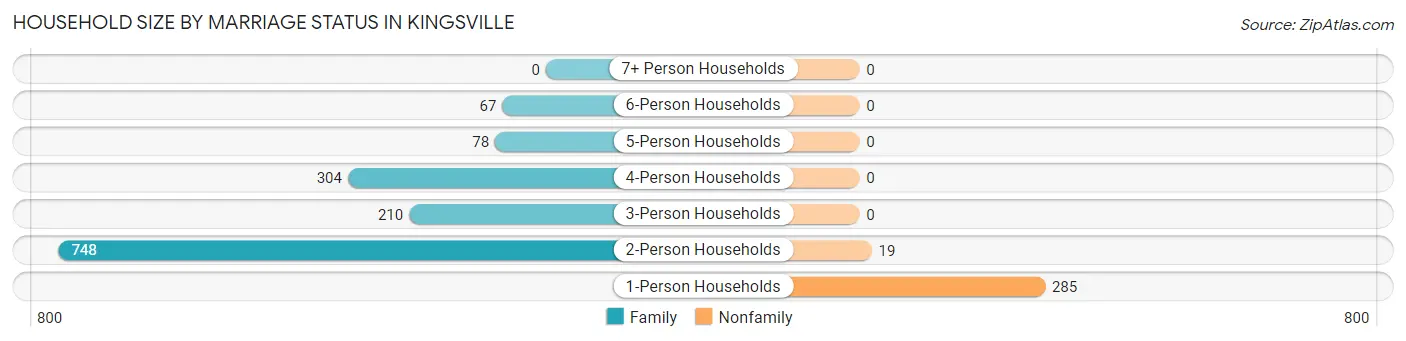
| Household Size | Family Households | Nonfamily Households |
| 1-Person Households | - | 285 (16.7%) |
| 2-Person Households | 748 (43.7%) | 19 (1.1%) |
| 3-Person Households | 210 (12.3%) | 0 (0.0%) |
| 4-Person Households | 304 (17.8%) | 0 (0.0%) |
| 5-Person Households | 78 (4.6%) | 0 (0.0%) |
| 6-Person Households | 67 (3.9%) | 0 (0.0%) |
| 7+ Person Households | 0 (0.0%) | 0 (0.0%) |
| Total | 1,407 (82.2%) | 304 (17.8%) |
Female Fertility in Kingsville
Fertility by Age in Kingsville
Average fertility rate in Kingsville is 39.0 births per 1,000 women. Women in the age bracket of 20 to 34 years have the highest fertility rate with 105.0 births per 1,000 women. Women in the age bracket of 20 to 34 years acount for 79.4% of all women with births.
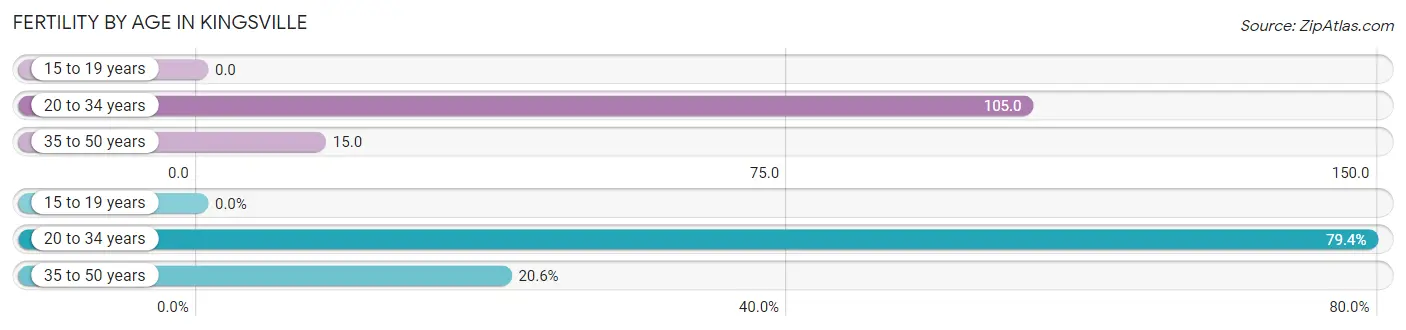
| Age Bracket | Women with Births | Births / 1,000 Women |
| 15 to 19 years | 0 (0.0%) | 0.0 |
| 20 to 34 years | 27 (79.4%) | 105.0 |
| 35 to 50 years | 7 (20.6%) | 15.0 |
| Total | 34 (100.0%) | 39.0 |
Fertility by Age by Marriage Status in Kingsville
73.5% of women with births (34) in Kingsville are married. The highest percentage of unmarried women with births falls into 20 to 34 years age bracket with 33.3% of them unmarried at the time of birth, while the lowest percentage of unmarried women with births belong to 35 to 50 years age bracket with 0.0% of them unmarried.
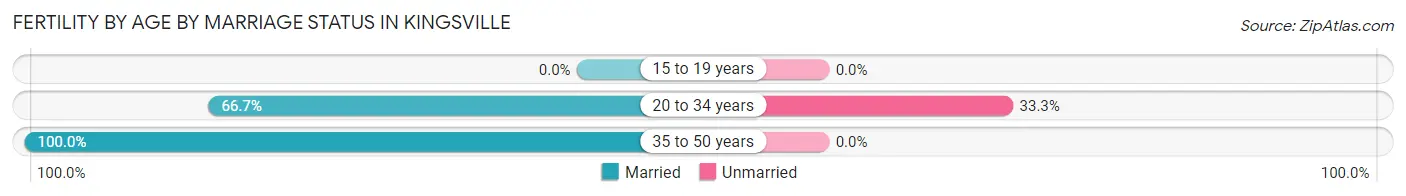
| Age Bracket | Married | Unmarried |
| 15 to 19 years | 0 (0.0%) | 0 (0.0%) |
| 20 to 34 years | 18 (66.7%) | 9 (33.3%) |
| 35 to 50 years | 7 (100.0%) | 0 (0.0%) |
| Total | 25 (73.5%) | 9 (26.5%) |
Fertility by Education in Kingsville
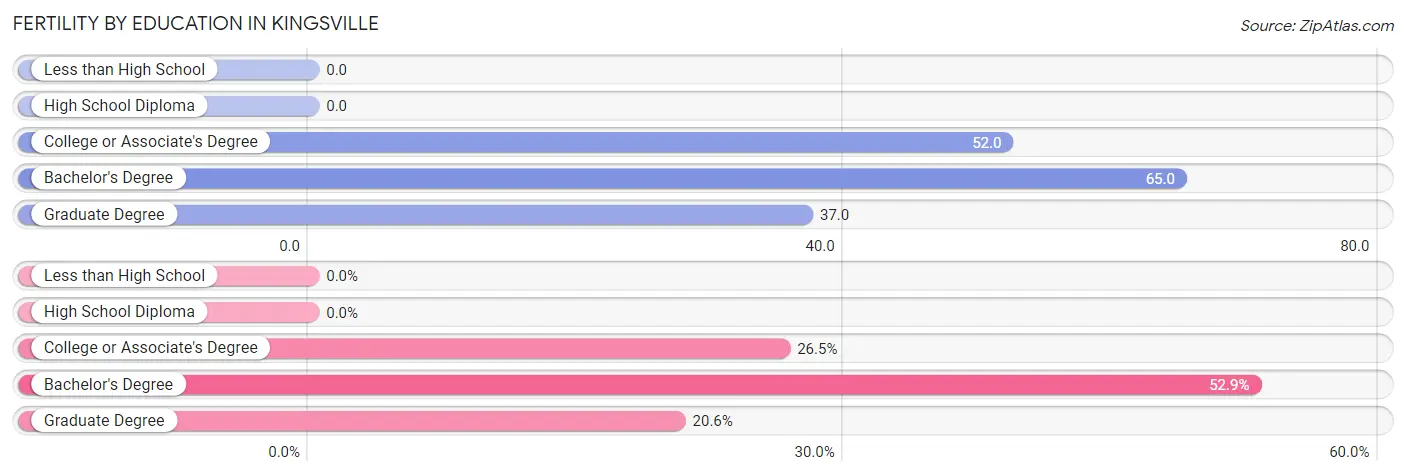
| Educational Attainment | Women with Births | Births / 1,000 Women |
| Less than High School | 0 (0.0%) | 0.0 |
| High School Diploma | 0 (0.0%) | 0.0 |
| College or Associate's Degree | 9 (26.5%) | 52.0 |
| Bachelor's Degree | 18 (52.9%) | 65.0 |
| Graduate Degree | 7 (20.6%) | 37.0 |
| Total | 34 (100.0%) | 39.0 |
Fertility by Education by Marriage Status in Kingsville
26.5% of women with births in Kingsville are unmarried. Women with the educational attainment of bachelor's degree are most likely to be married with 100.0% of them married at childbirth, while women with the educational attainment of college or associate's degree are least likely to be married with 100.0% of them unmarried at childbirth.
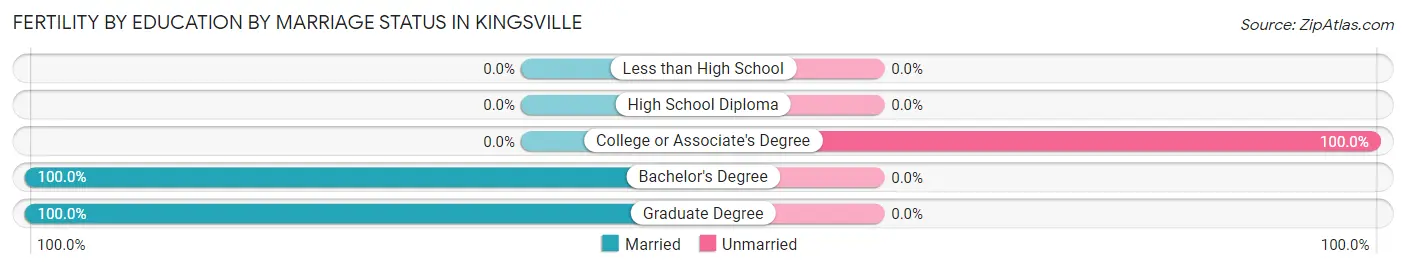
| Educational Attainment | Married | Unmarried |
| Less than High School | 0 (0.0%) | 0 (0.0%) |
| High School Diploma | 0 (0.0%) | 0 (0.0%) |
| College or Associate's Degree | 0 (0.0%) | 9 (100.0%) |
| Bachelor's Degree | 18 (100.0%) | 0 (0.0%) |
| Graduate Degree | 7 (100.0%) | 0 (0.0%) |
| Total | 25 (73.5%) | 9 (26.5%) |
Employment Characteristics in Kingsville
Employment by Class of Employer in Kingsville
Among the 2,303 employed individuals in Kingsville, private company employees (1,137 | 49.4%), not-for-profit organizations (351 | 15.2%), and self-employed (incorporated) (256 | 11.1%) make up the most common classes of employment.
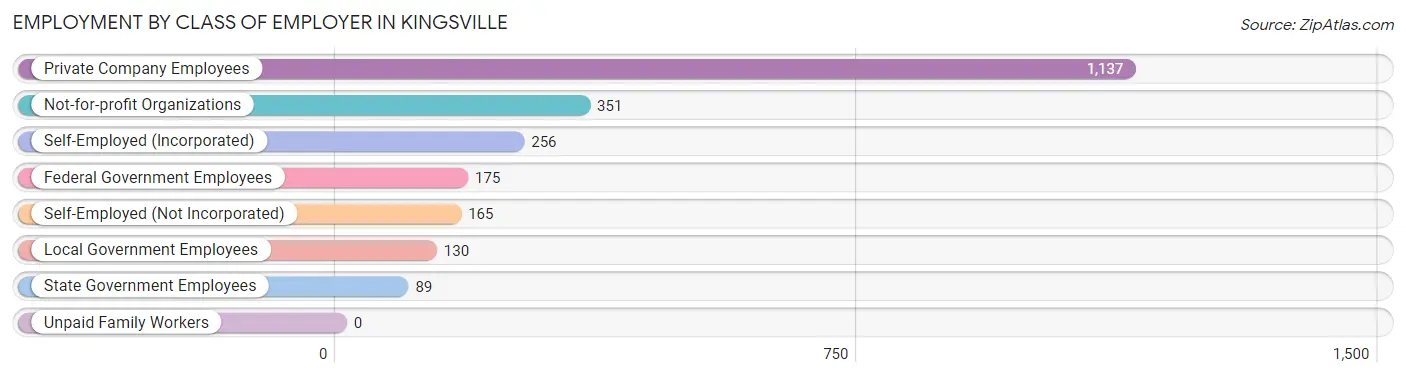
| Employer Class | # Employees | % Employees |
| Private Company Employees | 1,137 | 49.4% |
| Self-Employed (Incorporated) | 256 | 11.1% |
| Self-Employed (Not Incorporated) | 165 | 7.2% |
| Not-for-profit Organizations | 351 | 15.2% |
| Local Government Employees | 130 | 5.6% |
| State Government Employees | 89 | 3.9% |
| Federal Government Employees | 175 | 7.6% |
| Unpaid Family Workers | 0 | 0.0% |
| Total | 2,303 | 100.0% |
Employment Status by Age in Kingsville
According to the labor force statistics for Kingsville, out of the total population over 16 years of age (3,873), 60.1% or 2,328 individuals are in the labor force, with 0.6% or 14 of them unemployed. The age group with the highest labor force participation rate is 30 to 34 years, with 100.0% or 128 individuals in the labor force. Within the labor force, the 25 to 29 years age range has the highest percentage of unemployed individuals, with 7.4% or 8 of them being unemployed.
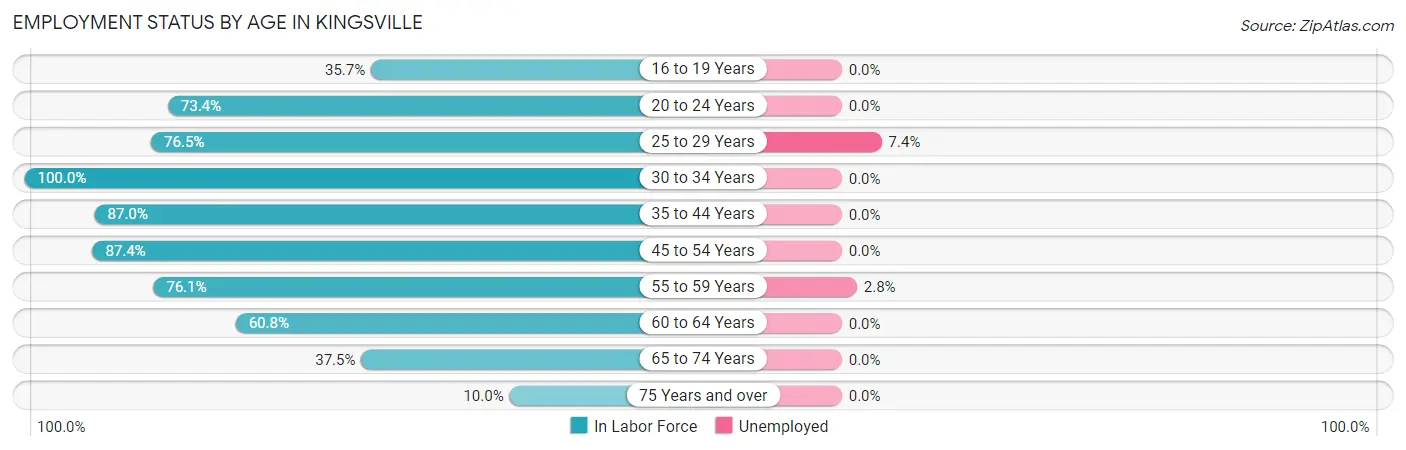
| Age Bracket | In Labor Force | Unemployed |
| 16 to 19 Years | 76 (35.7%) | 0 (0.0%) |
| 20 to 24 Years | 113 (73.4%) | 0 (0.0%) |
| 25 to 29 Years | 104 (76.5%) | 8 (7.4%) |
| 30 to 34 Years | 128 (100.0%) | 0 (0.0%) |
| 35 to 44 Years | 516 (87.0%) | 0 (0.0%) |
| 45 to 54 Years | 432 (87.4%) | 0 (0.0%) |
| 55 to 59 Years | 286 (76.1%) | 8 (2.8%) |
| 60 to 64 Years | 322 (60.8%) | 0 (0.0%) |
| 65 to 74 Years | 307 (37.5%) | 0 (0.0%) |
| 75 Years and over | 43 (10.0%) | 0 (0.0%) |
| Total | 2,328 (60.1%) | 14 (0.6%) |
Employment Status by Educational Attainment in Kingsville
According to labor force statistics for Kingsville, 79.2% of individuals (1,788) out of the total population between 25 and 64 years of age (2,257) are in the labor force, with 0.8% or 14 of them being unemployed. The group with the highest labor force participation rate are those with the educational attainment of bachelor's degree or higher, with 87.9% or 1,006 individuals in the labor force. Within the labor force, individuals with high school diploma education have the highest percentage of unemployment, with 2.0% or 8 of them being unemployed.
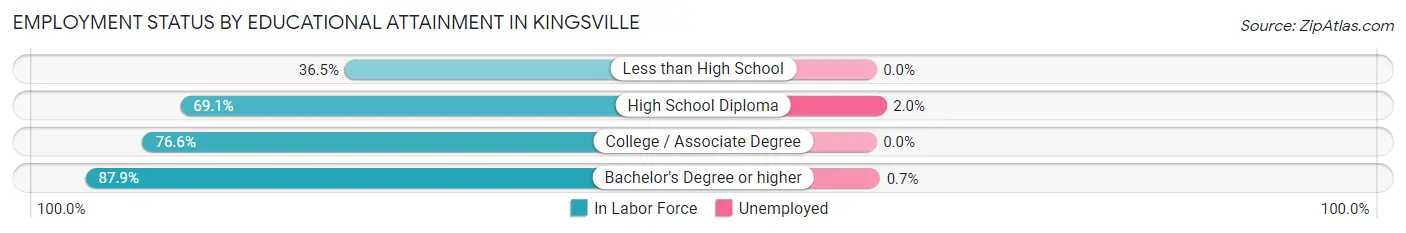
| Educational Attainment | In Labor Force | Unemployed |
| Less than High School | 23 (36.5%) | 0 (0.0%) |
| High School Diploma | 415 (69.1%) | 12 (2.0%) |
| College / Associate Degree | 343 (76.6%) | 0 (0.0%) |
| Bachelor's Degree or higher | 1,006 (87.9%) | 8 (0.7%) |
| Total | 1,788 (79.2%) | 18 (0.8%) |
Employment Occupations by Sex in Kingsville
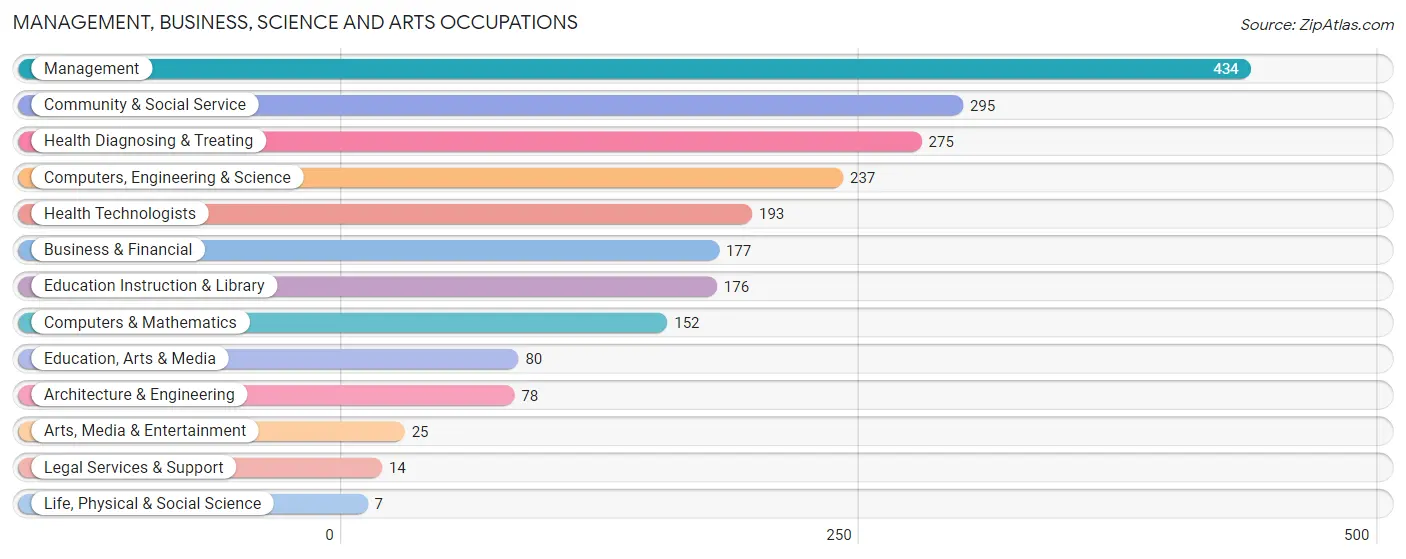
Management, Business, Science and Arts Occupations
The most common Management, Business, Science and Arts occupations in Kingsville are Management (434 | 18.9%), Community & Social Service (295 | 12.8%), Health Diagnosing & Treating (275 | 11.9%), Computers, Engineering & Science (237 | 10.3%), and Health Technologists (193 | 8.4%).
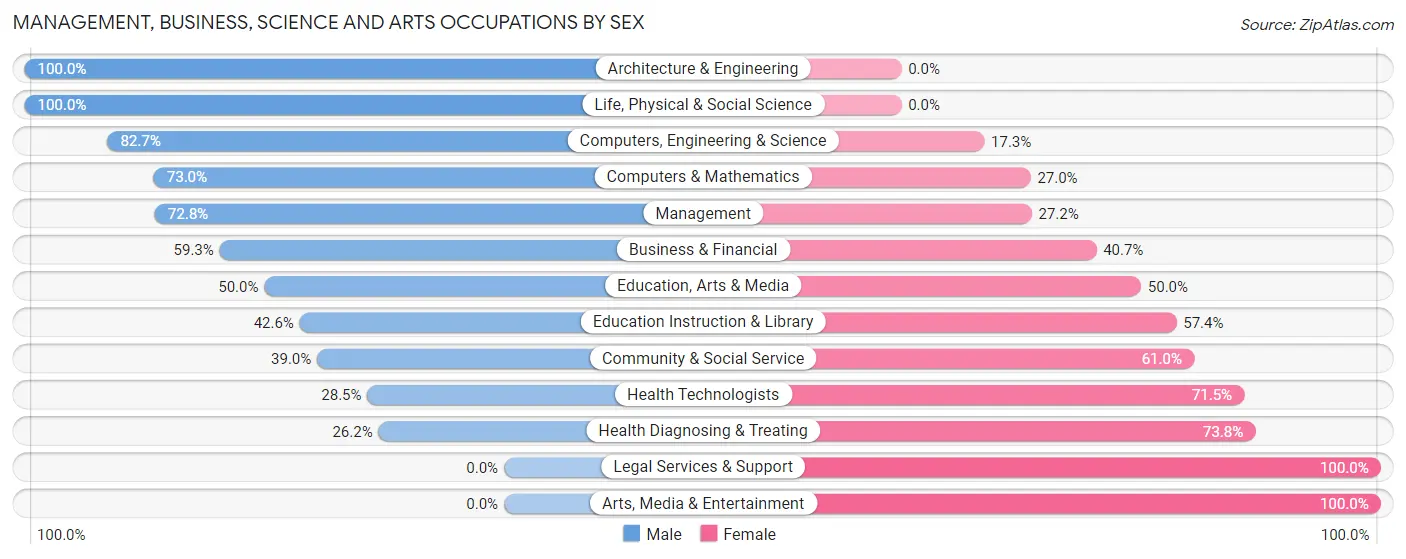
Management, Business, Science and Arts Occupations by Sex
Within the Management, Business, Science and Arts occupations in Kingsville, the most male-oriented occupations are Architecture & Engineering (100.0%), Life, Physical & Social Science (100.0%), and Computers, Engineering & Science (82.7%), while the most female-oriented occupations are Legal Services & Support (100.0%), Arts, Media & Entertainment (100.0%), and Health Diagnosing & Treating (73.8%).
| Occupation | Male | Female |
| Management | 316 (72.8%) | 118 (27.2%) |
| Business & Financial | 105 (59.3%) | 72 (40.7%) |
| Computers, Engineering & Science | 196 (82.7%) | 41 (17.3%) |
| Computers & Mathematics | 111 (73.0%) | 41 (27.0%) |
| Architecture & Engineering | 78 (100.0%) | 0 (0.0%) |
| Life, Physical & Social Science | 7 (100.0%) | 0 (0.0%) |
| Community & Social Service | 115 (39.0%) | 180 (61.0%) |
| Education, Arts & Media | 40 (50.0%) | 40 (50.0%) |
| Legal Services & Support | 0 (0.0%) | 14 (100.0%) |
| Education Instruction & Library | 75 (42.6%) | 101 (57.4%) |
| Arts, Media & Entertainment | 0 (0.0%) | 25 (100.0%) |
| Health Diagnosing & Treating | 72 (26.2%) | 203 (73.8%) |
| Health Technologists | 55 (28.5%) | 138 (71.5%) |
| Total (Category) | 804 (56.7%) | 614 (43.3%) |
| Total (Overall) | 1,346 (58.5%) | 956 (41.5%) |
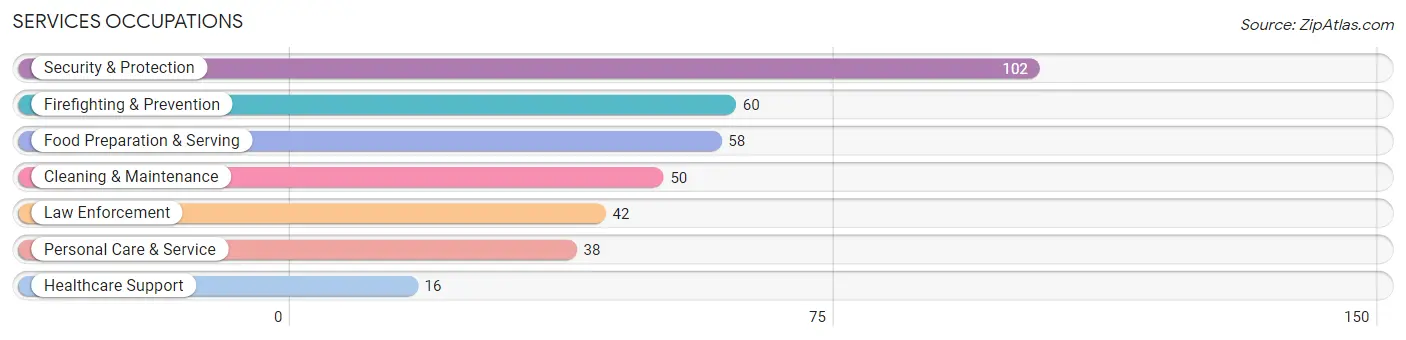
Services Occupations
The most common Services occupations in Kingsville are Security & Protection (102 | 4.4%), Firefighting & Prevention (60 | 2.6%), Food Preparation & Serving (58 | 2.5%), Cleaning & Maintenance (50 | 2.2%), and Law Enforcement (42 | 1.8%).
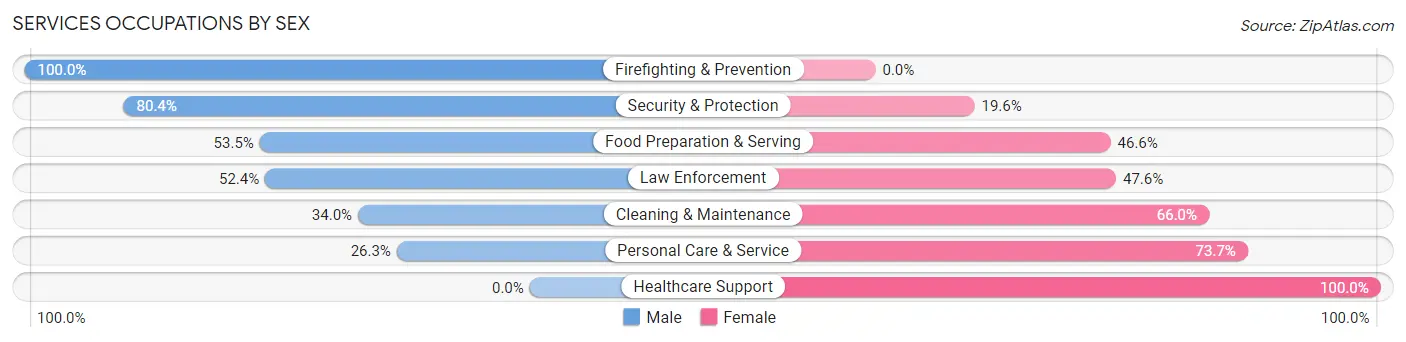
Services Occupations by Sex
Within the Services occupations in Kingsville, the most male-oriented occupations are Firefighting & Prevention (100.0%), Security & Protection (80.4%), and Food Preparation & Serving (53.4%), while the most female-oriented occupations are Healthcare Support (100.0%), Personal Care & Service (73.7%), and Cleaning & Maintenance (66.0%).
| Occupation | Male | Female |
| Healthcare Support | 0 (0.0%) | 16 (100.0%) |
| Security & Protection | 82 (80.4%) | 20 (19.6%) |
| Firefighting & Prevention | 60 (100.0%) | 0 (0.0%) |
| Law Enforcement | 22 (52.4%) | 20 (47.6%) |
| Food Preparation & Serving | 31 (53.4%) | 27 (46.6%) |
| Cleaning & Maintenance | 17 (34.0%) | 33 (66.0%) |
| Personal Care & Service | 10 (26.3%) | 28 (73.7%) |
| Total (Category) | 140 (53.0%) | 124 (47.0%) |
| Total (Overall) | 1,346 (58.5%) | 956 (41.5%) |
Sales and Office Occupations
The most common Sales and Office occupations in Kingsville are Sales & Related (235 | 10.2%), and Office & Administration (160 | 7.0%).
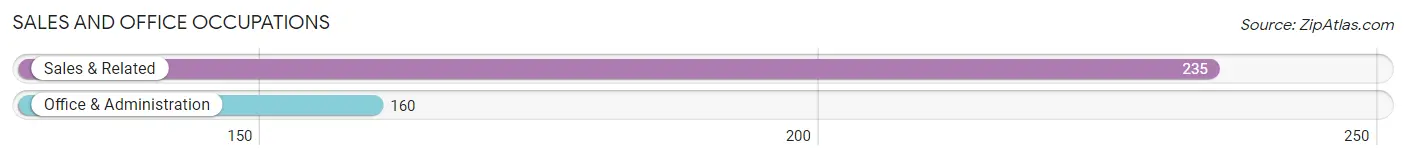
Sales and Office Occupations by Sex
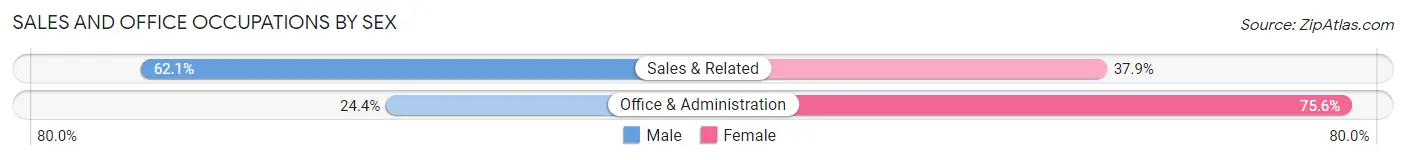
| Occupation | Male | Female |
| Sales & Related | 146 (62.1%) | 89 (37.9%) |
| Office & Administration | 39 (24.4%) | 121 (75.6%) |
| Total (Category) | 185 (46.8%) | 210 (53.2%) |
| Total (Overall) | 1,346 (58.5%) | 956 (41.5%) |
Natural Resources, Construction and Maintenance Occupations
The most common Natural Resources, Construction and Maintenance occupations in Kingsville are Installation, Maintenance & Repair (56 | 2.4%), and Construction & Extraction (53 | 2.3%).
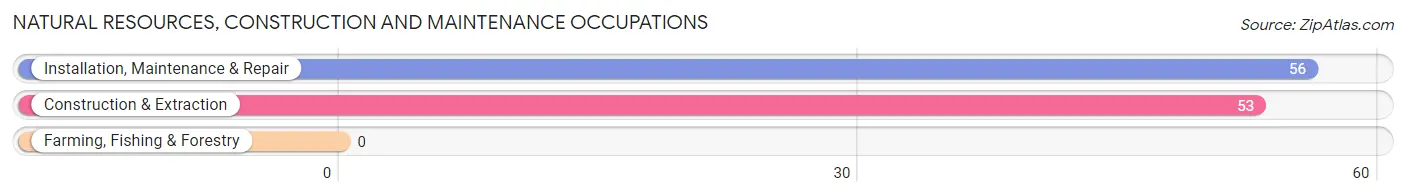
Natural Resources, Construction and Maintenance Occupations by Sex
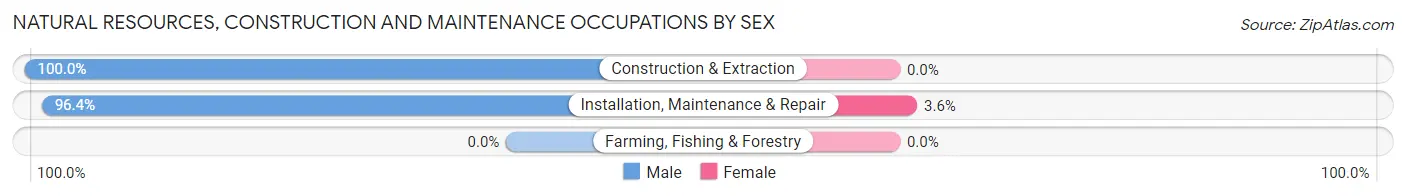
| Occupation | Male | Female |
| Farming, Fishing & Forestry | 0 (0.0%) | 0 (0.0%) |
| Construction & Extraction | 53 (100.0%) | 0 (0.0%) |
| Installation, Maintenance & Repair | 54 (96.4%) | 2 (3.6%) |
| Total (Category) | 107 (98.2%) | 2 (1.8%) |
| Total (Overall) | 1,346 (58.5%) | 956 (41.5%) |
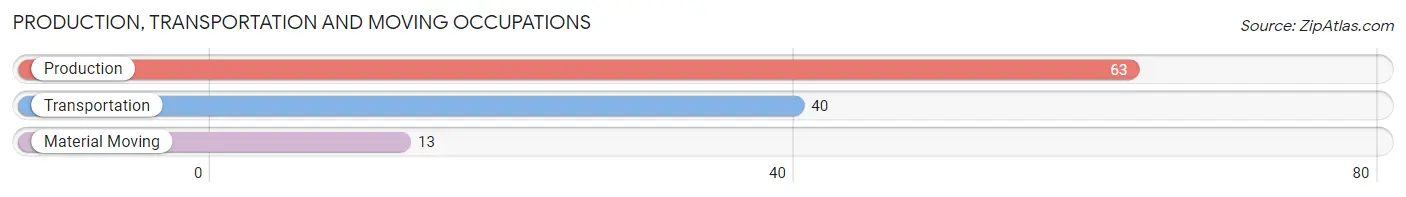
Production, Transportation and Moving Occupations
The most common Production, Transportation and Moving occupations in Kingsville are Production (63 | 2.7%), Transportation (40 | 1.7%), and Material Moving (13 | 0.6%).
Production, Transportation and Moving Occupations by Sex
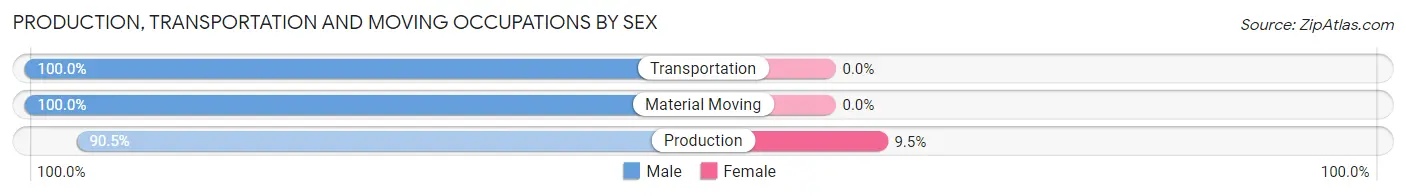
| Occupation | Male | Female |
| Production | 57 (90.5%) | 6 (9.5%) |
| Transportation | 40 (100.0%) | 0 (0.0%) |
| Material Moving | 13 (100.0%) | 0 (0.0%) |
| Total (Category) | 110 (94.8%) | 6 (5.2%) |
| Total (Overall) | 1,346 (58.5%) | 956 (41.5%) |
Employment Industries by Sex in Kingsville
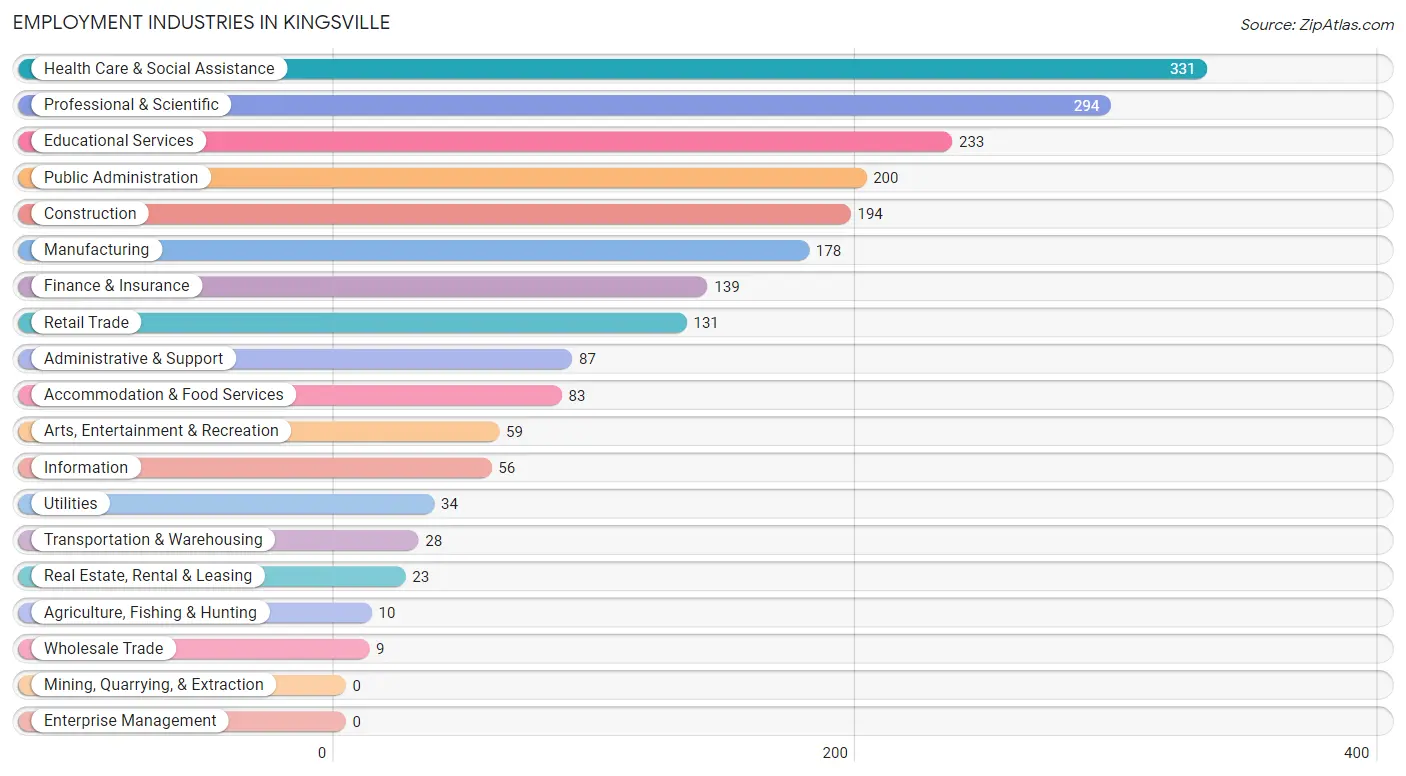
Employment Industries in Kingsville
The major employment industries in Kingsville include Health Care & Social Assistance (331 | 14.4%), Professional & Scientific (294 | 12.8%), Educational Services (233 | 10.1%), Public Administration (200 | 8.7%), and Construction (194 | 8.4%).
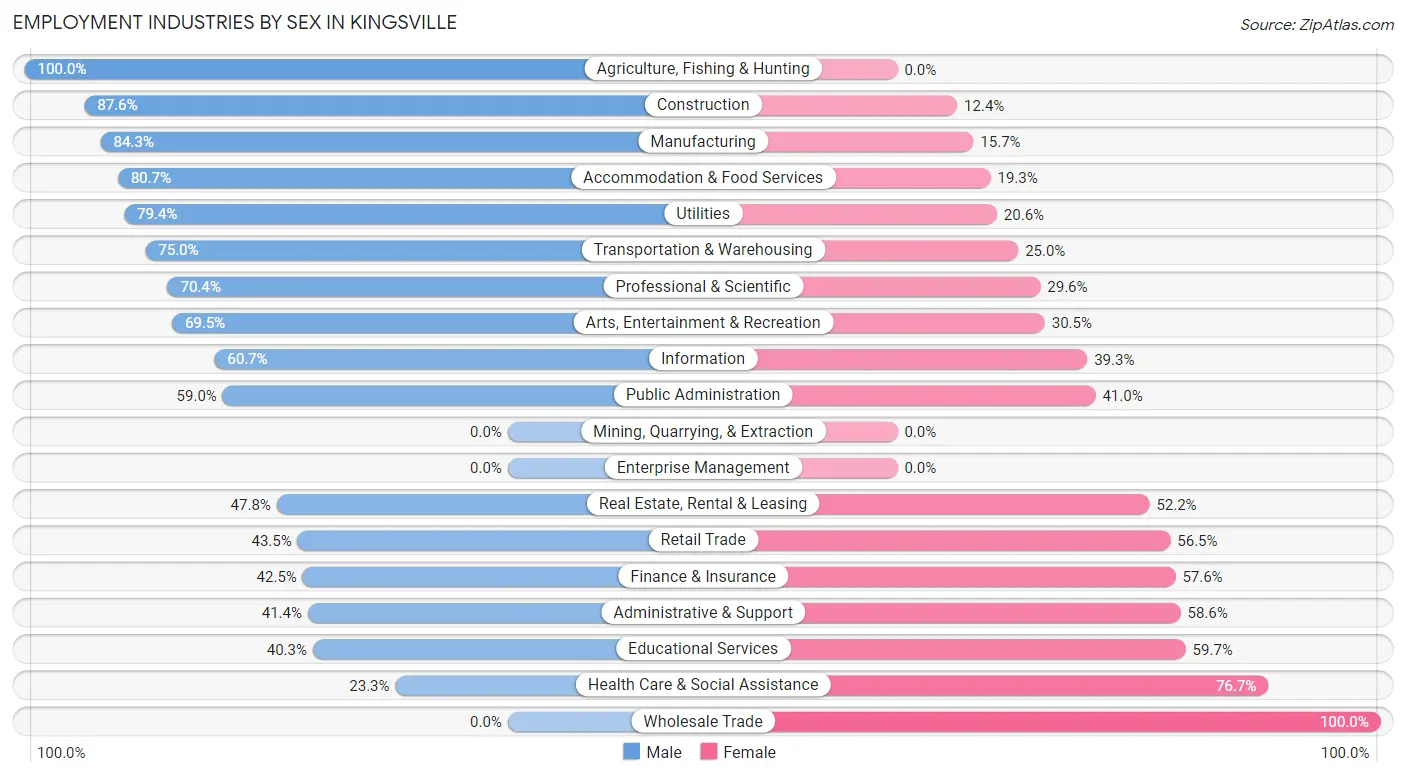
Employment Industries by Sex in Kingsville
The Kingsville industries that see more men than women are Agriculture, Fishing & Hunting (100.0%), Construction (87.6%), and Manufacturing (84.3%), whereas the industries that tend to have a higher number of women are Wholesale Trade (100.0%), Health Care & Social Assistance (76.7%), and Educational Services (59.7%).
| Industry | Male | Female |
| Agriculture, Fishing & Hunting | 10 (100.0%) | 0 (0.0%) |
| Mining, Quarrying, & Extraction | 0 (0.0%) | 0 (0.0%) |
| Construction | 170 (87.6%) | 24 (12.4%) |
| Manufacturing | 150 (84.3%) | 28 (15.7%) |
| Wholesale Trade | 0 (0.0%) | 9 (100.0%) |
| Retail Trade | 57 (43.5%) | 74 (56.5%) |
| Transportation & Warehousing | 21 (75.0%) | 7 (25.0%) |
| Utilities | 27 (79.4%) | 7 (20.6%) |
| Information | 34 (60.7%) | 22 (39.3%) |
| Finance & Insurance | 59 (42.4%) | 80 (57.6%) |
| Real Estate, Rental & Leasing | 11 (47.8%) | 12 (52.2%) |
| Professional & Scientific | 207 (70.4%) | 87 (29.6%) |
| Enterprise Management | 0 (0.0%) | 0 (0.0%) |
| Administrative & Support | 36 (41.4%) | 51 (58.6%) |
| Educational Services | 94 (40.3%) | 139 (59.7%) |
| Health Care & Social Assistance | 77 (23.3%) | 254 (76.7%) |
| Arts, Entertainment & Recreation | 41 (69.5%) | 18 (30.5%) |
| Accommodation & Food Services | 67 (80.7%) | 16 (19.3%) |
| Public Administration | 118 (59.0%) | 82 (41.0%) |
| Total | 1,346 (58.5%) | 956 (41.5%) |
Education in Kingsville
School Enrollment in Kingsville
The most common levels of schooling among the 953 students in Kingsville are middle school (208 | 21.8%), elementary school (184 | 19.3%), and high school (184 | 19.3%).
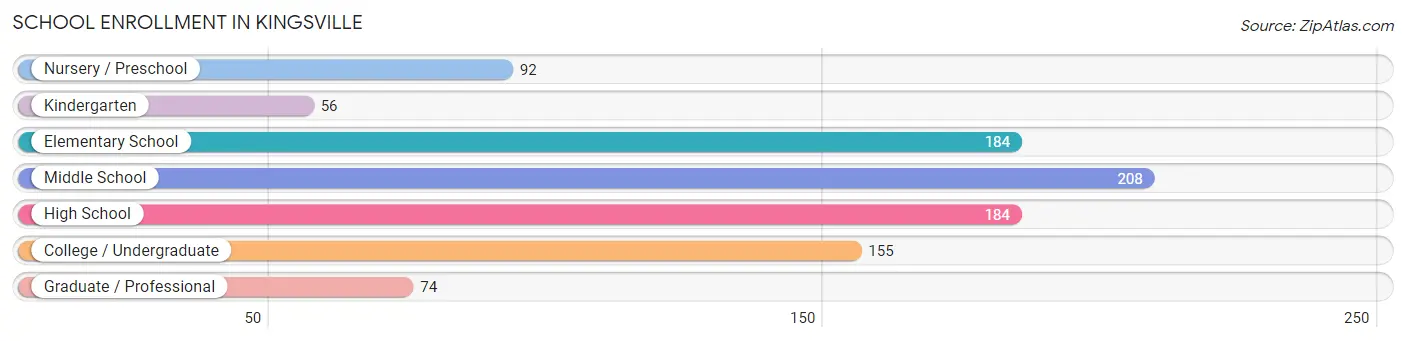
| School Level | # Students | % Students |
| Nursery / Preschool | 92 | 9.7% |
| Kindergarten | 56 | 5.9% |
| Elementary School | 184 | 19.3% |
| Middle School | 208 | 21.8% |
| High School | 184 | 19.3% |
| College / Undergraduate | 155 | 16.3% |
| Graduate / Professional | 74 | 7.8% |
| Total | 953 | 100.0% |
School Enrollment by Age by Funding Source in Kingsville
Out of a total of 953 students who are enrolled in schools in Kingsville, 384 (40.3%) attend a private institution, while the remaining 569 (59.7%) are enrolled in public schools. The age group of 15 to 17 year olds has the highest likelihood of being enrolled in private schools, with 112 (73.7% in the age bracket) enrolled. Conversely, the age group of 20 to 24 year olds has the lowest likelihood of being enrolled in a private school, with 84 (100.0% in the age bracket) attending a public institution.
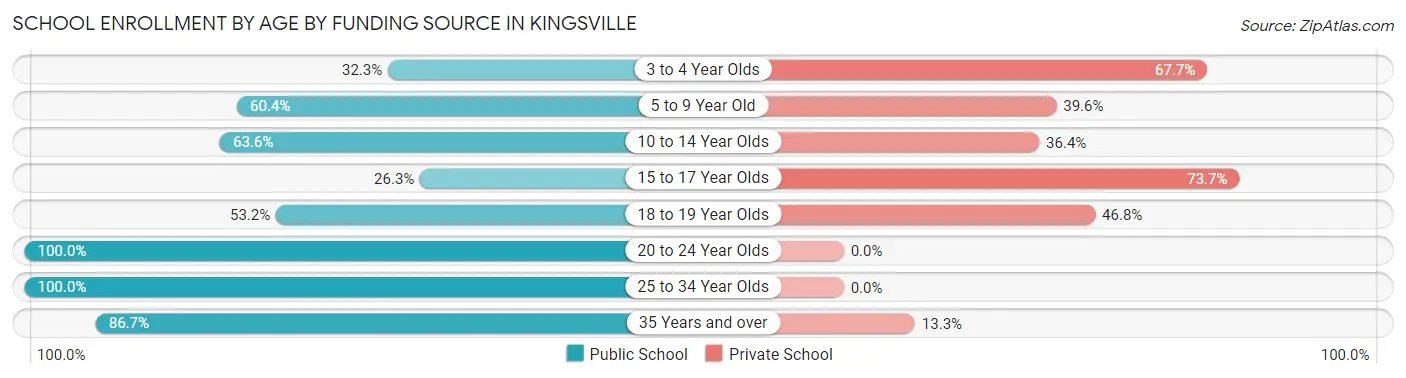
| Age Bracket | Public School | Private School |
| 3 to 4 Year Olds | 21 (32.3%) | 44 (67.7%) |
| 5 to 9 Year Old | 151 (60.4%) | 99 (39.6%) |
| 10 to 14 Year Olds | 138 (63.6%) | 79 (36.4%) |
| 15 to 17 Year Olds | 40 (26.3%) | 112 (73.7%) |
| 18 to 19 Year Olds | 42 (53.2%) | 37 (46.8%) |
| 20 to 24 Year Olds | 84 (100.0%) | 0 (0.0%) |
| 25 to 34 Year Olds | 8 (100.0%) | 0 (0.0%) |
| 35 Years and over | 85 (86.7%) | 13 (13.3%) |
| Total | 569 (59.7%) | 384 (40.3%) |
Educational Attainment by Field of Study in Kingsville
Business (341 | 21.0%), education (286 | 17.6%), science & technology (196 | 12.0%), engineering (100 | 6.1%), and arts & humanities (98 | 6.0%) are the most common fields of study among 1,626 individuals in Kingsville who have obtained a bachelor's degree or higher.
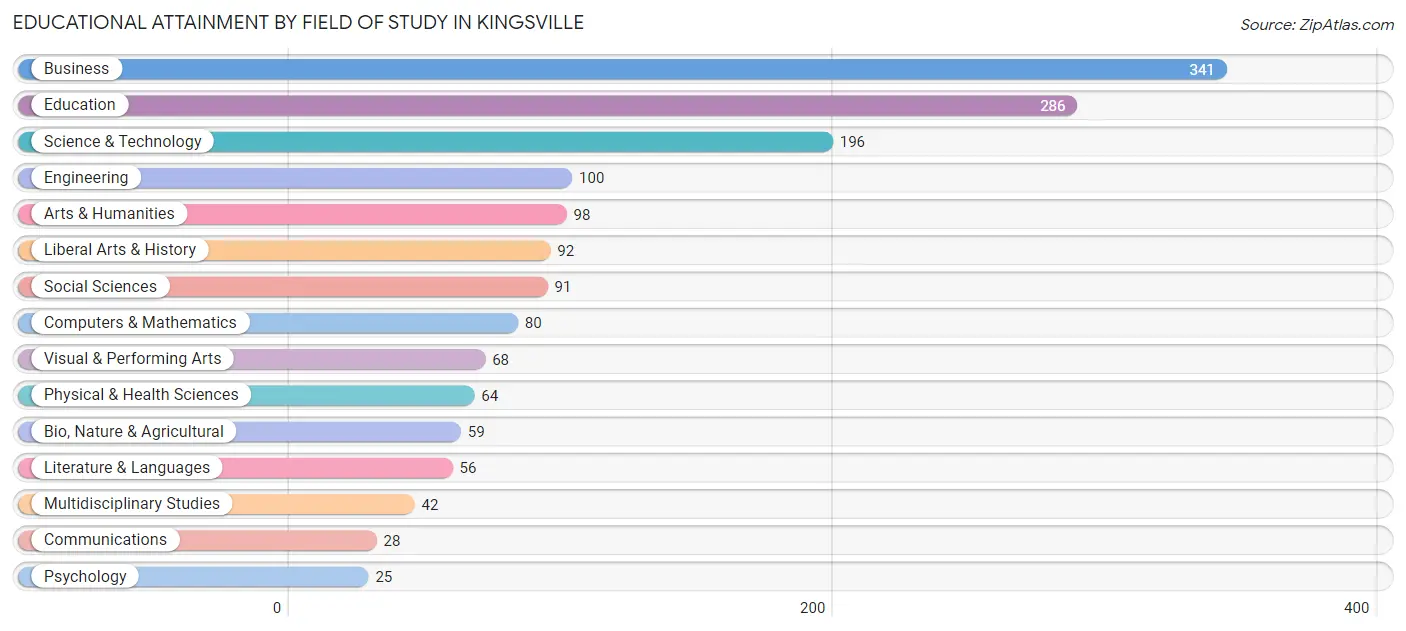
| Field of Study | # Graduates | % Graduates |
| Computers & Mathematics | 80 | 4.9% |
| Bio, Nature & Agricultural | 59 | 3.6% |
| Physical & Health Sciences | 64 | 3.9% |
| Psychology | 25 | 1.5% |
| Social Sciences | 91 | 5.6% |
| Engineering | 100 | 6.1% |
| Multidisciplinary Studies | 42 | 2.6% |
| Science & Technology | 196 | 12.0% |
| Business | 341 | 21.0% |
| Education | 286 | 17.6% |
| Literature & Languages | 56 | 3.4% |
| Liberal Arts & History | 92 | 5.7% |
| Visual & Performing Arts | 68 | 4.2% |
| Communications | 28 | 1.7% |
| Arts & Humanities | 98 | 6.0% |
| Total | 1,626 | 100.0% |
Transportation & Commute in Kingsville
Vehicle Availability by Sex in Kingsville
The most prevalent vehicle ownership categories in Kingsville are males with 2 vehicles (626, accounting for 46.5%) and females with 2 vehicles (411, making up 65.5%).
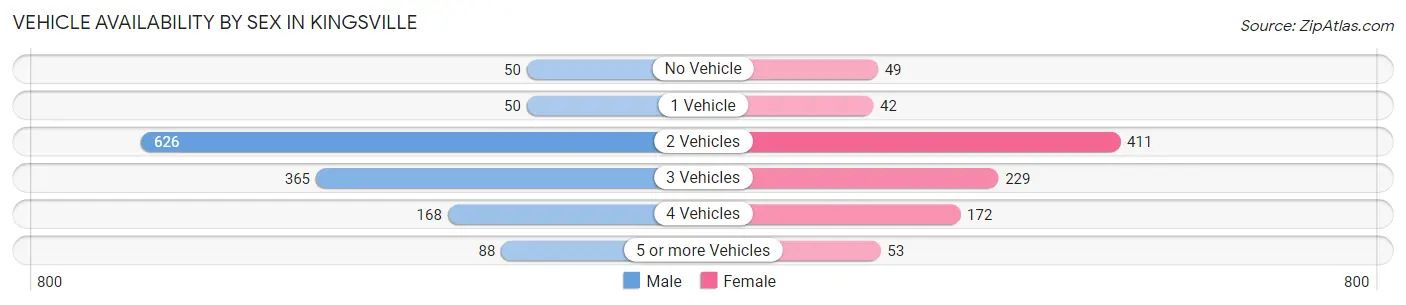
| Vehicles Available | Male | Female |
| No Vehicle | 50 (3.7%) | 49 (5.1%) |
| 1 Vehicle | 50 (3.7%) | 42 (4.4%) |
| 2 Vehicles | 626 (46.5%) | 411 (43.0%) |
| 3 Vehicles | 365 (27.1%) | 229 (23.9%) |
| 4 Vehicles | 168 (12.5%) | 172 (18.0%) |
| 5 or more Vehicles | 88 (6.5%) | 53 (5.5%) |
| Total | 1,347 (100.0%) | 956 (100.0%) |
Commute Time in Kingsville
The most frequently occuring commute durations in Kingsville are 45 to 59 minutes (397 commuters, 19.8%), 30 to 34 minutes (395 commuters, 19.7%), and 20 to 24 minutes (288 commuters, 14.4%).
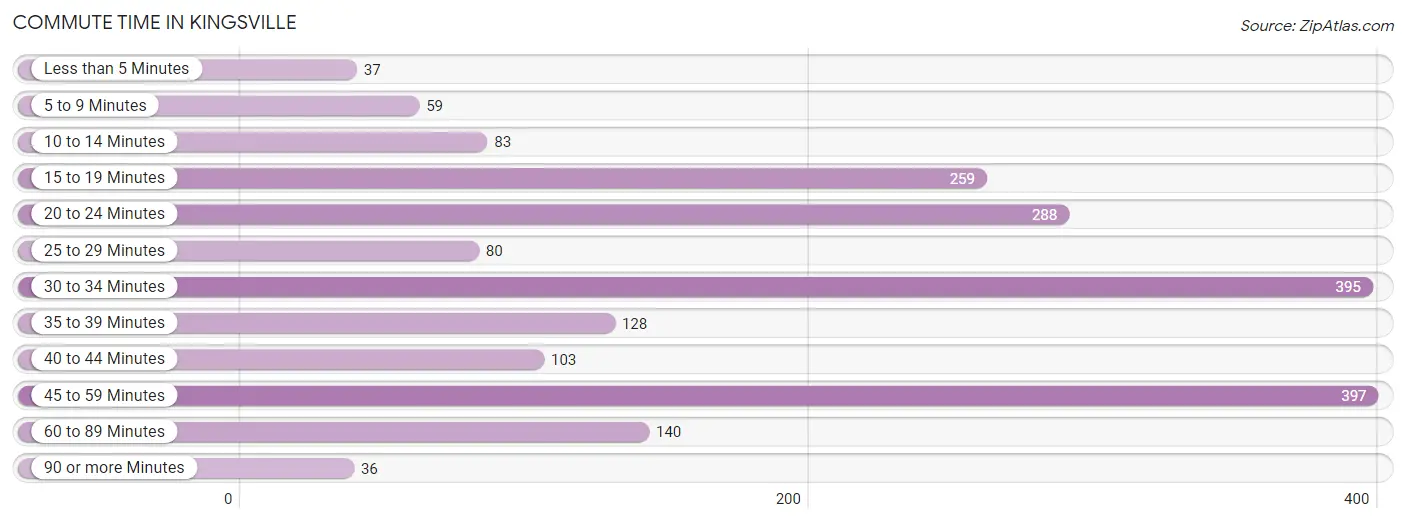
| Commute Time | # Commuters | % Commuters |
| Less than 5 Minutes | 37 | 1.8% |
| 5 to 9 Minutes | 59 | 2.9% |
| 10 to 14 Minutes | 83 | 4.1% |
| 15 to 19 Minutes | 259 | 12.9% |
| 20 to 24 Minutes | 288 | 14.4% |
| 25 to 29 Minutes | 80 | 4.0% |
| 30 to 34 Minutes | 395 | 19.7% |
| 35 to 39 Minutes | 128 | 6.4% |
| 40 to 44 Minutes | 103 | 5.1% |
| 45 to 59 Minutes | 397 | 19.8% |
| 60 to 89 Minutes | 140 | 7.0% |
| 90 or more Minutes | 36 | 1.8% |
Commute Time by Sex in Kingsville
The most common commute times in Kingsville are 30 to 34 minutes (267 commuters, 22.1%) for males and 45 to 59 minutes (141 commuters, 17.7%) for females.
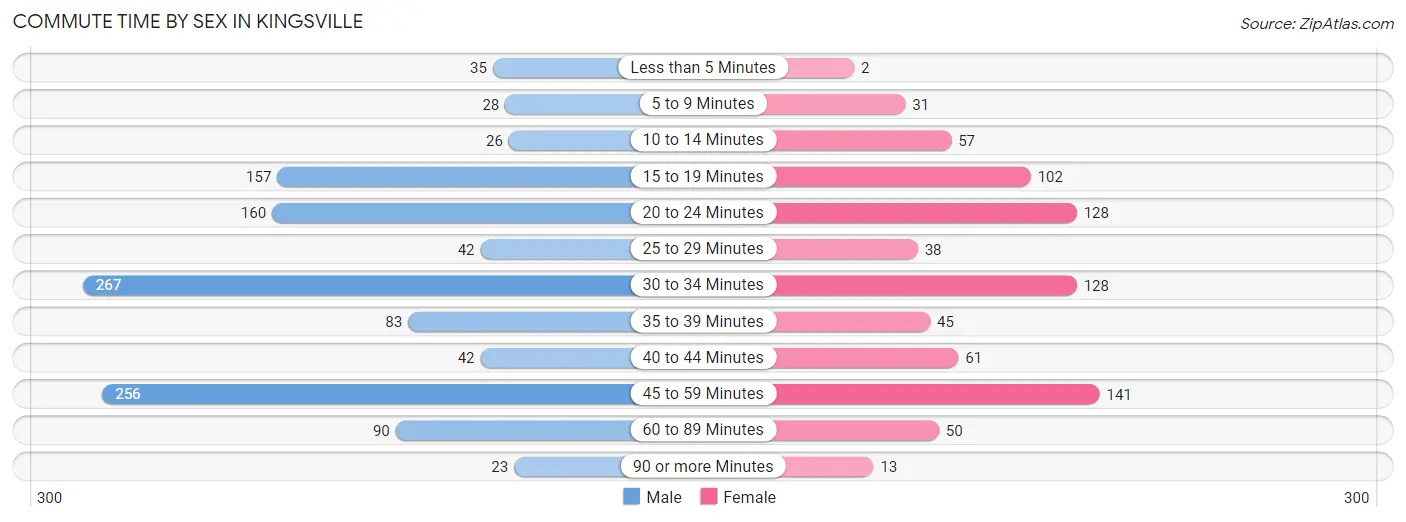
| Commute Time | Male | Female |
| Less than 5 Minutes | 35 (2.9%) | 2 (0.3%) |
| 5 to 9 Minutes | 28 (2.3%) | 31 (3.9%) |
| 10 to 14 Minutes | 26 (2.1%) | 57 (7.2%) |
| 15 to 19 Minutes | 157 (13.0%) | 102 (12.8%) |
| 20 to 24 Minutes | 160 (13.2%) | 128 (16.1%) |
| 25 to 29 Minutes | 42 (3.5%) | 38 (4.8%) |
| 30 to 34 Minutes | 267 (22.1%) | 128 (16.1%) |
| 35 to 39 Minutes | 83 (6.9%) | 45 (5.7%) |
| 40 to 44 Minutes | 42 (3.5%) | 61 (7.7%) |
| 45 to 59 Minutes | 256 (21.2%) | 141 (17.7%) |
| 60 to 89 Minutes | 90 (7.4%) | 50 (6.3%) |
| 90 or more Minutes | 23 (1.9%) | 13 (1.6%) |
Time of Departure to Work by Sex in Kingsville
The most frequent times of departure to work in Kingsville are 7:00 AM to 7:29 AM (187, 15.5%) for males and 8:00 AM to 8:29 AM (147, 18.5%) for females.
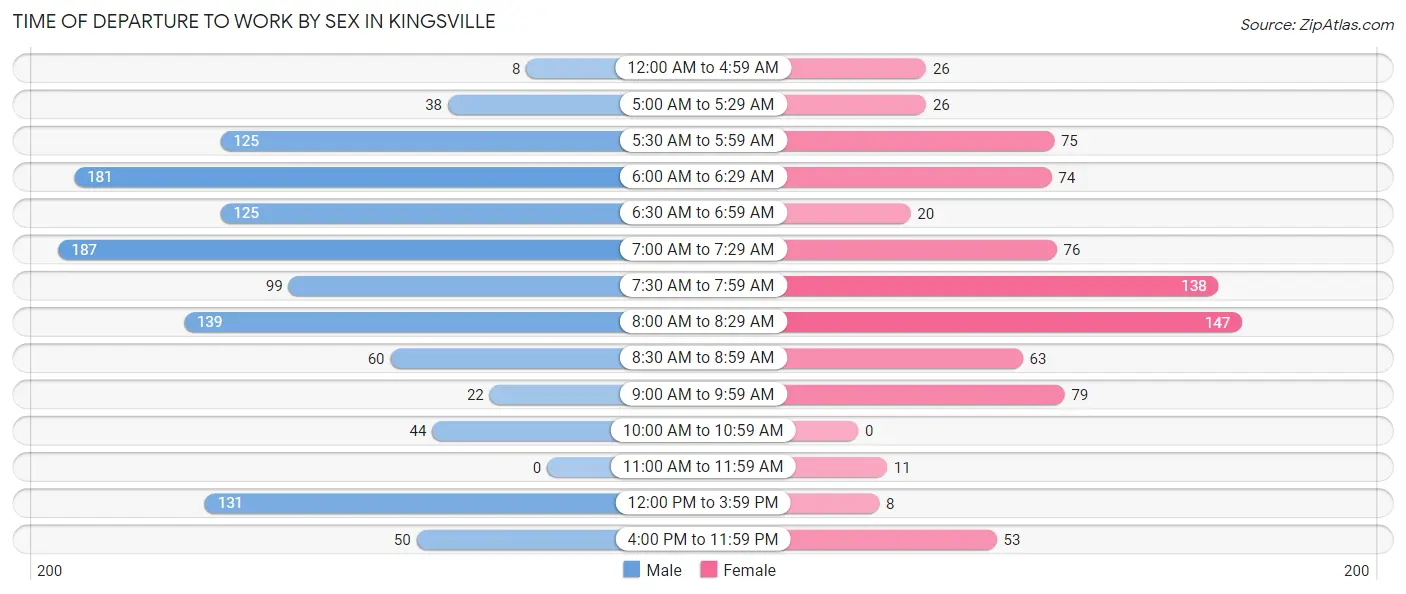
| Time of Departure | Male | Female |
| 12:00 AM to 4:59 AM | 8 (0.7%) | 26 (3.3%) |
| 5:00 AM to 5:29 AM | 38 (3.1%) | 26 (3.3%) |
| 5:30 AM to 5:59 AM | 125 (10.3%) | 75 (9.4%) |
| 6:00 AM to 6:29 AM | 181 (15.0%) | 74 (9.3%) |
| 6:30 AM to 6:59 AM | 125 (10.3%) | 20 (2.5%) |
| 7:00 AM to 7:29 AM | 187 (15.5%) | 76 (9.6%) |
| 7:30 AM to 7:59 AM | 99 (8.2%) | 138 (17.3%) |
| 8:00 AM to 8:29 AM | 139 (11.5%) | 147 (18.5%) |
| 8:30 AM to 8:59 AM | 60 (5.0%) | 63 (7.9%) |
| 9:00 AM to 9:59 AM | 22 (1.8%) | 79 (9.9%) |
| 10:00 AM to 10:59 AM | 44 (3.6%) | 0 (0.0%) |
| 11:00 AM to 11:59 AM | 0 (0.0%) | 11 (1.4%) |
| 12:00 PM to 3:59 PM | 131 (10.8%) | 8 (1.0%) |
| 4:00 PM to 11:59 PM | 50 (4.1%) | 53 (6.7%) |
| Total | 1,209 (100.0%) | 796 (100.0%) |
Housing Occupancy in Kingsville
Occupancy by Ownership in Kingsville
Of the total 1,711 dwellings in Kingsville, owner-occupied units account for 1,550 (90.6%), while renter-occupied units make up 161 (9.4%).
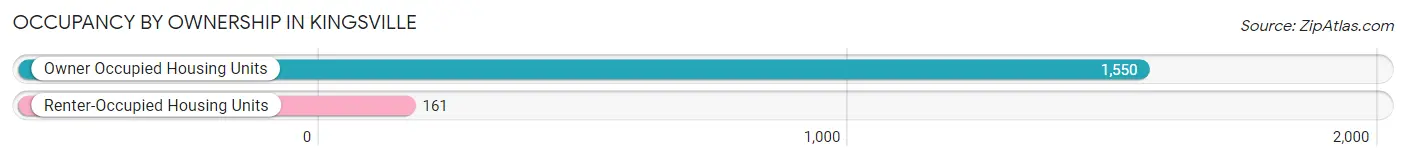
| Occupancy | # Housing Units | % Housing Units |
| Owner Occupied Housing Units | 1,550 | 90.6% |
| Renter-Occupied Housing Units | 161 | 9.4% |
| Total Occupied Housing Units | 1,711 | 100.0% |
Occupancy by Household Size in Kingsville
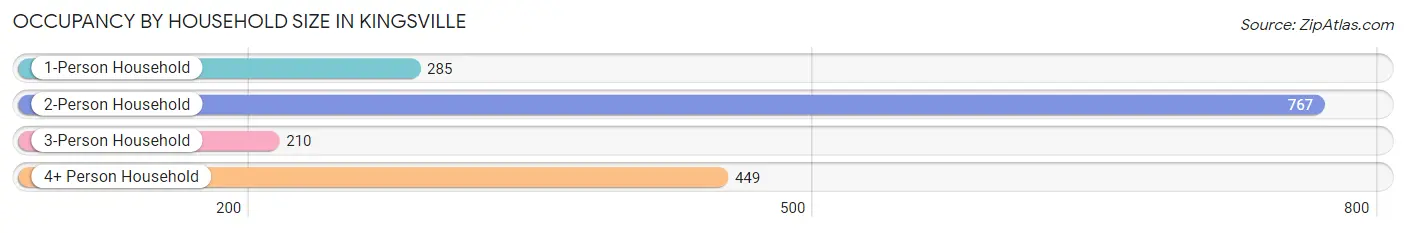
| Household Size | # Housing Units | % Housing Units |
| 1-Person Household | 285 | 16.7% |
| 2-Person Household | 767 | 44.8% |
| 3-Person Household | 210 | 12.3% |
| 4+ Person Household | 449 | 26.2% |
| Total Housing Units | 1,711 | 100.0% |
Occupancy by Ownership by Household Size in Kingsville
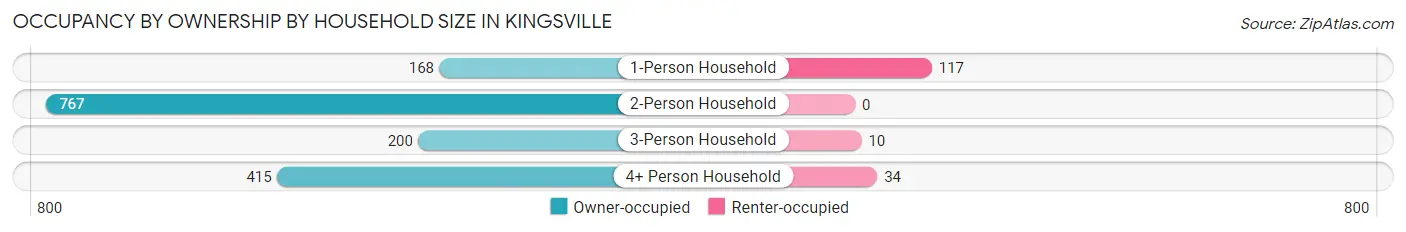
| Household Size | Owner-occupied | Renter-occupied |
| 1-Person Household | 168 (59.0%) | 117 (41.0%) |
| 2-Person Household | 767 (100.0%) | 0 (0.0%) |
| 3-Person Household | 200 (95.2%) | 10 (4.8%) |
| 4+ Person Household | 415 (92.4%) | 34 (7.6%) |
| Total Housing Units | 1,550 (90.6%) | 161 (9.4%) |
Occupancy by Educational Attainment in Kingsville
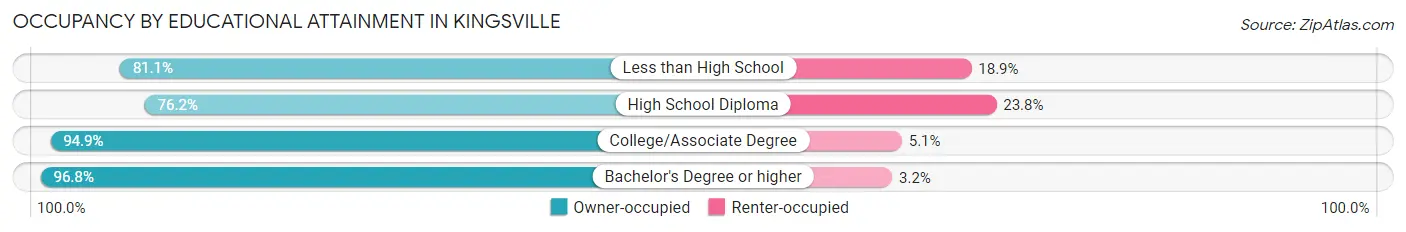
| Household Size | Owner-occupied | Renter-occupied |
| Less than High School | 43 (81.1%) | 10 (18.9%) |
| High School Diploma | 336 (76.2%) | 105 (23.8%) |
| College/Associate Degree | 374 (94.9%) | 20 (5.1%) |
| Bachelor's Degree or higher | 797 (96.8%) | 26 (3.2%) |
Occupancy by Age of Householder in Kingsville
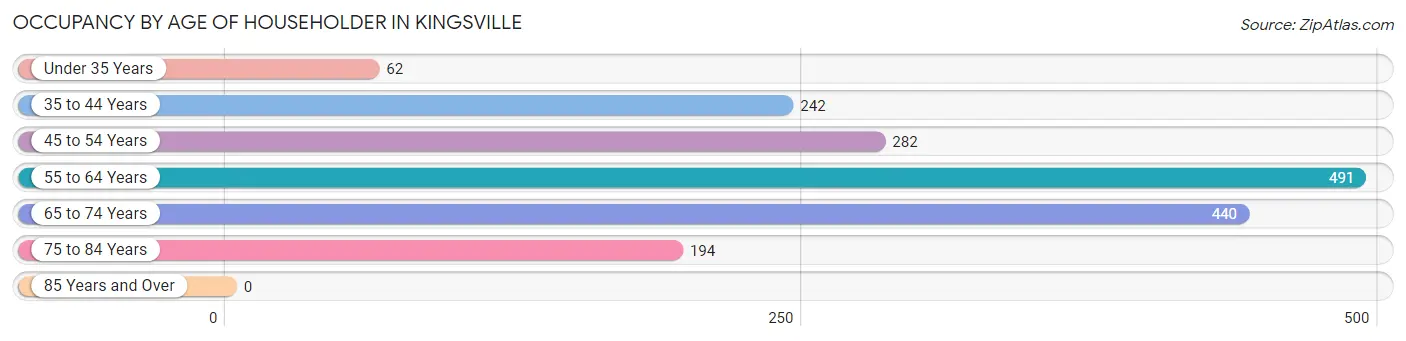
| Age Bracket | # Households | % Households |
| Under 35 Years | 62 | 3.6% |
| 35 to 44 Years | 242 | 14.1% |
| 45 to 54 Years | 282 | 16.5% |
| 55 to 64 Years | 491 | 28.7% |
| 65 to 74 Years | 440 | 25.7% |
| 75 to 84 Years | 194 | 11.3% |
| 85 Years and Over | 0 | 0.0% |
| Total | 1,711 | 100.0% |
Housing Finances in Kingsville
Median Income by Occupancy in Kingsville
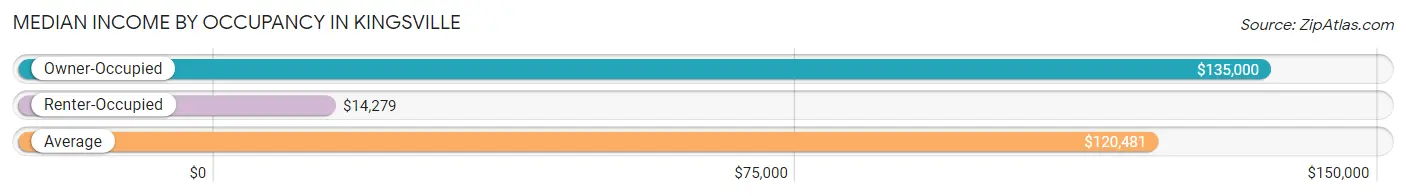
| Occupancy Type | # Households | Median Income |
| Owner-Occupied | 1,550 (90.6%) | $135,000 |
| Renter-Occupied | 161 (9.4%) | $14,279 |
| Average | 1,711 (100.0%) | $120,481 |
Occupancy by Householder Income Bracket in Kingsville
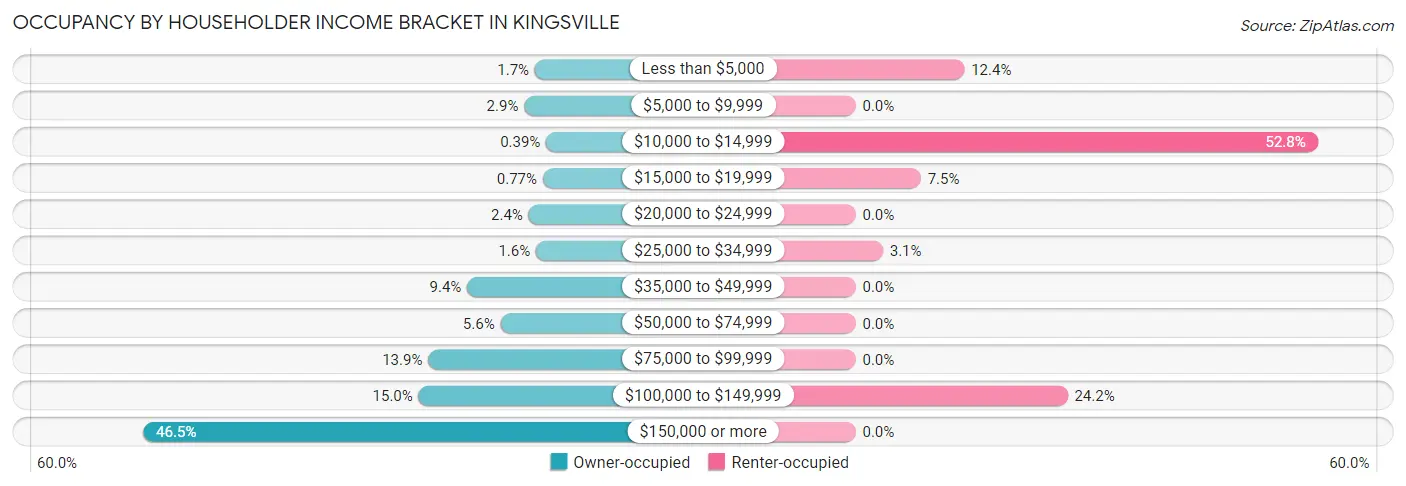
| Income Bracket | Owner-occupied | Renter-occupied |
| Less than $5,000 | 26 (1.7%) | 20 (12.4%) |
| $5,000 to $9,999 | 45 (2.9%) | 0 (0.0%) |
| $10,000 to $14,999 | 6 (0.4%) | 85 (52.8%) |
| $15,000 to $19,999 | 12 (0.8%) | 12 (7.4%) |
| $20,000 to $24,999 | 37 (2.4%) | 0 (0.0%) |
| $25,000 to $34,999 | 24 (1.5%) | 5 (3.1%) |
| $35,000 to $49,999 | 146 (9.4%) | 0 (0.0%) |
| $50,000 to $74,999 | 87 (5.6%) | 0 (0.0%) |
| $75,000 to $99,999 | 215 (13.9%) | 0 (0.0%) |
| $100,000 to $149,999 | 232 (15.0%) | 39 (24.2%) |
| $150,000 or more | 720 (46.5%) | 0 (0.0%) |
| Total | 1,550 (100.0%) | 161 (100.0%) |
Monthly Housing Cost Tiers in Kingsville
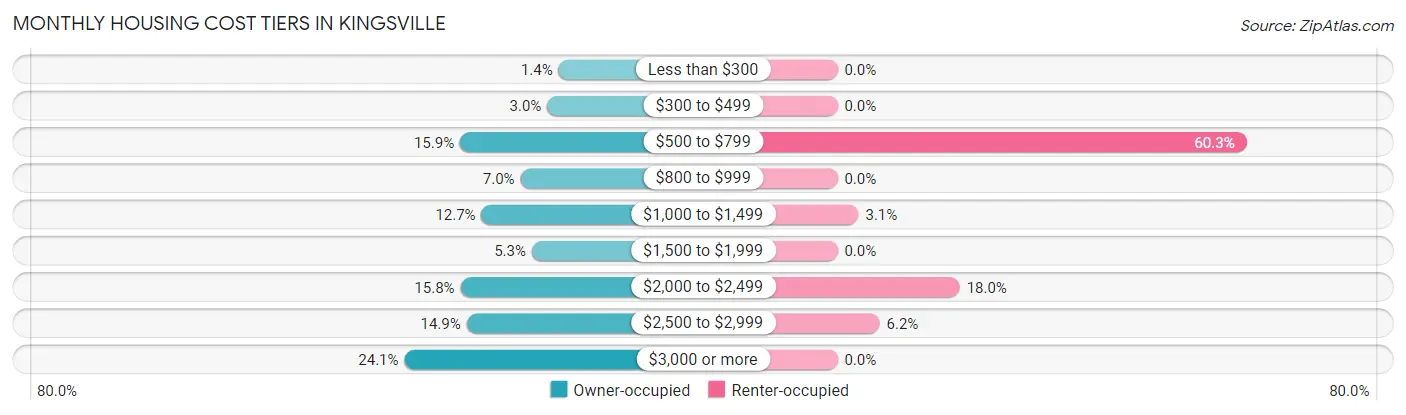
| Monthly Cost | Owner-occupied | Renter-occupied |
| Less than $300 | 21 (1.3%) | 0 (0.0%) |
| $300 to $499 | 47 (3.0%) | 0 (0.0%) |
| $500 to $799 | 246 (15.9%) | 97 (60.3%) |
| $800 to $999 | 108 (7.0%) | 0 (0.0%) |
| $1,000 to $1,499 | 197 (12.7%) | 5 (3.1%) |
| $1,500 to $1,999 | 82 (5.3%) | 0 (0.0%) |
| $2,000 to $2,499 | 245 (15.8%) | 29 (18.0%) |
| $2,500 to $2,999 | 231 (14.9%) | 10 (6.2%) |
| $3,000 or more | 373 (24.1%) | 0 (0.0%) |
| Total | 1,550 (100.0%) | 161 (100.0%) |
Physical Housing Characteristics in Kingsville
Housing Structures in Kingsville
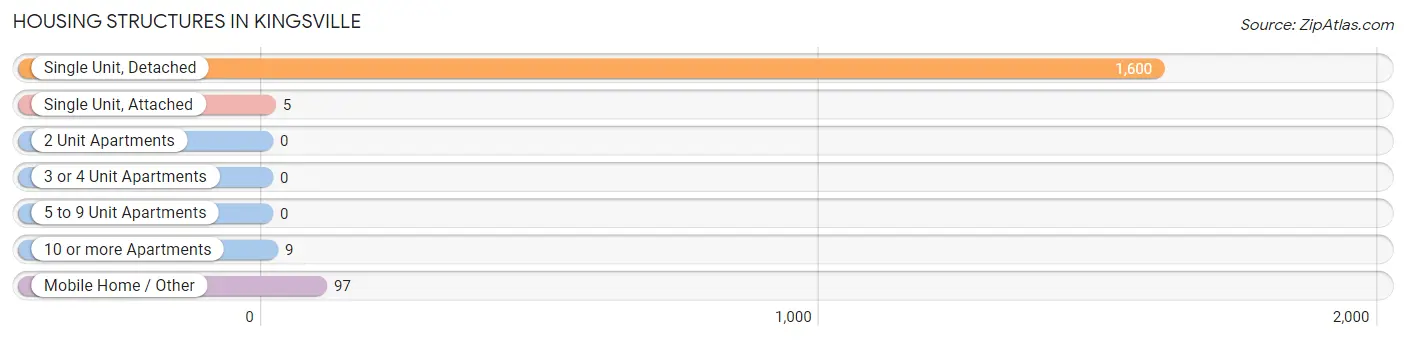
| Structure Type | # Housing Units | % Housing Units |
| Single Unit, Detached | 1,600 | 93.5% |
| Single Unit, Attached | 5 | 0.3% |
| 2 Unit Apartments | 0 | 0.0% |
| 3 or 4 Unit Apartments | 0 | 0.0% |
| 5 to 9 Unit Apartments | 0 | 0.0% |
| 10 or more Apartments | 9 | 0.5% |
| Mobile Home / Other | 97 | 5.7% |
| Total | 1,711 | 100.0% |
Housing Structures by Occupancy in Kingsville
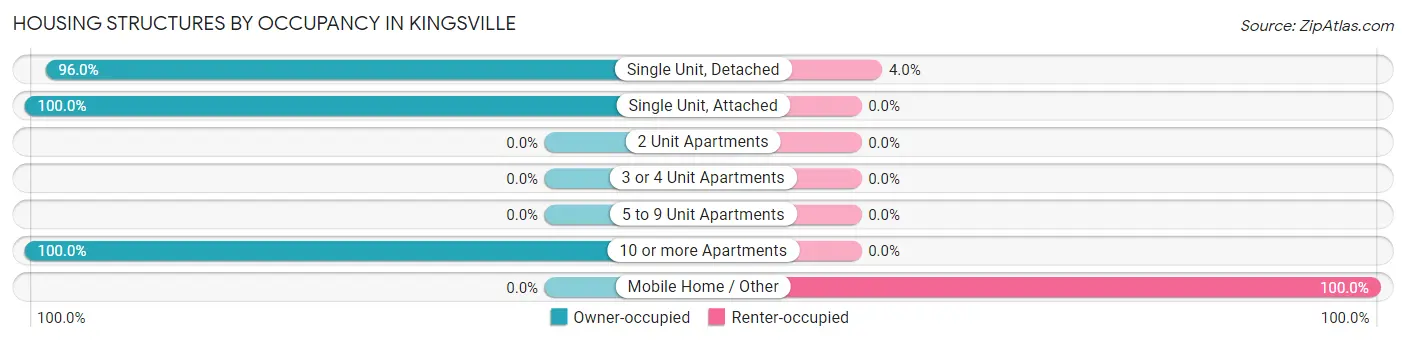
| Structure Type | Owner-occupied | Renter-occupied |
| Single Unit, Detached | 1,536 (96.0%) | 64 (4.0%) |
| Single Unit, Attached | 5 (100.0%) | 0 (0.0%) |
| 2 Unit Apartments | 0 (0.0%) | 0 (0.0%) |
| 3 or 4 Unit Apartments | 0 (0.0%) | 0 (0.0%) |
| 5 to 9 Unit Apartments | 0 (0.0%) | 0 (0.0%) |
| 10 or more Apartments | 9 (100.0%) | 0 (0.0%) |
| Mobile Home / Other | 0 (0.0%) | 97 (100.0%) |
| Total | 1,550 (90.6%) | 161 (9.4%) |
Housing Structures by Number of Rooms in Kingsville
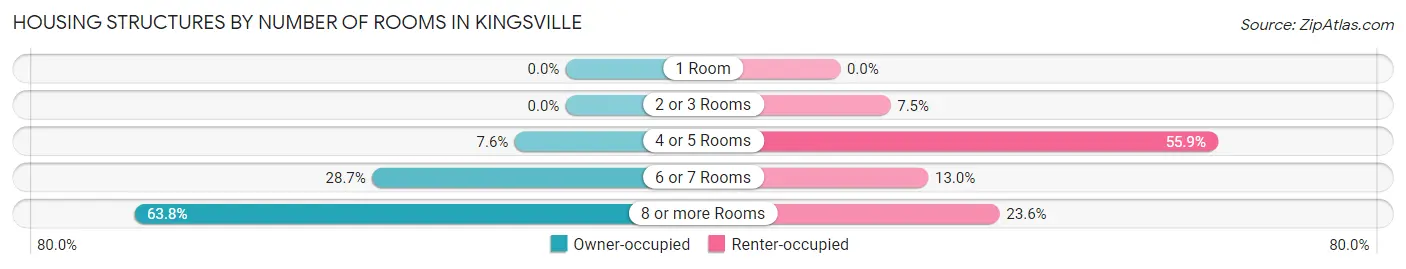
| Number of Rooms | Owner-occupied | Renter-occupied |
| 1 Room | 0 (0.0%) | 0 (0.0%) |
| 2 or 3 Rooms | 0 (0.0%) | 12 (7.4%) |
| 4 or 5 Rooms | 117 (7.5%) | 90 (55.9%) |
| 6 or 7 Rooms | 444 (28.6%) | 21 (13.0%) |
| 8 or more Rooms | 989 (63.8%) | 38 (23.6%) |
| Total | 1,550 (100.0%) | 161 (100.0%) |
Housing Structure by Heating Type in Kingsville
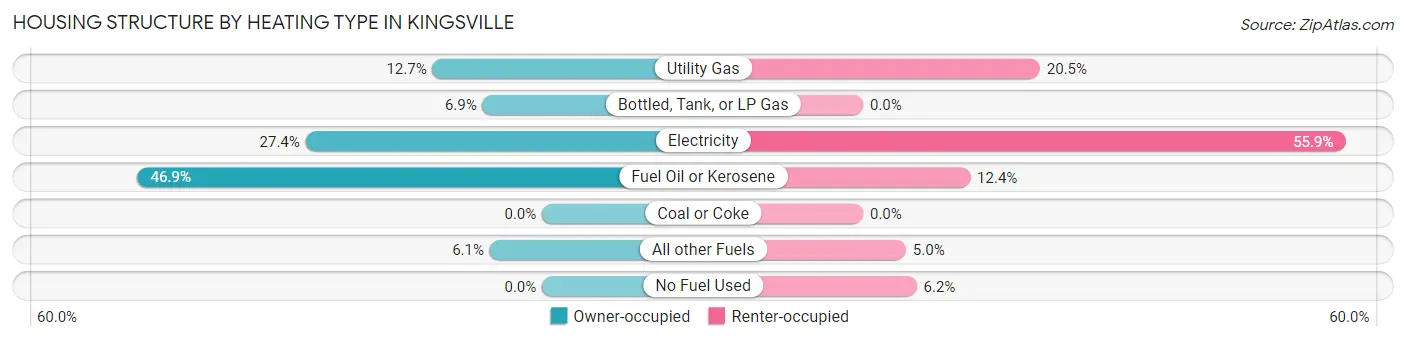
| Heating Type | Owner-occupied | Renter-occupied |
| Utility Gas | 197 (12.7%) | 33 (20.5%) |
| Bottled, Tank, or LP Gas | 107 (6.9%) | 0 (0.0%) |
| Electricity | 425 (27.4%) | 90 (55.9%) |
| Fuel Oil or Kerosene | 727 (46.9%) | 20 (12.4%) |
| Coal or Coke | 0 (0.0%) | 0 (0.0%) |
| All other Fuels | 94 (6.1%) | 8 (5.0%) |
| No Fuel Used | 0 (0.0%) | 10 (6.2%) |
| Total | 1,550 (100.0%) | 161 (100.0%) |
Household Vehicle Usage in Kingsville
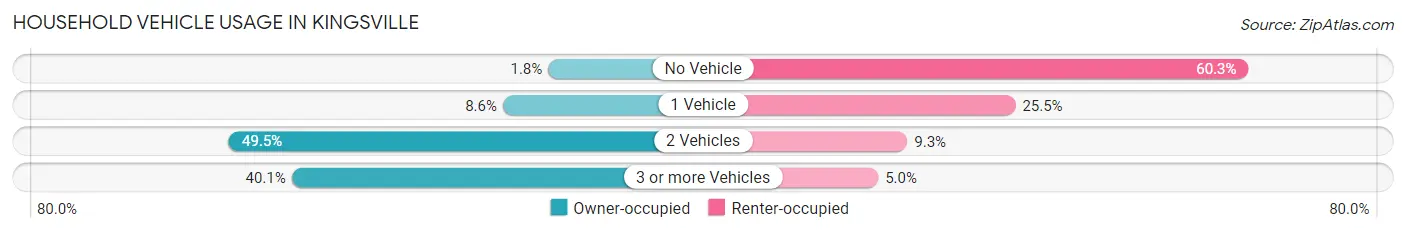
| Vehicles per Household | Owner-occupied | Renter-occupied |
| No Vehicle | 28 (1.8%) | 97 (60.3%) |
| 1 Vehicle | 133 (8.6%) | 41 (25.5%) |
| 2 Vehicles | 767 (49.5%) | 15 (9.3%) |
| 3 or more Vehicles | 622 (40.1%) | 8 (5.0%) |
| Total | 1,550 (100.0%) | 161 (100.0%) |
Real Estate & Mortgages in Kingsville
Real Estate and Mortgage Overview in Kingsville
| Characteristic | Without Mortgage | With Mortgage |
| Housing Units | 534 | 1,016 |
| Median Property Value | $459,400 | $541,500 |
| Median Household Income | $102,386 | $536 |
| Monthly Housing Costs | $745 | $373 |
| Real Estate Taxes | $4,120 | $0 |
Property Value by Mortgage Status in Kingsville
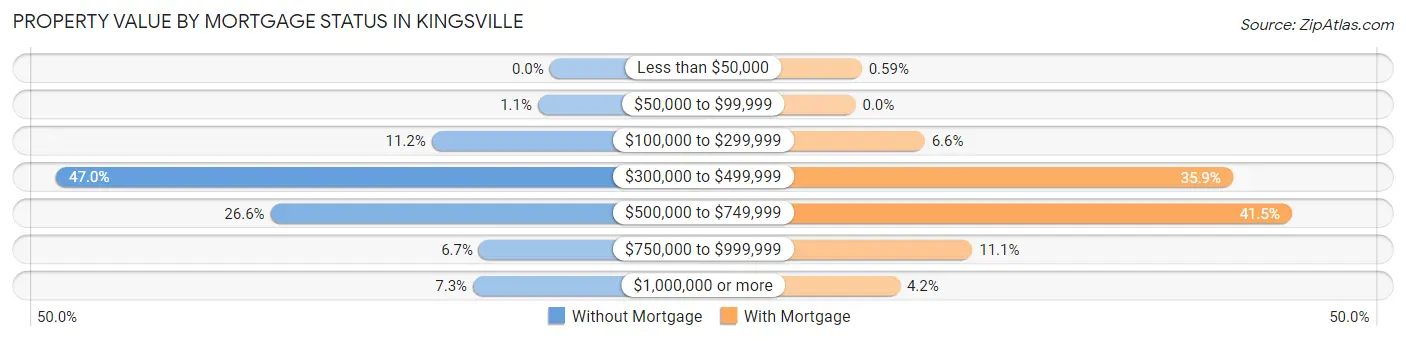
| Property Value | Without Mortgage | With Mortgage |
| Less than $50,000 | 0 (0.0%) | 6 (0.6%) |
| $50,000 to $99,999 | 6 (1.1%) | 0 (0.0%) |
| $100,000 to $299,999 | 60 (11.2%) | 67 (6.6%) |
| $300,000 to $499,999 | 251 (47.0%) | 365 (35.9%) |
| $500,000 to $749,999 | 142 (26.6%) | 422 (41.5%) |
| $750,000 to $999,999 | 36 (6.7%) | 113 (11.1%) |
| $1,000,000 or more | 39 (7.3%) | 43 (4.2%) |
| Total | 534 (100.0%) | 1,016 (100.0%) |
Household Income by Mortgage Status in Kingsville
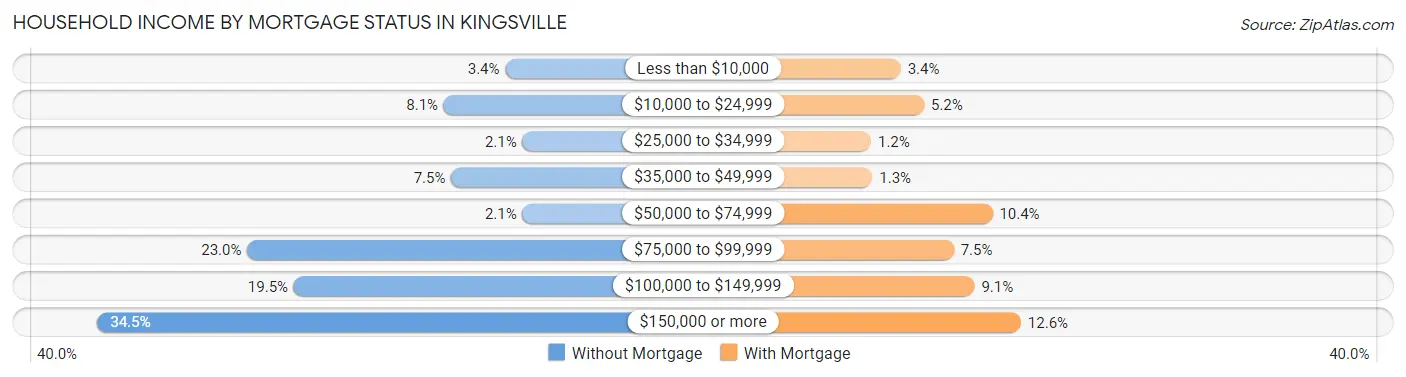
| Household Income | Without Mortgage | With Mortgage |
| Less than $10,000 | 18 (3.4%) | 35 (3.4%) |
| $10,000 to $24,999 | 43 (8.1%) | 53 (5.2%) |
| $25,000 to $34,999 | 11 (2.1%) | 12 (1.2%) |
| $35,000 to $49,999 | 40 (7.5%) | 13 (1.3%) |
| $50,000 to $74,999 | 11 (2.1%) | 106 (10.4%) |
| $75,000 to $99,999 | 123 (23.0%) | 76 (7.5%) |
| $100,000 to $149,999 | 104 (19.5%) | 92 (9.1%) |
| $150,000 or more | 184 (34.5%) | 128 (12.6%) |
| Total | 534 (100.0%) | 1,016 (100.0%) |
Property Value to Household Income Ratio in Kingsville
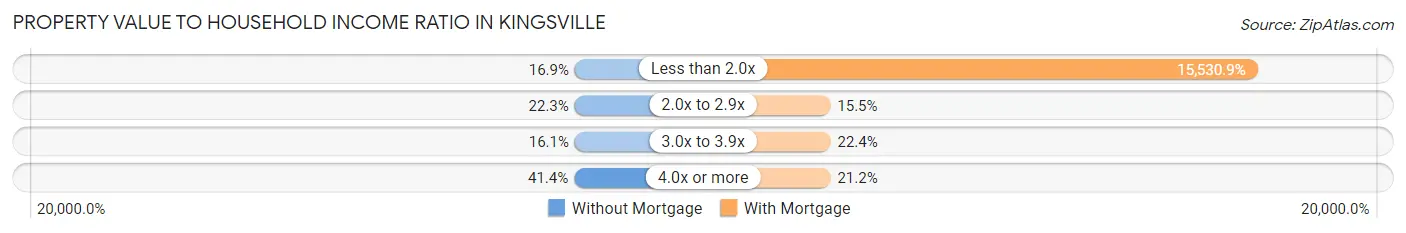
| Value-to-Income Ratio | Without Mortgage | With Mortgage |
| Less than 2.0x | 90 (16.9%) | 157,794 (15,530.9%) |
| 2.0x to 2.9x | 119 (22.3%) | 157 (15.4%) |
| 3.0x to 3.9x | 86 (16.1%) | 228 (22.4%) |
| 4.0x or more | 221 (41.4%) | 215 (21.2%) |
| Total | 534 (100.0%) | 1,016 (100.0%) |
Real Estate Taxes by Mortgage Status in Kingsville
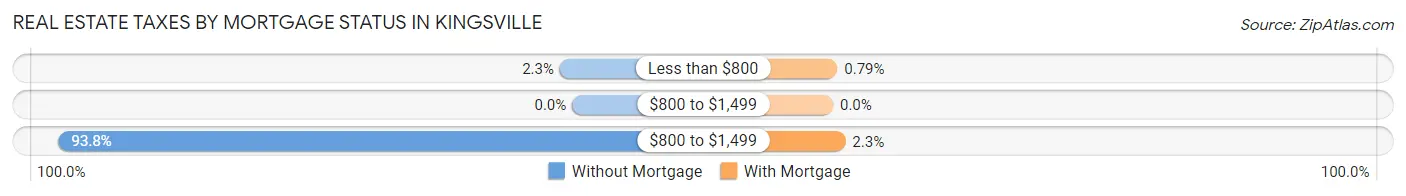
| Property Taxes | Without Mortgage | With Mortgage |
| Less than $800 | 12 (2.2%) | 8 (0.8%) |
| $800 to $1,499 | 0 (0.0%) | 0 (0.0%) |
| $800 to $1,499 | 501 (93.8%) | 23 (2.3%) |
| Total | 534 (100.0%) | 1,016 (100.0%) |
Health & Disability in Kingsville
Health Insurance Coverage by Age in Kingsville
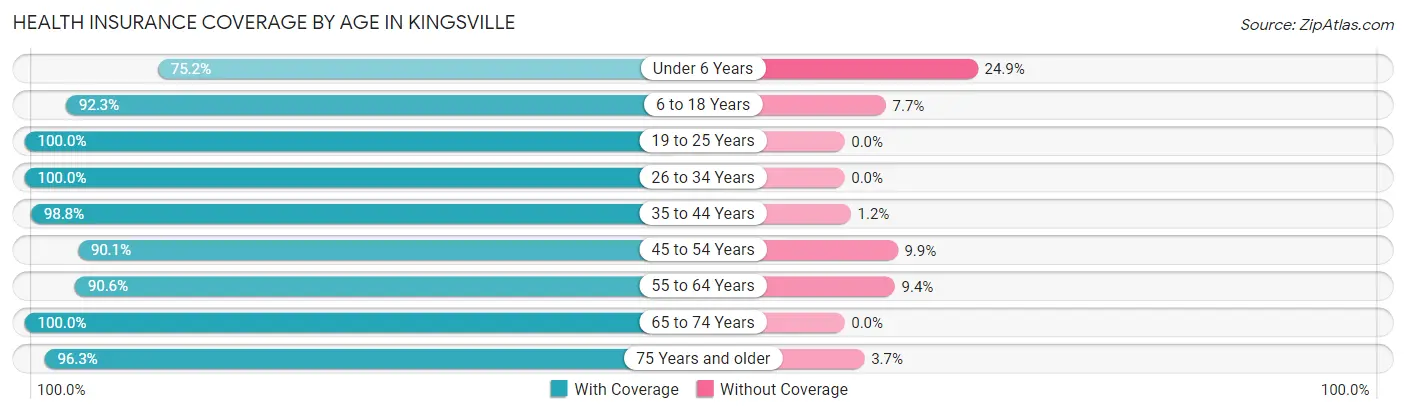
| Age Bracket | With Coverage | Without Coverage |
| Under 6 Years | 257 (75.1%) | 85 (24.8%) |
| 6 to 18 Years | 563 (92.3%) | 47 (7.7%) |
| 19 to 25 Years | 225 (100.0%) | 0 (0.0%) |
| 26 to 34 Years | 223 (100.0%) | 0 (0.0%) |
| 35 to 44 Years | 586 (98.8%) | 7 (1.2%) |
| 45 to 54 Years | 445 (90.1%) | 49 (9.9%) |
| 55 to 64 Years | 821 (90.6%) | 85 (9.4%) |
| 65 to 74 Years | 818 (100.0%) | 0 (0.0%) |
| 75 Years and older | 415 (96.3%) | 16 (3.7%) |
| Total | 4,353 (93.8%) | 289 (6.2%) |
Health Insurance Coverage by Citizenship Status in Kingsville
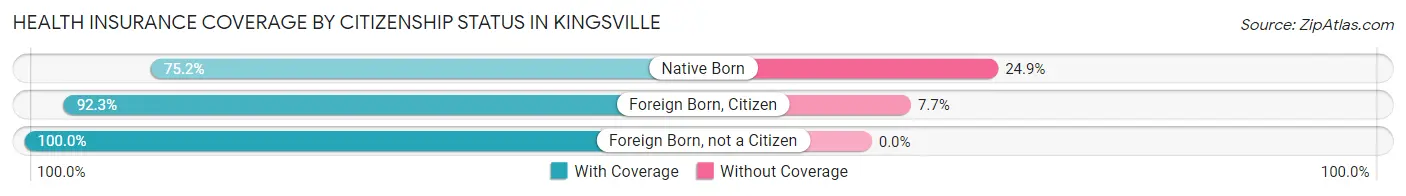
| Citizenship Status | With Coverage | Without Coverage |
| Native Born | 257 (75.1%) | 85 (24.8%) |
| Foreign Born, Citizen | 563 (92.3%) | 47 (7.7%) |
| Foreign Born, not a Citizen | 225 (100.0%) | 0 (0.0%) |
Health Insurance Coverage by Household Income in Kingsville
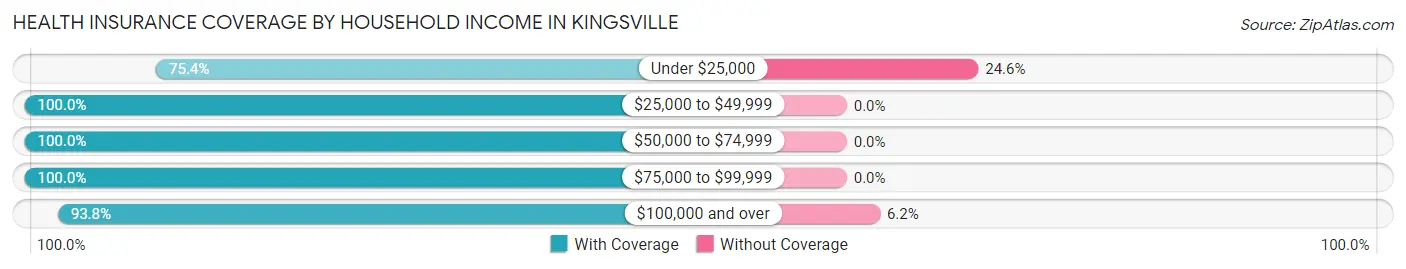
| Household Income | With Coverage | Without Coverage |
| Under $25,000 | 260 (75.4%) | 85 (24.6%) |
| $25,000 to $49,999 | 354 (100.0%) | 0 (0.0%) |
| $50,000 to $74,999 | 198 (100.0%) | 0 (0.0%) |
| $75,000 to $99,999 | 466 (100.0%) | 0 (0.0%) |
| $100,000 and over | 3,075 (93.8%) | 204 (6.2%) |
Public vs Private Health Insurance Coverage by Age in Kingsville
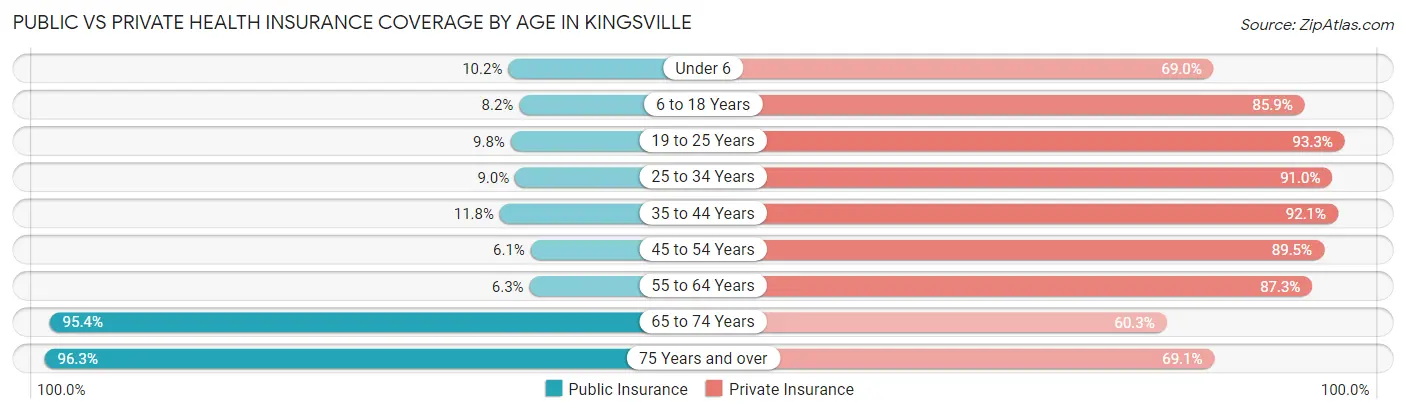
| Age Bracket | Public Insurance | Private Insurance |
| Under 6 | 35 (10.2%) | 236 (69.0%) |
| 6 to 18 Years | 50 (8.2%) | 524 (85.9%) |
| 19 to 25 Years | 22 (9.8%) | 210 (93.3%) |
| 25 to 34 Years | 20 (9.0%) | 203 (91.0%) |
| 35 to 44 Years | 70 (11.8%) | 546 (92.1%) |
| 45 to 54 Years | 30 (6.1%) | 442 (89.5%) |
| 55 to 64 Years | 57 (6.3%) | 791 (87.3%) |
| 65 to 74 Years | 780 (95.4%) | 493 (60.3%) |
| 75 Years and over | 415 (96.3%) | 298 (69.1%) |
| Total | 1,479 (31.9%) | 3,743 (80.6%) |
Disability Status by Sex by Age in Kingsville
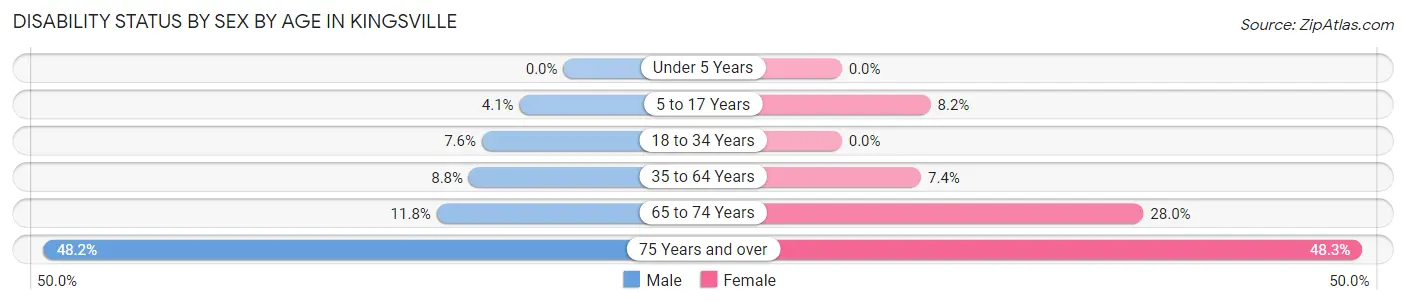
| Age Bracket | Male | Female |
| Under 5 Years | 0 (0.0%) | 0 (0.0%) |
| 5 to 17 Years | 12 (4.1%) | 28 (8.2%) |
| 18 to 34 Years | 14 (7.6%) | 0 (0.0%) |
| 35 to 64 Years | 95 (8.8%) | 67 (7.4%) |
| 65 to 74 Years | 50 (11.8%) | 110 (28.0%) |
| 75 Years and over | 95 (48.2%) | 113 (48.3%) |
Disability Class by Sex by Age in Kingsville
Disability Class: Hearing Difficulty
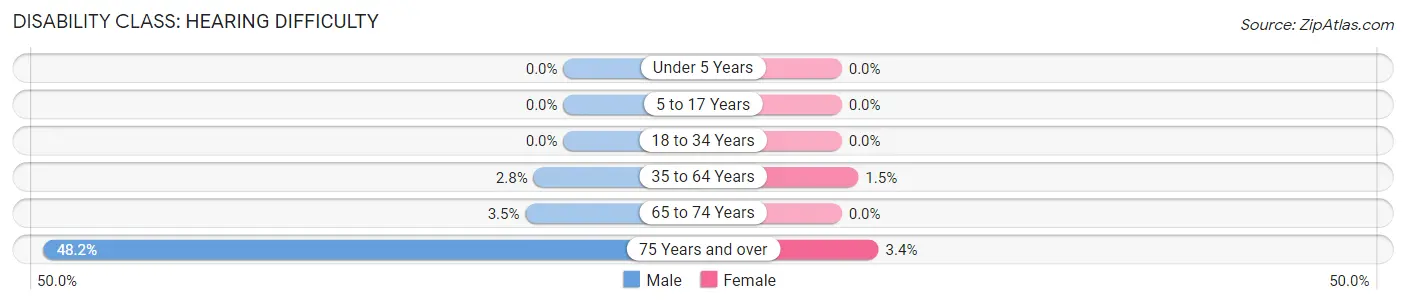
| Age Bracket | Male | Female |
| Under 5 Years | 0 (0.0%) | 0 (0.0%) |
| 5 to 17 Years | 0 (0.0%) | 0 (0.0%) |
| 18 to 34 Years | 0 (0.0%) | 0 (0.0%) |
| 35 to 64 Years | 30 (2.8%) | 14 (1.5%) |
| 65 to 74 Years | 15 (3.5%) | 0 (0.0%) |
| 75 Years and over | 95 (48.2%) | 8 (3.4%) |
Disability Class: Vision Difficulty
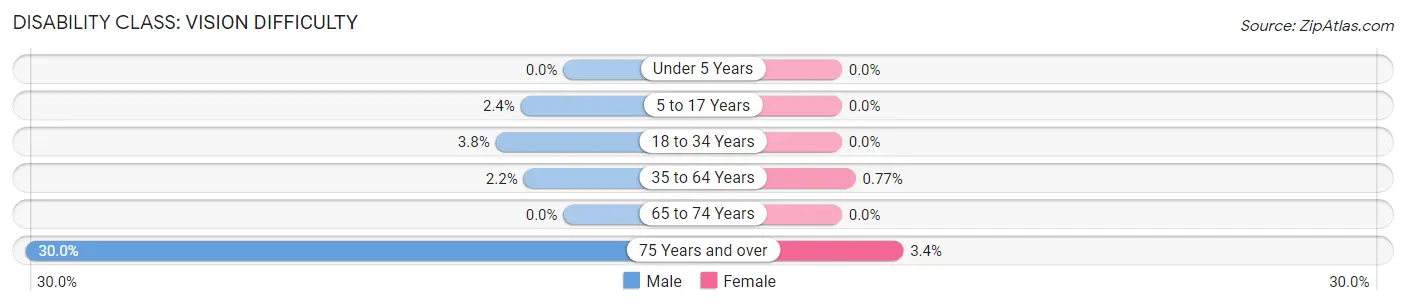
| Age Bracket | Male | Female |
| Under 5 Years | 0 (0.0%) | 0 (0.0%) |
| 5 to 17 Years | 7 (2.4%) | 0 (0.0%) |
| 18 to 34 Years | 7 (3.8%) | 0 (0.0%) |
| 35 to 64 Years | 24 (2.2%) | 7 (0.8%) |
| 65 to 74 Years | 0 (0.0%) | 0 (0.0%) |
| 75 Years and over | 59 (29.9%) | 8 (3.4%) |
Disability Class: Cognitive Difficulty
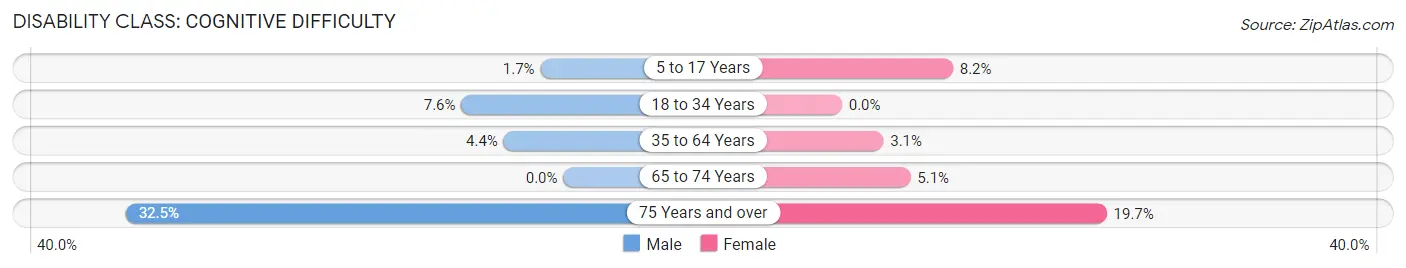
| Age Bracket | Male | Female |
| 5 to 17 Years | 5 (1.7%) | 28 (8.2%) |
| 18 to 34 Years | 14 (7.6%) | 0 (0.0%) |
| 35 to 64 Years | 48 (4.4%) | 28 (3.1%) |
| 65 to 74 Years | 0 (0.0%) | 20 (5.1%) |
| 75 Years and over | 64 (32.5%) | 46 (19.7%) |
Disability Class: Ambulatory Difficulty
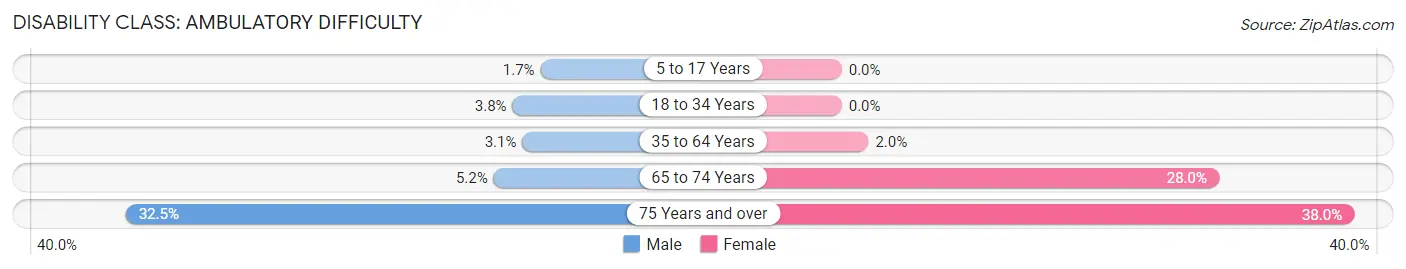
| Age Bracket | Male | Female |
| 5 to 17 Years | 5 (1.7%) | 0 (0.0%) |
| 18 to 34 Years | 7 (3.8%) | 0 (0.0%) |
| 35 to 64 Years | 33 (3.0%) | 18 (2.0%) |
| 65 to 74 Years | 22 (5.2%) | 110 (28.0%) |
| 75 Years and over | 64 (32.5%) | 89 (38.0%) |
Disability Class: Self-Care Difficulty
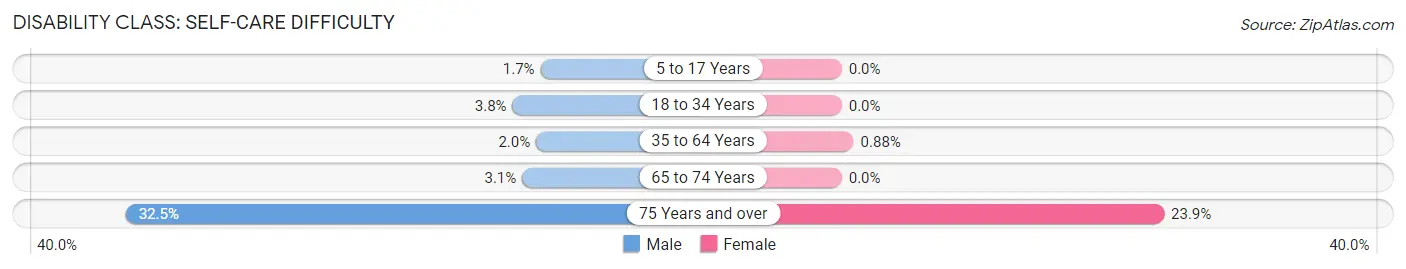
| Age Bracket | Male | Female |
| 5 to 17 Years | 5 (1.7%) | 0 (0.0%) |
| 18 to 34 Years | 7 (3.8%) | 0 (0.0%) |
| 35 to 64 Years | 22 (2.0%) | 8 (0.9%) |
| 65 to 74 Years | 13 (3.1%) | 0 (0.0%) |
| 75 Years and over | 64 (32.5%) | 56 (23.9%) |
Technology Access in Kingsville
Computing Device Access in Kingsville
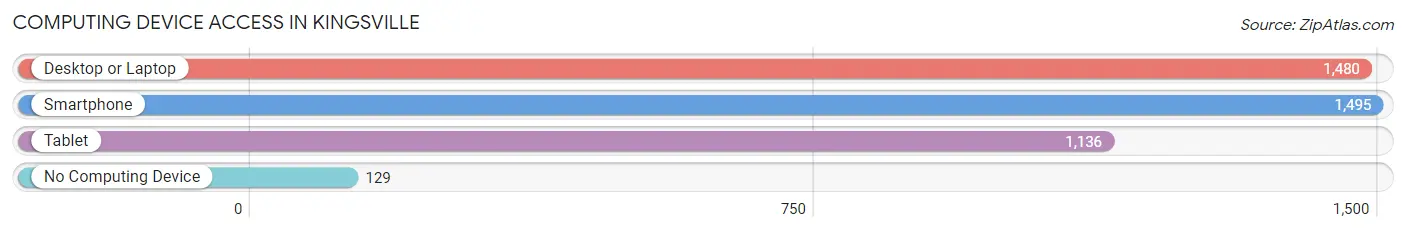
| Device Type | # Households | % Households |
| Desktop or Laptop | 1,480 | 86.5% |
| Smartphone | 1,495 | 87.4% |
| Tablet | 1,136 | 66.4% |
| No Computing Device | 129 | 7.5% |
| Total | 1,711 | 100.0% |
Internet Access in Kingsville
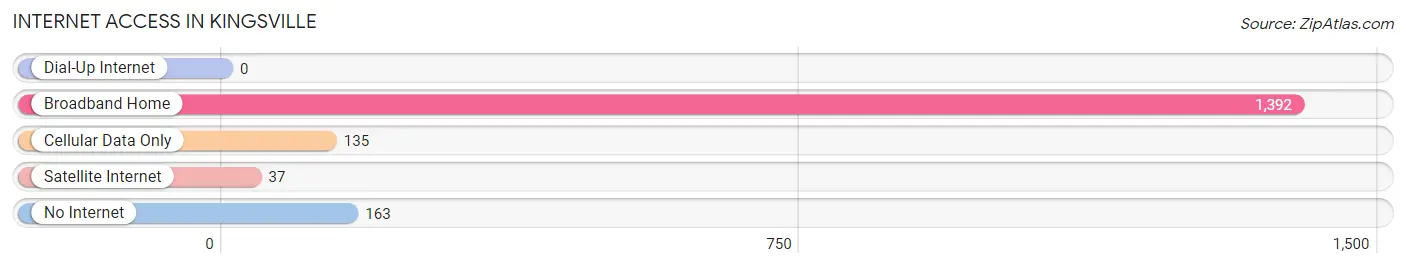
| Internet Type | # Households | % Households |
| Dial-Up Internet | 0 | 0.0% |
| Broadband Home | 1,392 | 81.4% |
| Cellular Data Only | 135 | 7.9% |
| Satellite Internet | 37 | 2.2% |
| No Internet | 163 | 9.5% |
| Total | 1,711 | 100.0% |
Kingsville Summary
History
The town of Kingsville, Maryland is located in Baltimore County, and is a small, unincorporated community. It is located in the northern part of the county, and is bordered by White Marsh to the north, Perry Hall to the east, and Parkville to the south. The town was founded in 1872 by William King, who purchased the land from the estate of John and Mary Smith. The town was originally known as King’s Crossroads, and was later changed to Kingsville.
The town was originally a farming community, and the main crops were corn, wheat, and tobacco. The town also had a few small businesses, including a general store, a blacksmith shop, and a post office. The town was also home to a few churches, including the Kingsville Methodist Episcopal Church, which was founded in 1873.
In the early 1900s, the town began to grow and develop. The population increased, and new businesses opened, including a bank, a movie theater, and a grocery store. The town also had a few schools, including Kingsville Elementary School, which opened in 1912.
In the 1950s, the town began to experience a decline in population and businesses. Many of the businesses closed, and the population decreased. In the 1970s, the town began to experience a resurgence, and new businesses opened, including a hardware store, a pharmacy, and a gas station.
Geography
Kingsville is located in northern Baltimore County, and is bordered by White Marsh to the north, Perry Hall to the east, and Parkville to the south. The town is situated on a plateau, and is surrounded by rolling hills and forests. The town is located near the Gunpowder River, and is about 20 miles from downtown Baltimore.
The town has a total area of 1.2 square miles, and is mostly residential. The town is home to several parks, including Kingsville Park, which has a playground, a basketball court, and a picnic area.
Economy
The economy of Kingsville is largely based on small businesses and services. The town is home to several small businesses, including restaurants, retail stores, and professional services. The town also has a few larger businesses, including a grocery store, a hardware store, and a pharmacy.
The town is also home to a few industrial businesses, including a manufacturing plant and a distribution center. The town is also home to a few government offices, including a post office and a library.
Demographics
As of the 2010 census, the population of Kingsville was 8,945. The population is mostly white (83.3%), with a small percentage of African Americans (7.3%), Asians (3.2%), and Hispanics (2.7%). The median household income is $68,945, and the median home value is $269,000.
The town is served by the Baltimore County Public Schools system, and is home to Kingsville Elementary School, Kingsville Middle School, and Kingsville High School. The town is also home to a few private schools, including St. John’s Catholic School and Kingsville Christian Academy.
Common Questions
What is Per Capita Income in Kingsville?
Per Capita income in Kingsville is $56,735.
What is the Median Family Income in Kingsville?
Median Family Income in Kingsville is $136,546.
What is the Median Household income in Kingsville?
Median Household Income in Kingsville is $120,481.
What is Income or Wage Gap in Kingsville?
Income or Wage Gap in Kingsville is 28.2%.
Women in Kingsville earn 71.8 cents for every dollar earned by a man.
What is Inequality or Gini Index in Kingsville?
Inequality or Gini Index in Kingsville is 0.44.
What is the Total Population of Kingsville?
Total Population of Kingsville is 4,652.
What is the Total Male Population of Kingsville?
Total Male Population of Kingsville is 2,321.
What is the Total Female Population of Kingsville?
Total Female Population of Kingsville is 2,331.
What is the Ratio of Males per 100 Females in Kingsville?
There are 99.57 Males per 100 Females in Kingsville.
What is the Ratio of Females per 100 Males in Kingsville?
There are 100.43 Females per 100 Males in Kingsville.
What is the Median Population Age in Kingsville?
Median Population Age in Kingsville is 51.0 Years.
What is the Average Family Size in Kingsville
Average Family Size in Kingsville is 3.0 People.
What is the Average Household Size in Kingsville
Average Household Size in Kingsville is 2.7 People.
How Large is the Labor Force in Kingsville?
There are 2,328 People in the Labor Forcein in Kingsville.
What is the Percentage of People in the Labor Force in Kingsville?
60.1% of People are in the Labor Force in Kingsville.
What is the Unemployment Rate in Kingsville?
Unemployment Rate in Kingsville is 0.6%.