Frostburg, MD Map & Demographics
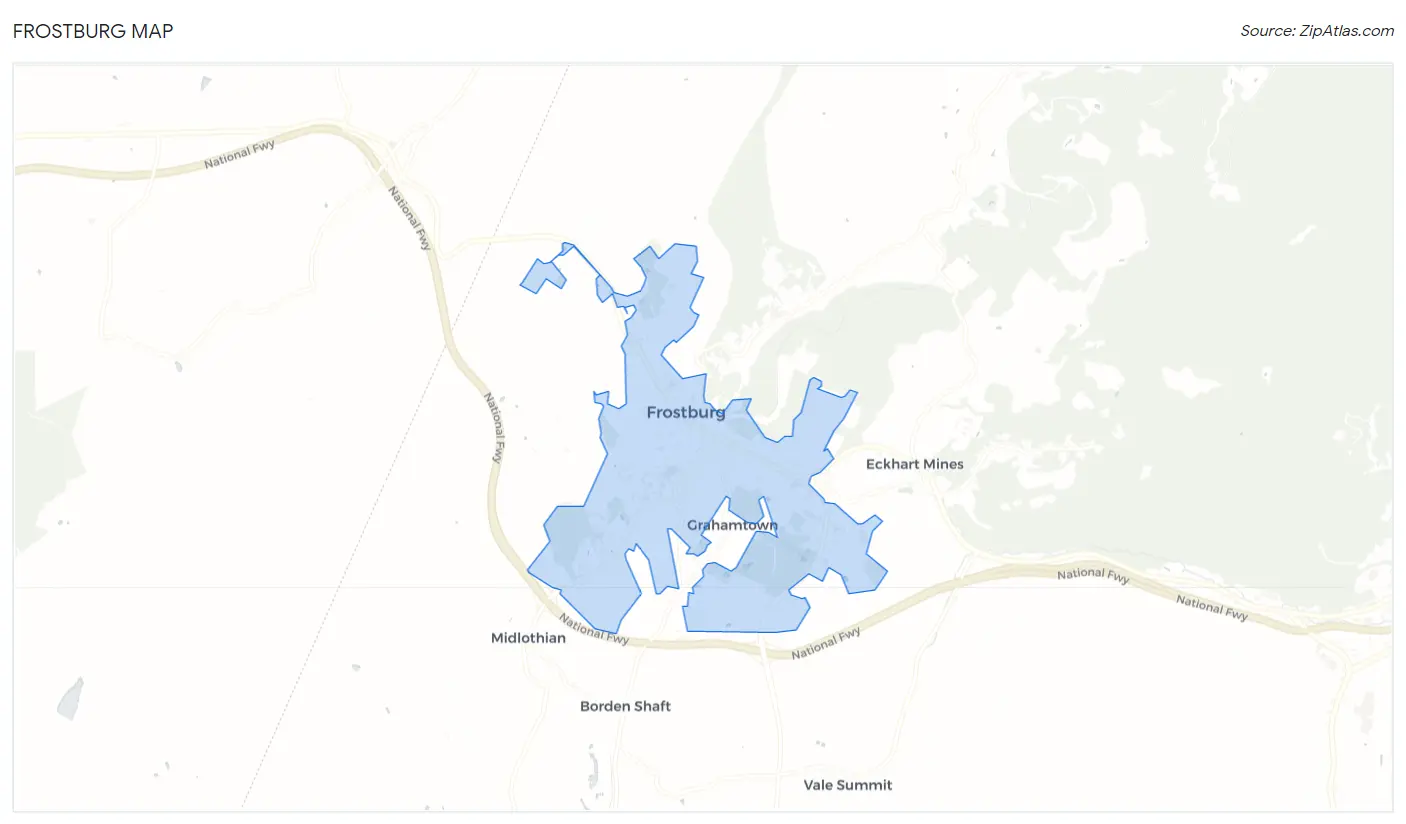
Frostburg Map
Frostburg Overview
$24,402
PER CAPITA INCOME
$71,382
AVG FAMILY INCOME
$44,658
AVG HOUSEHOLD INCOME
21.8%
WAGE / INCOME GAP [ % ]
78.2¢/ $1
WAGE / INCOME GAP [ $ ]
0.50
INEQUALITY / GINI INDEX
7,118
TOTAL POPULATION
3,190
MALE POPULATION
3,928
FEMALE POPULATION
81.21
MALES / 100 FEMALES
123.13
FEMALES / 100 MALES
24.2
MEDIAN AGE
2.7
AVG FAMILY SIZE
2.1
AVG HOUSEHOLD SIZE
3,042
LABOR FORCE [ PEOPLE ]
48.2%
PERCENT IN LABOR FORCE
7.3%
UNEMPLOYMENT RATE
Frostburg Zip Codes
Income in Frostburg
Income Overview in Frostburg
Per Capita Income in Frostburg is $24,402, while median incomes of families and households are $71,382 and $44,658 respectively.
| Characteristic | Number | Measure |
| Per Capita Income | 7,118 | $24,402 |
| Median Family Income | 1,075 | $71,382 |
| Mean Family Income | 1,075 | $89,896 |
| Median Household Income | 2,538 | $44,658 |
| Mean Household Income | 2,538 | $63,776 |
| Income Deficit | 1,075 | $0 |
| Wage / Income Gap (%) | 7,118 | 21.76% |
| Wage / Income Gap ($) | 7,118 | 78.24¢ per $1 |
| Gini / Inequality Index | 7,118 | 0.50 |
Earnings by Sex in Frostburg
Average Earnings in Frostburg are $16,938, $19,625 for men and $15,354 for women, a difference of 21.8%.
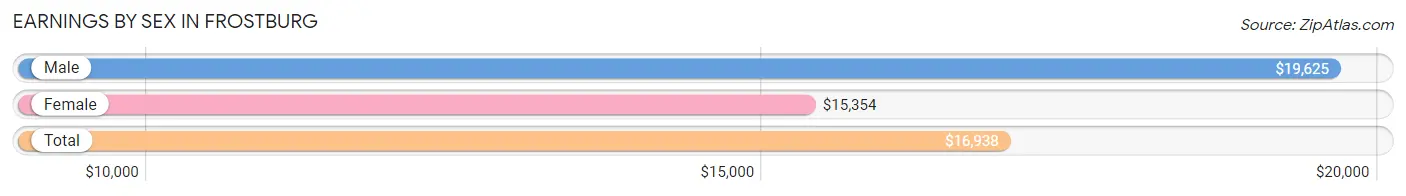
| Sex | Number | Average Earnings |
| Male | 1,954 (47.7%) | $19,625 |
| Female | 2,145 (52.3%) | $15,354 |
| Total | 4,099 (100.0%) | $16,938 |
Earnings by Sex by Income Bracket in Frostburg
The most common earnings brackets in Frostburg are $2,499 or less for men (221 | 11.3%) and $2,499 or less for women (317 | 14.8%).
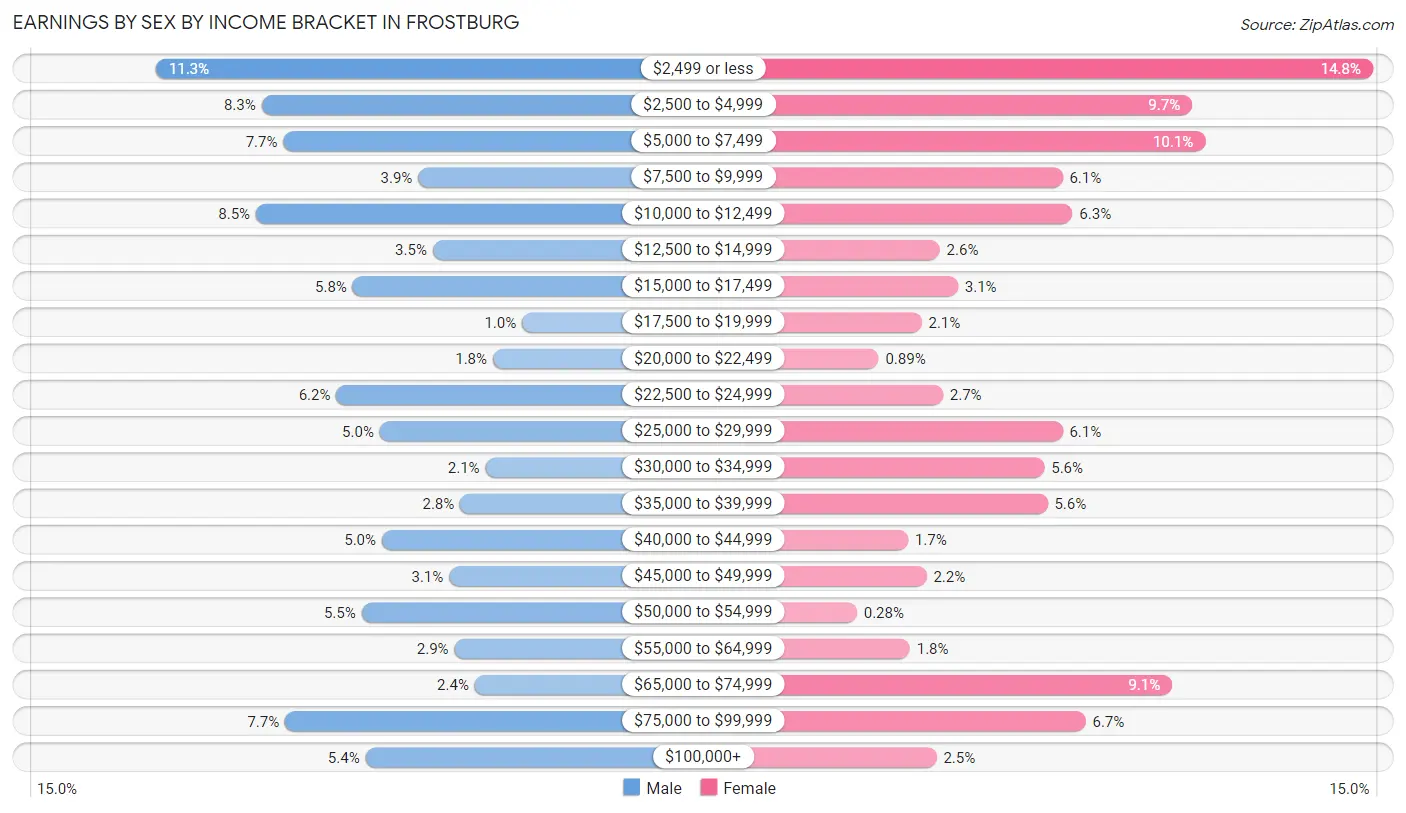
| Income | Male | Female |
| $2,499 or less | 221 (11.3%) | 317 (14.8%) |
| $2,500 to $4,999 | 163 (8.3%) | 208 (9.7%) |
| $5,000 to $7,499 | 151 (7.7%) | 216 (10.1%) |
| $7,500 to $9,999 | 77 (3.9%) | 130 (6.1%) |
| $10,000 to $12,499 | 166 (8.5%) | 136 (6.3%) |
| $12,500 to $14,999 | 69 (3.5%) | 56 (2.6%) |
| $15,000 to $17,499 | 113 (5.8%) | 67 (3.1%) |
| $17,500 to $19,999 | 20 (1.0%) | 45 (2.1%) |
| $20,000 to $22,499 | 36 (1.8%) | 19 (0.9%) |
| $22,500 to $24,999 | 122 (6.2%) | 58 (2.7%) |
| $25,000 to $29,999 | 98 (5.0%) | 130 (6.1%) |
| $30,000 to $34,999 | 40 (2.1%) | 119 (5.6%) |
| $35,000 to $39,999 | 54 (2.8%) | 121 (5.6%) |
| $40,000 to $44,999 | 97 (5.0%) | 37 (1.7%) |
| $45,000 to $49,999 | 60 (3.1%) | 48 (2.2%) |
| $50,000 to $54,999 | 108 (5.5%) | 6 (0.3%) |
| $55,000 to $64,999 | 57 (2.9%) | 38 (1.8%) |
| $65,000 to $74,999 | 46 (2.4%) | 196 (9.1%) |
| $75,000 to $99,999 | 150 (7.7%) | 144 (6.7%) |
| $100,000+ | 106 (5.4%) | 54 (2.5%) |
| Total | 1,954 (100.0%) | 2,145 (100.0%) |
Earnings by Sex by Educational Attainment in Frostburg
Average earnings in Frostburg are $44,731 for men and $36,675 for women, a difference of 18.0%. Men with an educational attainment of graduate degree enjoy the highest average annual earnings of $75,481, while those with less than high school education earn the least with $34,615. Women with an educational attainment of graduate degree earn the most with the average annual earnings of $69,219, while those with high school diploma education have the smallest earnings of $26,094.
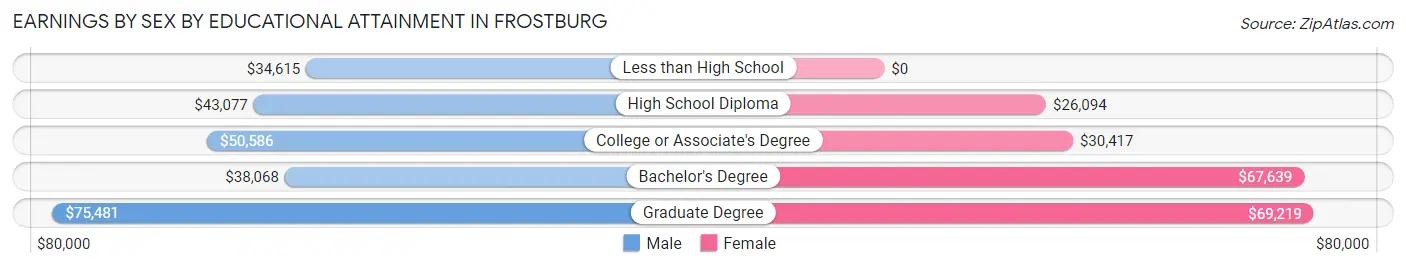
| Educational Attainment | Male Income | Female Income |
| Less than High School | $34,615 | $0 |
| High School Diploma | $43,077 | $26,094 |
| College or Associate's Degree | $50,586 | $30,417 |
| Bachelor's Degree | $38,068 | $67,639 |
| Graduate Degree | $75,481 | $69,219 |
| Total | $44,731 | $36,675 |
Family Income in Frostburg
Family Income Brackets in Frostburg
According to the Frostburg family income data, there are 248 families falling into the $100,000 to $149,999 income range, which is the most common income bracket and makes up 23.1% of all families. Conversely, the $10,000 to $14,999 income bracket is the least frequent group with only 40 families (3.7%) belonging to this category.
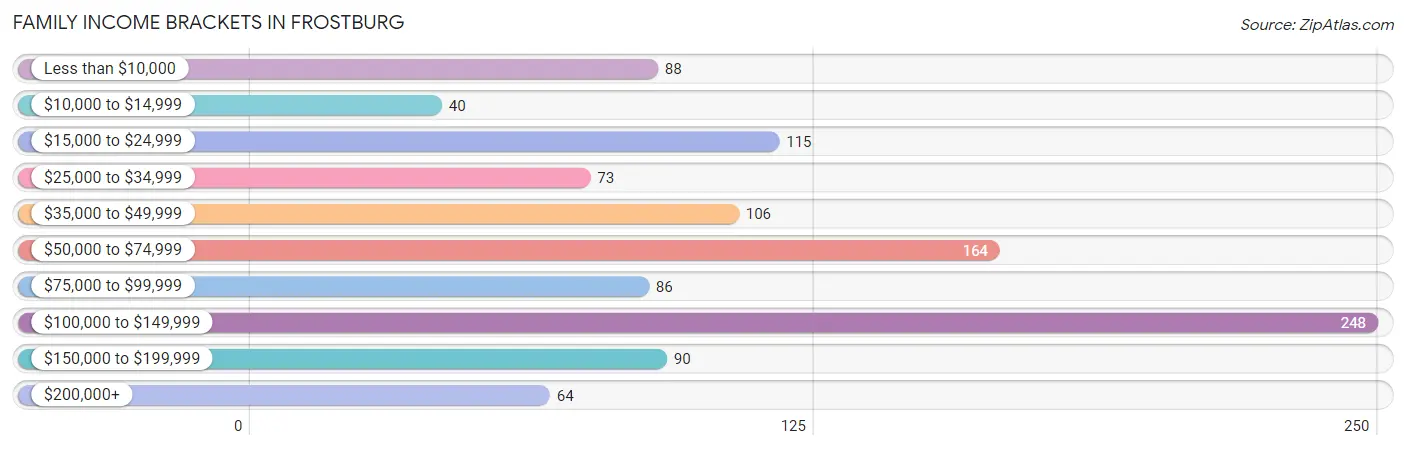
| Income Bracket | # Families | % Families |
| Less than $10,000 | 88 | 8.2% |
| $10,000 to $14,999 | 40 | 3.7% |
| $15,000 to $24,999 | 115 | 10.7% |
| $25,000 to $34,999 | 73 | 6.8% |
| $35,000 to $49,999 | 106 | 9.9% |
| $50,000 to $74,999 | 164 | 15.3% |
| $75,000 to $99,999 | 86 | 8.0% |
| $100,000 to $149,999 | 248 | 23.1% |
| $150,000 to $199,999 | 90 | 8.4% |
| $200,000+ | 64 | 6.0% |
Family Income by Famaliy Size in Frostburg
4-person families (165 | 15.3%) account for the highest median family income in Frostburg with $123,125 per family, while 4-person families (165 | 15.3%) have the highest median income of $30,781 per family member.
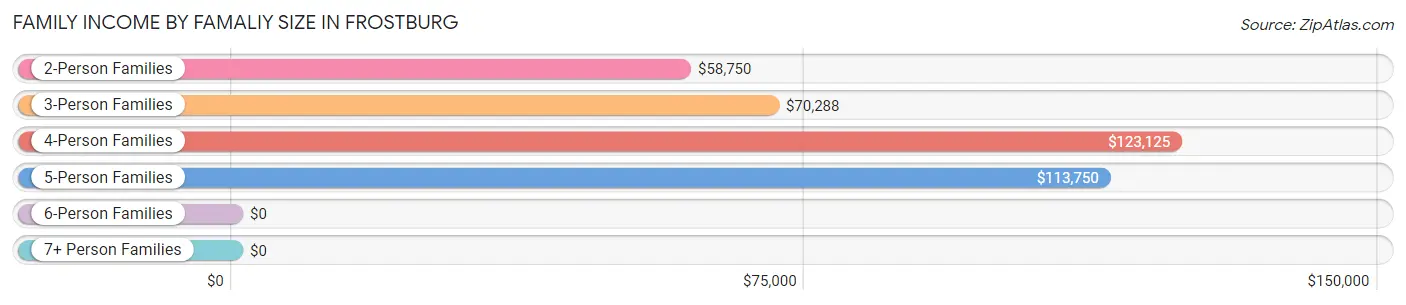
| Income Bracket | # Families | Median Income |
| 2-Person Families | 567 (52.7%) | $58,750 |
| 3-Person Families | 310 (28.8%) | $70,288 |
| 4-Person Families | 165 (15.3%) | $123,125 |
| 5-Person Families | 20 (1.9%) | $113,750 |
| 6-Person Families | 13 (1.2%) | $0 |
| 7+ Person Families | 0 (0.0%) | $0 |
| Total | 1,075 (100.0%) | $71,382 |
Family Income by Number of Earners in Frostburg
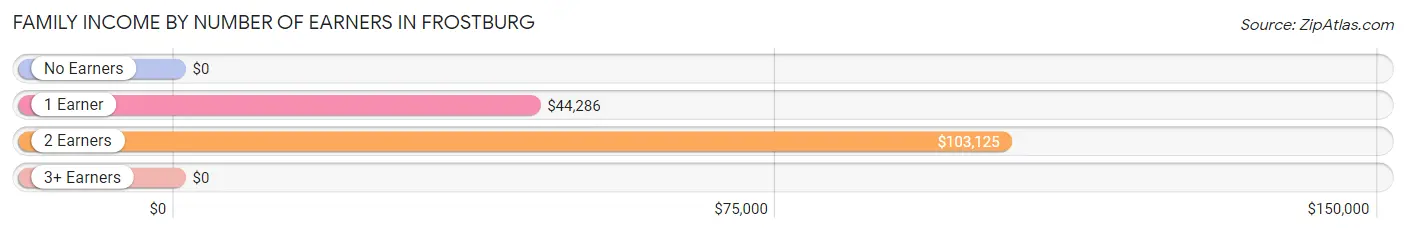
| Number of Earners | # Families | Median Income |
| No Earners | 286 (26.6%) | $0 |
| 1 Earner | 308 (28.6%) | $44,286 |
| 2 Earners | 399 (37.1%) | $103,125 |
| 3+ Earners | 82 (7.6%) | $0 |
| Total | 1,075 (100.0%) | $71,382 |
Household Income in Frostburg
Household Income Brackets in Frostburg
With 439 households falling in the category, the $100,000 to $149,999 income range is the most frequent in Frostburg, accounting for 17.3% of all households. In contrast, only 76 households (3.0%) fall into the $200,000+ income bracket, making it the least populous group.
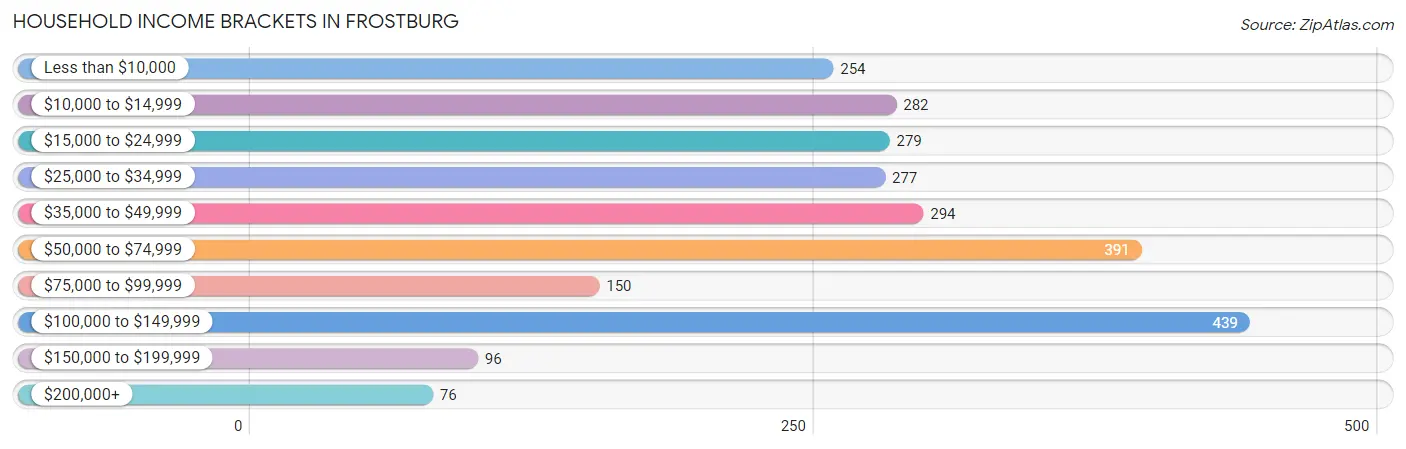
| Income Bracket | # Households | % Households |
| Less than $10,000 | 254 | 10.0% |
| $10,000 to $14,999 | 282 | 11.1% |
| $15,000 to $24,999 | 279 | 11.0% |
| $25,000 to $34,999 | 277 | 10.9% |
| $35,000 to $49,999 | 294 | 11.6% |
| $50,000 to $74,999 | 391 | 15.4% |
| $75,000 to $99,999 | 150 | 5.9% |
| $100,000 to $149,999 | 439 | 17.3% |
| $150,000 to $199,999 | 96 | 3.8% |
| $200,000+ | 76 | 3.0% |
Household Income by Householder Age in Frostburg
The median household income in Frostburg is $44,658, with the highest median household income of $69,167 found in the 25 to 44 years age bracket for the primary householder. A total of 690 households (27.2%) fall into this category. Meanwhile, the 15 to 24 years age bracket for the primary householder has the lowest median household income of $0, with 507 households (20.0%) in this group.
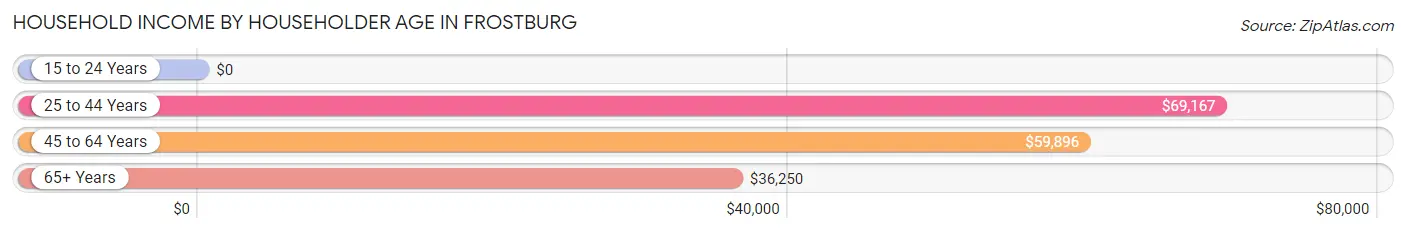
| Income Bracket | # Households | Median Income |
| 15 to 24 Years | 507 (20.0%) | $0 |
| 25 to 44 Years | 690 (27.2%) | $69,167 |
| 45 to 64 Years | 659 (26.0%) | $59,896 |
| 65+ Years | 682 (26.9%) | $36,250 |
| Total | 2,538 (100.0%) | $44,658 |
Poverty in Frostburg
Income Below Poverty by Sex and Age in Frostburg
With 23.9% poverty level for males and 32.8% for females among the residents of Frostburg, 18 to 24 year old males and 18 to 24 year old females are the most vulnerable to poverty, with 303 males (59.3%) and 547 females (67.9%) in their respective age groups living below the poverty level.
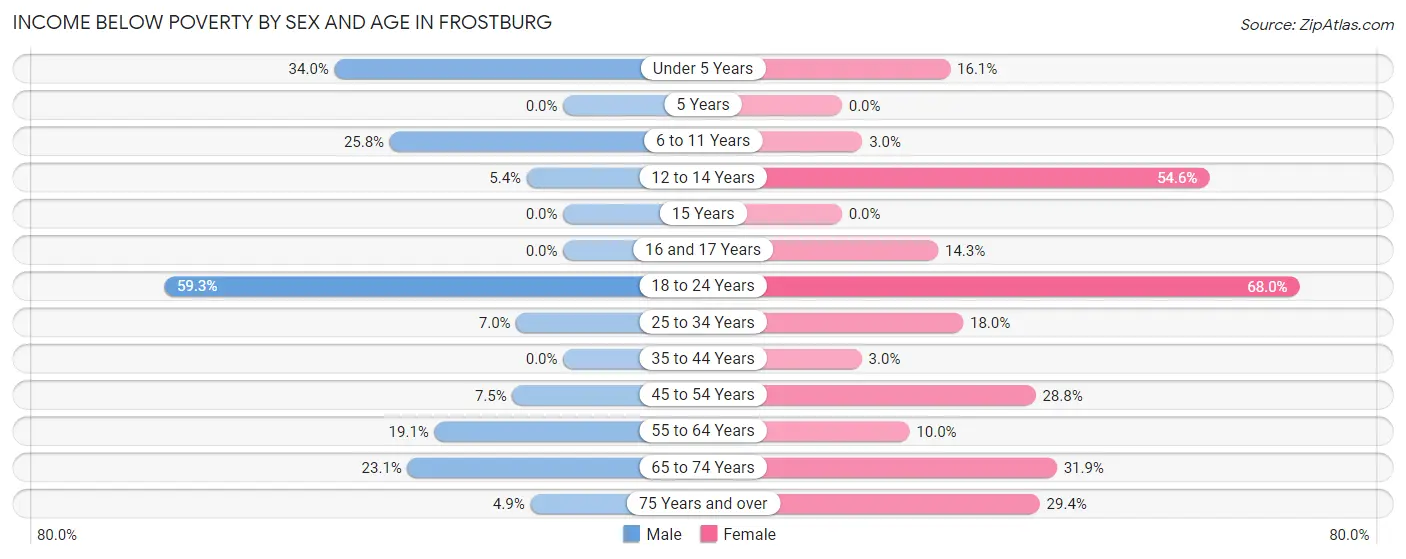
| Age Bracket | Male | Female |
| Under 5 Years | 54 (34.0%) | 23 (16.1%) |
| 5 Years | 0 (0.0%) | 0 (0.0%) |
| 6 to 11 Years | 43 (25.8%) | 3 (3.0%) |
| 12 to 14 Years | 2 (5.4%) | 12 (54.5%) |
| 15 Years | 0 (0.0%) | 0 (0.0%) |
| 16 and 17 Years | 0 (0.0%) | 9 (14.3%) |
| 18 to 24 Years | 303 (59.3%) | 547 (67.9%) |
| 25 to 34 Years | 28 (7.0%) | 54 (18.0%) |
| 35 to 44 Years | 0 (0.0%) | 9 (2.9%) |
| 45 to 54 Years | 15 (7.5%) | 88 (28.8%) |
| 55 to 64 Years | 56 (19.1%) | 23 (10.0%) |
| 65 to 74 Years | 46 (23.1%) | 135 (31.9%) |
| 75 Years and over | 4 (4.9%) | 62 (29.4%) |
| Total | 551 (23.9%) | 965 (32.8%) |
Income Above Poverty by Sex and Age in Frostburg
According to the poverty statistics in Frostburg, males aged 5 years and females aged 5 years are the age groups that are most secure financially, with 100.0% of males and 100.0% of females in these age groups living above the poverty line.
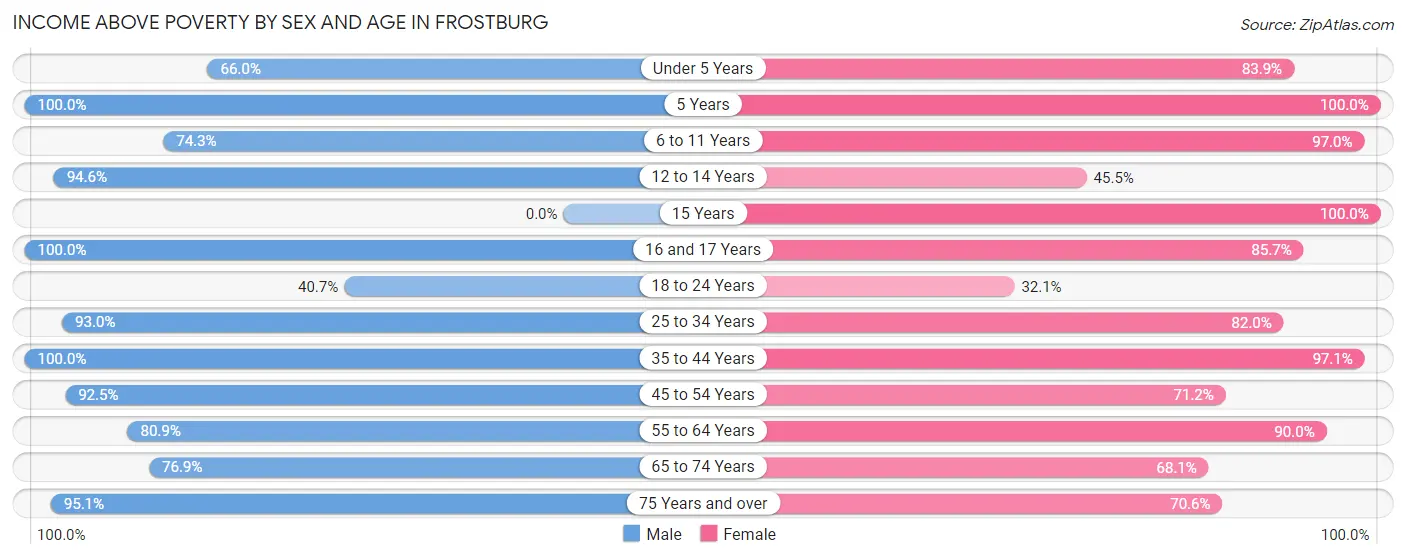
| Age Bracket | Male | Female |
| Under 5 Years | 105 (66.0%) | 120 (83.9%) |
| 5 Years | 31 (100.0%) | 5 (100.0%) |
| 6 to 11 Years | 124 (74.3%) | 96 (97.0%) |
| 12 to 14 Years | 35 (94.6%) | 10 (45.5%) |
| 15 Years | 0 (0.0%) | 28 (100.0%) |
| 16 and 17 Years | 28 (100.0%) | 54 (85.7%) |
| 18 to 24 Years | 208 (40.7%) | 258 (32.1%) |
| 25 to 34 Years | 374 (93.0%) | 246 (82.0%) |
| 35 to 44 Years | 201 (100.0%) | 296 (97.1%) |
| 45 to 54 Years | 184 (92.5%) | 218 (71.2%) |
| 55 to 64 Years | 237 (80.9%) | 206 (90.0%) |
| 65 to 74 Years | 153 (76.9%) | 288 (68.1%) |
| 75 Years and over | 78 (95.1%) | 149 (70.6%) |
| Total | 1,758 (76.1%) | 1,974 (67.2%) |
Income Below Poverty Among Married-Couple Families in Frostburg
The poverty statistics for married-couple families in Frostburg show that 8.7% or 60 of the total 690 families live below the poverty line. Families with no children have the highest poverty rate of 11.5%, comprising of 51 families. On the other hand, families with 3 or 4 children have the lowest poverty rate of 0.0%, which includes 0 families.
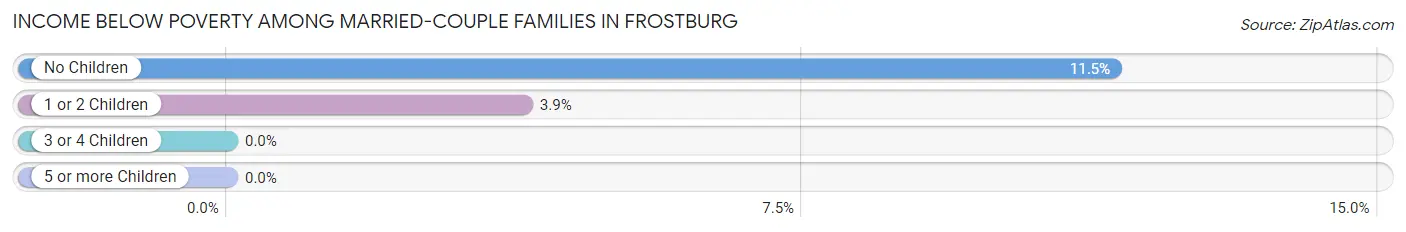
| Children | Above Poverty | Below Poverty |
| No Children | 391 (88.5%) | 51 (11.5%) |
| 1 or 2 Children | 225 (96.2%) | 9 (3.8%) |
| 3 or 4 Children | 14 (100.0%) | 0 (0.0%) |
| 5 or more Children | 0 (0.0%) | 0 (0.0%) |
| Total | 630 (91.3%) | 60 (8.7%) |
Income Below Poverty Among Single-Parent Households in Frostburg
According to the poverty data in Frostburg, 10.8% or 7 single-father households and 37.5% or 120 single-mother households are living below the poverty line. Among single-father households, those with no children have the highest poverty rate, with 7 households (35.0%) experiencing poverty. Likewise, among single-mother households, those with 1 or 2 children have the highest poverty rate, with 110 households (46.6%) falling below the poverty line.
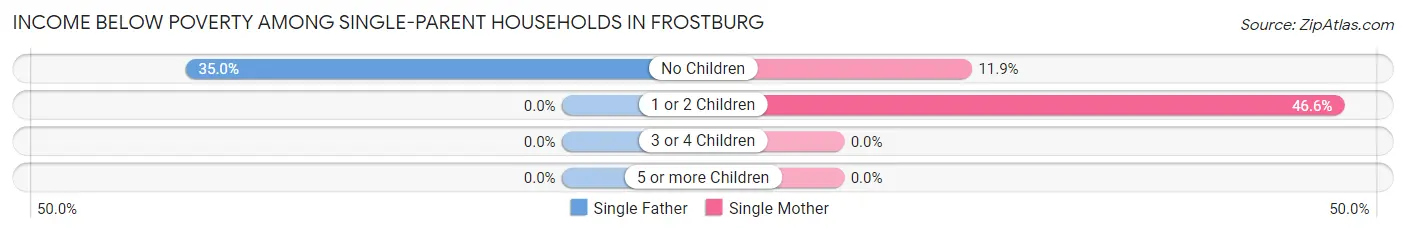
| Children | Single Father | Single Mother |
| No Children | 7 (35.0%) | 10 (11.9%) |
| 1 or 2 Children | 0 (0.0%) | 110 (46.6%) |
| 3 or 4 Children | 0 (0.0%) | 0 (0.0%) |
| 5 or more Children | 0 (0.0%) | 0 (0.0%) |
| Total | 7 (10.8%) | 120 (37.5%) |
Income Below Poverty Among Married-Couple vs Single-Parent Households in Frostburg
The poverty data for Frostburg shows that 60 of the married-couple family households (8.7%) and 127 of the single-parent households (33.0%) are living below the poverty level. Within the married-couple family households, those with no children have the highest poverty rate, with 51 households (11.5%) falling below the poverty line. Among the single-parent households, those with 1 or 2 children have the highest poverty rate, with 110 household (41.8%) living below poverty.
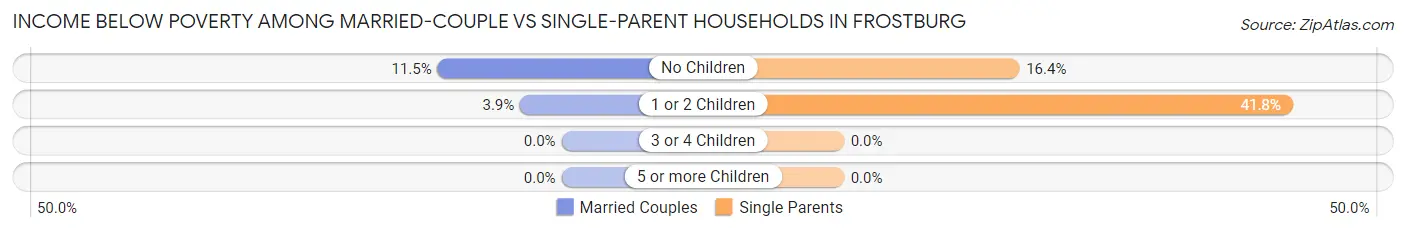
| Children | Married-Couple Families | Single-Parent Households |
| No Children | 51 (11.5%) | 17 (16.4%) |
| 1 or 2 Children | 9 (3.8%) | 110 (41.8%) |
| 3 or 4 Children | 0 (0.0%) | 0 (0.0%) |
| 5 or more Children | 0 (0.0%) | 0 (0.0%) |
| Total | 60 (8.7%) | 127 (33.0%) |
Race in Frostburg
The most populous races in Frostburg are White / Caucasian (5,711 | 80.2%), Black / African American (931 | 13.1%), and Hispanic or Latino (252 | 3.5%).
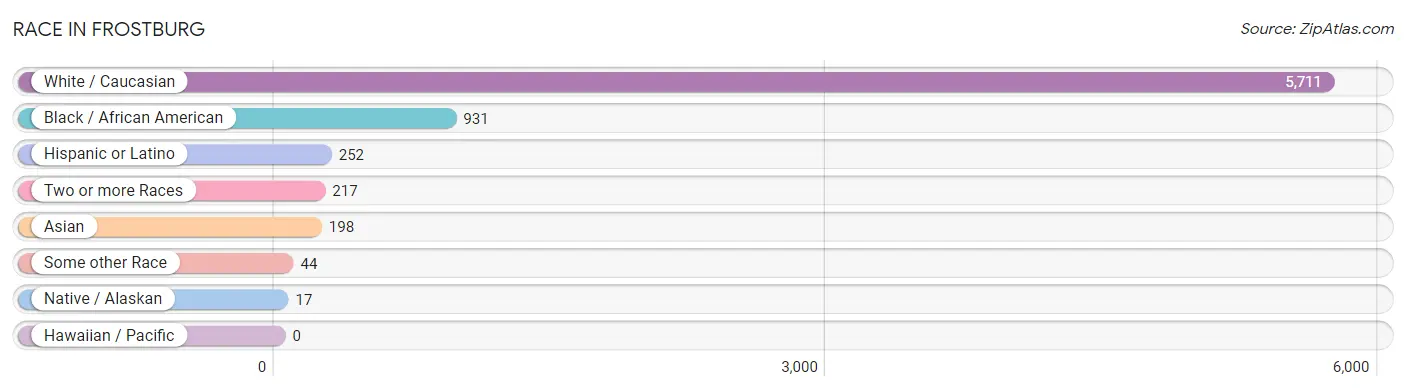
| Race | # Population | % Population |
| Asian | 198 | 2.8% |
| Black / African American | 931 | 13.1% |
| Hawaiian / Pacific | 0 | 0.0% |
| Hispanic or Latino | 252 | 3.5% |
| Native / Alaskan | 17 | 0.2% |
| White / Caucasian | 5,711 | 80.2% |
| Two or more Races | 217 | 3.0% |
| Some other Race | 44 | 0.6% |
| Total | 7,118 | 100.0% |
Ancestry in Frostburg
The most populous ancestries reported in Frostburg are German (1,580 | 22.2%), Irish (920 | 12.9%), English (820 | 11.5%), Scottish (254 | 3.6%), and Welsh (231 | 3.3%), together accounting for 53.5% of all Frostburg residents.
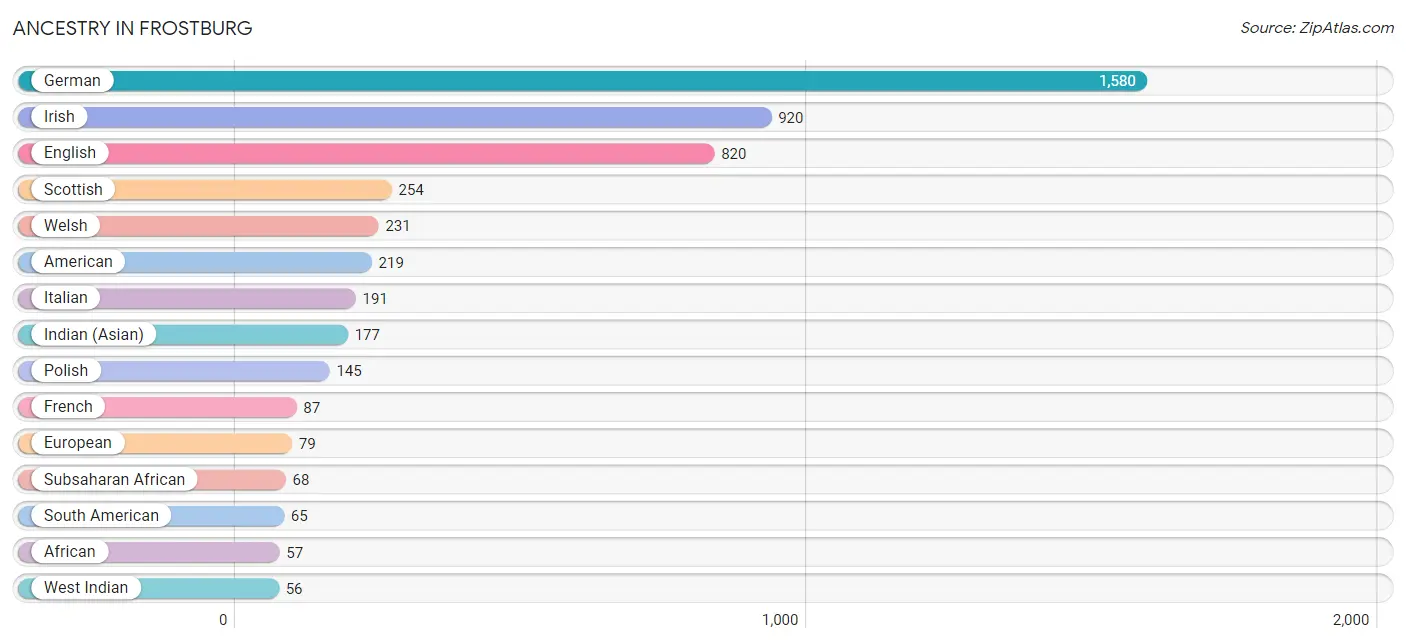
| Ancestry | # Population | % Population |
| African | 57 | 0.8% |
| Albanian | 9 | 0.1% |
| Alsatian | 11 | 0.2% |
| American | 219 | 3.1% |
| Arab | 16 | 0.2% |
| Bhutanese | 4 | 0.1% |
| British | 26 | 0.4% |
| Burmese | 12 | 0.2% |
| Central American | 54 | 0.8% |
| Cherokee | 6 | 0.1% |
| Chilean | 53 | 0.7% |
| Danish | 2 | 0.0% |
| Dutch | 49 | 0.7% |
| Eastern European | 18 | 0.3% |
| Ecuadorian | 6 | 0.1% |
| Egyptian | 16 | 0.2% |
| English | 820 | 11.5% |
| European | 79 | 1.1% |
| French | 87 | 1.2% |
| German | 1,580 | 22.2% |
| Greek | 18 | 0.3% |
| Haitian | 16 | 0.2% |
| Hungarian | 42 | 0.6% |
| Indian (Asian) | 177 | 2.5% |
| Irish | 920 | 12.9% |
| Iroquois | 3 | 0.0% |
| Italian | 191 | 2.7% |
| Jamaican | 42 | 0.6% |
| Korean | 12 | 0.2% |
| Lithuanian | 18 | 0.3% |
| Mexican | 16 | 0.2% |
| Native Hawaiian | 12 | 0.2% |
| Nigerian | 11 | 0.2% |
| Norwegian | 29 | 0.4% |
| Peruvian | 6 | 0.1% |
| Polish | 145 | 2.0% |
| Puerto Rican | 15 | 0.2% |
| Romanian | 7 | 0.1% |
| Russian | 17 | 0.2% |
| Salvadoran | 54 | 0.8% |
| Scotch-Irish | 53 | 0.7% |
| Scottish | 254 | 3.6% |
| Serbian | 8 | 0.1% |
| Slovak | 10 | 0.1% |
| Slovene | 32 | 0.4% |
| South American | 65 | 0.9% |
| Spaniard | 23 | 0.3% |
| Spanish | 3 | 0.0% |
| Subsaharan African | 68 | 1.0% |
| Swedish | 13 | 0.2% |
| Swiss | 15 | 0.2% |
| Thai | 13 | 0.2% |
| Welsh | 231 | 3.3% |
| West Indian | 56 | 0.8% |
| Yugoslavian | 6 | 0.1% | View All 55 Rows |
Immigrants in Frostburg
The most numerous immigrant groups reported in Frostburg came from Asia (170 | 2.4%), Eastern Asia (149 | 2.1%), China (137 | 1.9%), Europe (43 | 0.6%), and Southern Europe (43 | 0.6%), together accounting for 7.6% of all Frostburg residents.
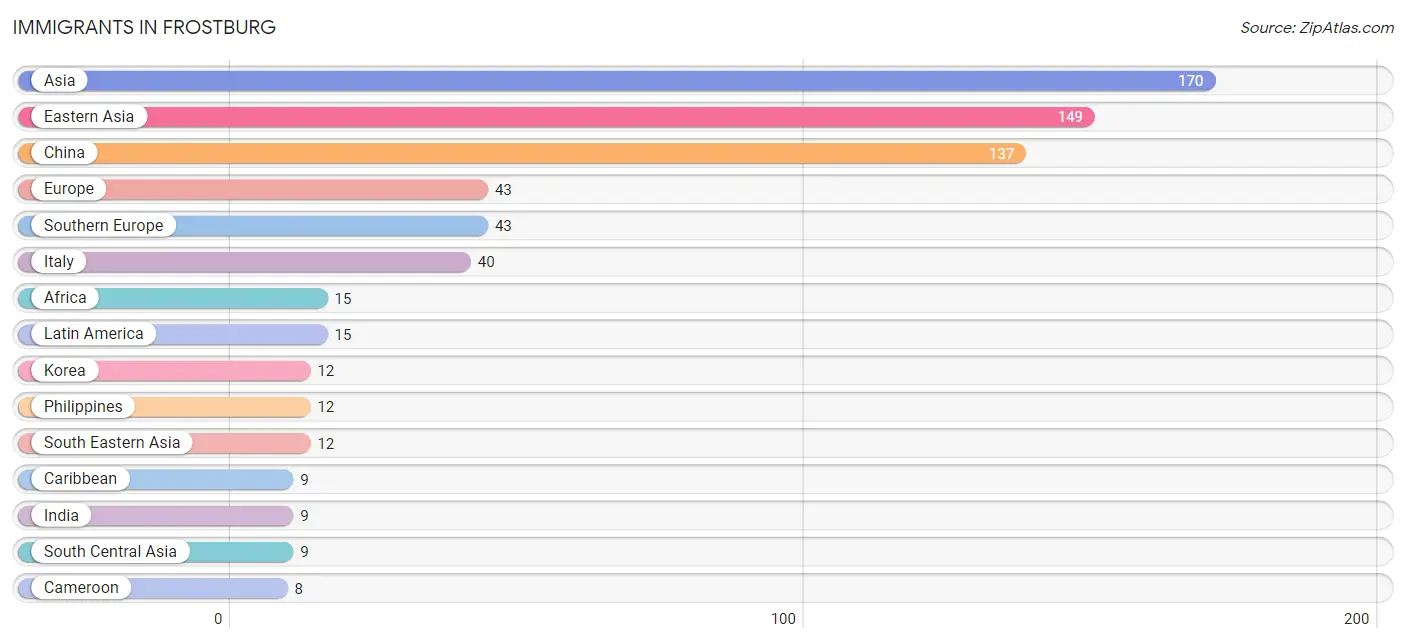
| Immigration Origin | # Population | % Population |
| Africa | 15 | 0.2% |
| Asia | 170 | 2.4% |
| Cameroon | 8 | 0.1% |
| Caribbean | 9 | 0.1% |
| China | 137 | 1.9% |
| Eastern Asia | 149 | 2.1% |
| Ecuador | 6 | 0.1% |
| Egypt | 7 | 0.1% |
| Europe | 43 | 0.6% |
| Greece | 3 | 0.0% |
| Haiti | 4 | 0.1% |
| India | 9 | 0.1% |
| Italy | 40 | 0.6% |
| Korea | 12 | 0.2% |
| Latin America | 15 | 0.2% |
| Middle Africa | 8 | 0.1% |
| Northern Africa | 7 | 0.1% |
| Philippines | 12 | 0.2% |
| South America | 6 | 0.1% |
| South Central Asia | 9 | 0.1% |
| South Eastern Asia | 12 | 0.2% |
| Southern Europe | 43 | 0.6% |
| Trinidad and Tobago | 5 | 0.1% | View All 23 Rows |
Sex and Age in Frostburg
Sex and Age in Frostburg
The most populous age groups in Frostburg are 20 to 24 Years (793 | 24.9%) for men and 20 to 24 Years (925 | 23.5%) for women.
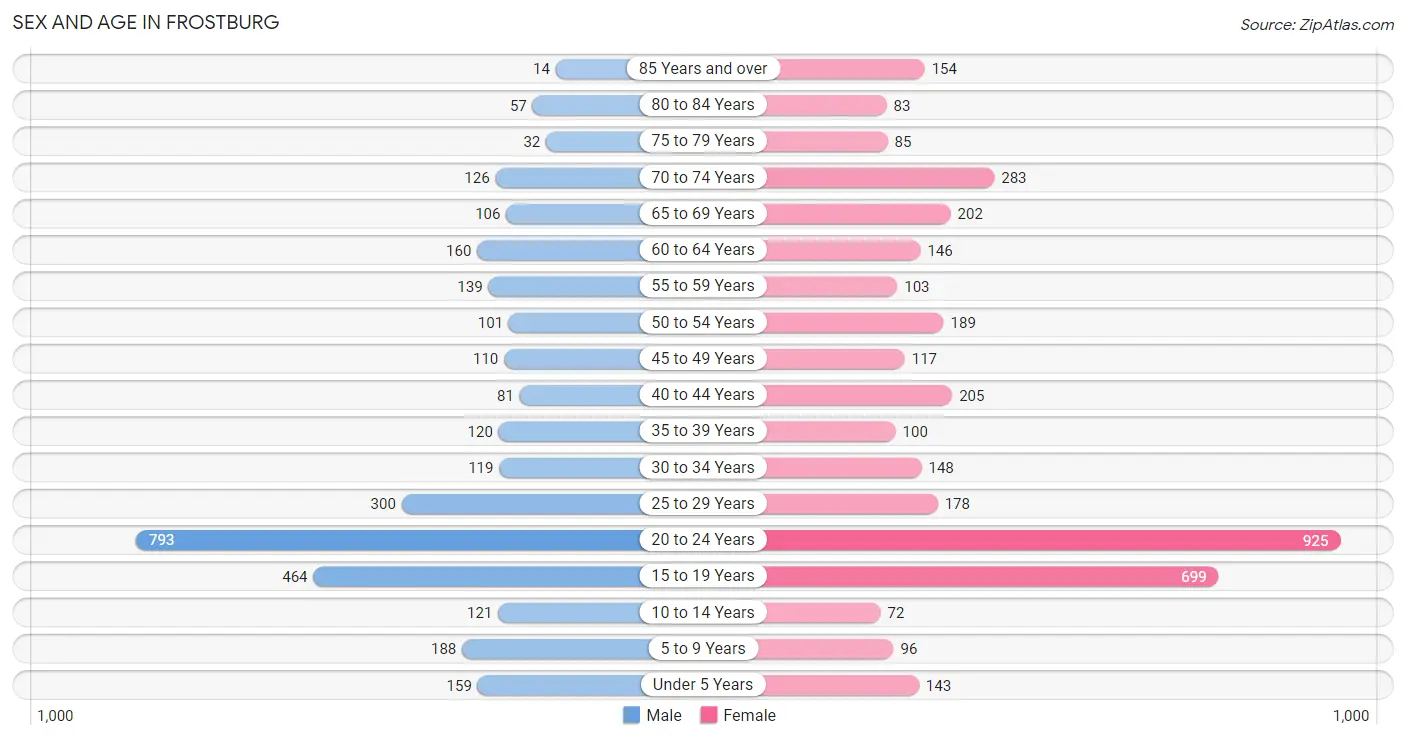
| Age Bracket | Male | Female |
| Under 5 Years | 159 (5.0%) | 143 (3.6%) |
| 5 to 9 Years | 188 (5.9%) | 96 (2.4%) |
| 10 to 14 Years | 121 (3.8%) | 72 (1.8%) |
| 15 to 19 Years | 464 (14.5%) | 699 (17.8%) |
| 20 to 24 Years | 793 (24.9%) | 925 (23.5%) |
| 25 to 29 Years | 300 (9.4%) | 178 (4.5%) |
| 30 to 34 Years | 119 (3.7%) | 148 (3.8%) |
| 35 to 39 Years | 120 (3.8%) | 100 (2.5%) |
| 40 to 44 Years | 81 (2.5%) | 205 (5.2%) |
| 45 to 49 Years | 110 (3.5%) | 117 (3.0%) |
| 50 to 54 Years | 101 (3.2%) | 189 (4.8%) |
| 55 to 59 Years | 139 (4.4%) | 103 (2.6%) |
| 60 to 64 Years | 160 (5.0%) | 146 (3.7%) |
| 65 to 69 Years | 106 (3.3%) | 202 (5.1%) |
| 70 to 74 Years | 126 (4.0%) | 283 (7.2%) |
| 75 to 79 Years | 32 (1.0%) | 85 (2.2%) |
| 80 to 84 Years | 57 (1.8%) | 83 (2.1%) |
| 85 Years and over | 14 (0.4%) | 154 (3.9%) |
| Total | 3,190 (100.0%) | 3,928 (100.0%) |
Families and Households in Frostburg
Median Family Size in Frostburg
The median family size in Frostburg is 2.69 persons per family, with married-couple families (690 | 64.2%) accounting for the largest median family size of 2.92 persons per family. On the other hand, single female/mother families (320 | 29.8%) represent the smallest median family size with 2.26 persons per family.
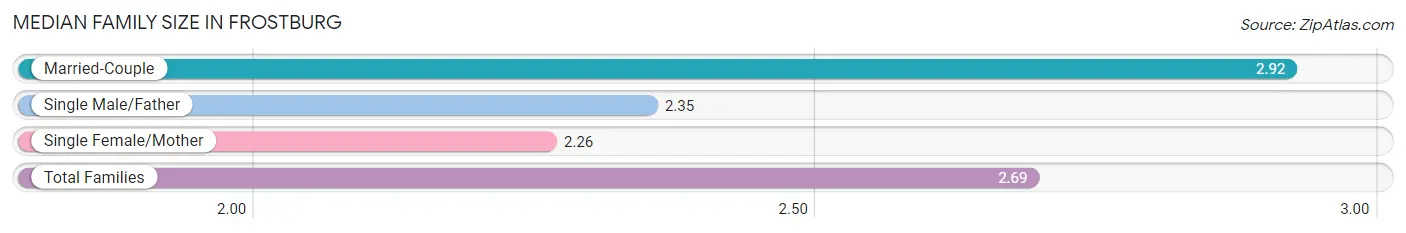
| Family Type | # Families | Family Size |
| Married-Couple | 690 (64.2%) | 2.92 |
| Single Male/Father | 65 (6.0%) | 2.35 |
| Single Female/Mother | 320 (29.8%) | 2.26 |
| Total Families | 1,075 (100.0%) | 2.69 |
Median Household Size in Frostburg
The median household size in Frostburg is 2.11 persons per household, with single male/father households (65 | 2.6%) accounting for the largest median household size of 3.09 persons per household. non-family households (1,463 | 57.6%) represent the smallest median household size with 1.61 persons per household.
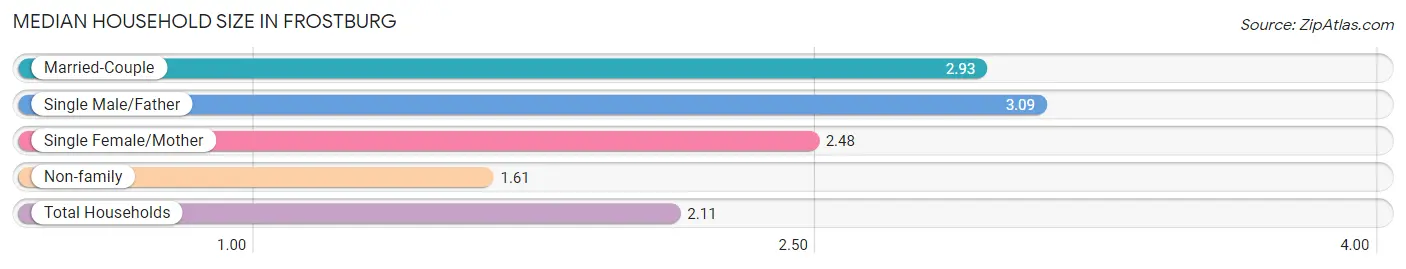
| Household Type | # Households | Household Size |
| Married-Couple | 690 (27.2%) | 2.93 |
| Single Male/Father | 65 (2.6%) | 3.09 |
| Single Female/Mother | 320 (12.6%) | 2.48 |
| Non-family | 1,463 (57.6%) | 1.61 |
| Total Households | 2,538 (100.0%) | 2.11 |
Household Size by Marriage Status in Frostburg
Out of a total of 2,538 households in Frostburg, 1,075 (42.4%) are family households, while 1,463 (57.6%) are nonfamily households. The most numerous type of family households are 2-person households, comprising 525, and the most common type of nonfamily households are 1-person households, comprising 967.
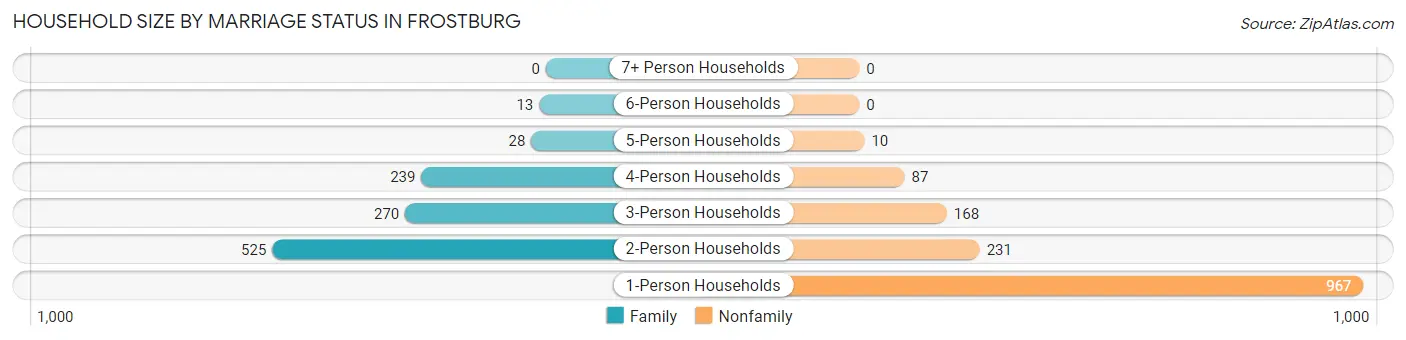
| Household Size | Family Households | Nonfamily Households |
| 1-Person Households | - | 967 (38.1%) |
| 2-Person Households | 525 (20.7%) | 231 (9.1%) |
| 3-Person Households | 270 (10.6%) | 168 (6.6%) |
| 4-Person Households | 239 (9.4%) | 87 (3.4%) |
| 5-Person Households | 28 (1.1%) | 10 (0.4%) |
| 6-Person Households | 13 (0.5%) | 0 (0.0%) |
| 7+ Person Households | 0 (0.0%) | 0 (0.0%) |
| Total | 1,075 (42.4%) | 1,463 (57.6%) |
Female Fertility in Frostburg
Fertility by Age in Frostburg
Average fertility rate in Frostburg is 59.0 births per 1,000 women. Women in the age bracket of 20 to 34 years have the highest fertility rate with 80.0 births per 1,000 women. Women in the age bracket of 20 to 34 years acount for 70.9% of all women with births.
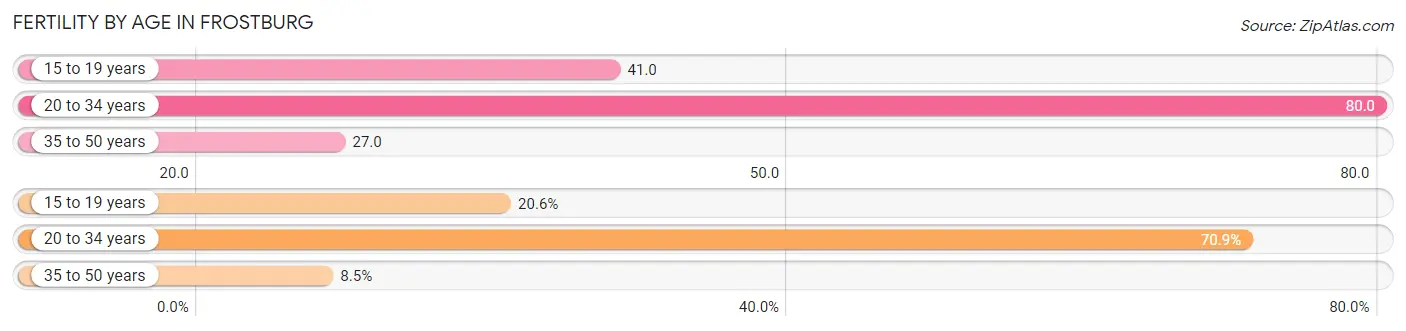
| Age Bracket | Women with Births | Births / 1,000 Women |
| 15 to 19 years | 29 (20.6%) | 41.0 |
| 20 to 34 years | 100 (70.9%) | 80.0 |
| 35 to 50 years | 12 (8.5%) | 27.0 |
| Total | 141 (100.0%) | 59.0 |
Fertility by Age by Marriage Status in Frostburg
32.6% of women with births (141) in Frostburg are married. The highest percentage of unmarried women with births falls into 15 to 19 years age bracket with 100.0% of them unmarried at the time of birth, while the lowest percentage of unmarried women with births belong to 35 to 50 years age bracket with 0.0% of them unmarried.
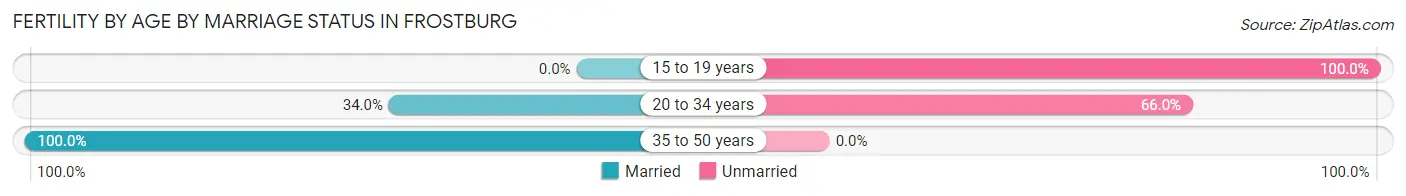
| Age Bracket | Married | Unmarried |
| 15 to 19 years | 0 (0.0%) | 29 (100.0%) |
| 20 to 34 years | 34 (34.0%) | 66 (66.0%) |
| 35 to 50 years | 12 (100.0%) | 0 (0.0%) |
| Total | 46 (32.6%) | 95 (67.4%) |
Fertility by Education in Frostburg
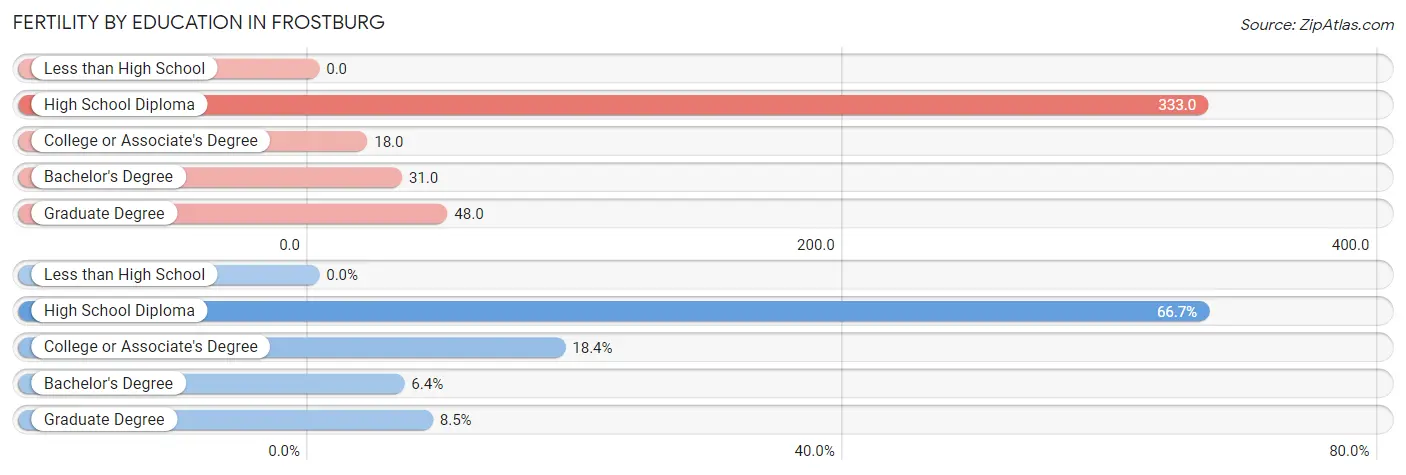
| Educational Attainment | Women with Births | Births / 1,000 Women |
| Less than High School | 0 (0.0%) | 0.0 |
| High School Diploma | 94 (66.7%) | 333.0 |
| College or Associate's Degree | 26 (18.4%) | 18.0 |
| Bachelor's Degree | 9 (6.4%) | 31.0 |
| Graduate Degree | 12 (8.5%) | 48.0 |
| Total | 141 (100.0%) | 59.0 |
Fertility by Education by Marriage Status in Frostburg
67.4% of women with births in Frostburg are unmarried. Women with the educational attainment of bachelor's degree are most likely to be married with 100.0% of them married at childbirth, while women with the educational attainment of college or associate's degree are least likely to be married with 100.0% of them unmarried at childbirth.
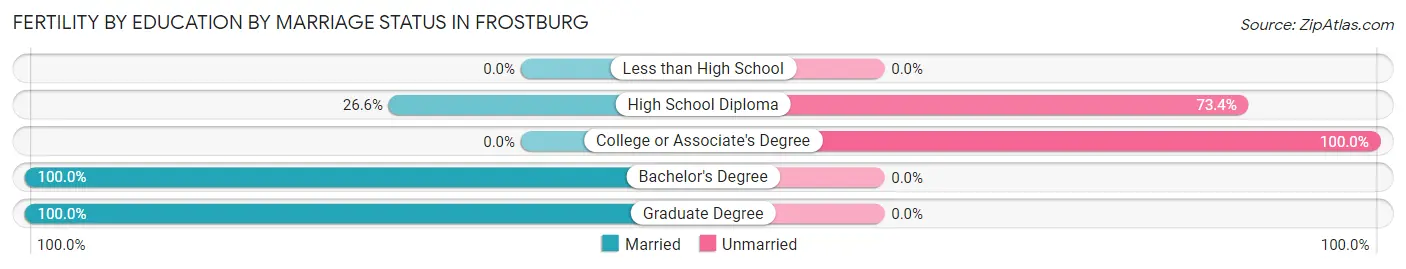
| Educational Attainment | Married | Unmarried |
| Less than High School | 0 (0.0%) | 0 (0.0%) |
| High School Diploma | 25 (26.6%) | 69 (73.4%) |
| College or Associate's Degree | 0 (0.0%) | 26 (100.0%) |
| Bachelor's Degree | 9 (100.0%) | 0 (0.0%) |
| Graduate Degree | 12 (100.0%) | 0 (0.0%) |
| Total | 46 (32.6%) | 95 (67.4%) |
Employment Characteristics in Frostburg
Employment by Class of Employer in Frostburg
Among the 2,693 employed individuals in Frostburg, private company employees (1,563 | 58.0%), state government employees (568 | 21.1%), and not-for-profit organizations (160 | 5.9%) make up the most common classes of employment.
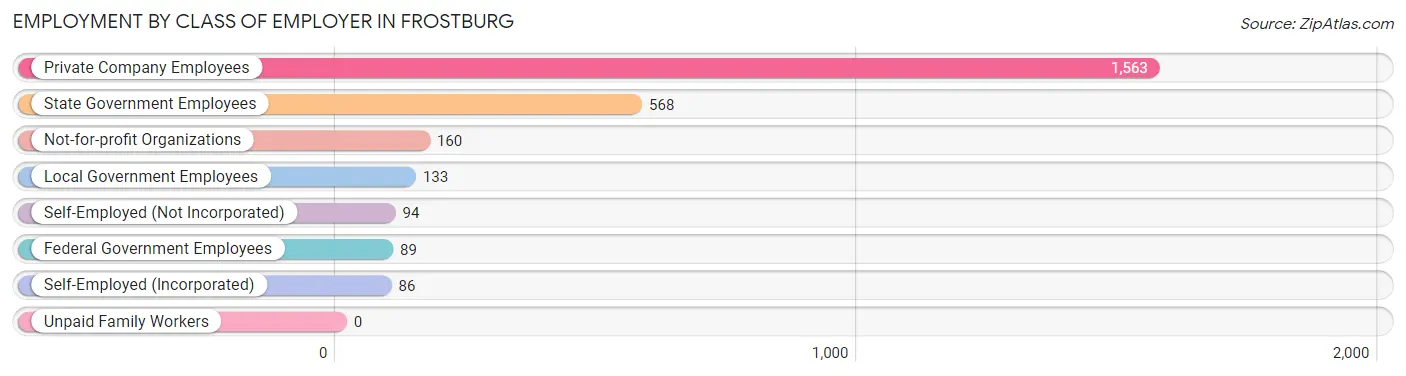
| Employer Class | # Employees | % Employees |
| Private Company Employees | 1,563 | 58.0% |
| Self-Employed (Incorporated) | 86 | 3.2% |
| Self-Employed (Not Incorporated) | 94 | 3.5% |
| Not-for-profit Organizations | 160 | 5.9% |
| Local Government Employees | 133 | 4.9% |
| State Government Employees | 568 | 21.1% |
| Federal Government Employees | 89 | 3.3% |
| Unpaid Family Workers | 0 | 0.0% |
| Total | 2,693 | 100.0% |
Employment Status by Age in Frostburg
According to the labor force statistics for Frostburg, out of the total population over 16 years of age (6,311), 48.2% or 3,042 individuals are in the labor force, with 7.3% or 222 of them unemployed. The age group with the highest labor force participation rate is 30 to 34 years, with 98.5% or 263 individuals in the labor force. Within the labor force, the 16 to 19 years age range has the highest percentage of unemployed individuals, with 19.4% or 74 of them being unemployed.
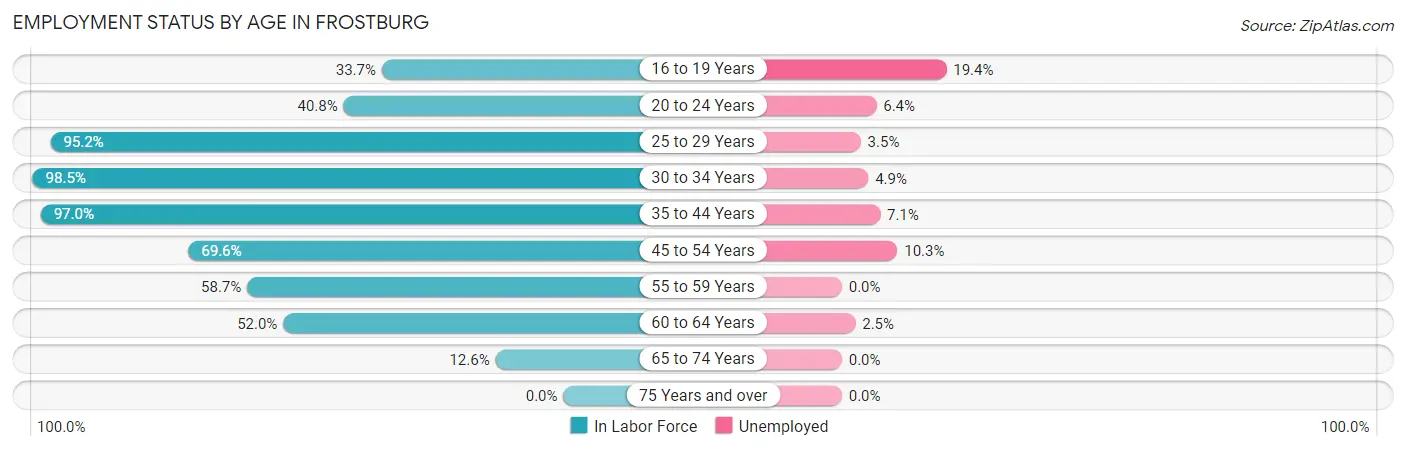
| Age Bracket | In Labor Force | Unemployed |
| 16 to 19 Years | 382 (33.7%) | 74 (19.4%) |
| 20 to 24 Years | 701 (40.8%) | 45 (6.4%) |
| 25 to 29 Years | 455 (95.2%) | 16 (3.5%) |
| 30 to 34 Years | 263 (98.5%) | 13 (4.9%) |
| 35 to 44 Years | 491 (97.0%) | 35 (7.1%) |
| 45 to 54 Years | 360 (69.6%) | 37 (10.3%) |
| 55 to 59 Years | 142 (58.7%) | 0 (0.0%) |
| 60 to 64 Years | 159 (52.0%) | 4 (2.5%) |
| 65 to 74 Years | 90 (12.6%) | 0 (0.0%) |
| 75 Years and over | 0 (0.0%) | 0 (0.0%) |
| Total | 3,042 (48.2%) | 222 (7.3%) |
Employment Status by Educational Attainment in Frostburg
According to labor force statistics for Frostburg, 80.7% of individuals (1,869) out of the total population between 25 and 64 years of age (2,316) are in the labor force, with 5.6% or 105 of them being unemployed. The group with the highest labor force participation rate are those with the educational attainment of bachelor's degree or higher, with 93.0% or 970 individuals in the labor force. Within the labor force, individuals with bachelor's degree or higher education have the highest percentage of unemployment, with 7.3% or 71 of them being unemployed.
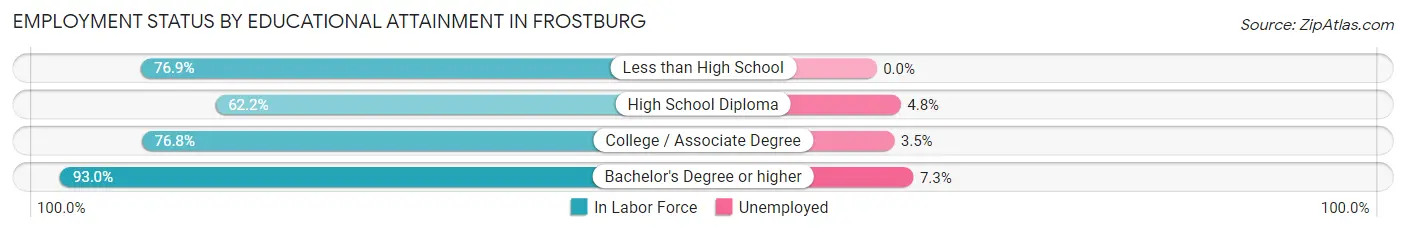
| Educational Attainment | In Labor Force | Unemployed |
| Less than High School | 50 (76.9%) | 0 (0.0%) |
| High School Diploma | 333 (62.2%) | 26 (4.8%) |
| College / Associate Degree | 517 (76.8%) | 24 (3.5%) |
| Bachelor's Degree or higher | 970 (93.0%) | 76 (7.3%) |
| Total | 1,869 (80.7%) | 130 (5.6%) |
Employment Occupations by Sex in Frostburg
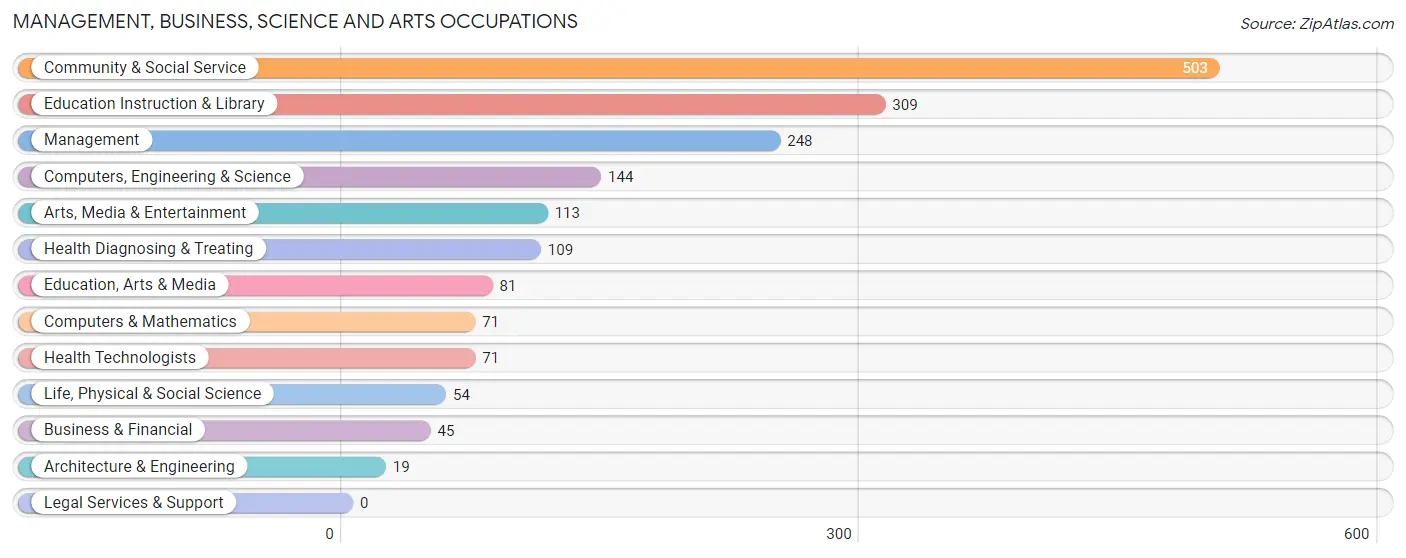
Management, Business, Science and Arts Occupations
The most common Management, Business, Science and Arts occupations in Frostburg are Community & Social Service (503 | 17.9%), Education Instruction & Library (309 | 11.0%), Management (248 | 8.8%), Computers, Engineering & Science (144 | 5.1%), and Arts, Media & Entertainment (113 | 4.0%).
Management, Business, Science and Arts Occupations by Sex
Within the Management, Business, Science and Arts occupations in Frostburg, the most male-oriented occupations are Business & Financial (100.0%), Architecture & Engineering (100.0%), and Life, Physical & Social Science (100.0%), while the most female-oriented occupations are Health Technologists (90.1%), Health Diagnosing & Treating (80.7%), and Education Instruction & Library (78.0%).
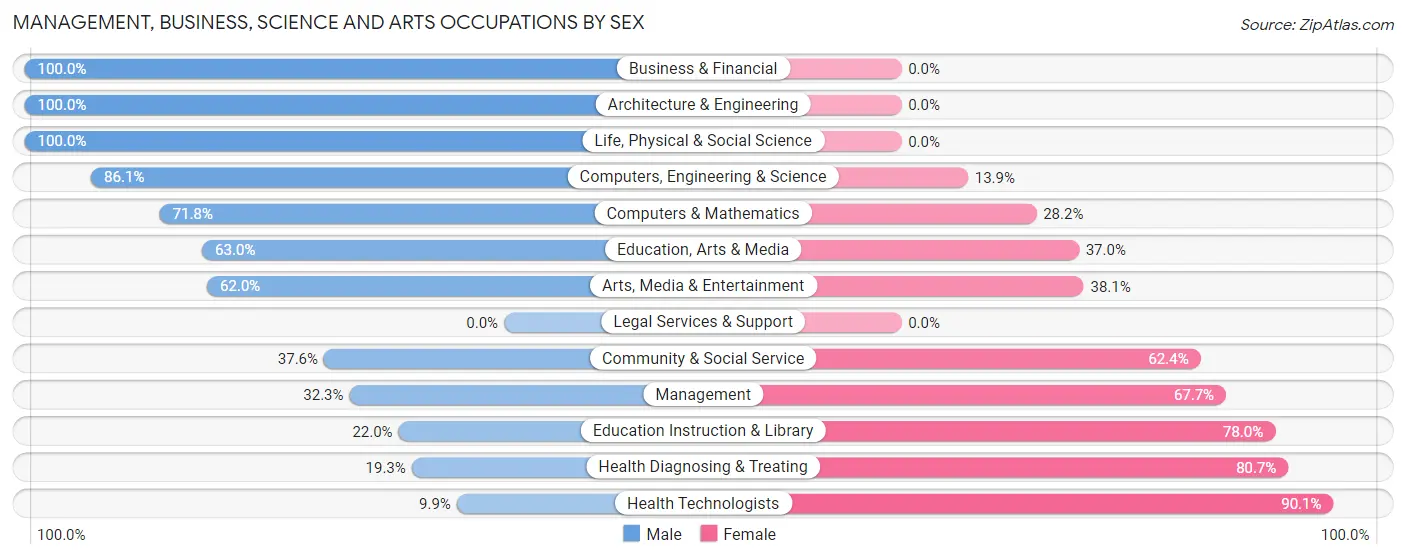
| Occupation | Male | Female |
| Management | 80 (32.3%) | 168 (67.7%) |
| Business & Financial | 45 (100.0%) | 0 (0.0%) |
| Computers, Engineering & Science | 124 (86.1%) | 20 (13.9%) |
| Computers & Mathematics | 51 (71.8%) | 20 (28.2%) |
| Architecture & Engineering | 19 (100.0%) | 0 (0.0%) |
| Life, Physical & Social Science | 54 (100.0%) | 0 (0.0%) |
| Community & Social Service | 189 (37.6%) | 314 (62.4%) |
| Education, Arts & Media | 51 (63.0%) | 30 (37.0%) |
| Legal Services & Support | 0 (0.0%) | 0 (0.0%) |
| Education Instruction & Library | 68 (22.0%) | 241 (78.0%) |
| Arts, Media & Entertainment | 70 (62.0%) | 43 (38.1%) |
| Health Diagnosing & Treating | 21 (19.3%) | 88 (80.7%) |
| Health Technologists | 7 (9.9%) | 64 (90.1%) |
| Total (Category) | 459 (43.8%) | 590 (56.2%) |
| Total (Overall) | 1,389 (49.4%) | 1,421 (50.6%) |
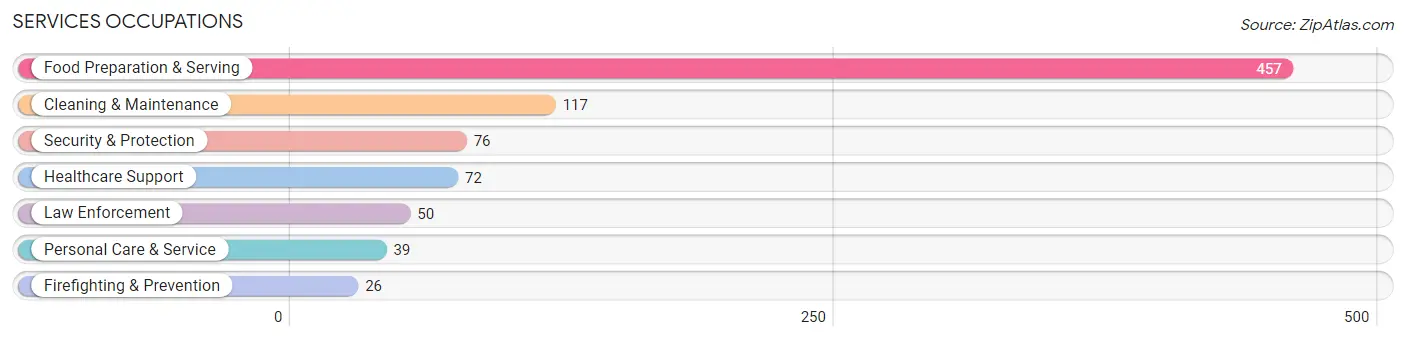
Services Occupations
The most common Services occupations in Frostburg are Food Preparation & Serving (457 | 16.3%), Cleaning & Maintenance (117 | 4.2%), Security & Protection (76 | 2.7%), Healthcare Support (72 | 2.6%), and Law Enforcement (50 | 1.8%).
Services Occupations by Sex
Within the Services occupations in Frostburg, the most male-oriented occupations are Security & Protection (100.0%), Firefighting & Prevention (100.0%), and Law Enforcement (100.0%), while the most female-oriented occupations are Healthcare Support (100.0%), Food Preparation & Serving (55.1%), and Cleaning & Maintenance (47.9%).
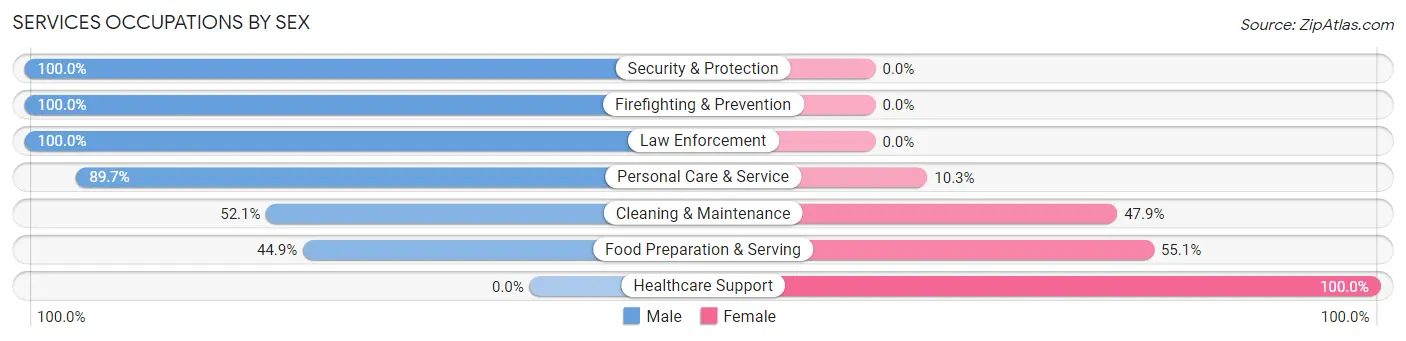
| Occupation | Male | Female |
| Healthcare Support | 0 (0.0%) | 72 (100.0%) |
| Security & Protection | 76 (100.0%) | 0 (0.0%) |
| Firefighting & Prevention | 26 (100.0%) | 0 (0.0%) |
| Law Enforcement | 50 (100.0%) | 0 (0.0%) |
| Food Preparation & Serving | 205 (44.9%) | 252 (55.1%) |
| Cleaning & Maintenance | 61 (52.1%) | 56 (47.9%) |
| Personal Care & Service | 35 (89.7%) | 4 (10.3%) |
| Total (Category) | 377 (49.5%) | 384 (50.5%) |
| Total (Overall) | 1,389 (49.4%) | 1,421 (50.6%) |
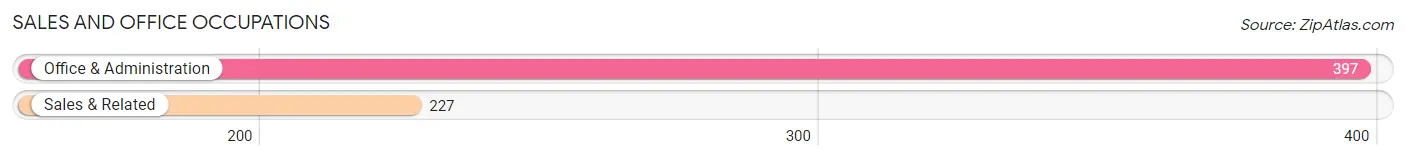
Sales and Office Occupations
The most common Sales and Office occupations in Frostburg are Office & Administration (397 | 14.1%), and Sales & Related (227 | 8.1%).
Sales and Office Occupations by Sex
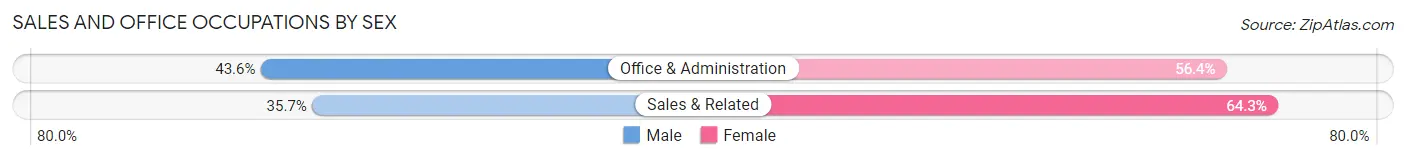
| Occupation | Male | Female |
| Sales & Related | 81 (35.7%) | 146 (64.3%) |
| Office & Administration | 173 (43.6%) | 224 (56.4%) |
| Total (Category) | 254 (40.7%) | 370 (59.3%) |
| Total (Overall) | 1,389 (49.4%) | 1,421 (50.6%) |
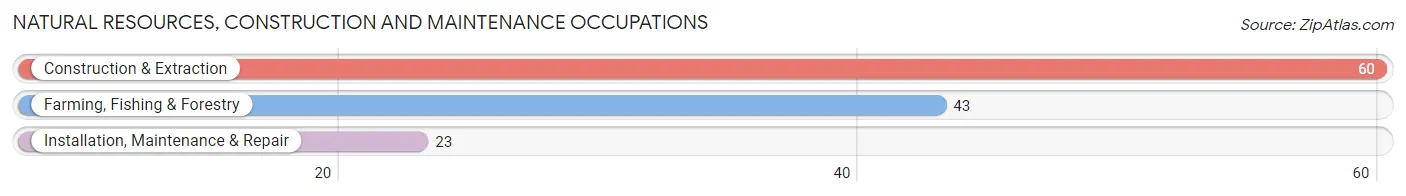
Natural Resources, Construction and Maintenance Occupations
The most common Natural Resources, Construction and Maintenance occupations in Frostburg are Construction & Extraction (60 | 2.1%), Farming, Fishing & Forestry (43 | 1.5%), and Installation, Maintenance & Repair (23 | 0.8%).
Natural Resources, Construction and Maintenance Occupations by Sex
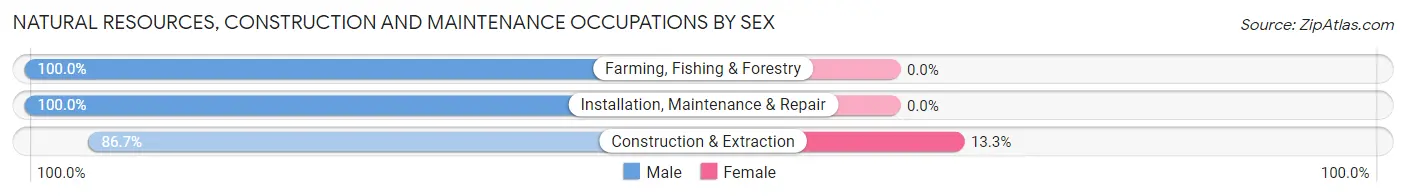
| Occupation | Male | Female |
| Farming, Fishing & Forestry | 43 (100.0%) | 0 (0.0%) |
| Construction & Extraction | 52 (86.7%) | 8 (13.3%) |
| Installation, Maintenance & Repair | 23 (100.0%) | 0 (0.0%) |
| Total (Category) | 118 (93.6%) | 8 (6.4%) |
| Total (Overall) | 1,389 (49.4%) | 1,421 (50.6%) |
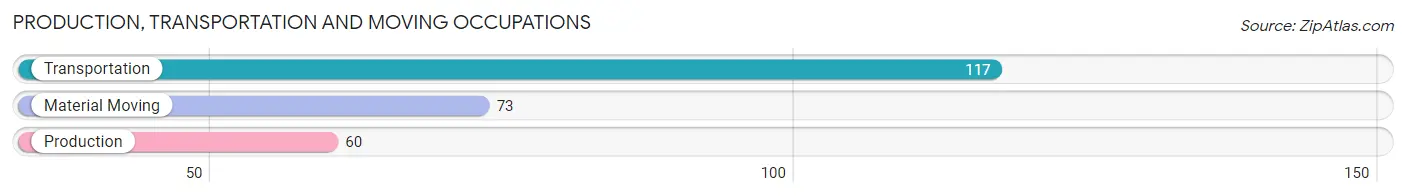
Production, Transportation and Moving Occupations
The most common Production, Transportation and Moving occupations in Frostburg are Transportation (117 | 4.2%), Material Moving (73 | 2.6%), and Production (60 | 2.1%).
Production, Transportation and Moving Occupations by Sex
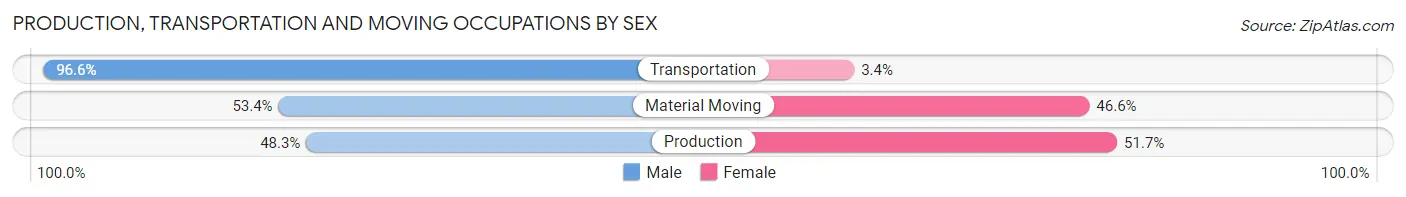
| Occupation | Male | Female |
| Production | 29 (48.3%) | 31 (51.7%) |
| Transportation | 113 (96.6%) | 4 (3.4%) |
| Material Moving | 39 (53.4%) | 34 (46.6%) |
| Total (Category) | 181 (72.4%) | 69 (27.6%) |
| Total (Overall) | 1,389 (49.4%) | 1,421 (50.6%) |
Employment Industries by Sex in Frostburg
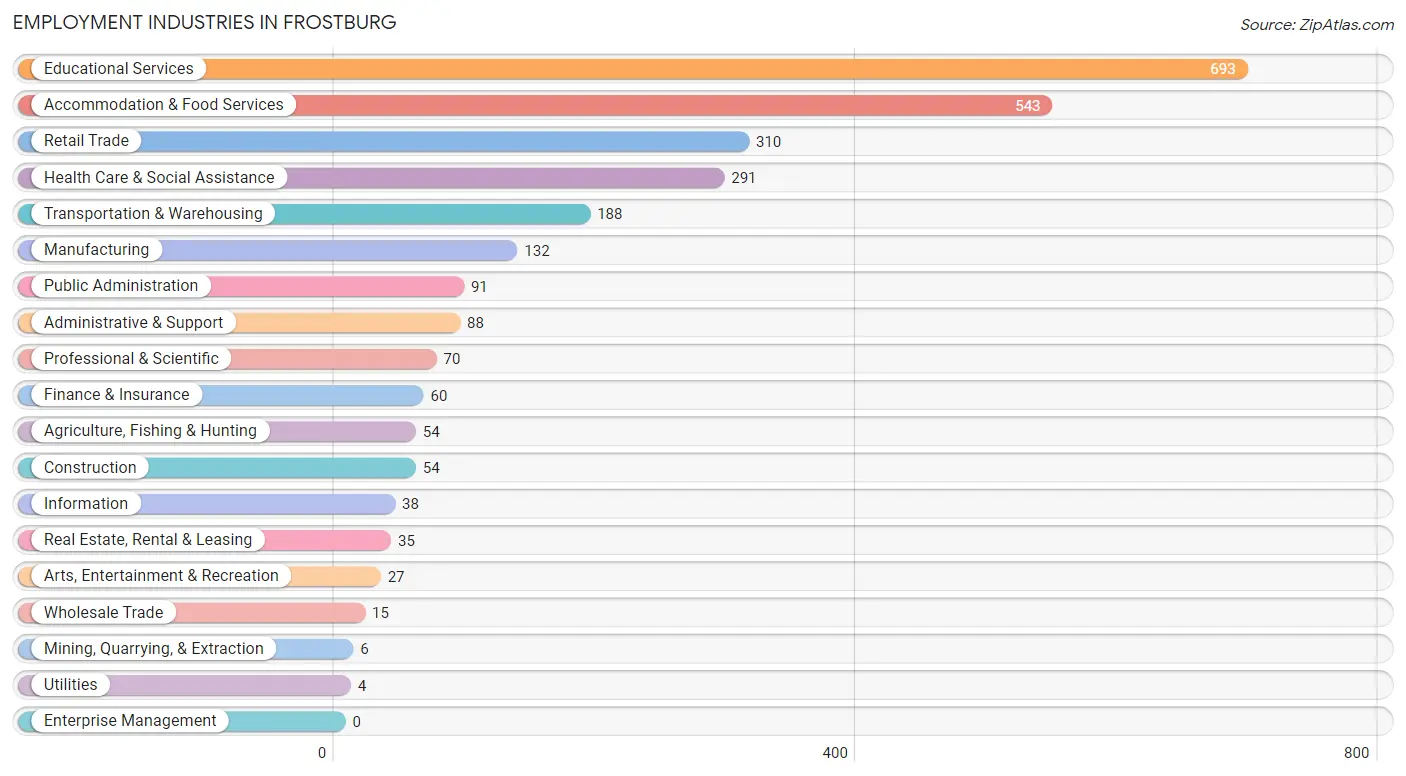
Employment Industries in Frostburg
The major employment industries in Frostburg include Educational Services (693 | 24.7%), Accommodation & Food Services (543 | 19.3%), Retail Trade (310 | 11.0%), Health Care & Social Assistance (291 | 10.4%), and Transportation & Warehousing (188 | 6.7%).
Employment Industries by Sex in Frostburg
The Frostburg industries that see more men than women are Agriculture, Fishing & Hunting (100.0%), Mining, Quarrying, & Extraction (100.0%), and Utilities (100.0%), whereas the industries that tend to have a higher number of women are Real Estate, Rental & Leasing (100.0%), Health Care & Social Assistance (75.9%), and Information (71.1%).
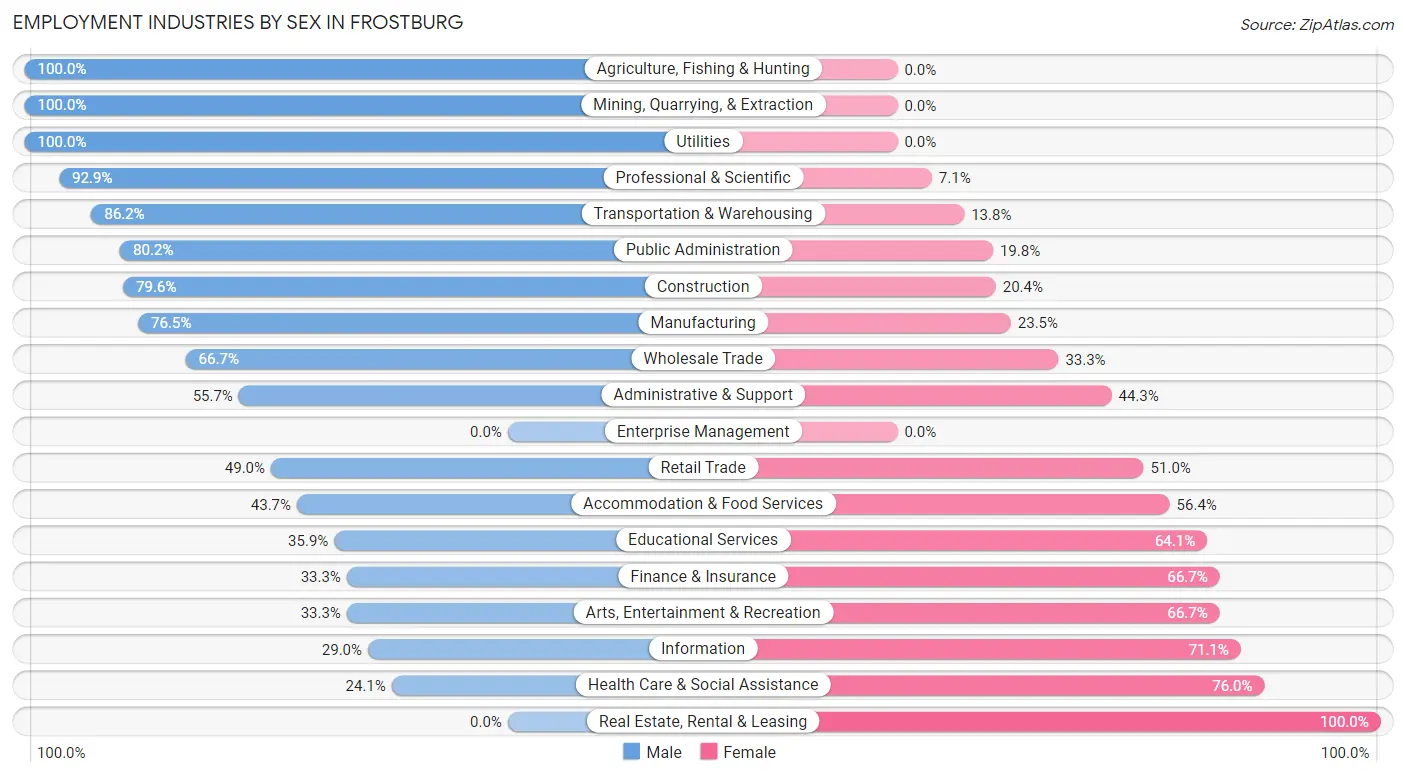
| Industry | Male | Female |
| Agriculture, Fishing & Hunting | 54 (100.0%) | 0 (0.0%) |
| Mining, Quarrying, & Extraction | 6 (100.0%) | 0 (0.0%) |
| Construction | 43 (79.6%) | 11 (20.4%) |
| Manufacturing | 101 (76.5%) | 31 (23.5%) |
| Wholesale Trade | 10 (66.7%) | 5 (33.3%) |
| Retail Trade | 152 (49.0%) | 158 (51.0%) |
| Transportation & Warehousing | 162 (86.2%) | 26 (13.8%) |
| Utilities | 4 (100.0%) | 0 (0.0%) |
| Information | 11 (28.9%) | 27 (71.1%) |
| Finance & Insurance | 20 (33.3%) | 40 (66.7%) |
| Real Estate, Rental & Leasing | 0 (0.0%) | 35 (100.0%) |
| Professional & Scientific | 65 (92.9%) | 5 (7.1%) |
| Enterprise Management | 0 (0.0%) | 0 (0.0%) |
| Administrative & Support | 49 (55.7%) | 39 (44.3%) |
| Educational Services | 249 (35.9%) | 444 (64.1%) |
| Health Care & Social Assistance | 70 (24.0%) | 221 (75.9%) |
| Arts, Entertainment & Recreation | 9 (33.3%) | 18 (66.7%) |
| Accommodation & Food Services | 237 (43.6%) | 306 (56.4%) |
| Public Administration | 73 (80.2%) | 18 (19.8%) |
| Total | 1,389 (49.4%) | 1,421 (50.6%) |
Education in Frostburg
School Enrollment in Frostburg
The most common levels of schooling among the 3,253 students in Frostburg are college / undergraduate (2,451 | 75.3%), elementary school (239 | 7.3%), and graduate / professional (189 | 5.8%).
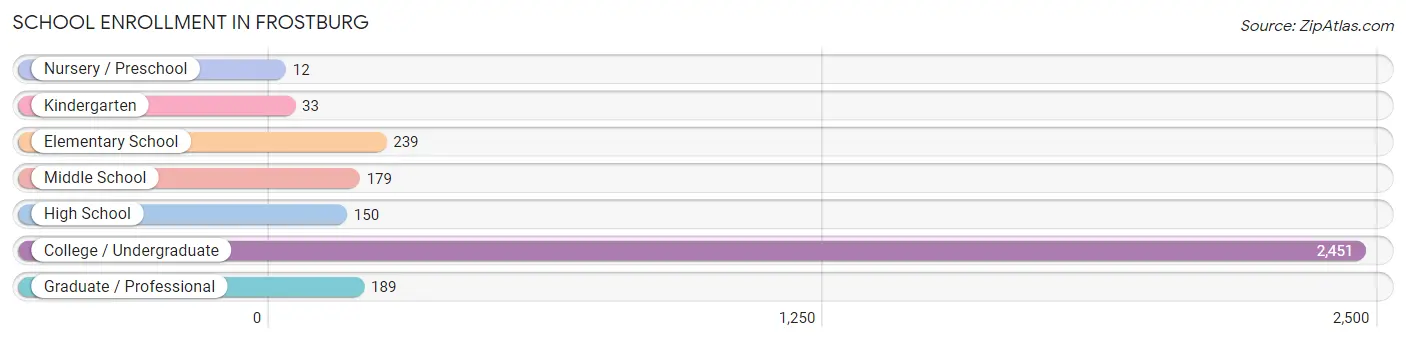
| School Level | # Students | % Students |
| Nursery / Preschool | 12 | 0.4% |
| Kindergarten | 33 | 1.0% |
| Elementary School | 239 | 7.3% |
| Middle School | 179 | 5.5% |
| High School | 150 | 4.6% |
| College / Undergraduate | 2,451 | 75.3% |
| Graduate / Professional | 189 | 5.8% |
| Total | 3,253 | 100.0% |
School Enrollment by Age by Funding Source in Frostburg
Out of a total of 3,253 students who are enrolled in schools in Frostburg, 277 (8.5%) attend a private institution, while the remaining 2,976 (91.5%) are enrolled in public schools. The age group of 3 to 4 year olds has the highest likelihood of being enrolled in private schools, with 10 (100.0% in the age bracket) enrolled. Conversely, the age group of 15 to 17 year olds has the lowest likelihood of being enrolled in a private school, with 119 (100.0% in the age bracket) attending a public institution.
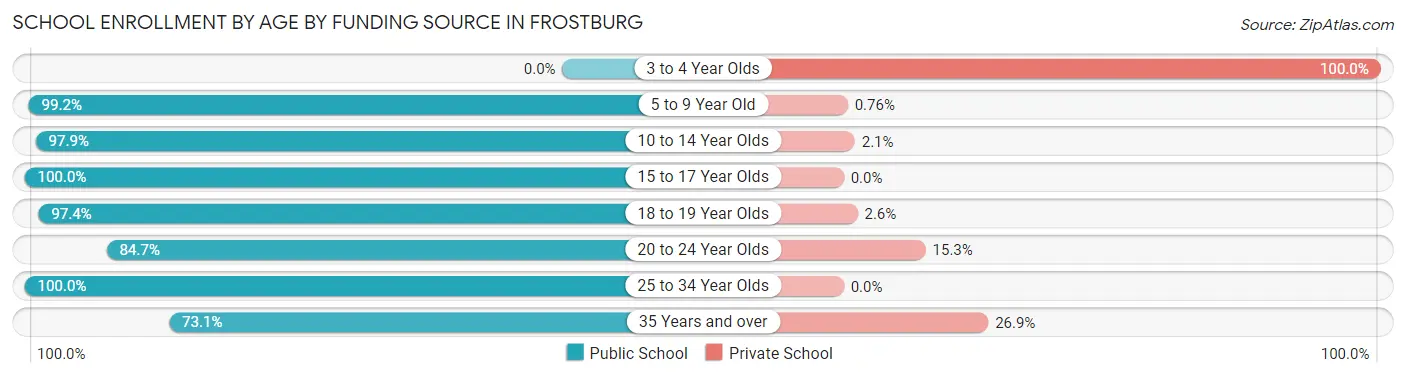
| Age Bracket | Public School | Private School |
| 3 to 4 Year Olds | 0 (0.0%) | 10 (100.0%) |
| 5 to 9 Year Old | 262 (99.2%) | 2 (0.8%) |
| 10 to 14 Year Olds | 189 (97.9%) | 4 (2.1%) |
| 15 to 17 Year Olds | 119 (100.0%) | 0 (0.0%) |
| 18 to 19 Year Olds | 980 (97.4%) | 26 (2.6%) |
| 20 to 24 Year Olds | 1,227 (84.7%) | 221 (15.3%) |
| 25 to 34 Year Olds | 161 (100.0%) | 0 (0.0%) |
| 35 Years and over | 38 (73.1%) | 14 (26.9%) |
| Total | 2,976 (91.5%) | 277 (8.5%) |
Educational Attainment by Field of Study in Frostburg
Education (353 | 23.7%), business (291 | 19.5%), social sciences (112 | 7.5%), science & technology (111 | 7.4%), and liberal arts & history (95 | 6.4%) are the most common fields of study among 1,489 individuals in Frostburg who have obtained a bachelor's degree or higher.
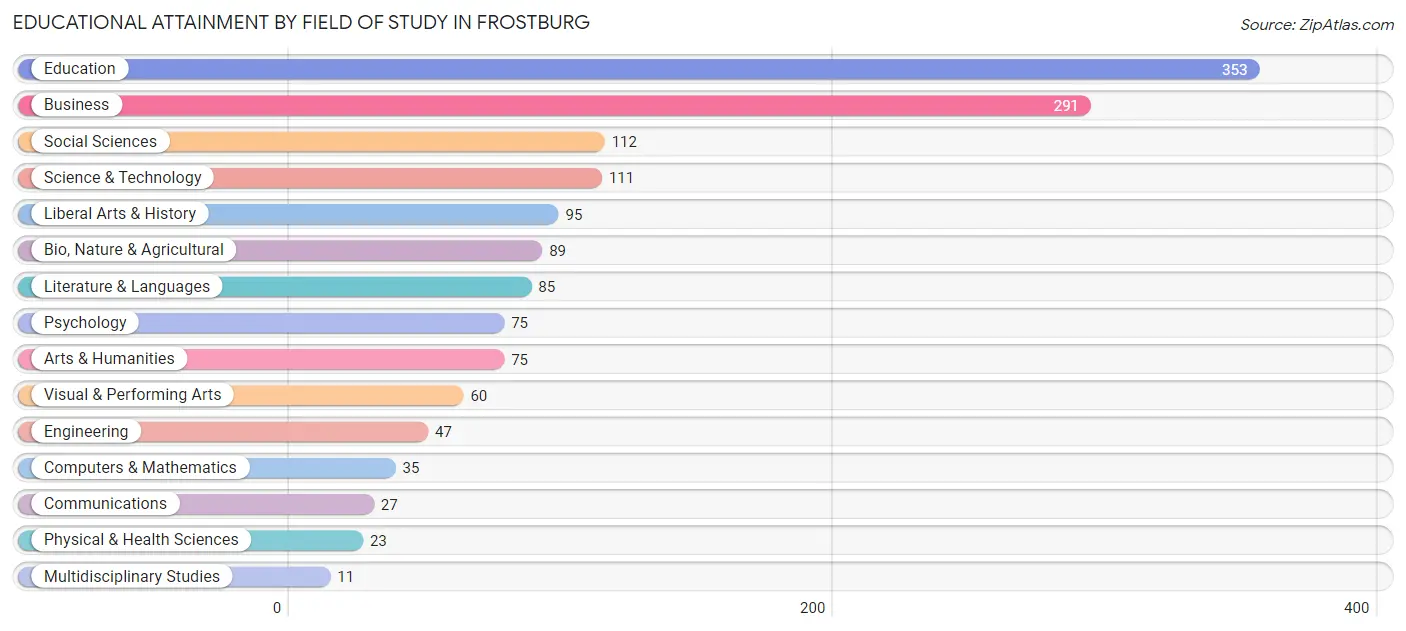
| Field of Study | # Graduates | % Graduates |
| Computers & Mathematics | 35 | 2.4% |
| Bio, Nature & Agricultural | 89 | 6.0% |
| Physical & Health Sciences | 23 | 1.5% |
| Psychology | 75 | 5.0% |
| Social Sciences | 112 | 7.5% |
| Engineering | 47 | 3.2% |
| Multidisciplinary Studies | 11 | 0.7% |
| Science & Technology | 111 | 7.4% |
| Business | 291 | 19.5% |
| Education | 353 | 23.7% |
| Literature & Languages | 85 | 5.7% |
| Liberal Arts & History | 95 | 6.4% |
| Visual & Performing Arts | 60 | 4.0% |
| Communications | 27 | 1.8% |
| Arts & Humanities | 75 | 5.0% |
| Total | 1,489 | 100.0% |
Transportation & Commute in Frostburg
Vehicle Availability by Sex in Frostburg
The most prevalent vehicle ownership categories in Frostburg are males with 2 vehicles (409, accounting for 34.5%) and females with 2 vehicles (430, making up 34.3%).
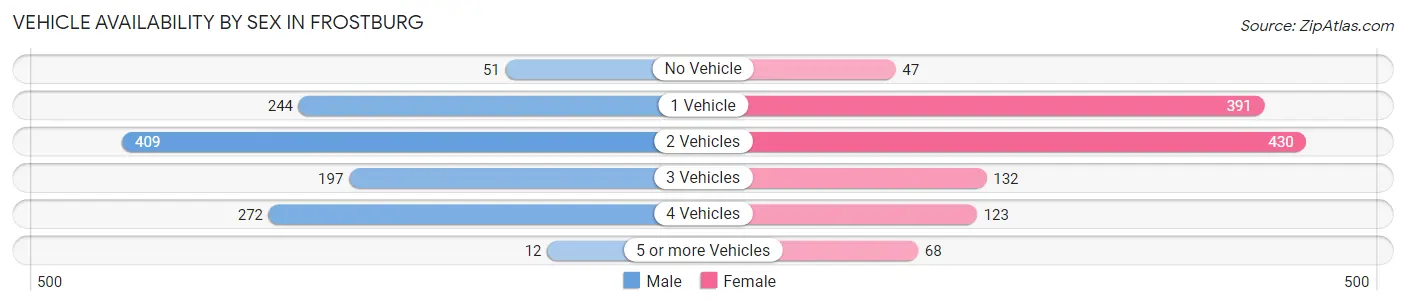
| Vehicles Available | Male | Female |
| No Vehicle | 51 (4.3%) | 47 (4.0%) |
| 1 Vehicle | 244 (20.6%) | 391 (32.8%) |
| 2 Vehicles | 409 (34.5%) | 430 (36.1%) |
| 3 Vehicles | 197 (16.6%) | 132 (11.1%) |
| 4 Vehicles | 272 (23.0%) | 123 (10.3%) |
| 5 or more Vehicles | 12 (1.0%) | 68 (5.7%) |
| Total | 1,185 (100.0%) | 1,191 (100.0%) |
Commute Time in Frostburg
The most frequently occuring commute durations in Frostburg are 5 to 9 minutes (643 commuters, 25.9%), 20 to 24 minutes (470 commuters, 18.9%), and 10 to 14 minutes (395 commuters, 15.9%).
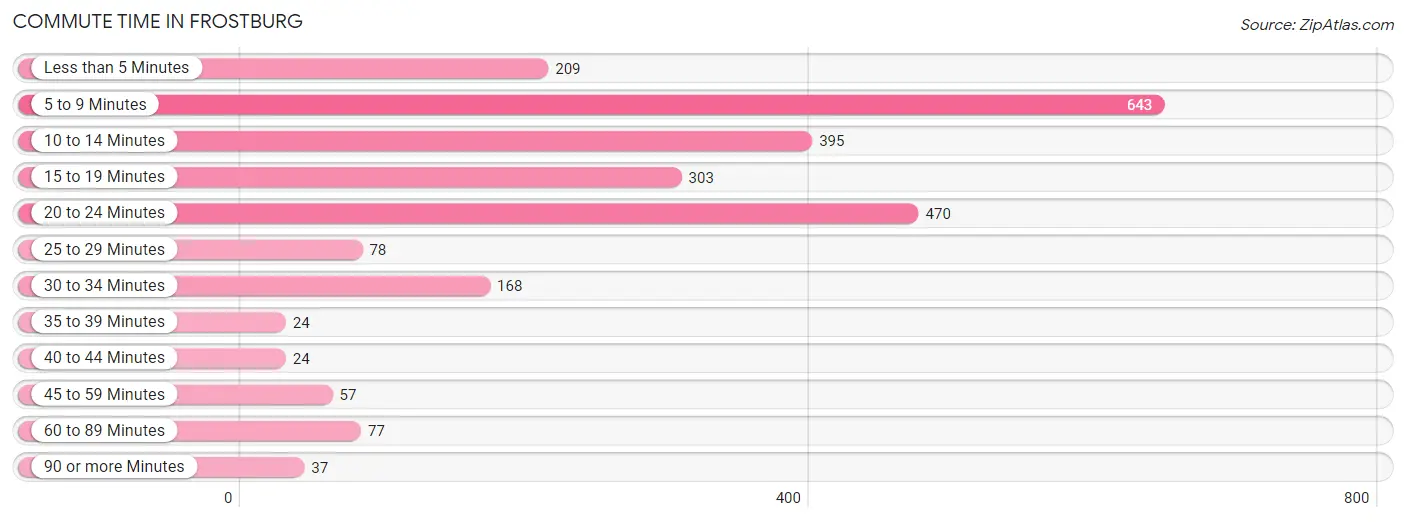
| Commute Time | # Commuters | % Commuters |
| Less than 5 Minutes | 209 | 8.4% |
| 5 to 9 Minutes | 643 | 25.9% |
| 10 to 14 Minutes | 395 | 15.9% |
| 15 to 19 Minutes | 303 | 12.2% |
| 20 to 24 Minutes | 470 | 18.9% |
| 25 to 29 Minutes | 78 | 3.1% |
| 30 to 34 Minutes | 168 | 6.8% |
| 35 to 39 Minutes | 24 | 1.0% |
| 40 to 44 Minutes | 24 | 1.0% |
| 45 to 59 Minutes | 57 | 2.3% |
| 60 to 89 Minutes | 77 | 3.1% |
| 90 or more Minutes | 37 | 1.5% |
Commute Time by Sex in Frostburg
The most common commute times in Frostburg are 5 to 9 minutes (287 commuters, 23.2%) for males and 5 to 9 minutes (356 commuters, 28.5%) for females.
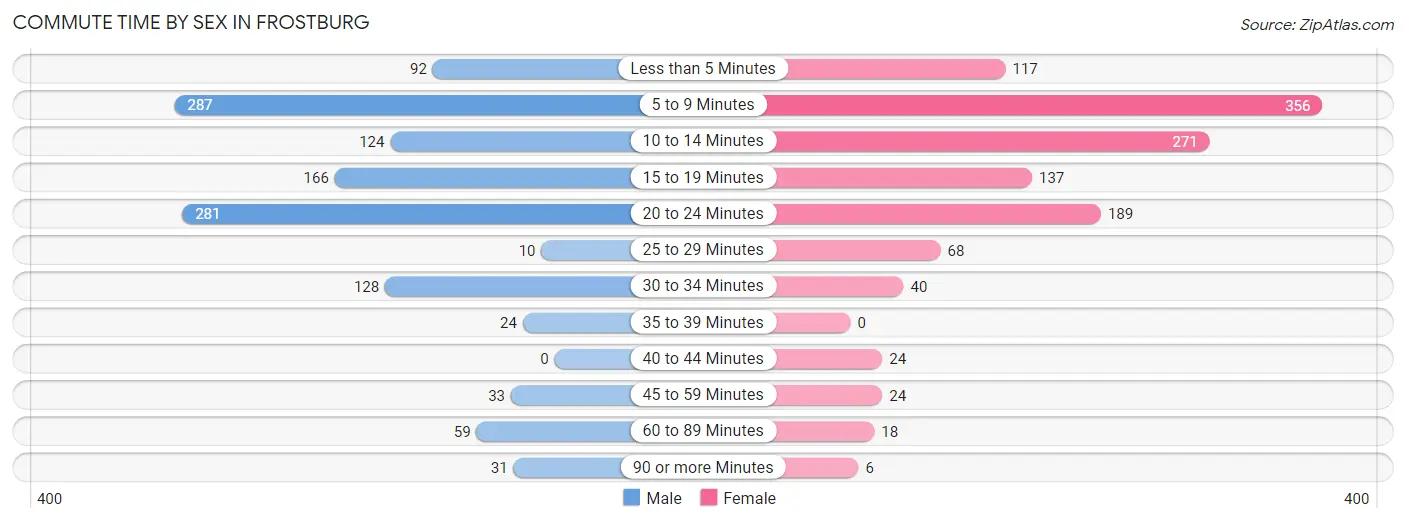
| Commute Time | Male | Female |
| Less than 5 Minutes | 92 (7.4%) | 117 (9.4%) |
| 5 to 9 Minutes | 287 (23.2%) | 356 (28.5%) |
| 10 to 14 Minutes | 124 (10.0%) | 271 (21.7%) |
| 15 to 19 Minutes | 166 (13.4%) | 137 (11.0%) |
| 20 to 24 Minutes | 281 (22.8%) | 189 (15.1%) |
| 25 to 29 Minutes | 10 (0.8%) | 68 (5.4%) |
| 30 to 34 Minutes | 128 (10.4%) | 40 (3.2%) |
| 35 to 39 Minutes | 24 (1.9%) | 0 (0.0%) |
| 40 to 44 Minutes | 0 (0.0%) | 24 (1.9%) |
| 45 to 59 Minutes | 33 (2.7%) | 24 (1.9%) |
| 60 to 89 Minutes | 59 (4.8%) | 18 (1.4%) |
| 90 or more Minutes | 31 (2.5%) | 6 (0.5%) |
Time of Departure to Work by Sex in Frostburg
The most frequent times of departure to work in Frostburg are 12:00 PM to 3:59 PM (232, 18.8%) for males and 7:30 AM to 7:59 AM (220, 17.6%) for females.
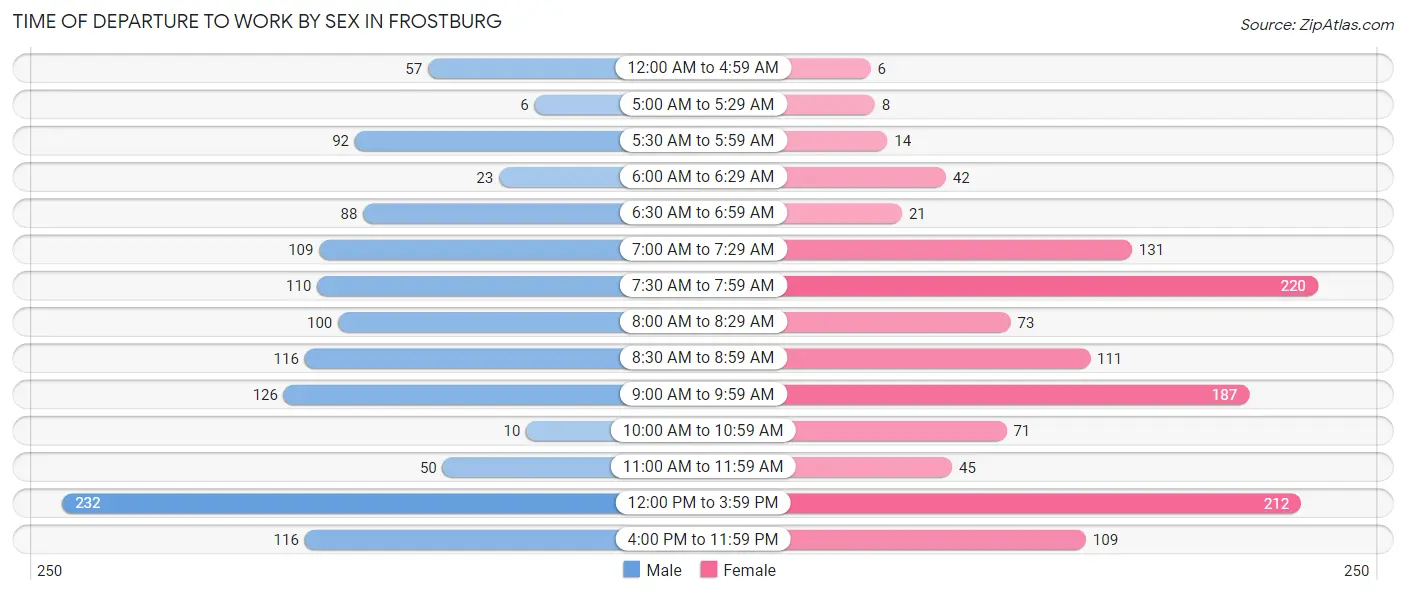
| Time of Departure | Male | Female |
| 12:00 AM to 4:59 AM | 57 (4.6%) | 6 (0.5%) |
| 5:00 AM to 5:29 AM | 6 (0.5%) | 8 (0.6%) |
| 5:30 AM to 5:59 AM | 92 (7.4%) | 14 (1.1%) |
| 6:00 AM to 6:29 AM | 23 (1.9%) | 42 (3.4%) |
| 6:30 AM to 6:59 AM | 88 (7.1%) | 21 (1.7%) |
| 7:00 AM to 7:29 AM | 109 (8.8%) | 131 (10.5%) |
| 7:30 AM to 7:59 AM | 110 (8.9%) | 220 (17.6%) |
| 8:00 AM to 8:29 AM | 100 (8.1%) | 73 (5.8%) |
| 8:30 AM to 8:59 AM | 116 (9.4%) | 111 (8.9%) |
| 9:00 AM to 9:59 AM | 126 (10.2%) | 187 (15.0%) |
| 10:00 AM to 10:59 AM | 10 (0.8%) | 71 (5.7%) |
| 11:00 AM to 11:59 AM | 50 (4.1%) | 45 (3.6%) |
| 12:00 PM to 3:59 PM | 232 (18.8%) | 212 (17.0%) |
| 4:00 PM to 11:59 PM | 116 (9.4%) | 109 (8.7%) |
| Total | 1,235 (100.0%) | 1,250 (100.0%) |
Housing Occupancy in Frostburg
Occupancy by Ownership in Frostburg
Of the total 2,538 dwellings in Frostburg, owner-occupied units account for 1,289 (50.8%), while renter-occupied units make up 1,249 (49.2%).
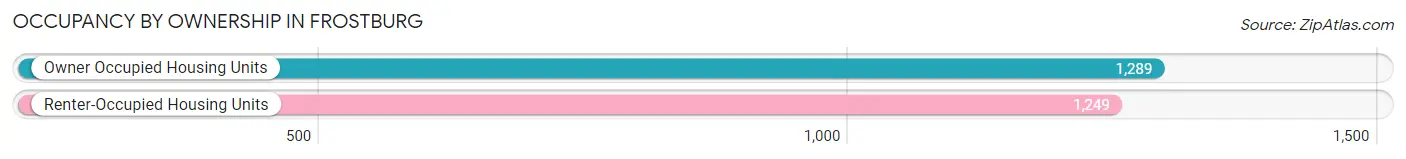
| Occupancy | # Housing Units | % Housing Units |
| Owner Occupied Housing Units | 1,289 | 50.8% |
| Renter-Occupied Housing Units | 1,249 | 49.2% |
| Total Occupied Housing Units | 2,538 | 100.0% |
Occupancy by Household Size in Frostburg
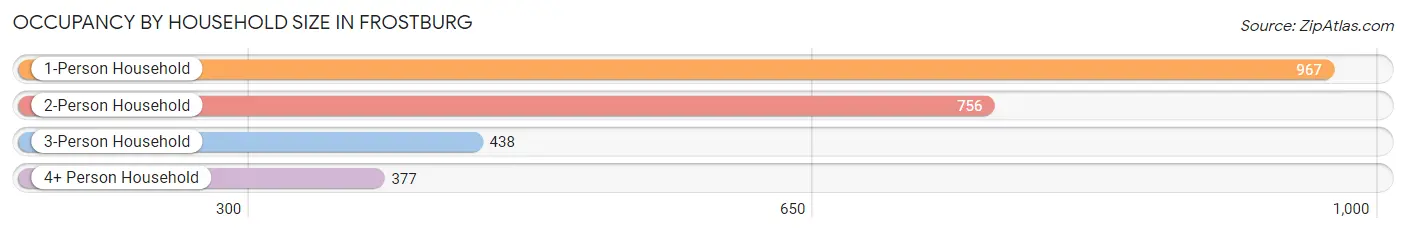
| Household Size | # Housing Units | % Housing Units |
| 1-Person Household | 967 | 38.1% |
| 2-Person Household | 756 | 29.8% |
| 3-Person Household | 438 | 17.3% |
| 4+ Person Household | 377 | 14.8% |
| Total Housing Units | 2,538 | 100.0% |
Occupancy by Ownership by Household Size in Frostburg
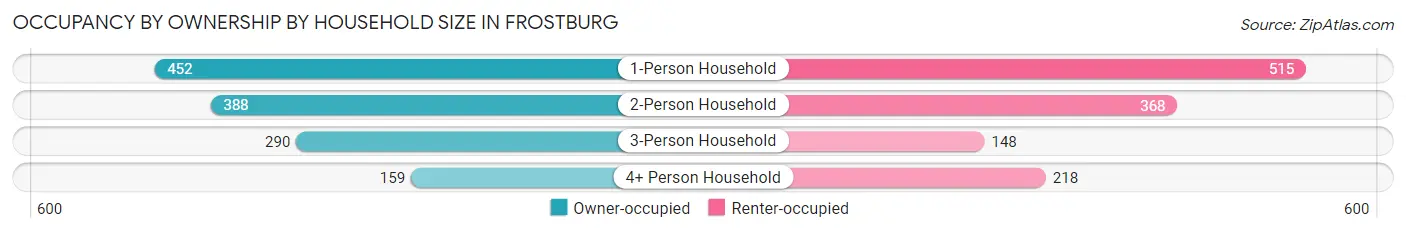
| Household Size | Owner-occupied | Renter-occupied |
| 1-Person Household | 452 (46.7%) | 515 (53.3%) |
| 2-Person Household | 388 (51.3%) | 368 (48.7%) |
| 3-Person Household | 290 (66.2%) | 148 (33.8%) |
| 4+ Person Household | 159 (42.2%) | 218 (57.8%) |
| Total Housing Units | 1,289 (50.8%) | 1,249 (49.2%) |
Occupancy by Educational Attainment in Frostburg
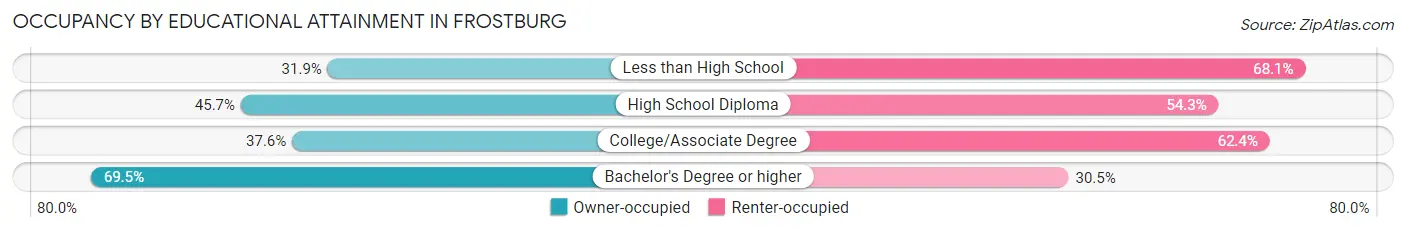
| Household Size | Owner-occupied | Renter-occupied |
| Less than High School | 38 (31.9%) | 81 (68.1%) |
| High School Diploma | 271 (45.7%) | 322 (54.3%) |
| College/Associate Degree | 340 (37.6%) | 565 (62.4%) |
| Bachelor's Degree or higher | 640 (69.5%) | 281 (30.5%) |
Occupancy by Age of Householder in Frostburg
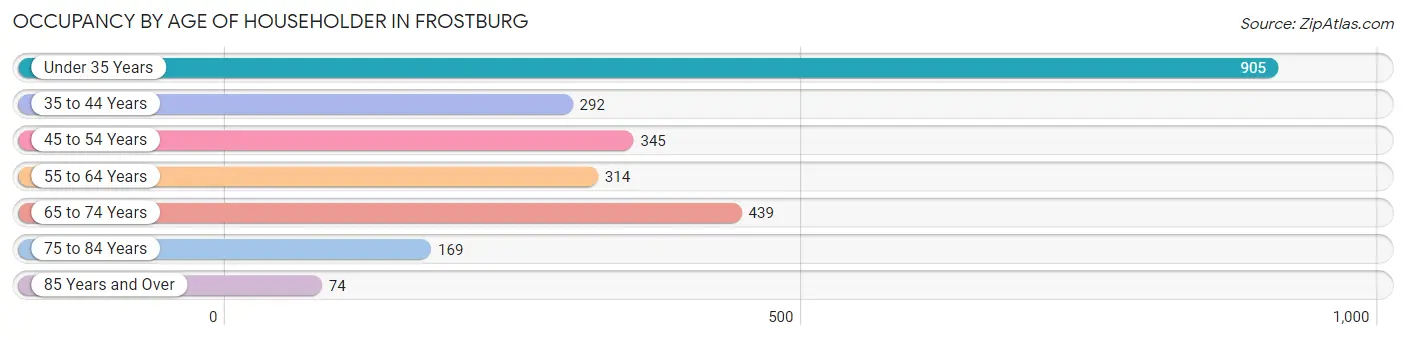
| Age Bracket | # Households | % Households |
| Under 35 Years | 905 | 35.7% |
| 35 to 44 Years | 292 | 11.5% |
| 45 to 54 Years | 345 | 13.6% |
| 55 to 64 Years | 314 | 12.4% |
| 65 to 74 Years | 439 | 17.3% |
| 75 to 84 Years | 169 | 6.7% |
| 85 Years and Over | 74 | 2.9% |
| Total | 2,538 | 100.0% |
Housing Finances in Frostburg
Median Income by Occupancy in Frostburg
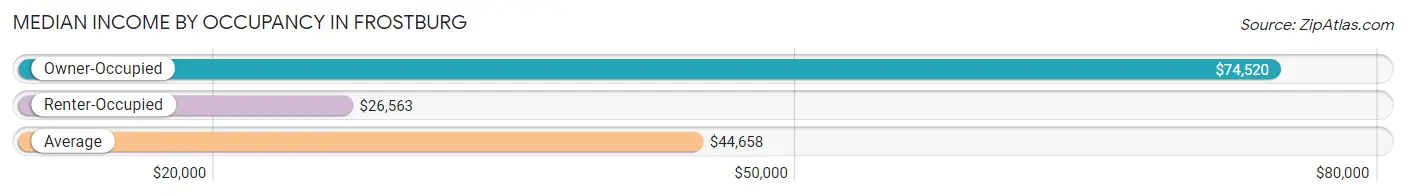
| Occupancy Type | # Households | Median Income |
| Owner-Occupied | 1,289 (50.8%) | $74,520 |
| Renter-Occupied | 1,249 (49.2%) | $26,563 |
| Average | 2,538 (100.0%) | $44,658 |
Occupancy by Householder Income Bracket in Frostburg
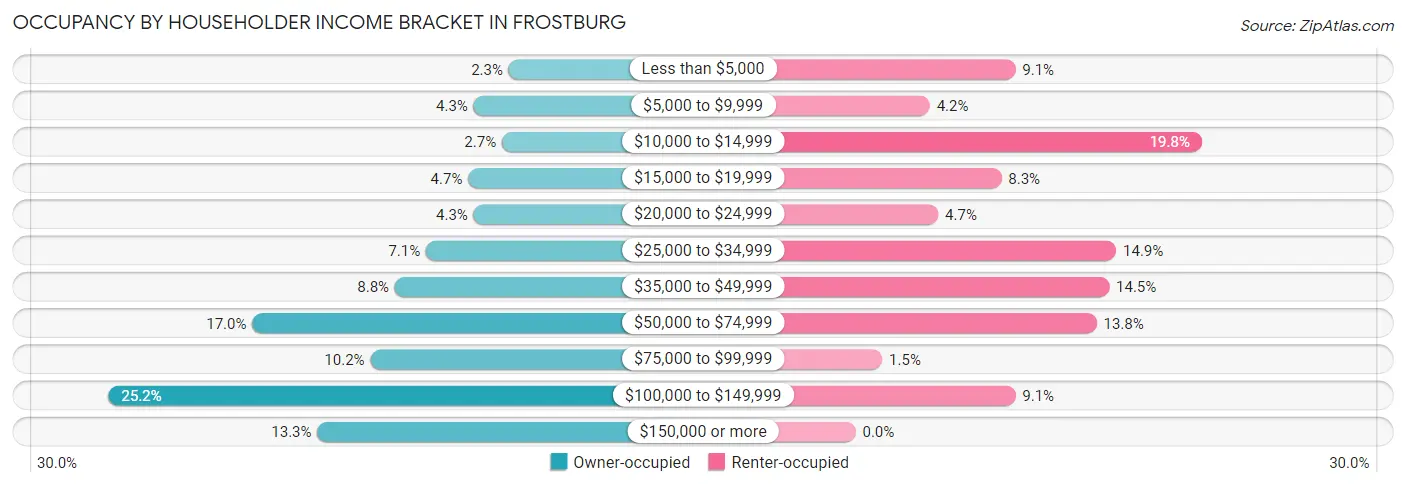
| Income Bracket | Owner-occupied | Renter-occupied |
| Less than $5,000 | 30 (2.3%) | 114 (9.1%) |
| $5,000 to $9,999 | 56 (4.3%) | 53 (4.2%) |
| $10,000 to $14,999 | 35 (2.7%) | 247 (19.8%) |
| $15,000 to $19,999 | 60 (4.6%) | 104 (8.3%) |
| $20,000 to $24,999 | 56 (4.3%) | 59 (4.7%) |
| $25,000 to $34,999 | 91 (7.1%) | 186 (14.9%) |
| $35,000 to $49,999 | 114 (8.8%) | 181 (14.5%) |
| $50,000 to $74,999 | 219 (17.0%) | 172 (13.8%) |
| $75,000 to $99,999 | 132 (10.2%) | 19 (1.5%) |
| $100,000 to $149,999 | 325 (25.2%) | 114 (9.1%) |
| $150,000 or more | 171 (13.3%) | 0 (0.0%) |
| Total | 1,289 (100.0%) | 1,249 (100.0%) |
Monthly Housing Cost Tiers in Frostburg
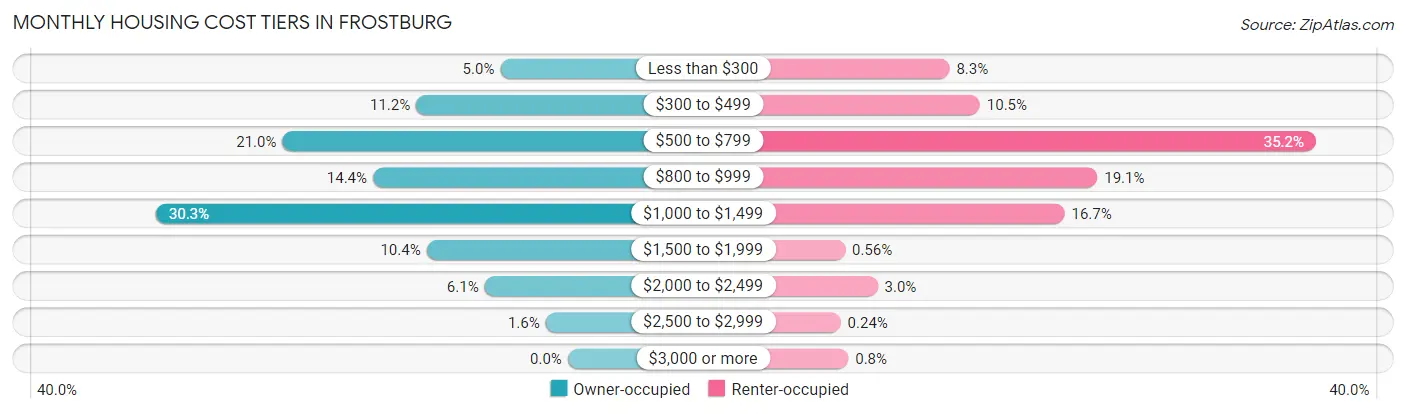
| Monthly Cost | Owner-occupied | Renter-occupied |
| Less than $300 | 64 (5.0%) | 103 (8.3%) |
| $300 to $499 | 144 (11.2%) | 131 (10.5%) |
| $500 to $799 | 271 (21.0%) | 440 (35.2%) |
| $800 to $999 | 185 (14.3%) | 239 (19.1%) |
| $1,000 to $1,499 | 391 (30.3%) | 209 (16.7%) |
| $1,500 to $1,999 | 134 (10.4%) | 7 (0.6%) |
| $2,000 to $2,499 | 79 (6.1%) | 37 (3.0%) |
| $2,500 to $2,999 | 21 (1.6%) | 3 (0.2%) |
| $3,000 or more | 0 (0.0%) | 10 (0.8%) |
| Total | 1,289 (100.0%) | 1,249 (100.0%) |
Physical Housing Characteristics in Frostburg
Housing Structures in Frostburg
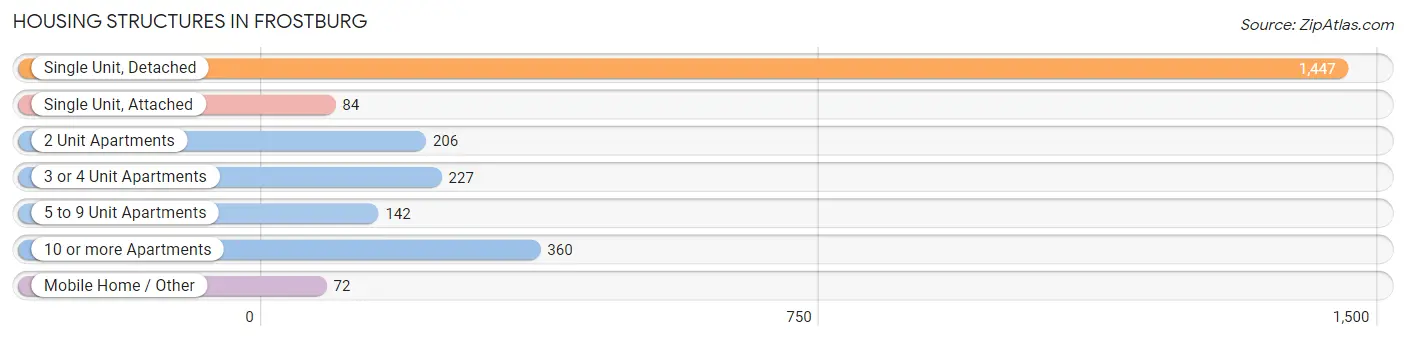
| Structure Type | # Housing Units | % Housing Units |
| Single Unit, Detached | 1,447 | 57.0% |
| Single Unit, Attached | 84 | 3.3% |
| 2 Unit Apartments | 206 | 8.1% |
| 3 or 4 Unit Apartments | 227 | 8.9% |
| 5 to 9 Unit Apartments | 142 | 5.6% |
| 10 or more Apartments | 360 | 14.2% |
| Mobile Home / Other | 72 | 2.8% |
| Total | 2,538 | 100.0% |
Housing Structures by Occupancy in Frostburg
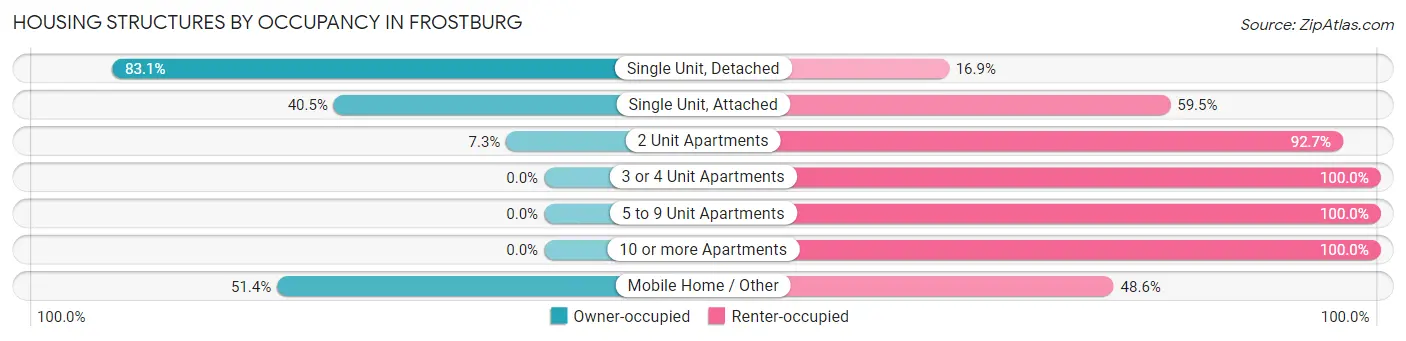
| Structure Type | Owner-occupied | Renter-occupied |
| Single Unit, Detached | 1,203 (83.1%) | 244 (16.9%) |
| Single Unit, Attached | 34 (40.5%) | 50 (59.5%) |
| 2 Unit Apartments | 15 (7.3%) | 191 (92.7%) |
| 3 or 4 Unit Apartments | 0 (0.0%) | 227 (100.0%) |
| 5 to 9 Unit Apartments | 0 (0.0%) | 142 (100.0%) |
| 10 or more Apartments | 0 (0.0%) | 360 (100.0%) |
| Mobile Home / Other | 37 (51.4%) | 35 (48.6%) |
| Total | 1,289 (50.8%) | 1,249 (49.2%) |
Housing Structures by Number of Rooms in Frostburg
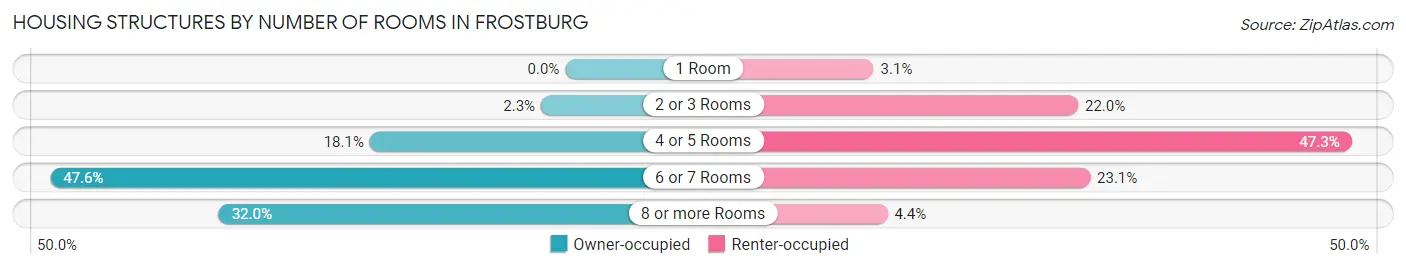
| Number of Rooms | Owner-occupied | Renter-occupied |
| 1 Room | 0 (0.0%) | 39 (3.1%) |
| 2 or 3 Rooms | 29 (2.2%) | 275 (22.0%) |
| 4 or 5 Rooms | 233 (18.1%) | 591 (47.3%) |
| 6 or 7 Rooms | 614 (47.6%) | 289 (23.1%) |
| 8 or more Rooms | 413 (32.0%) | 55 (4.4%) |
| Total | 1,289 (100.0%) | 1,249 (100.0%) |
Housing Structure by Heating Type in Frostburg
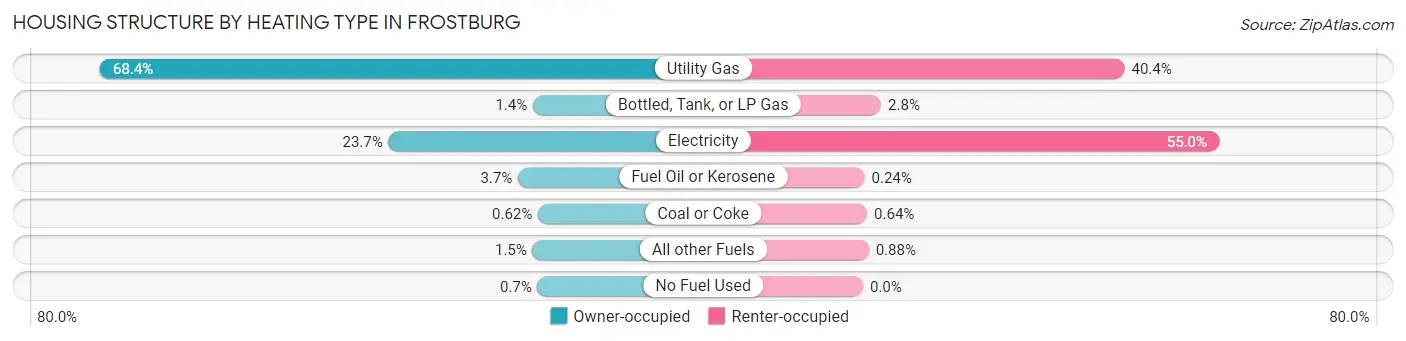
| Heating Type | Owner-occupied | Renter-occupied |
| Utility Gas | 881 (68.3%) | 505 (40.4%) |
| Bottled, Tank, or LP Gas | 18 (1.4%) | 35 (2.8%) |
| Electricity | 306 (23.7%) | 687 (55.0%) |
| Fuel Oil or Kerosene | 48 (3.7%) | 3 (0.2%) |
| Coal or Coke | 8 (0.6%) | 8 (0.6%) |
| All other Fuels | 19 (1.5%) | 11 (0.9%) |
| No Fuel Used | 9 (0.7%) | 0 (0.0%) |
| Total | 1,289 (100.0%) | 1,249 (100.0%) |
Household Vehicle Usage in Frostburg
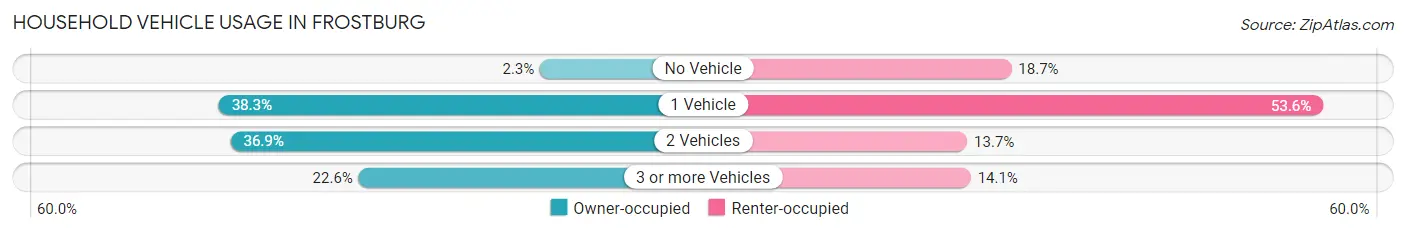
| Vehicles per Household | Owner-occupied | Renter-occupied |
| No Vehicle | 29 (2.2%) | 233 (18.6%) |
| 1 Vehicle | 493 (38.3%) | 669 (53.6%) |
| 2 Vehicles | 476 (36.9%) | 171 (13.7%) |
| 3 or more Vehicles | 291 (22.6%) | 176 (14.1%) |
| Total | 1,289 (100.0%) | 1,249 (100.0%) |
Real Estate & Mortgages in Frostburg
Real Estate and Mortgage Overview in Frostburg
| Characteristic | Without Mortgage | With Mortgage |
| Housing Units | 414 | 875 |
| Median Property Value | $124,200 | $159,800 |
| Median Household Income | $59,375 | $133 |
| Monthly Housing Costs | $499 | $0 |
| Real Estate Taxes | $1,836 | $15 |
Property Value by Mortgage Status in Frostburg
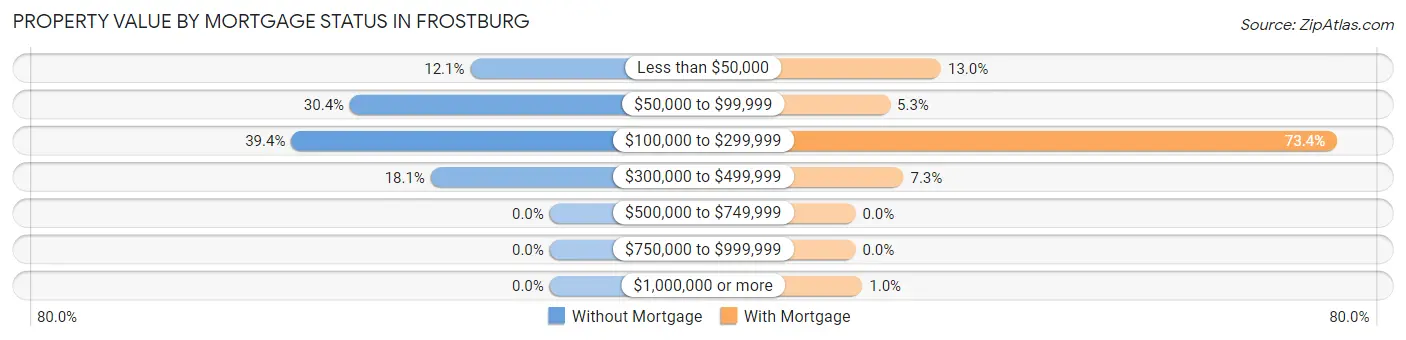
| Property Value | Without Mortgage | With Mortgage |
| Less than $50,000 | 50 (12.1%) | 114 (13.0%) |
| $50,000 to $99,999 | 126 (30.4%) | 46 (5.3%) |
| $100,000 to $299,999 | 163 (39.4%) | 642 (73.4%) |
| $300,000 to $499,999 | 75 (18.1%) | 64 (7.3%) |
| $500,000 to $749,999 | 0 (0.0%) | 0 (0.0%) |
| $750,000 to $999,999 | 0 (0.0%) | 0 (0.0%) |
| $1,000,000 or more | 0 (0.0%) | 9 (1.0%) |
| Total | 414 (100.0%) | 875 (100.0%) |
Household Income by Mortgage Status in Frostburg
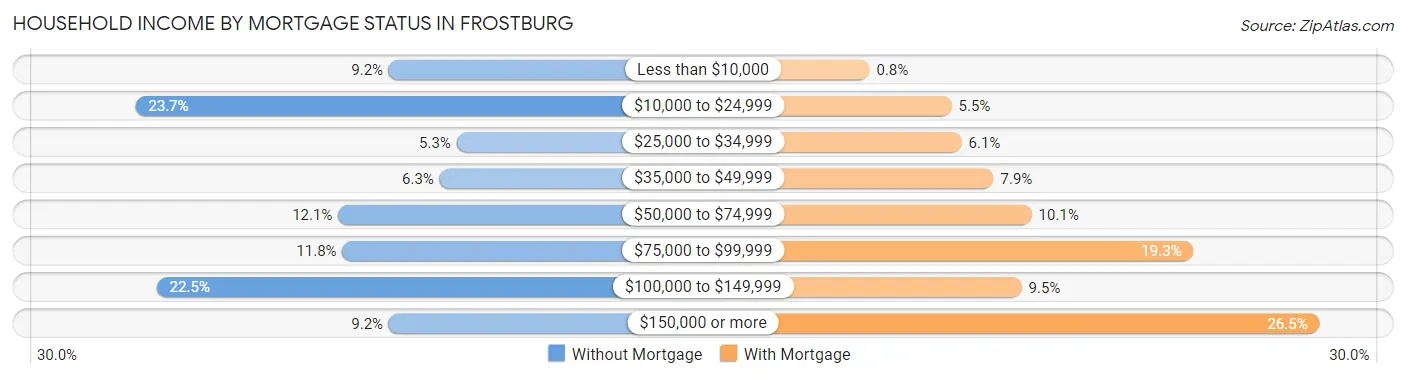
| Household Income | Without Mortgage | With Mortgage |
| Less than $10,000 | 38 (9.2%) | 7 (0.8%) |
| $10,000 to $24,999 | 98 (23.7%) | 48 (5.5%) |
| $25,000 to $34,999 | 22 (5.3%) | 53 (6.1%) |
| $35,000 to $49,999 | 26 (6.3%) | 69 (7.9%) |
| $50,000 to $74,999 | 50 (12.1%) | 88 (10.1%) |
| $75,000 to $99,999 | 49 (11.8%) | 169 (19.3%) |
| $100,000 to $149,999 | 93 (22.5%) | 83 (9.5%) |
| $150,000 or more | 38 (9.2%) | 232 (26.5%) |
| Total | 414 (100.0%) | 875 (100.0%) |
Property Value to Household Income Ratio in Frostburg
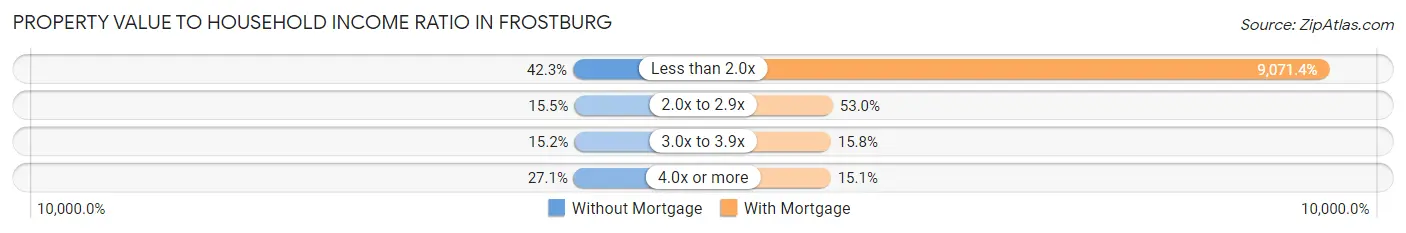
| Value-to-Income Ratio | Without Mortgage | With Mortgage |
| Less than 2.0x | 175 (42.3%) | 79,375 (9,071.4%) |
| 2.0x to 2.9x | 64 (15.5%) | 464 (53.0%) |
| 3.0x to 3.9x | 63 (15.2%) | 138 (15.8%) |
| 4.0x or more | 112 (27.1%) | 132 (15.1%) |
| Total | 414 (100.0%) | 875 (100.0%) |
Real Estate Taxes by Mortgage Status in Frostburg
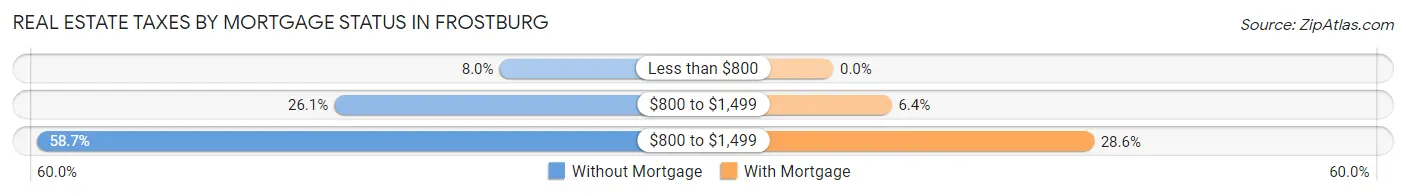
| Property Taxes | Without Mortgage | With Mortgage |
| Less than $800 | 33 (8.0%) | 0 (0.0%) |
| $800 to $1,499 | 108 (26.1%) | 56 (6.4%) |
| $800 to $1,499 | 243 (58.7%) | 250 (28.6%) |
| Total | 414 (100.0%) | 875 (100.0%) |
Health & Disability in Frostburg
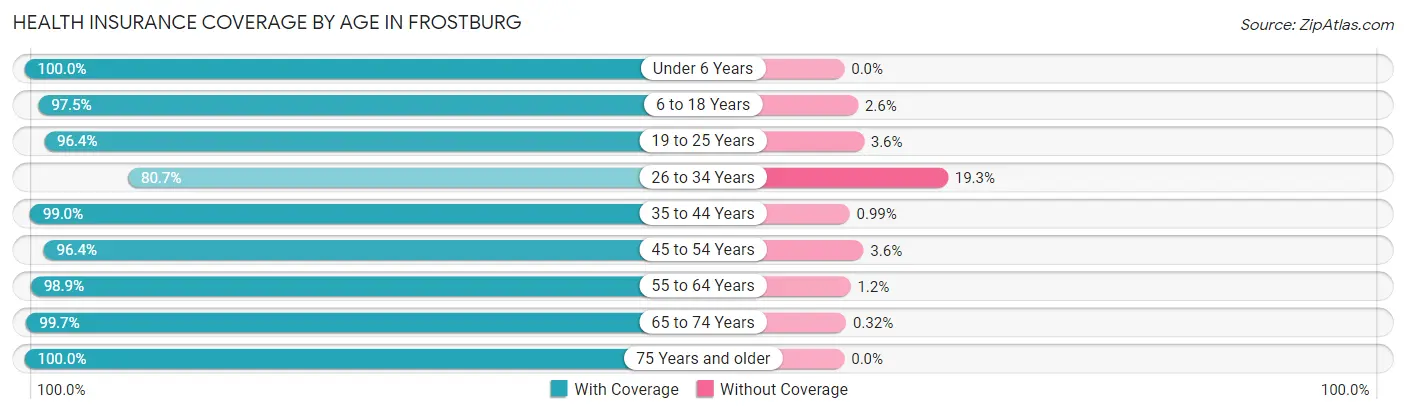
Health Insurance Coverage by Age in Frostburg
| Age Bracket | With Coverage | Without Coverage |
| Under 6 Years | 338 (100.0%) | 0 (0.0%) |
| 6 to 18 Years | 956 (97.5%) | 25 (2.5%) |
| 19 to 25 Years | 2,388 (96.4%) | 90 (3.6%) |
| 26 to 34 Years | 481 (80.7%) | 115 (19.3%) |
| 35 to 44 Years | 501 (99.0%) | 5 (1.0%) |
| 45 to 54 Years | 487 (96.4%) | 18 (3.6%) |
| 55 to 64 Years | 516 (98.9%) | 6 (1.1%) |
| 65 to 74 Years | 620 (99.7%) | 2 (0.3%) |
| 75 Years and older | 293 (100.0%) | 0 (0.0%) |
| Total | 6,580 (96.2%) | 261 (3.8%) |
Health Insurance Coverage by Citizenship Status in Frostburg
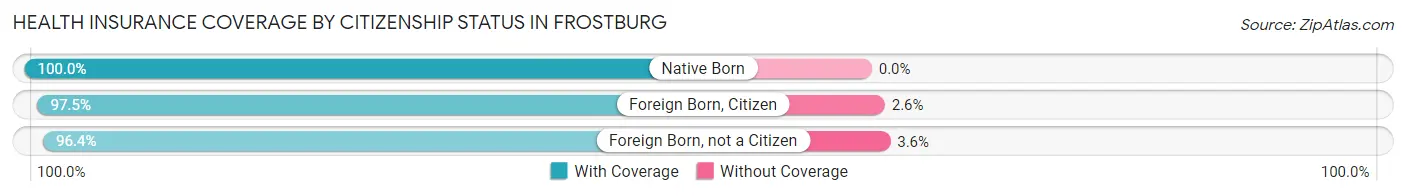
| Citizenship Status | With Coverage | Without Coverage |
| Native Born | 338 (100.0%) | 0 (0.0%) |
| Foreign Born, Citizen | 956 (97.5%) | 25 (2.5%) |
| Foreign Born, not a Citizen | 2,388 (96.4%) | 90 (3.6%) |
Health Insurance Coverage by Household Income in Frostburg
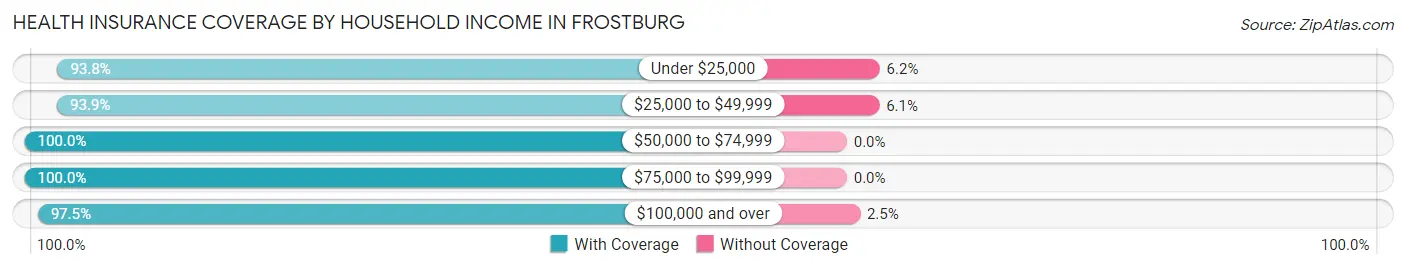
| Household Income | With Coverage | Without Coverage |
| Under $25,000 | 1,372 (93.8%) | 90 (6.2%) |
| $25,000 to $49,999 | 958 (93.9%) | 62 (6.1%) |
| $50,000 to $74,999 | 787 (100.0%) | 0 (0.0%) |
| $75,000 to $99,999 | 382 (100.0%) | 0 (0.0%) |
| $100,000 and over | 1,659 (97.5%) | 42 (2.5%) |
Public vs Private Health Insurance Coverage by Age in Frostburg
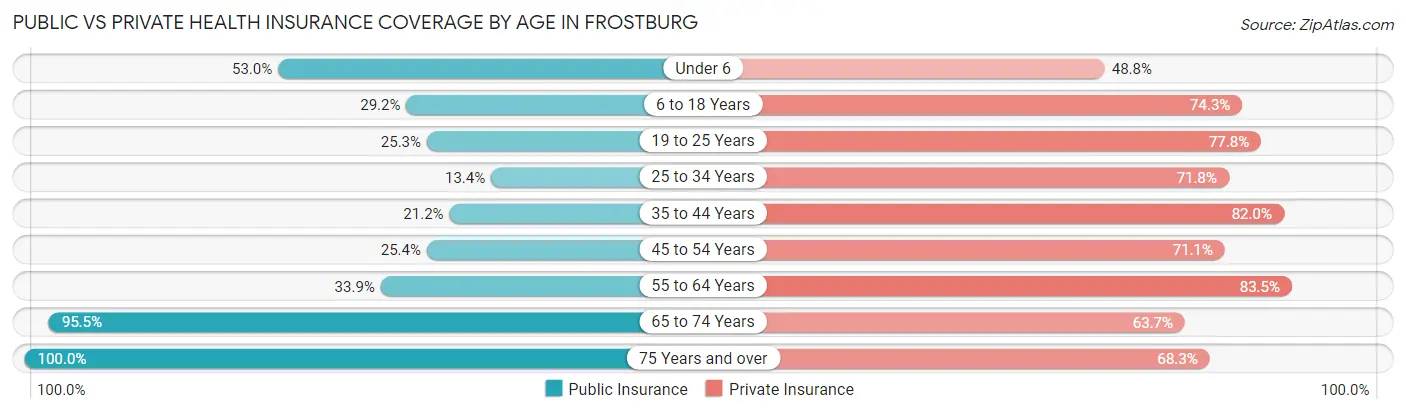
| Age Bracket | Public Insurance | Private Insurance |
| Under 6 | 179 (53.0%) | 165 (48.8%) |
| 6 to 18 Years | 286 (29.1%) | 729 (74.3%) |
| 19 to 25 Years | 628 (25.3%) | 1,928 (77.8%) |
| 25 to 34 Years | 80 (13.4%) | 428 (71.8%) |
| 35 to 44 Years | 107 (21.1%) | 415 (82.0%) |
| 45 to 54 Years | 128 (25.4%) | 359 (71.1%) |
| 55 to 64 Years | 177 (33.9%) | 436 (83.5%) |
| 65 to 74 Years | 594 (95.5%) | 396 (63.7%) |
| 75 Years and over | 293 (100.0%) | 200 (68.3%) |
| Total | 2,472 (36.1%) | 5,056 (73.9%) |
Disability Status by Sex by Age in Frostburg
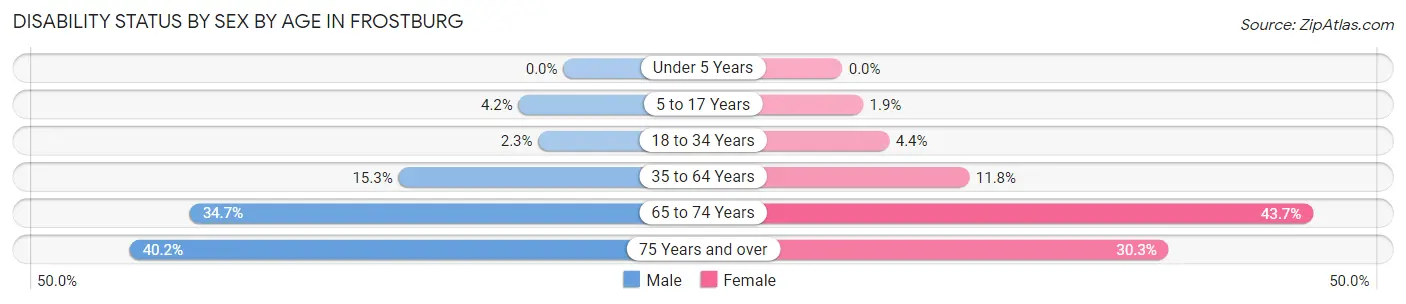
| Age Bracket | Male | Female |
| Under 5 Years | 0 (0.0%) | 0 (0.0%) |
| 5 to 17 Years | 14 (4.2%) | 5 (1.9%) |
| 18 to 34 Years | 38 (2.3%) | 81 (4.4%) |
| 35 to 64 Years | 106 (15.3%) | 99 (11.8%) |
| 65 to 74 Years | 69 (34.7%) | 185 (43.7%) |
| 75 Years and over | 33 (40.2%) | 64 (30.3%) |
Disability Class by Sex by Age in Frostburg
Disability Class: Hearing Difficulty
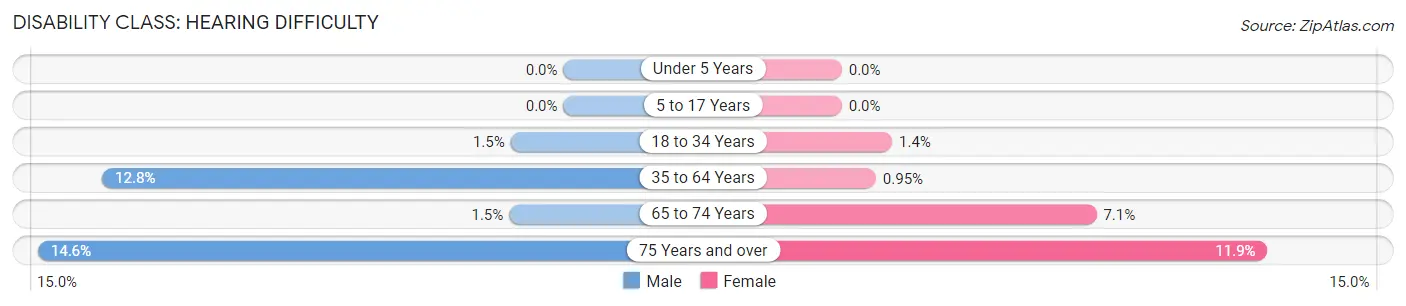
| Age Bracket | Male | Female |
| Under 5 Years | 0 (0.0%) | 0 (0.0%) |
| 5 to 17 Years | 0 (0.0%) | 0 (0.0%) |
| 18 to 34 Years | 24 (1.5%) | 26 (1.4%) |
| 35 to 64 Years | 89 (12.8%) | 8 (0.9%) |
| 65 to 74 Years | 3 (1.5%) | 30 (7.1%) |
| 75 Years and over | 12 (14.6%) | 25 (11.8%) |
Disability Class: Vision Difficulty
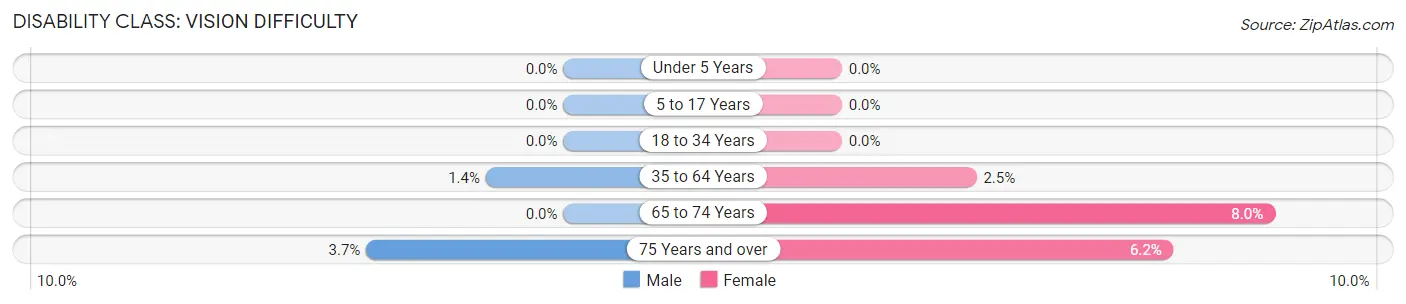
| Age Bracket | Male | Female |
| Under 5 Years | 0 (0.0%) | 0 (0.0%) |
| 5 to 17 Years | 0 (0.0%) | 0 (0.0%) |
| 18 to 34 Years | 0 (0.0%) | 0 (0.0%) |
| 35 to 64 Years | 10 (1.4%) | 21 (2.5%) |
| 65 to 74 Years | 0 (0.0%) | 34 (8.0%) |
| 75 Years and over | 3 (3.7%) | 13 (6.2%) |
Disability Class: Cognitive Difficulty
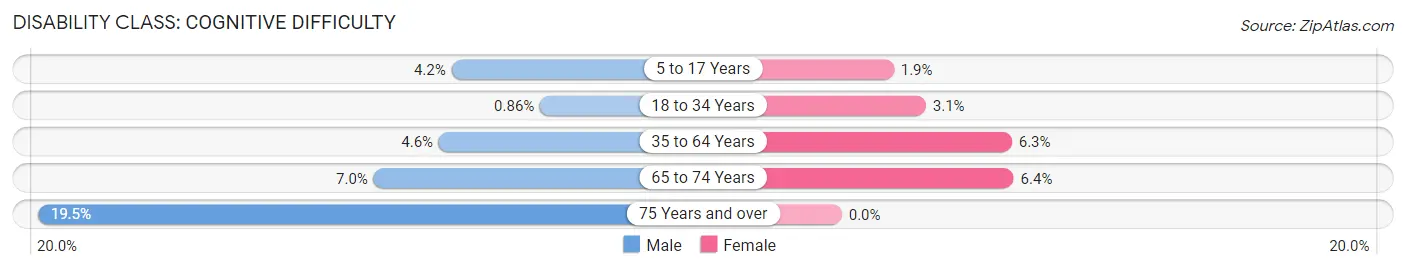
| Age Bracket | Male | Female |
| 5 to 17 Years | 14 (4.2%) | 5 (1.9%) |
| 18 to 34 Years | 14 (0.9%) | 58 (3.1%) |
| 35 to 64 Years | 32 (4.6%) | 53 (6.3%) |
| 65 to 74 Years | 14 (7.0%) | 27 (6.4%) |
| 75 Years and over | 16 (19.5%) | 0 (0.0%) |
Disability Class: Ambulatory Difficulty
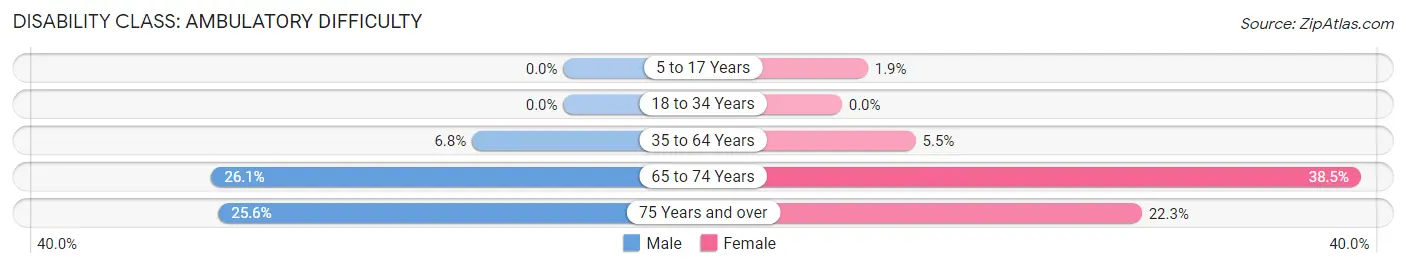
| Age Bracket | Male | Female |
| 5 to 17 Years | 0 (0.0%) | 5 (1.9%) |
| 18 to 34 Years | 0 (0.0%) | 0 (0.0%) |
| 35 to 64 Years | 47 (6.8%) | 46 (5.5%) |
| 65 to 74 Years | 52 (26.1%) | 163 (38.5%) |
| 75 Years and over | 21 (25.6%) | 47 (22.3%) |
Disability Class: Self-Care Difficulty
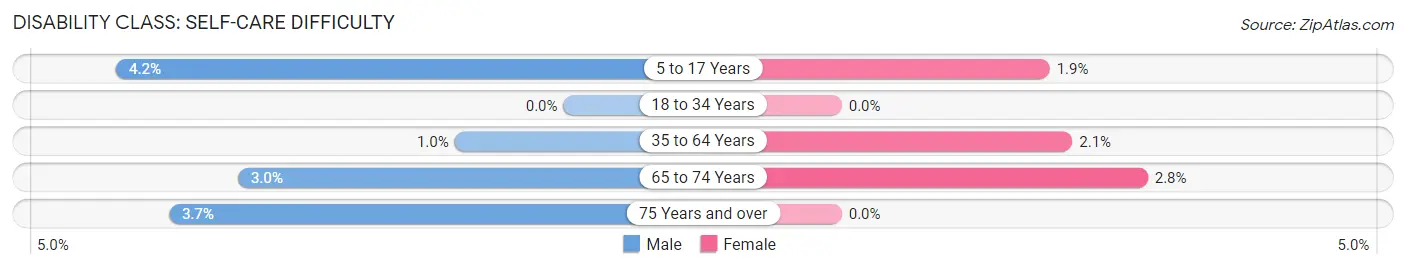
| Age Bracket | Male | Female |
| 5 to 17 Years | 14 (4.2%) | 5 (1.9%) |
| 18 to 34 Years | 0 (0.0%) | 0 (0.0%) |
| 35 to 64 Years | 7 (1.0%) | 18 (2.1%) |
| 65 to 74 Years | 6 (3.0%) | 12 (2.8%) |
| 75 Years and over | 3 (3.7%) | 0 (0.0%) |
Technology Access in Frostburg
Computing Device Access in Frostburg
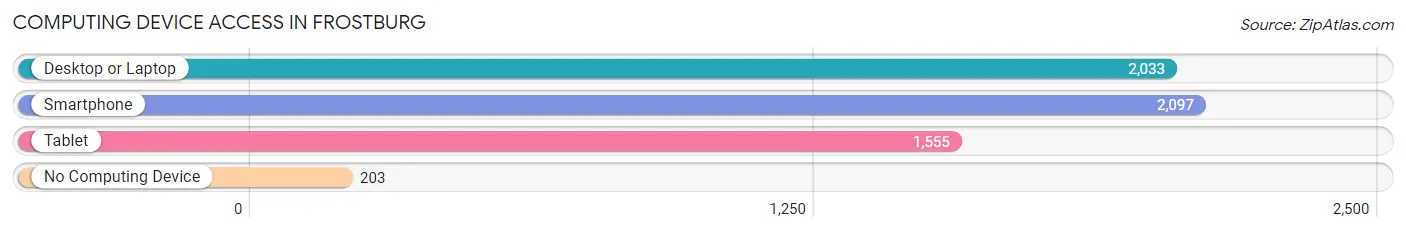
| Device Type | # Households | % Households |
| Desktop or Laptop | 2,033 | 80.1% |
| Smartphone | 2,097 | 82.6% |
| Tablet | 1,555 | 61.3% |
| No Computing Device | 203 | 8.0% |
| Total | 2,538 | 100.0% |
Internet Access in Frostburg
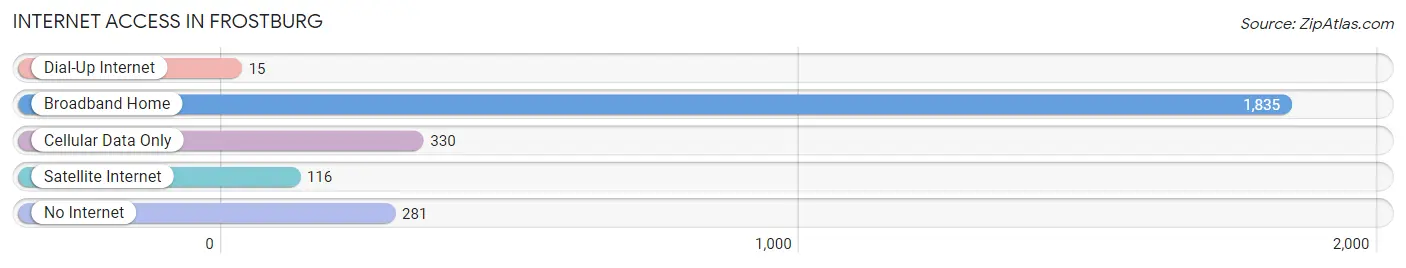
| Internet Type | # Households | % Households |
| Dial-Up Internet | 15 | 0.6% |
| Broadband Home | 1,835 | 72.3% |
| Cellular Data Only | 330 | 13.0% |
| Satellite Internet | 116 | 4.6% |
| No Internet | 281 | 11.1% |
| Total | 2,538 | 100.0% |
Frostburg Summary
Frostburg is a small city located in Allegany County, Maryland. It is situated in the Appalachian Mountains, near the border of West Virginia. The city has a population of approximately 9,000 people and is the second largest city in Allegany County.
History
Frostburg was founded in 1786 by a group of settlers from Pennsylvania. The town was named after the Frost family, who were among the first settlers. The town was originally a farming community, but in the early 19th century, the discovery of coal in the area led to the development of the coal mining industry. The coal industry was the main source of employment for the town until the mid-20th century.
In the late 19th century, the town began to develop as a tourist destination. The town was home to several resorts, including the Mountain Lake Hotel, which was built in 1891. The hotel was a popular destination for wealthy tourists from the East Coast.
In the early 20th century, the town began to develop as an industrial center. The Frostburg Manufacturing Company was established in 1910 and produced a variety of products, including furniture, clothing, and textiles. The company was the largest employer in the town until it closed in the 1970s.
Geography
Frostburg is located in the Appalachian Mountains, near the border of West Virginia. The city is situated at an elevation of 1,890 feet above sea level. The city is surrounded by mountains and is located in a valley. The city is located near the Potomac River and is approximately 70 miles from Washington, D.C.
The climate in Frostburg is classified as humid continental. The average temperature in the summer is around 75 degrees Fahrenheit and the average temperature in the winter is around 30 degrees Fahrenheit. The city receives an average of 40 inches of precipitation per year.
Economy
Frostburg’s economy is largely based on tourism and education. The city is home to Frostburg State University, which is a public university with an enrollment of approximately 5,000 students. The university is the largest employer in the city and provides a significant economic boost to the local economy.
The city is also home to several tourist attractions, including the Mountain Lake Hotel, which is a historic hotel that was built in 1891. The hotel is a popular destination for tourists from the East Coast.
The city is also home to several small businesses, including restaurants, retail stores, and art galleries. The city is also home to several manufacturing companies, including the Frostburg Manufacturing Company, which produces a variety of products, including furniture, clothing, and textiles.
Demographics
As of the 2010 census, the population of Frostburg was 8,734. The racial makeup of the city was 90.3% White, 5.2% African American, 0.3% Native American, 1.2% Asian, 0.1% Pacific Islander, and 2.9% from other races. The median household income in Frostburg was $35,945, and the median family income was $45,945. The per capita income in Frostburg was $19,945.
Common Questions
What is Per Capita Income in Frostburg?
Per Capita income in Frostburg is $24,402.
What is the Median Family Income in Frostburg?
Median Family Income in Frostburg is $71,382.
What is the Median Household income in Frostburg?
Median Household Income in Frostburg is $44,658.
What is Income or Wage Gap in Frostburg?
Income or Wage Gap in Frostburg is 21.8%.
Women in Frostburg earn 78.2 cents for every dollar earned by a man.
What is Inequality or Gini Index in Frostburg?
Inequality or Gini Index in Frostburg is 0.50.
What is the Total Population of Frostburg?
Total Population of Frostburg is 7,118.
What is the Total Male Population of Frostburg?
Total Male Population of Frostburg is 3,190.
What is the Total Female Population of Frostburg?
Total Female Population of Frostburg is 3,928.
What is the Ratio of Males per 100 Females in Frostburg?
There are 81.21 Males per 100 Females in Frostburg.
What is the Ratio of Females per 100 Males in Frostburg?
There are 123.13 Females per 100 Males in Frostburg.
What is the Median Population Age in Frostburg?
Median Population Age in Frostburg is 24.2 Years.
What is the Average Family Size in Frostburg
Average Family Size in Frostburg is 2.7 People.
What is the Average Household Size in Frostburg
Average Household Size in Frostburg is 2.1 People.
How Large is the Labor Force in Frostburg?
There are 3,042 People in the Labor Forcein in Frostburg.
What is the Percentage of People in the Labor Force in Frostburg?
48.2% of People are in the Labor Force in Frostburg.
What is the Unemployment Rate in Frostburg?
Unemployment Rate in Frostburg is 7.3%.