South American Indian vs Immigrants from Bahamas 1 or more Vehicles in Household
COMPARE
South American Indian
Immigrants from Bahamas
1 or more Vehicles in Household
1 or more Vehicles in Household Comparison
South American Indians
Immigrants from Bahamas
88.0%
1 OR MORE VEHICLES IN HOUSEHOLD
0.9/ 100
METRIC RATING
258th/ 347
METRIC RANK
90.2%
1 OR MORE VEHICLES IN HOUSEHOLD
81.5/ 100
METRIC RATING
143rd/ 347
METRIC RANK
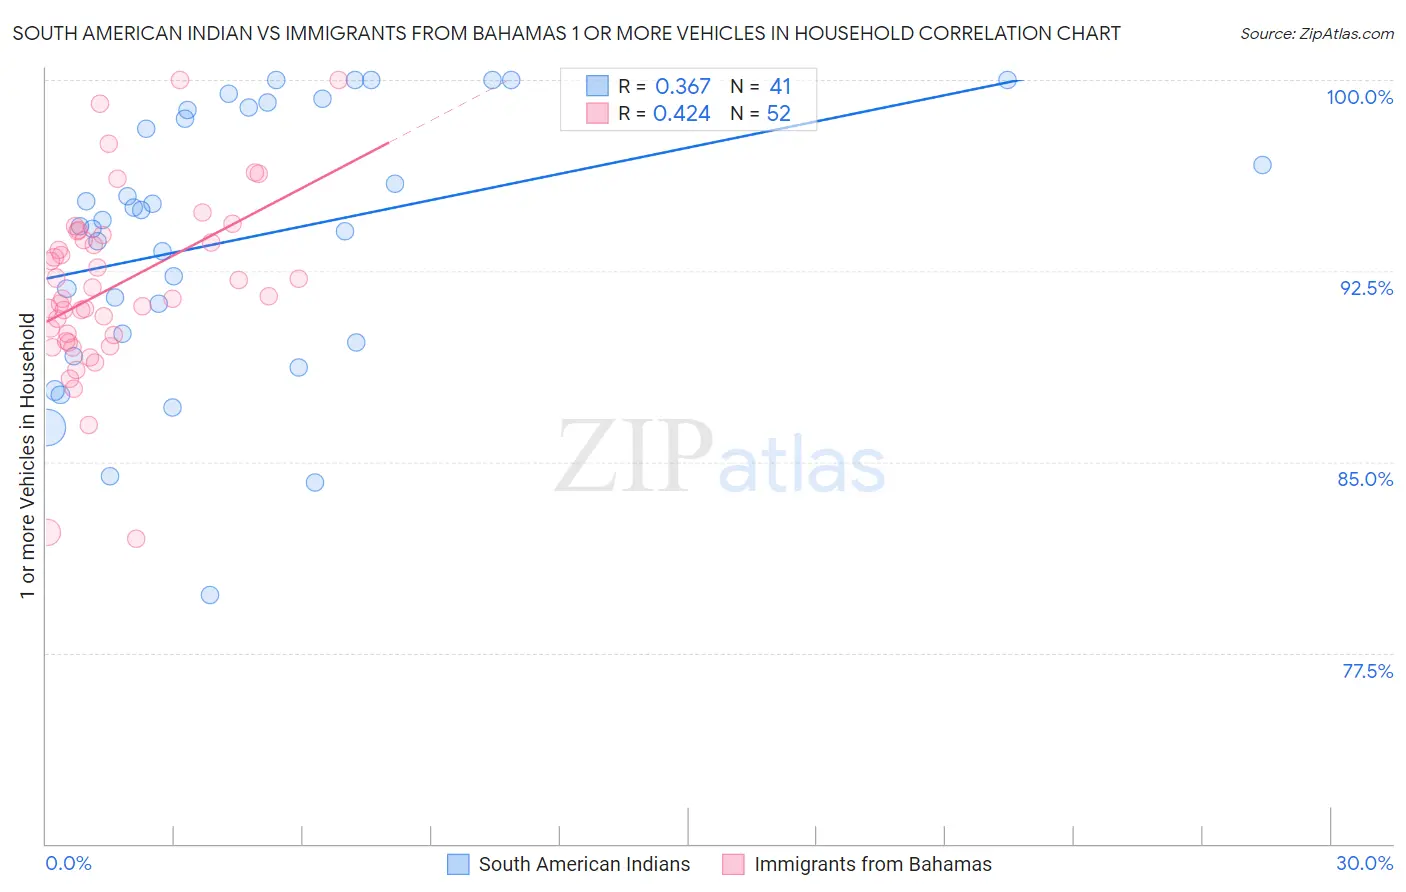
South American Indian vs Immigrants from Bahamas 1 or more Vehicles in Household Correlation Chart
The statistical analysis conducted on geographies consisting of 164,540,397 people shows a mild positive correlation between the proportion of South American Indians and percentage of households with 1 or more vehicles available in the United States with a correlation coefficient (R) of 0.367 and weighted average of 88.0%. Similarly, the statistical analysis conducted on geographies consisting of 104,615,512 people shows a moderate positive correlation between the proportion of Immigrants from Bahamas and percentage of households with 1 or more vehicles available in the United States with a correlation coefficient (R) of 0.424 and weighted average of 90.2%, a difference of 2.5%.
1 or more Vehicles in Household Correlation Summary
| Measurement | South American Indian | Immigrants from Bahamas |
| Minimum | 79.8% | 82.0% |
| Maximum | 100.0% | 100.0% |
| Range | 20.2% | 18.0% |
| Mean | 93.8% | 91.9% |
| Median | 94.5% | 91.5% |
| Interquartile 25% (IQ1) | 89.9% | 89.9% |
| Interquartile 75% (IQ3) | 98.9% | 93.8% |
| Interquartile Range (IQR) | 9.0% | 3.9% |
| Standard Deviation (Sample) | 5.2% | 3.6% |
| Standard Deviation (Population) | 5.1% | 3.5% |
Similar Demographics by 1 or more Vehicles in Household
Demographics Similar to South American Indians by 1 or more Vehicles in Household
In terms of 1 or more vehicles in household, the demographic groups most similar to South American Indians are Liberian (88.0%, a difference of 0.0%), Immigrants from Latvia (88.1%, a difference of 0.010%), Colombian (88.0%, a difference of 0.010%), Nigerian (88.0%, a difference of 0.030%), and Honduran (88.1%, a difference of 0.040%).
| Demographics | Rating | Rank | 1 or more Vehicles in Household |
| Immigrants | Serbia | 1.2 /100 | #251 | Tragic 88.2% |
| Immigrants | Uruguay | 1.1 /100 | #252 | Tragic 88.1% |
| Hondurans | 1.0 /100 | #253 | Tragic 88.1% |
| Haitians | 0.9 /100 | #254 | Tragic 88.1% |
| Immigrants | Latvia | 0.9 /100 | #255 | Tragic 88.1% |
| Colombians | 0.9 /100 | #256 | Tragic 88.0% |
| Liberians | 0.9 /100 | #257 | Tragic 88.0% |
| South American Indians | 0.9 /100 | #258 | Tragic 88.0% |
| Nigerians | 0.8 /100 | #259 | Tragic 88.0% |
| Macedonians | 0.6 /100 | #260 | Tragic 87.9% |
| Immigrants | Switzerland | 0.6 /100 | #261 | Tragic 87.9% |
| Sub-Saharan Africans | 0.5 /100 | #262 | Tragic 87.9% |
| Immigrants | Egypt | 0.5 /100 | #263 | Tragic 87.8% |
| Immigrants | Liberia | 0.4 /100 | #264 | Tragic 87.8% |
| Africans | 0.4 /100 | #265 | Tragic 87.8% |
Demographics Similar to Immigrants from Bahamas by 1 or more Vehicles in Household
In terms of 1 or more vehicles in household, the demographic groups most similar to Immigrants from Bahamas are Immigrants from Zimbabwe (90.2%, a difference of 0.0%), Sioux (90.2%, a difference of 0.010%), Bahamian (90.2%, a difference of 0.030%), Immigrants from Moldova (90.2%, a difference of 0.040%), and Immigrants from Lithuania (90.2%, a difference of 0.040%).
| Demographics | Rating | Rank | 1 or more Vehicles in Household |
| Hungarians | 86.5 /100 | #136 | Excellent 90.3% |
| Latvians | 86.3 /100 | #137 | Excellent 90.3% |
| Syrians | 86.3 /100 | #138 | Excellent 90.3% |
| Estonians | 85.6 /100 | #139 | Excellent 90.3% |
| Sudanese | 85.2 /100 | #140 | Excellent 90.3% |
| Immigrants | Moldova | 83.1 /100 | #141 | Excellent 90.2% |
| Immigrants | Lithuania | 83.0 /100 | #142 | Excellent 90.2% |
| Immigrants | Bahamas | 81.5 /100 | #143 | Excellent 90.2% |
| Immigrants | Zimbabwe | 81.5 /100 | #144 | Excellent 90.2% |
| Sioux | 81.3 /100 | #145 | Excellent 90.2% |
| Bahamians | 80.5 /100 | #146 | Excellent 90.2% |
| Chileans | 79.8 /100 | #147 | Good 90.2% |
| Immigrants | Eastern Africa | 78.2 /100 | #148 | Good 90.1% |
| Immigrants | Nicaragua | 76.7 /100 | #149 | Good 90.1% |
| Immigrants | Micronesia | 75.9 /100 | #150 | Good 90.1% |