Immigrants from Southern Europe vs Immigrants from St. Vincent and the Grenadines 1 or more Vehicles in Household
COMPARE
Immigrants from Southern Europe
Immigrants from St. Vincent and the Grenadines
1 or more Vehicles in Household
1 or more Vehicles in Household Comparison
Immigrants from Southern Europe
Immigrants from St. Vincent and the Grenadines
87.1%
1 OR MORE VEHICLES IN HOUSEHOLD
0.1/ 100
METRIC RATING
278th/ 347
METRIC RANK
64.7%
1 OR MORE VEHICLES IN HOUSEHOLD
0.0/ 100
METRIC RATING
345th/ 347
METRIC RANK
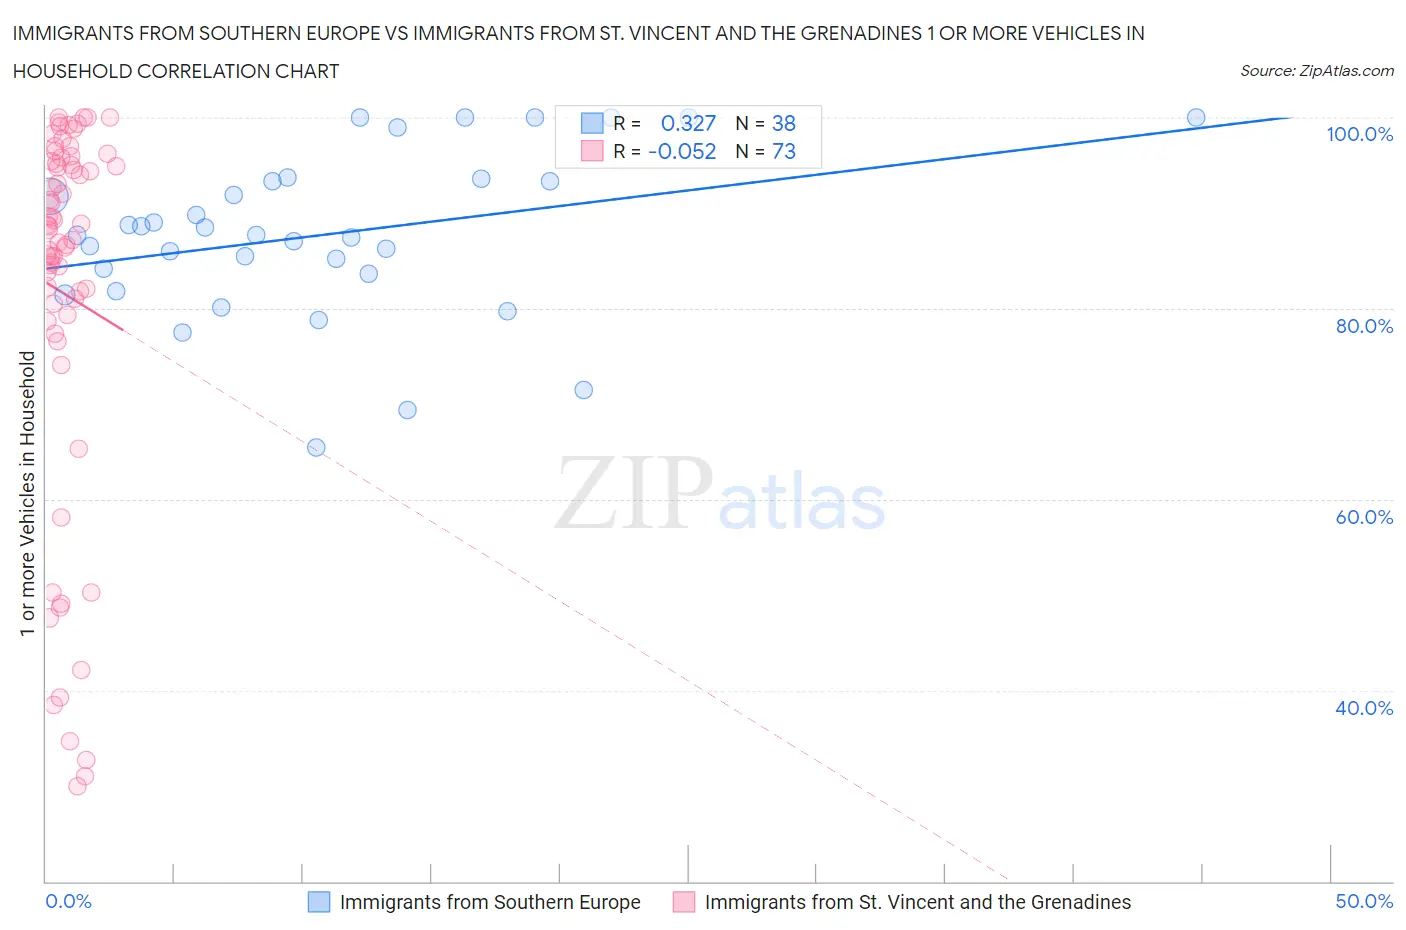
Immigrants from Southern Europe vs Immigrants from St. Vincent and the Grenadines 1 or more Vehicles in Household Correlation Chart
The statistical analysis conducted on geographies consisting of 402,667,102 people shows a mild positive correlation between the proportion of Immigrants from Southern Europe and percentage of households with 1 or more vehicles available in the United States with a correlation coefficient (R) of 0.327 and weighted average of 87.1%. Similarly, the statistical analysis conducted on geographies consisting of 56,188,620 people shows a slight negative correlation between the proportion of Immigrants from St. Vincent and the Grenadines and percentage of households with 1 or more vehicles available in the United States with a correlation coefficient (R) of -0.052 and weighted average of 64.7%, a difference of 34.6%.
1 or more Vehicles in Household Correlation Summary
| Measurement | Immigrants from Southern Europe | Immigrants from St. Vincent and the Grenadines |
| Minimum | 65.4% | 30.0% |
| Maximum | 100.0% | 100.0% |
| Range | 34.6% | 70.0% |
| Mean | 87.7% | 81.5% |
| Median | 87.7% | 88.2% |
| Interquartile 25% (IQ1) | 83.6% | 79.0% |
| Interquartile 75% (IQ3) | 93.4% | 95.2% |
| Interquartile Range (IQR) | 9.8% | 16.2% |
| Standard Deviation (Sample) | 8.6% | 19.9% |
| Standard Deviation (Population) | 8.5% | 19.8% |
Similar Demographics by 1 or more Vehicles in Household
Demographics Similar to Immigrants from Southern Europe by 1 or more Vehicles in Household
In terms of 1 or more vehicles in household, the demographic groups most similar to Immigrants from Southern Europe are Immigrants from Albania (87.1%, a difference of 0.0%), Immigrants from Croatia (87.0%, a difference of 0.030%), Alsatian (87.1%, a difference of 0.040%), Immigrants from France (87.1%, a difference of 0.10%), and Mongolian (87.0%, a difference of 0.10%).
| Demographics | Rating | Rank | 1 or more Vehicles in Household |
| Bermudans | 0.2 /100 | #271 | Tragic 87.5% |
| Aleuts | 0.2 /100 | #272 | Tragic 87.5% |
| Immigrants | Northern Africa | 0.2 /100 | #273 | Tragic 87.4% |
| Immigrants | Morocco | 0.1 /100 | #274 | Tragic 87.4% |
| Immigrants | Singapore | 0.1 /100 | #275 | Tragic 87.2% |
| Immigrants | France | 0.1 /100 | #276 | Tragic 87.1% |
| Alsatians | 0.1 /100 | #277 | Tragic 87.1% |
| Immigrants | Southern Europe | 0.1 /100 | #278 | Tragic 87.1% |
| Immigrants | Albania | 0.1 /100 | #279 | Tragic 87.1% |
| Immigrants | Croatia | 0.0 /100 | #280 | Tragic 87.0% |
| Mongolians | 0.0 /100 | #281 | Tragic 87.0% |
| Colville | 0.0 /100 | #282 | Tragic 86.8% |
| Immigrants | Eastern Europe | 0.0 /100 | #283 | Tragic 86.7% |
| Central American Indians | 0.0 /100 | #284 | Tragic 86.7% |
| Immigrants | Kazakhstan | 0.0 /100 | #285 | Tragic 86.6% |
Demographics Similar to Immigrants from St. Vincent and the Grenadines by 1 or more Vehicles in Household
In terms of 1 or more vehicles in household, the demographic groups most similar to Immigrants from St. Vincent and the Grenadines are Immigrants from Grenada (62.7%, a difference of 3.2%), Immigrants from Dominican Republic (68.6%, a difference of 6.1%), British West Indian (70.4%, a difference of 8.8%), Immigrants from Guyana (70.6%, a difference of 9.1%), and Immigrants from Barbados (70.6%, a difference of 9.1%).
| Demographics | Rating | Rank | 1 or more Vehicles in Household |
| Immigrants | Ecuador | 0.0 /100 | #333 | Tragic 76.2% |
| Immigrants | Bangladesh | 0.0 /100 | #334 | Tragic 74.3% |
| Barbadians | 0.0 /100 | #335 | Tragic 74.0% |
| Vietnamese | 0.0 /100 | #336 | Tragic 73.8% |
| Immigrants | Uzbekistan | 0.0 /100 | #337 | Tragic 73.4% |
| Inupiat | 0.0 /100 | #338 | Tragic 71.5% |
| Guyanese | 0.0 /100 | #339 | Tragic 70.8% |
| Dominicans | 0.0 /100 | #340 | Tragic 70.7% |
| Immigrants | Barbados | 0.0 /100 | #341 | Tragic 70.6% |
| Immigrants | Guyana | 0.0 /100 | #342 | Tragic 70.6% |
| British West Indians | 0.0 /100 | #343 | Tragic 70.4% |
| Immigrants | Dominican Republic | 0.0 /100 | #344 | Tragic 68.6% |
| Immigrants | St. Vincent and the Grenadines | 0.0 /100 | #345 | Tragic 64.7% |
| Immigrants | Grenada | 0.0 /100 | #346 | Tragic 62.7% |
| Yup'ik | 0.0 /100 | #347 | Tragic 58.4% |