Canadian vs Cape Verdean 1 or more Vehicles in Household
COMPARE
Canadian
Cape Verdean
1 or more Vehicles in Household
1 or more Vehicles in Household Comparison
Canadians
Cape Verdeans
91.8%
1 OR MORE VEHICLES IN HOUSEHOLD
99.8/ 100
METRIC RATING
66th/ 347
METRIC RANK
84.5%
1 OR MORE VEHICLES IN HOUSEHOLD
0.0/ 100
METRIC RATING
312th/ 347
METRIC RANK
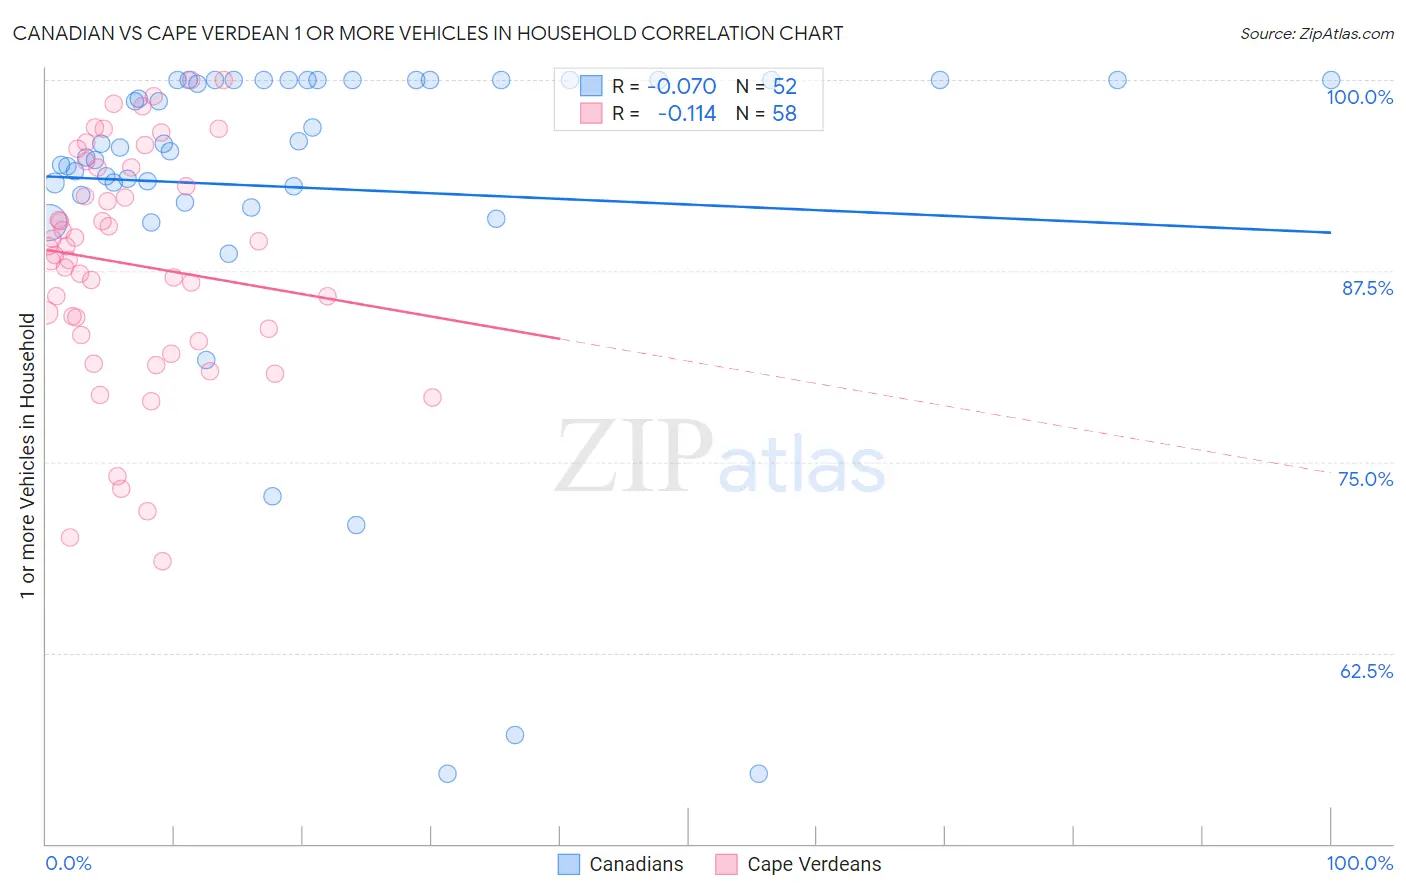
Canadian vs Cape Verdean 1 or more Vehicles in Household Correlation Chart
The statistical analysis conducted on geographies consisting of 437,336,131 people shows a slight negative correlation between the proportion of Canadians and percentage of households with 1 or more vehicles available in the United States with a correlation coefficient (R) of -0.070 and weighted average of 91.8%. Similarly, the statistical analysis conducted on geographies consisting of 107,533,487 people shows a poor negative correlation between the proportion of Cape Verdeans and percentage of households with 1 or more vehicles available in the United States with a correlation coefficient (R) of -0.114 and weighted average of 84.5%, a difference of 8.6%.
1 or more Vehicles in Household Correlation Summary
| Measurement | Canadian | Cape Verdean |
| Minimum | 54.5% | 68.5% |
| Maximum | 100.0% | 100.0% |
| Range | 45.5% | 31.5% |
| Mean | 92.9% | 87.9% |
| Median | 95.7% | 88.8% |
| Interquartile 25% (IQ1) | 92.8% | 83.3% |
| Interquartile 75% (IQ3) | 100.0% | 94.3% |
| Interquartile Range (IQR) | 7.2% | 10.9% |
| Standard Deviation (Sample) | 11.2% | 7.6% |
| Standard Deviation (Population) | 11.1% | 7.6% |
Similar Demographics by 1 or more Vehicles in Household
Demographics Similar to Canadians by 1 or more Vehicles in Household
In terms of 1 or more vehicles in household, the demographic groups most similar to Canadians are Immigrants from Laos (91.8%, a difference of 0.020%), Spaniard (91.8%, a difference of 0.020%), Chinese (91.9%, a difference of 0.050%), Croatian (91.9%, a difference of 0.050%), and Immigrants from Scotland (91.8%, a difference of 0.060%).
| Demographics | Rating | Rank | 1 or more Vehicles in Household |
| Venezuelans | 99.8 /100 | #59 | Exceptional 91.9% |
| Slovaks | 99.8 /100 | #60 | Exceptional 91.9% |
| Immigrants | India | 99.8 /100 | #61 | Exceptional 91.9% |
| Thais | 99.8 /100 | #62 | Exceptional 91.9% |
| Chinese | 99.8 /100 | #63 | Exceptional 91.9% |
| Croatians | 99.8 /100 | #64 | Exceptional 91.9% |
| Immigrants | Laos | 99.8 /100 | #65 | Exceptional 91.8% |
| Canadians | 99.8 /100 | #66 | Exceptional 91.8% |
| Spaniards | 99.8 /100 | #67 | Exceptional 91.8% |
| Immigrants | Scotland | 99.7 /100 | #68 | Exceptional 91.8% |
| Palestinians | 99.7 /100 | #69 | Exceptional 91.7% |
| Lithuanians | 99.7 /100 | #70 | Exceptional 91.7% |
| Poles | 99.7 /100 | #71 | Exceptional 91.7% |
| Cajuns | 99.7 /100 | #72 | Exceptional 91.7% |
| Immigrants | Iran | 99.7 /100 | #73 | Exceptional 91.7% |
Demographics Similar to Cape Verdeans by 1 or more Vehicles in Household
In terms of 1 or more vehicles in household, the demographic groups most similar to Cape Verdeans are Immigrants from Israel (84.5%, a difference of 0.020%), Albanian (84.4%, a difference of 0.090%), Puerto Rican (84.6%, a difference of 0.11%), U.S. Virgin Islander (84.6%, a difference of 0.15%), and Cypriot (84.4%, a difference of 0.16%).
| Demographics | Rating | Rank | 1 or more Vehicles in Household |
| Immigrants | China | 0.0 /100 | #305 | Tragic 84.9% |
| Immigrants | Western Africa | 0.0 /100 | #306 | Tragic 84.9% |
| Tohono O'odham | 0.0 /100 | #307 | Tragic 84.7% |
| Immigrants | Belize | 0.0 /100 | #308 | Tragic 84.7% |
| Immigrants | Haiti | 0.0 /100 | #309 | Tragic 84.7% |
| U.S. Virgin Islanders | 0.0 /100 | #310 | Tragic 84.6% |
| Puerto Ricans | 0.0 /100 | #311 | Tragic 84.6% |
| Cape Verdeans | 0.0 /100 | #312 | Tragic 84.5% |
| Immigrants | Israel | 0.0 /100 | #313 | Tragic 84.5% |
| Albanians | 0.0 /100 | #314 | Tragic 84.4% |
| Cypriots | 0.0 /100 | #315 | Tragic 84.4% |
| Alaska Natives | 0.0 /100 | #316 | Tragic 83.8% |
| Ghanaians | 0.0 /100 | #317 | Tragic 83.6% |
| Immigrants | Ghana | 0.0 /100 | #318 | Tragic 83.4% |
| Immigrants | Belarus | 0.0 /100 | #319 | Tragic 83.3% |