Canadian vs Yup'ik 1 or more Vehicles in Household
COMPARE
Canadian
Yup'ik
1 or more Vehicles in Household
1 or more Vehicles in Household Comparison
Canadians
Yup'ik
91.8%
1 OR MORE VEHICLES IN HOUSEHOLD
99.8/ 100
METRIC RATING
66th/ 347
METRIC RANK
58.4%
1 OR MORE VEHICLES IN HOUSEHOLD
0.0/ 100
METRIC RATING
347th/ 347
METRIC RANK
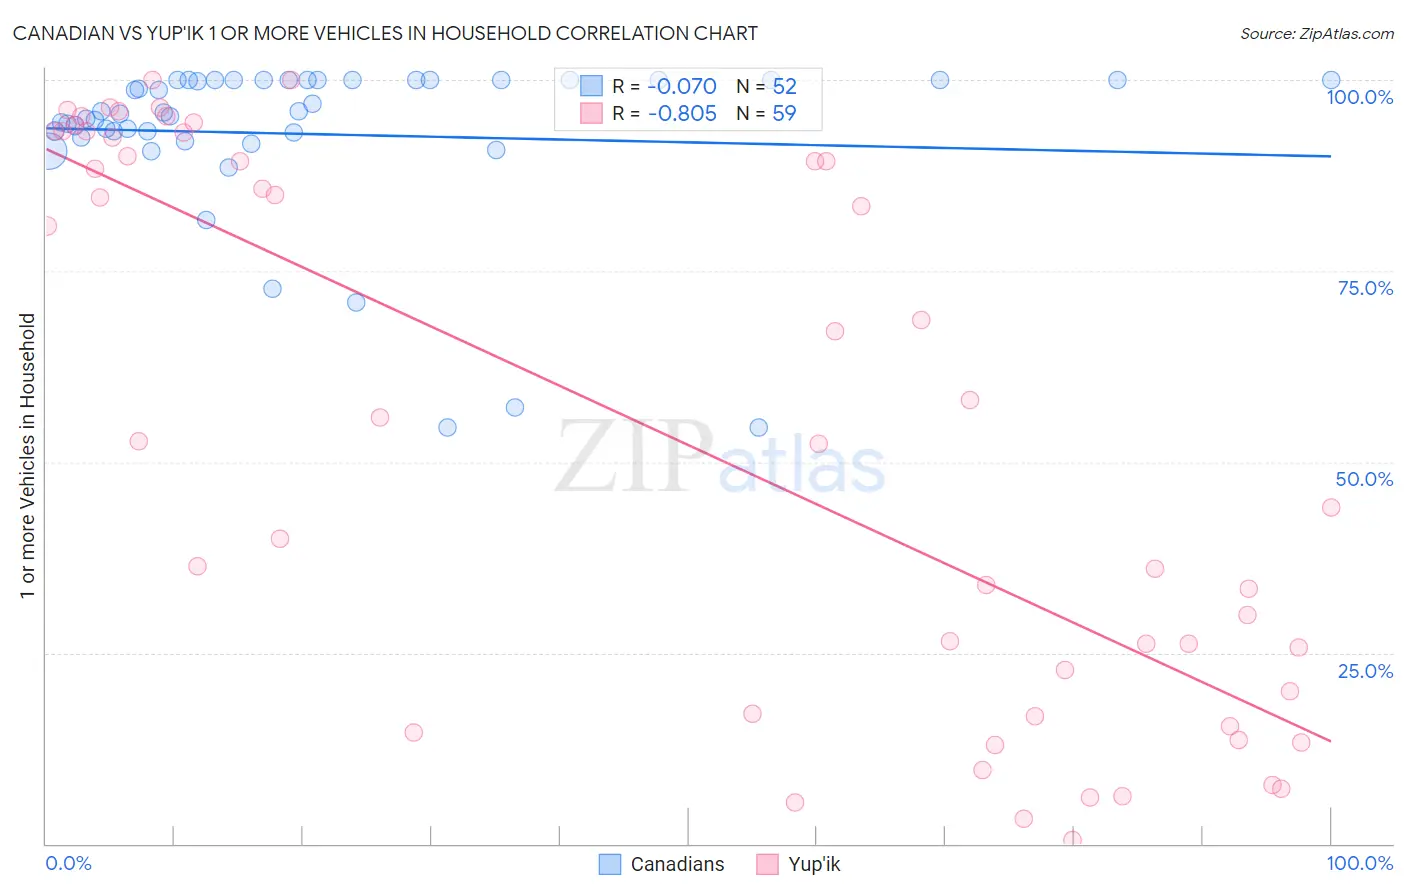
Canadian vs Yup'ik 1 or more Vehicles in Household Correlation Chart
The statistical analysis conducted on geographies consisting of 437,336,131 people shows a slight negative correlation between the proportion of Canadians and percentage of households with 1 or more vehicles available in the United States with a correlation coefficient (R) of -0.070 and weighted average of 91.8%. Similarly, the statistical analysis conducted on geographies consisting of 39,949,066 people shows a very strong negative correlation between the proportion of Yup'ik and percentage of households with 1 or more vehicles available in the United States with a correlation coefficient (R) of -0.805 and weighted average of 58.4%, a difference of 57.1%.
1 or more Vehicles in Household Correlation Summary
| Measurement | Canadian | Yup'ik |
| Minimum | 54.5% | 0.41% |
| Maximum | 100.0% | 100.0% |
| Range | 45.5% | 99.6% |
| Mean | 92.9% | 54.2% |
| Median | 95.7% | 52.7% |
| Interquartile 25% (IQ1) | 92.8% | 17.0% |
| Interquartile 75% (IQ3) | 100.0% | 92.4% |
| Interquartile Range (IQR) | 7.2% | 75.4% |
| Standard Deviation (Sample) | 11.2% | 35.7% |
| Standard Deviation (Population) | 11.1% | 35.4% |
Similar Demographics by 1 or more Vehicles in Household
Demographics Similar to Canadians by 1 or more Vehicles in Household
In terms of 1 or more vehicles in household, the demographic groups most similar to Canadians are Immigrants from Laos (91.8%, a difference of 0.020%), Spaniard (91.8%, a difference of 0.020%), Chinese (91.9%, a difference of 0.050%), Croatian (91.9%, a difference of 0.050%), and Immigrants from Scotland (91.8%, a difference of 0.060%).
| Demographics | Rating | Rank | 1 or more Vehicles in Household |
| Venezuelans | 99.8 /100 | #59 | Exceptional 91.9% |
| Slovaks | 99.8 /100 | #60 | Exceptional 91.9% |
| Immigrants | India | 99.8 /100 | #61 | Exceptional 91.9% |
| Thais | 99.8 /100 | #62 | Exceptional 91.9% |
| Chinese | 99.8 /100 | #63 | Exceptional 91.9% |
| Croatians | 99.8 /100 | #64 | Exceptional 91.9% |
| Immigrants | Laos | 99.8 /100 | #65 | Exceptional 91.8% |
| Canadians | 99.8 /100 | #66 | Exceptional 91.8% |
| Spaniards | 99.8 /100 | #67 | Exceptional 91.8% |
| Immigrants | Scotland | 99.7 /100 | #68 | Exceptional 91.8% |
| Palestinians | 99.7 /100 | #69 | Exceptional 91.7% |
| Lithuanians | 99.7 /100 | #70 | Exceptional 91.7% |
| Poles | 99.7 /100 | #71 | Exceptional 91.7% |
| Cajuns | 99.7 /100 | #72 | Exceptional 91.7% |
| Immigrants | Iran | 99.7 /100 | #73 | Exceptional 91.7% |
Demographics Similar to Yup'ik by 1 or more Vehicles in Household
In terms of 1 or more vehicles in household, the demographic groups most similar to Yup'ik are Immigrants from Grenada (62.7%, a difference of 7.2%), Immigrants from St. Vincent and the Grenadines (64.7%, a difference of 10.7%), Immigrants from Dominican Republic (68.6%, a difference of 17.4%), British West Indian (70.4%, a difference of 20.4%), and Immigrants from Guyana (70.6%, a difference of 20.7%).
| Demographics | Rating | Rank | 1 or more Vehicles in Household |
| Immigrants | Ecuador | 0.0 /100 | #333 | Tragic 76.2% |
| Immigrants | Bangladesh | 0.0 /100 | #334 | Tragic 74.3% |
| Barbadians | 0.0 /100 | #335 | Tragic 74.0% |
| Vietnamese | 0.0 /100 | #336 | Tragic 73.8% |
| Immigrants | Uzbekistan | 0.0 /100 | #337 | Tragic 73.4% |
| Inupiat | 0.0 /100 | #338 | Tragic 71.5% |
| Guyanese | 0.0 /100 | #339 | Tragic 70.8% |
| Dominicans | 0.0 /100 | #340 | Tragic 70.7% |
| Immigrants | Barbados | 0.0 /100 | #341 | Tragic 70.6% |
| Immigrants | Guyana | 0.0 /100 | #342 | Tragic 70.6% |
| British West Indians | 0.0 /100 | #343 | Tragic 70.4% |
| Immigrants | Dominican Republic | 0.0 /100 | #344 | Tragic 68.6% |
| Immigrants | St. Vincent and the Grenadines | 0.0 /100 | #345 | Tragic 64.7% |
| Immigrants | Grenada | 0.0 /100 | #346 | Tragic 62.7% |
| Yup'ik | 0.0 /100 | #347 | Tragic 58.4% |