Alaskan Athabascan vs Immigrants from Western Africa 1 or more Vehicles in Household
COMPARE
Alaskan Athabascan
Immigrants from Western Africa
1 or more Vehicles in Household
1 or more Vehicles in Household Comparison
Alaskan Athabascans
Immigrants from Western Africa
86.0%
1 OR MORE VEHICLES IN HOUSEHOLD
0.0/ 100
METRIC RATING
294th/ 347
METRIC RANK
84.9%
1 OR MORE VEHICLES IN HOUSEHOLD
0.0/ 100
METRIC RATING
306th/ 347
METRIC RANK
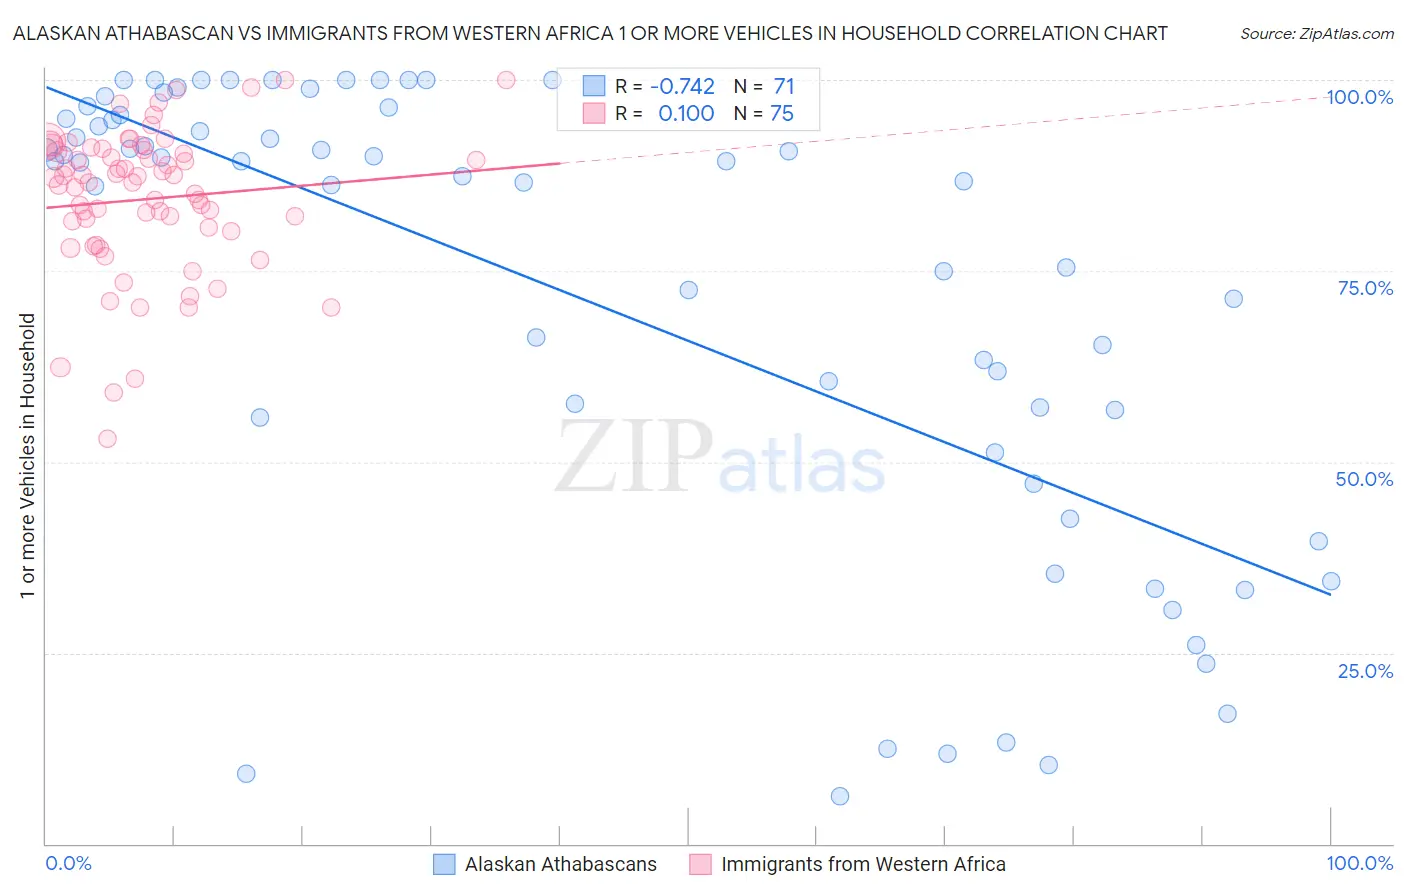
Alaskan Athabascan vs Immigrants from Western Africa 1 or more Vehicles in Household Correlation Chart
The statistical analysis conducted on geographies consisting of 45,812,389 people shows a strong negative correlation between the proportion of Alaskan Athabascans and percentage of households with 1 or more vehicles available in the United States with a correlation coefficient (R) of -0.742 and weighted average of 86.0%. Similarly, the statistical analysis conducted on geographies consisting of 357,592,771 people shows a poor positive correlation between the proportion of Immigrants from Western Africa and percentage of households with 1 or more vehicles available in the United States with a correlation coefficient (R) of 0.100 and weighted average of 84.9%, a difference of 1.3%.
1 or more Vehicles in Household Correlation Summary
| Measurement | Alaskan Athabascan | Immigrants from Western Africa |
| Minimum | 6.2% | 53.0% |
| Maximum | 100.0% | 100.0% |
| Range | 93.8% | 47.0% |
| Mean | 71.5% | 84.4% |
| Median | 87.4% | 86.5% |
| Interquartile 25% (IQ1) | 51.2% | 80.2% |
| Interquartile 75% (IQ3) | 94.9% | 90.9% |
| Interquartile Range (IQR) | 43.7% | 10.8% |
| Standard Deviation (Sample) | 29.8% | 9.5% |
| Standard Deviation (Population) | 29.6% | 9.4% |
Demographics Similar to Alaskan Athabascans and Immigrants from Western Africa by 1 or more Vehicles in Household
In terms of 1 or more vehicles in household, the demographic groups most similar to Alaskan Athabascans are Indian (Asian) (86.0%, a difference of 0.070%), Okinawan (86.1%, a difference of 0.13%), Immigrants from Jamaica (85.8%, a difference of 0.17%), Immigrants from Spain (85.8%, a difference of 0.20%), and Paraguayan (85.7%, a difference of 0.29%). Similarly, the demographic groups most similar to Immigrants from Western Africa are Immigrants from China (84.9%, a difference of 0.020%), Tohono O'odham (84.7%, a difference of 0.26%), Immigrants from Belize (84.7%, a difference of 0.29%), Immigrants from Haiti (84.7%, a difference of 0.30%), and U.S. Virgin Islander (84.6%, a difference of 0.33%).
| Demographics | Rating | Rank | 1 or more Vehicles in Household |
| Immigrants | Australia | 0.0 /100 | #290 | Tragic 86.4% |
| Pima | 0.0 /100 | #291 | Tragic 86.3% |
| Okinawans | 0.0 /100 | #292 | Tragic 86.1% |
| Indians (Asian) | 0.0 /100 | #293 | Tragic 86.0% |
| Alaskan Athabascans | 0.0 /100 | #294 | Tragic 86.0% |
| Immigrants | Jamaica | 0.0 /100 | #295 | Tragic 85.8% |
| Immigrants | Spain | 0.0 /100 | #296 | Tragic 85.8% |
| Paraguayans | 0.0 /100 | #297 | Tragic 85.7% |
| Belizeans | 0.0 /100 | #298 | Tragic 85.7% |
| Yuman | 0.0 /100 | #299 | Tragic 85.5% |
| Immigrants | Russia | 0.0 /100 | #300 | Tragic 85.4% |
| Immigrants | Panama | 0.0 /100 | #301 | Tragic 85.4% |
| Moroccans | 0.0 /100 | #302 | Tragic 85.4% |
| Immigrants | Greece | 0.0 /100 | #303 | Tragic 85.4% |
| Immigrants | Ukraine | 0.0 /100 | #304 | Tragic 85.2% |
| Immigrants | China | 0.0 /100 | #305 | Tragic 84.9% |
| Immigrants | Western Africa | 0.0 /100 | #306 | Tragic 84.9% |
| Tohono O'odham | 0.0 /100 | #307 | Tragic 84.7% |
| Immigrants | Belize | 0.0 /100 | #308 | Tragic 84.7% |
| Immigrants | Haiti | 0.0 /100 | #309 | Tragic 84.7% |
| U.S. Virgin Islanders | 0.0 /100 | #310 | Tragic 84.6% |