Alaskan Athabascan vs Immigrants from Lithuania 1 or more Vehicles in Household
COMPARE
Alaskan Athabascan
Immigrants from Lithuania
1 or more Vehicles in Household
1 or more Vehicles in Household Comparison
Alaskan Athabascans
Immigrants from Lithuania
86.0%
1 OR MORE VEHICLES IN HOUSEHOLD
0.0/ 100
METRIC RATING
294th/ 347
METRIC RANK
90.2%
1 OR MORE VEHICLES IN HOUSEHOLD
83.0/ 100
METRIC RATING
142nd/ 347
METRIC RANK
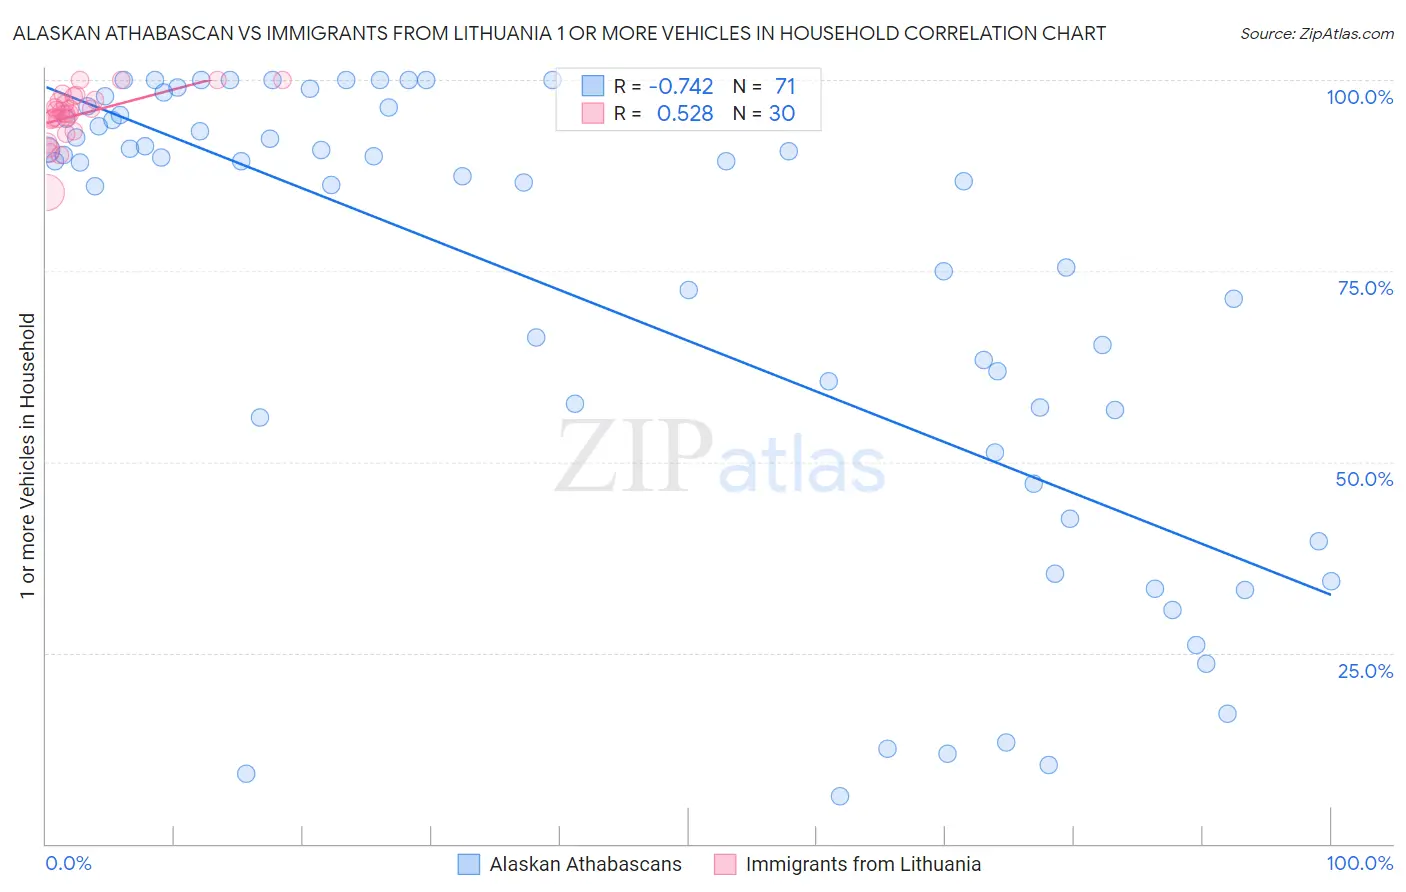
Alaskan Athabascan vs Immigrants from Lithuania 1 or more Vehicles in Household Correlation Chart
The statistical analysis conducted on geographies consisting of 45,812,389 people shows a strong negative correlation between the proportion of Alaskan Athabascans and percentage of households with 1 or more vehicles available in the United States with a correlation coefficient (R) of -0.742 and weighted average of 86.0%. Similarly, the statistical analysis conducted on geographies consisting of 117,713,976 people shows a substantial positive correlation between the proportion of Immigrants from Lithuania and percentage of households with 1 or more vehicles available in the United States with a correlation coefficient (R) of 0.528 and weighted average of 90.2%, a difference of 5.0%.
1 or more Vehicles in Household Correlation Summary
| Measurement | Alaskan Athabascan | Immigrants from Lithuania |
| Minimum | 6.2% | 85.3% |
| Maximum | 100.0% | 100.0% |
| Range | 93.8% | 14.7% |
| Mean | 71.5% | 95.4% |
| Median | 87.4% | 95.8% |
| Interquartile 25% (IQ1) | 51.2% | 94.8% |
| Interquartile 75% (IQ3) | 94.9% | 97.4% |
| Interquartile Range (IQR) | 43.7% | 2.6% |
| Standard Deviation (Sample) | 29.8% | 3.3% |
| Standard Deviation (Population) | 29.6% | 3.2% |
Similar Demographics by 1 or more Vehicles in Household
Demographics Similar to Alaskan Athabascans by 1 or more Vehicles in Household
In terms of 1 or more vehicles in household, the demographic groups most similar to Alaskan Athabascans are Indian (Asian) (86.0%, a difference of 0.070%), Okinawan (86.1%, a difference of 0.13%), Immigrants from Jamaica (85.8%, a difference of 0.17%), Immigrants from Spain (85.8%, a difference of 0.20%), and Paraguayan (85.7%, a difference of 0.29%).
| Demographics | Rating | Rank | 1 or more Vehicles in Household |
| Immigrants | Malaysia | 0.0 /100 | #287 | Tragic 86.5% |
| Hopi | 0.0 /100 | #288 | Tragic 86.4% |
| Immigrants | Ireland | 0.0 /100 | #289 | Tragic 86.4% |
| Immigrants | Australia | 0.0 /100 | #290 | Tragic 86.4% |
| Pima | 0.0 /100 | #291 | Tragic 86.3% |
| Okinawans | 0.0 /100 | #292 | Tragic 86.1% |
| Indians (Asian) | 0.0 /100 | #293 | Tragic 86.0% |
| Alaskan Athabascans | 0.0 /100 | #294 | Tragic 86.0% |
| Immigrants | Jamaica | 0.0 /100 | #295 | Tragic 85.8% |
| Immigrants | Spain | 0.0 /100 | #296 | Tragic 85.8% |
| Paraguayans | 0.0 /100 | #297 | Tragic 85.7% |
| Belizeans | 0.0 /100 | #298 | Tragic 85.7% |
| Yuman | 0.0 /100 | #299 | Tragic 85.5% |
| Immigrants | Russia | 0.0 /100 | #300 | Tragic 85.4% |
| Immigrants | Panama | 0.0 /100 | #301 | Tragic 85.4% |
Demographics Similar to Immigrants from Lithuania by 1 or more Vehicles in Household
In terms of 1 or more vehicles in household, the demographic groups most similar to Immigrants from Lithuania are Immigrants from Moldova (90.2%, a difference of 0.0%), Immigrants from Bahamas (90.2%, a difference of 0.040%), Immigrants from Zimbabwe (90.2%, a difference of 0.040%), Sioux (90.2%, a difference of 0.040%), and Sudanese (90.3%, a difference of 0.060%).
| Demographics | Rating | Rank | 1 or more Vehicles in Household |
| Immigrants | Oceania | 86.9 /100 | #135 | Excellent 90.4% |
| Hungarians | 86.5 /100 | #136 | Excellent 90.3% |
| Latvians | 86.3 /100 | #137 | Excellent 90.3% |
| Syrians | 86.3 /100 | #138 | Excellent 90.3% |
| Estonians | 85.6 /100 | #139 | Excellent 90.3% |
| Sudanese | 85.2 /100 | #140 | Excellent 90.3% |
| Immigrants | Moldova | 83.1 /100 | #141 | Excellent 90.2% |
| Immigrants | Lithuania | 83.0 /100 | #142 | Excellent 90.2% |
| Immigrants | Bahamas | 81.5 /100 | #143 | Excellent 90.2% |
| Immigrants | Zimbabwe | 81.5 /100 | #144 | Excellent 90.2% |
| Sioux | 81.3 /100 | #145 | Excellent 90.2% |
| Bahamians | 80.5 /100 | #146 | Excellent 90.2% |
| Chileans | 79.8 /100 | #147 | Good 90.2% |
| Immigrants | Eastern Africa | 78.2 /100 | #148 | Good 90.1% |
| Immigrants | Nicaragua | 76.7 /100 | #149 | Good 90.1% |