Seminole vs Immigrants from Middle Africa Unemployment Among Women with Children Ages 6 to 17 years
COMPARE
Seminole
Immigrants from Middle Africa
Unemployment Among Women with Children Ages 6 to 17 years
Unemployment Among Women with Children Ages 6 to 17 years Comparison
Seminole
Immigrants from Middle Africa
9.7%
UNEMPLOYMENT AMONG WOMEN WITH CHILDREN AGES 6 TO 17 YEARS
0.1/ 100
METRIC RATING
280th/ 347
METRIC RANK
9.1%
UNEMPLOYMENT AMONG WOMEN WITH CHILDREN AGES 6 TO 17 YEARS
15.6/ 100
METRIC RATING
202nd/ 347
METRIC RANK
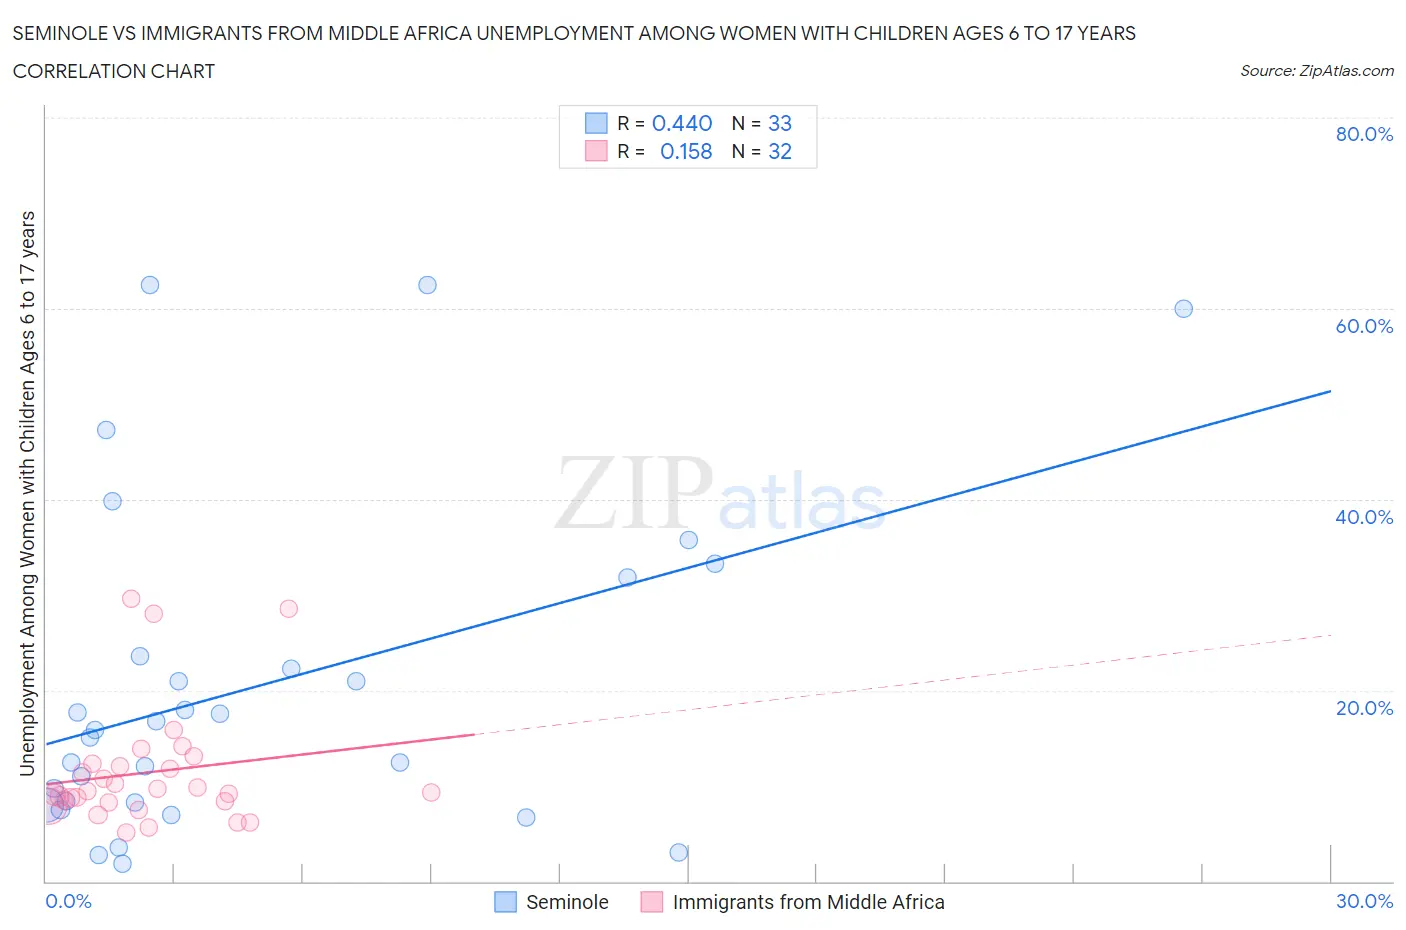
Seminole vs Immigrants from Middle Africa Unemployment Among Women with Children Ages 6 to 17 years Correlation Chart
The statistical analysis conducted on geographies consisting of 102,585,790 people shows a moderate positive correlation between the proportion of Seminole and unemployment rate among women with children between the ages 6 and 17 in the United States with a correlation coefficient (R) of 0.440 and weighted average of 9.7%. Similarly, the statistical analysis conducted on geographies consisting of 167,126,033 people shows a poor positive correlation between the proportion of Immigrants from Middle Africa and unemployment rate among women with children between the ages 6 and 17 in the United States with a correlation coefficient (R) of 0.158 and weighted average of 9.1%, a difference of 6.4%.
Unemployment Among Women with Children Ages 6 to 17 years Correlation Summary
| Measurement | Seminole | Immigrants from Middle Africa |
| Minimum | 1.8% | 5.1% |
| Maximum | 62.5% | 29.6% |
| Range | 60.7% | 24.5% |
| Mean | 20.5% | 11.4% |
| Median | 15.9% | 9.4% |
| Interquartile 25% (IQ1) | 8.2% | 8.3% |
| Interquartile 75% (IQ3) | 27.7% | 12.2% |
| Interquartile Range (IQR) | 19.5% | 3.9% |
| Standard Deviation (Sample) | 17.2% | 6.2% |
| Standard Deviation (Population) | 16.9% | 6.1% |
Similar Demographics by Unemployment Among Women with Children Ages 6 to 17 years
Demographics Similar to Seminole by Unemployment Among Women with Children Ages 6 to 17 years
In terms of unemployment among women with children ages 6 to 17 years, the demographic groups most similar to Seminole are Scotch-Irish (9.7%, a difference of 0.19%), French (9.7%, a difference of 0.22%), British West Indian (9.7%, a difference of 0.29%), Immigrants from Portugal (9.7%, a difference of 0.35%), and U.S. Virgin Islander (9.7%, a difference of 0.36%).
| Demographics | Rating | Rank | Unemployment Among Women with Children Ages 6 to 17 years |
| Whites/Caucasians | 0.1 /100 | #273 | Tragic 9.6% |
| Aleuts | 0.1 /100 | #274 | Tragic 9.6% |
| U.S. Virgin Islanders | 0.1 /100 | #275 | Tragic 9.7% |
| Immigrants | Portugal | 0.1 /100 | #276 | Tragic 9.7% |
| British West Indians | 0.1 /100 | #277 | Tragic 9.7% |
| French | 0.1 /100 | #278 | Tragic 9.7% |
| Scotch-Irish | 0.1 /100 | #279 | Tragic 9.7% |
| Seminole | 0.1 /100 | #280 | Tragic 9.7% |
| Jamaicans | 0.0 /100 | #281 | Tragic 9.8% |
| Slovaks | 0.0 /100 | #282 | Tragic 9.8% |
| Central American Indians | 0.0 /100 | #283 | Tragic 9.9% |
| Yakama | 0.0 /100 | #284 | Tragic 9.9% |
| Hispanics or Latinos | 0.0 /100 | #285 | Tragic 9.9% |
| Choctaw | 0.0 /100 | #286 | Tragic 9.9% |
| Sierra Leoneans | 0.0 /100 | #287 | Tragic 9.9% |
Demographics Similar to Immigrants from Middle Africa by Unemployment Among Women with Children Ages 6 to 17 years
In terms of unemployment among women with children ages 6 to 17 years, the demographic groups most similar to Immigrants from Middle Africa are Maltese (9.1%, a difference of 0.020%), Immigrants from Canada (9.1%, a difference of 0.020%), Immigrants from Trinidad and Tobago (9.1%, a difference of 0.090%), Immigrants from Western Europe (9.1%, a difference of 0.13%), and Trinidadian and Tobagonian (9.1%, a difference of 0.20%).
| Demographics | Rating | Rank | Unemployment Among Women with Children Ages 6 to 17 years |
| Austrians | 25.0 /100 | #195 | Fair 9.1% |
| Brazilians | 24.4 /100 | #196 | Fair 9.1% |
| Immigrants | Panama | 24.3 /100 | #197 | Fair 9.1% |
| Guyanese | 21.8 /100 | #198 | Fair 9.1% |
| Czechoslovakians | 20.8 /100 | #199 | Fair 9.1% |
| Trinidadians and Tobagonians | 18.2 /100 | #200 | Poor 9.1% |
| Immigrants | Trinidad and Tobago | 16.7 /100 | #201 | Poor 9.1% |
| Immigrants | Middle Africa | 15.6 /100 | #202 | Poor 9.1% |
| Maltese | 15.3 /100 | #203 | Poor 9.1% |
| Immigrants | Canada | 15.3 /100 | #204 | Poor 9.1% |
| Immigrants | Western Europe | 14.1 /100 | #205 | Poor 9.1% |
| Immigrants | North America | 12.7 /100 | #206 | Poor 9.2% |
| Cubans | 10.9 /100 | #207 | Poor 9.2% |
| Immigrants | Peru | 10.8 /100 | #208 | Poor 9.2% |
| Salvadorans | 10.7 /100 | #209 | Poor 9.2% |