Native/Alaskan Unemployment Among Women with Children Ages 6 to 17 years
COMPARE
Native/Alaskan
Select to Compare
Unemployment Among Women with Children Ages 6 to 17 years
Native/Alaskan Unemployment Among Women with Children Ages 6 to 17 years
11.5%
UNEMPLOYMENT | WOMEN W/ CHILDREN 6 TO 17
0.0/ 100
METRIC RATING
333rd/ 347
METRIC RANK
Native/Alaskan Unemployment Among Women with Children Ages 6 to 17 years Correlation Chart
The statistical analysis conducted on geographies consisting of 344,398,137 people shows a moderate positive correlation between the proportion of Natives/Alaskans and unemployment rate among women with children between the ages 6 and 17 in the United States with a correlation coefficient (R) of 0.478 and weighted average of 11.5%. On average, for every 1% (one percent) increase in Natives/Alaskans within a typical geography, there is an increase of 0.21% in unemployment rate among women with children between the ages 6 and 17.
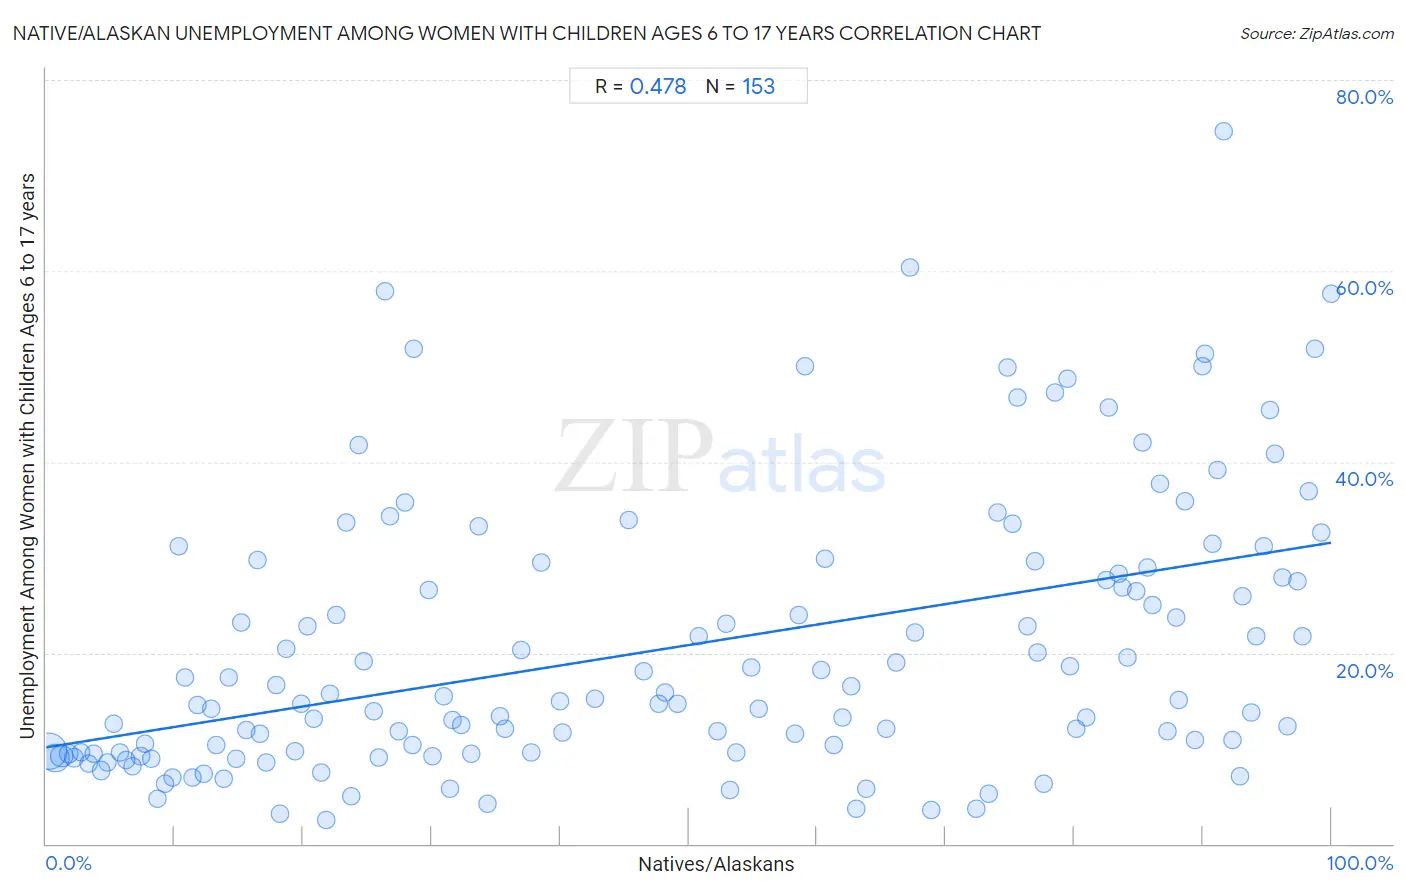
It is essential to understand that the correlation between the percentage of Natives/Alaskans and unemployment rate among women with children between the ages 6 and 17 does not imply a direct cause-and-effect relationship. It remains uncertain whether the presence of Natives/Alaskans influences an upward or downward trend in the level of unemployment rate among women with children between the ages 6 and 17 within an area, or if Natives/Alaskans simply ended up residing in those areas with higher or lower levels of unemployment rate among women with children between the ages 6 and 17 due to other factors.
Demographics Similar to Natives/Alaskans by Unemployment Among Women with Children Ages 6 to 17 years
In terms of unemployment among women with children ages 6 to 17 years, the demographic groups most similar to Natives/Alaskans are Tsimshian (11.4%, a difference of 0.63%), Black/African American (11.4%, a difference of 0.74%), Chippewa (11.1%, a difference of 3.4%), Pennsylvania German (11.0%, a difference of 3.9%), and Ugandan (12.0%, a difference of 4.9%).
| Demographics | Rating | Rank | Unemployment Among Women with Children Ages 6 to 17 years |
| Liberians | 0.0 /100 | #326 | Tragic 10.8% |
| Cape Verdeans | 0.0 /100 | #327 | Tragic 10.9% |
| Ottawa | 0.0 /100 | #328 | Tragic 10.9% |
| Pennsylvania Germans | 0.0 /100 | #329 | Tragic 11.0% |
| Chippewa | 0.0 /100 | #330 | Tragic 11.1% |
| Blacks/African Americans | 0.0 /100 | #331 | Tragic 11.4% |
| Tsimshian | 0.0 /100 | #332 | Tragic 11.4% |
| Natives/Alaskans | 0.0 /100 | #333 | Tragic 11.5% |
| Ugandans | 0.0 /100 | #334 | Tragic 12.0% |
| Colville | 0.0 /100 | #335 | Tragic 12.3% |
| Houma | 0.0 /100 | #336 | Tragic 12.5% |
| Immigrants from Yemen | 0.0 /100 | #337 | Tragic 12.7% |
| Hopi | 0.0 /100 | #338 | Tragic 12.9% |
| Sioux | 0.0 /100 | #339 | Tragic 13.2% |
| Puerto Ricans | 0.0 /100 | #340 | Tragic 13.9% |
Native/Alaskan Unemployment Among Women with Children Ages 6 to 17 years Correlation Summary
| Measurement | Native/Alaskan Data | Unemployment Among Women with Children Ages 6 to 17 years Data |
| Minimum | 0.22% | 2.5% |
| Maximum | 100.0% | 74.6% |
| Range | 99.8% | 72.1% |
| Mean | 48.5% | 20.5% |
| Median | 46.5% | 15.1% |
| Interquartile 25% (IQ1) | 19.0% | 9.5% |
| Interquartile 75% (IQ3) | 79.9% | 28.6% |
| Interquartile Range (IQR) | 60.9% | 19.1% |
| Standard Deviation (Sample) | 32.0% | 14.4% |
| Standard Deviation (Population) | 31.9% | 14.3% |
Correlation Details
| Native/Alaskan Percentile | Sample Size | Unemployment Among Women with Children Ages 6 to 17 years |
[ 0.0% - 0.5% ] 0.22% | 181,531,782 | 9.6% |
[ 0.5% - 1.0% ] 0.71% | 88,064,801 | 9.0% |
[ 1.0% - 1.5% ] 1.19% | 39,632,509 | 9.2% |
[ 1.5% - 2.0% ] 1.72% | 12,486,444 | 9.5% |
[ 2.0% - 2.5% ] 2.18% | 7,773,871 | 9.0% |
[ 2.5% - 3.0% ] 2.70% | 3,142,044 | 9.5% |
[ 3.0% - 3.5% ] 3.27% | 3,002,161 | 8.4% |
[ 3.5% - 4.0% ] 3.69% | 1,144,684 | 9.4% |
[ 4.0% - 4.5% ] 4.28% | 1,667,195 | 7.7% |
[ 4.5% - 5.0% ] 4.78% | 1,311,512 | 8.6% |
[ 5.0% - 5.5% ] 5.23% | 348,833 | 12.6% |
[ 5.5% - 6.0% ] 5.76% | 370,982 | 9.5% |
[ 6.0% - 6.5% ] 6.26% | 400,065 | 8.8% |
[ 6.5% - 7.0% ] 6.73% | 157,219 | 8.1% |
[ 7.0% - 7.5% ] 7.34% | 509,339 | 9.2% |
[ 7.5% - 8.0% ] 7.66% | 209,523 | 10.4% |
[ 8.0% - 8.5% ] 8.20% | 196,204 | 8.9% |
[ 8.5% - 9.0% ] 8.70% | 217,585 | 4.7% |
[ 9.0% - 9.5% ] 9.26% | 160,011 | 6.2% |
[ 9.5% - 10.0% ] 9.86% | 144,262 | 6.9% |
[ 10.0% - 10.5% ] 10.29% | 31,608 | 31.1% |
[ 10.5% - 11.0% ] 10.80% | 46,035 | 17.4% |
[ 11.0% - 11.5% ] 11.39% | 72,493 | 6.9% |
[ 11.5% - 12.0% ] 11.76% | 71,342 | 14.5% |
[ 12.0% - 12.5% ] 12.22% | 135,210 | 7.3% |
[ 12.5% - 13.0% ] 12.80% | 39,157 | 14.2% |
[ 13.0% - 13.5% ] 13.27% | 59,491 | 10.4% |
[ 13.5% - 14.0% ] 13.86% | 85,762 | 6.8% |
[ 14.0% - 14.5% ] 14.17% | 34,501 | 17.4% |
[ 14.5% - 15.0% ] 14.77% | 47,050 | 8.9% |
[ 15.0% - 15.5% ] 15.15% | 46,362 | 23.2% |
[ 15.5% - 16.0% ] 15.60% | 49,057 | 12.0% |
[ 16.0% - 16.5% ] 16.44% | 17,781 | 29.8% |
[ 16.5% - 17.0% ] 16.60% | 44,849 | 11.5% |
[ 17.0% - 17.5% ] 17.11% | 24,033 | 8.5% |
[ 17.5% - 18.0% ] 17.91% | 39,688 | 16.6% |
[ 18.0% - 18.5% ] 18.16% | 52,598 | 3.1% |
[ 18.5% - 19.0% ] 18.69% | 25,635 | 20.4% |
[ 19.0% - 19.5% ] 19.33% | 60,511 | 9.7% |
[ 19.5% - 20.0% ] 19.86% | 30,132 | 14.6% |
[ 20.0% - 20.5% ] 20.37% | 19,751 | 22.8% |
[ 20.5% - 21.0% ] 20.85% | 27,161 | 13.0% |
[ 21.0% - 21.5% ] 21.36% | 3,769 | 7.5% |
[ 21.5% - 22.0% ] 21.79% | 27,245 | 2.5% |
[ 22.0% - 22.5% ] 22.09% | 4,314 | 15.7% |
[ 22.5% - 23.0% ] 22.57% | 11,278 | 23.9% |
[ 23.0% - 23.5% ] 23.31% | 3,247 | 33.7% |
[ 23.5% - 24.0% ] 23.75% | 11,505 | 5.0% |
[ 24.0% - 24.5% ] 24.31% | 4,389 | 41.8% |
[ 24.5% - 25.0% ] 24.73% | 10,732 | 19.2% |
[ 25.0% - 25.5% ] 25.46% | 10,040 | 13.9% |
[ 25.5% - 26.0% ] 25.86% | 6,753 | 9.0% |
[ 26.0% - 26.5% ] 26.33% | 5,370 | 57.8% |
[ 26.5% - 27.0% ] 26.71% | 4,695 | 34.3% |
[ 27.0% - 27.5% ] 27.44% | 5,983 | 11.7% |
[ 27.5% - 28.0% ] 27.89% | 6,762 | 35.7% |
[ 28.0% - 28.5% ] 28.49% | 47,449 | 10.3% |
[ 28.5% - 29.0% ] 28.64% | 3,995 | 51.8% |
[ 29.5% - 30.0% ] 29.74% | 13,727 | 26.5% |
[ 30.0% - 30.5% ] 30.04% | 17,346 | 9.2% |
[ 30.5% - 31.0% ] 30.92% | 1,410 | 15.4% |
[ 31.0% - 31.5% ] 31.37% | 3,672 | 5.7% |
[ 31.5% - 32.0% ] 31.59% | 1,741 | 13.0% |
[ 32.0% - 32.5% ] 32.33% | 10,670 | 12.4% |
[ 33.0% - 33.5% ] 33.11% | 46,398 | 9.4% |
[ 33.5% - 34.0% ] 33.71% | 1,792 | 33.3% |
[ 34.0% - 34.5% ] 34.33% | 34,839 | 4.2% |
[ 35.0% - 35.5% ] 35.33% | 2,918 | 13.3% |
[ 35.5% - 36.0% ] 35.67% | 8,586 | 12.1% |
[ 36.5% - 37.0% ] 36.93% | 1,725 | 20.3% |
[ 37.5% - 38.0% ] 37.72% | 5,692 | 9.5% |
[ 38.5% - 39.0% ] 38.52% | 945 | 29.4% |
[ 39.5% - 40.0% ] 39.97% | 2,952 | 14.9% |
[ 40.0% - 40.5% ] 40.19% | 1,672 | 11.6% |
[ 42.5% - 43.0% ] 42.71% | 4,589 | 15.2% |
[ 45.0% - 45.5% ] 45.34% | 1,533 | 33.9% |
[ 46.5% - 47.0% ] 46.53% | 13,807 | 18.1% |
[ 47.5% - 48.0% ] 47.68% | 22,454 | 14.6% |
[ 48.0% - 48.5% ] 48.17% | 6,560 | 15.8% |
[ 49.0% - 49.5% ] 49.16% | 21,672 | 14.6% |
[ 50.5% - 51.0% ] 50.82% | 5,915 | 21.8% |
[ 52.0% - 52.5% ] 52.27% | 1,963 | 11.8% |
[ 52.5% - 53.0% ] 52.95% | 644 | 23.1% |
[ 53.0% - 53.5% ] 53.19% | 14,688 | 5.6% |
[ 53.5% - 54.0% ] 53.68% | 15,584 | 9.5% |
[ 54.5% - 55.0% ] 54.88% | 3,134 | 18.5% |
[ 55.0% - 55.5% ] 55.47% | 4,368 | 14.1% |
[ 58.0% - 58.5% ] 58.28% | 5,666 | 11.6% |
[ 58.5% - 59.0% ] 58.57% | 1,103 | 24.0% |
[ 59.0% - 59.5% ] 59.04% | 293 | 50.0% |
[ 60.0% - 60.5% ] 60.33% | 300 | 18.2% |
[ 60.5% - 61.0% ] 60.65% | 1,939 | 29.9% |
[ 61.0% - 61.5% ] 61.26% | 13,687 | 10.3% |
[ 61.5% - 62.0% ] 61.99% | 2,665 | 13.2% |
[ 62.5% - 63.0% ] 62.61% | 3,760 | 16.5% |
[ 63.0% - 63.5% ] 63.05% | 912 | 3.7% |
[ 63.5% - 64.0% ] 63.80% | 11,444 | 5.8% |
[ 65.0% - 65.5% ] 65.38% | 3,088 | 12.1% |
[ 66.0% - 66.5% ] 66.13% | 1,724 | 19.0% |
[ 67.0% - 67.5% ] 67.22% | 2,364 | 60.3% |
[ 67.5% - 68.0% ] 67.58% | 4,136 | 22.1% |
[ 68.5% - 69.0% ] 68.91% | 13,151 | 3.6% |
[ 72.0% - 72.5% ] 72.39% | 7,465 | 3.7% |
[ 73.0% - 73.5% ] 73.30% | 16,494 | 5.2% |
[ 74.0% - 74.5% ] 74.03% | 2,965 | 34.7% |
[ 74.5% - 75.0% ] 74.79% | 4,593 | 49.8% |
[ 75.0% - 75.5% ] 75.21% | 2,622 | 33.5% |
[ 75.5% - 76.0% ] 75.59% | 299 | 46.7% |
[ 76.0% - 76.5% ] 76.38% | 2,121 | 22.7% |
[ 76.5% - 77.0% ] 76.91% | 1,256 | 29.6% |
[ 77.0% - 77.5% ] 77.17% | 5,835 | 20.1% |
[ 77.5% - 78.0% ] 77.61% | 1,206 | 6.3% |
[ 78.5% - 79.0% ] 78.51% | 954 | 47.3% |
[ 79.0% - 79.5% ] 79.48% | 1,496 | 48.8% |
[ 79.5% - 80.0% ] 79.63% | 4,944 | 18.5% |
[ 80.0% - 80.5% ] 80.13% | 6,569 | 12.0% |
[ 80.5% - 81.0% ] 80.95% | 2,940 | 13.2% |
[ 82.0% - 82.5% ] 82.45% | 792 | 27.6% |
[ 82.5% - 83.0% ] 82.65% | 2,156 | 45.7% |
[ 83.0% - 83.5% ] 83.43% | 8,281 | 28.2% |
[ 83.5% - 84.0% ] 83.71% | 1,946 | 26.8% |
[ 84.0% - 84.5% ] 84.10% | 1,465 | 19.5% |
[ 84.5% - 85.0% ] 84.85% | 18,316 | 26.4% |
[ 85.0% - 85.5% ] 85.35% | 2,410 | 42.0% |
[ 85.5% - 86.0% ] 85.69% | 5,352 | 28.9% |
[ 86.0% - 86.5% ] 86.05% | 344 | 25.0% |
[ 86.5% - 87.0% ] 86.63% | 3,957 | 37.6% |
[ 87.0% - 87.5% ] 87.29% | 2,070 | 11.8% |
[ 87.5% - 88.0% ] 87.91% | 2,895 | 23.7% |
[ 88.0% - 88.5% ] 88.11% | 1,253 | 15.1% |
[ 88.5% - 89.0% ] 88.63% | 12,669 | 35.9% |
[ 89.0% - 89.5% ] 89.38% | 2,372 | 10.9% |
[ 89.5% - 90.0% ] 89.95% | 1,453 | 50.0% |
[ 90.0% - 90.5% ] 90.19% | 4,283 | 51.3% |
[ 90.5% - 91.0% ] 90.72% | 4,981 | 31.5% |
[ 91.0% - 91.5% ] 91.14% | 2,823 | 39.1% |
[ 91.5% - 92.0% ] 91.68% | 3,811 | 74.6% |
[ 92.0% - 92.5% ] 92.32% | 10,794 | 10.9% |
[ 92.5% - 93.0% ] 92.88% | 21,102 | 7.1% |
[ 93.0% - 93.5% ] 93.13% | 13,505 | 25.9% |
[ 93.5% - 94.0% ] 93.80% | 17,004 | 13.7% |
[ 94.0% - 94.5% ] 94.20% | 9,340 | 21.8% |
[ 94.5% - 95.0% ] 94.77% | 21,072 | 31.2% |
[ 95.0% - 95.5% ] 95.25% | 7,157 | 45.4% |
[ 95.5% - 96.0% ] 95.67% | 24,683 | 40.8% |
[ 96.0% - 96.5% ] 96.24% | 15,917 | 27.9% |
[ 96.5% - 97.0% ] 96.57% | 11,190 | 12.3% |
[ 97.0% - 97.5% ] 97.34% | 6,006 | 27.5% |
[ 97.5% - 98.0% ] 97.76% | 16,861 | 21.8% |
[ 98.0% - 98.5% ] 98.26% | 12,101 | 37.0% |
[ 98.5% - 99.0% ] 98.75% | 8,456 | 51.8% |
[ 99.0% - 99.5% ] 99.25% | 9,702 | 32.6% |
[ 99.5% - 100.0% ] 99.98% | 9,872 | 57.7% |