Zip Codes with the Most Immigrants from South Eastern Asia in Stephenville, TX
RELATED REPORTS & OPTIONS
South Eastern Asia
Stephenville
Compare Zip Codes
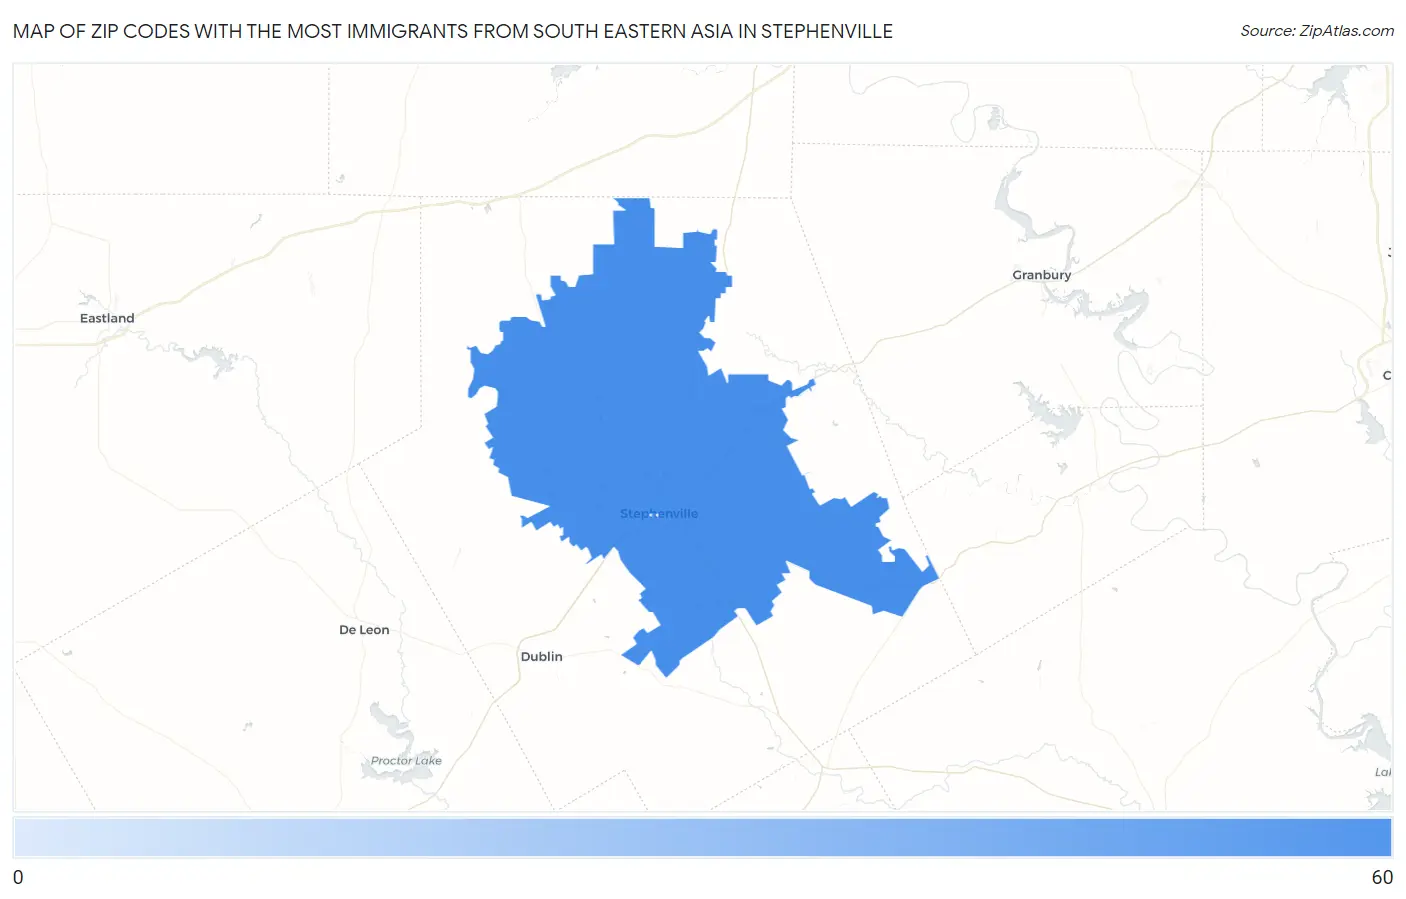
Map of Zip Codes with the Most Immigrants from South Eastern Asia in Stephenville
3
55
Zip Codes with the Most Immigrants from South Eastern Asia in Stephenville, TX
| Zip Code | South Eastern Asia | vs State | vs National | |
| 1. | 76401 | 55 | 354,725(0.02%)#622 | 4,292,058(0.00%)#7,508 |
| 2. | 76402 | 3 | 354,725(0.00%)#1,004 | 4,292,058(0.00%)#14,170 |
1
Common Questions
What are the Top Zip Codes with the Most Immigrants from South Eastern Asia in Stephenville, TX?
Top Zip Codes with the Most Immigrants from South Eastern Asia in Stephenville, TX are:
What zip code has the Most Immigrants from South Eastern Asia in Stephenville, TX?
76401 has the Most Immigrants from South Eastern Asia in Stephenville, TX with 55.
What is the Total Immigrants from South Eastern Asia in Stephenville, TX?
Total Immigrants from South Eastern Asia in Stephenville is 43.
What is the Total Immigrants from South Eastern Asia in Texas?
Total Immigrants from South Eastern Asia in Texas is 354,725.
What is the Total Immigrants from South Eastern Asia in the United States?
Total Immigrants from South Eastern Asia in the United States is 4,292,058.