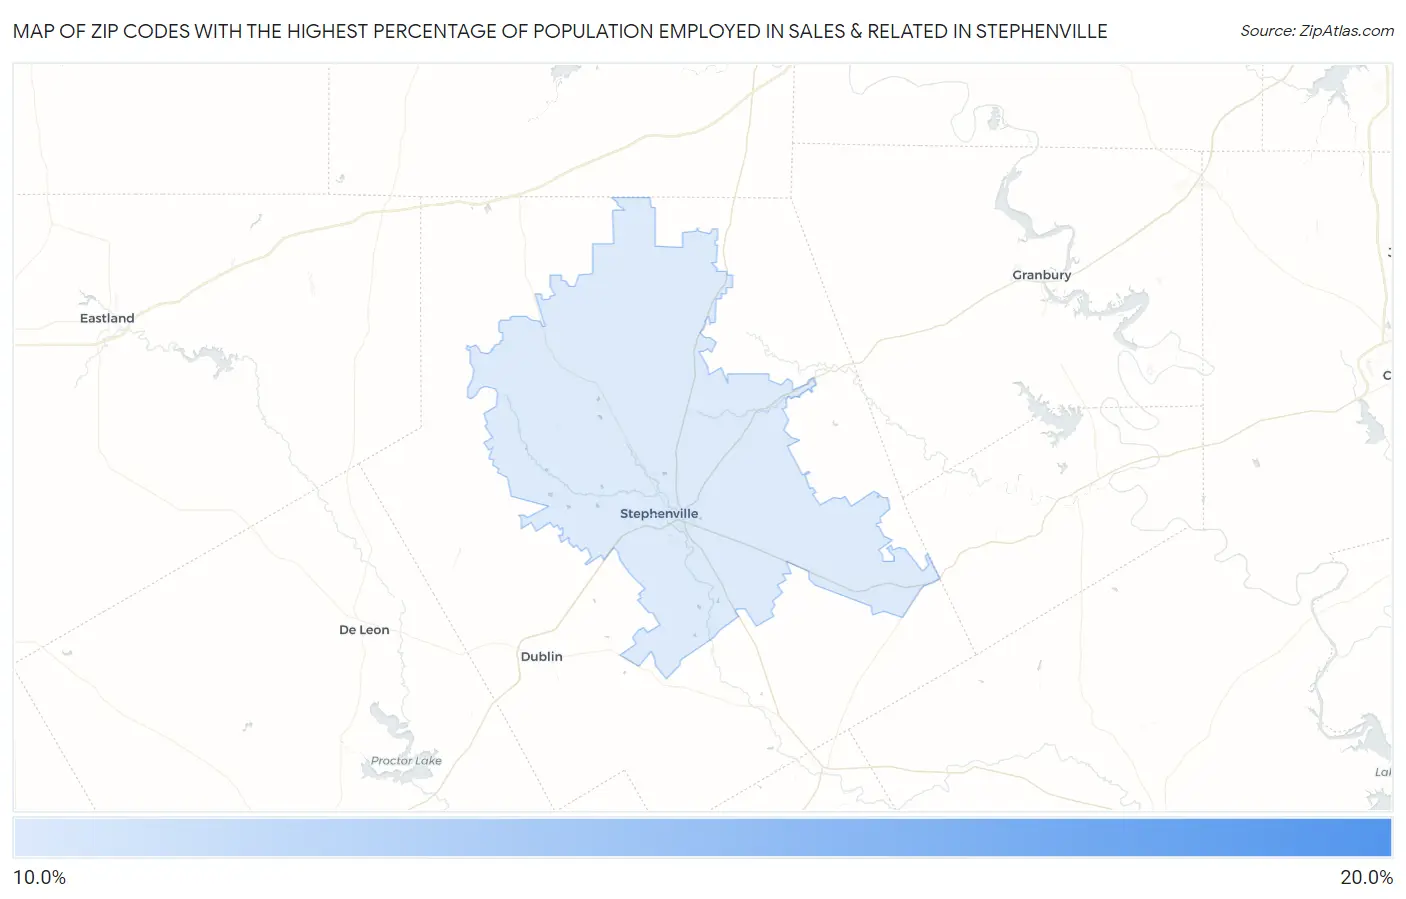
Zip Codes with the Highest Percentage of Population Employed in Sales & Related in Stephenville, TX
RELATED REPORTS & OPTIONS
Sales & Related
Stephenville
Compare Zip Codes
Map of Zip Codes with the Highest Percentage of Population Employed in Sales & Related in Stephenville
10.1%
19.2%
Zip Codes with the Highest Percentage of Population Employed in Sales & Related in Stephenville, TX
| Zip Code | % Employed | vs State | vs National | |
| 1. | 76402 | 19.2% | 10.2%(+8.94)#77 | 9.6%(+9.57)#1,309 |
| 2. | 76401 | 10.1% | 10.2%(-0.076)#758 | 9.6%(+0.553)#10,579 |
1
Common Questions
What are the Top Zip Codes with the Highest Percentage of Population Employed in Sales & Related in Stephenville, TX?
Top Zip Codes with the Highest Percentage of Population Employed in Sales & Related in Stephenville, TX are:
What zip code has the Highest Percentage of Population Employed in Sales & Related in Stephenville, TX?
76402 has the Highest Percentage of Population Employed in Sales & Related in Stephenville, TX with 19.2%.
What is the Percentage of Population Employed in Sales & Related in Stephenville, TX?
Percentage of Population Employed in Sales & Related in Stephenville is 11.2%.
What is the Percentage of Population Employed in Sales & Related in Texas?
Percentage of Population Employed in Sales & Related in Texas is 10.2%.
What is the Percentage of Population Employed in Sales & Related in the United States?
Percentage of Population Employed in Sales & Related in the United States is 9.6%.