Zip Codes with the Most Immigrants from Oceania in Leander, TX
On this page
RELATED REPORTS & OPTIONS
Oceania
Population
Highest PopulationHighest Population DensityLowest Population DensityMale / Female RatioFemale / Male RatioOldest PopulationOldest Population | MaleOldest Population | FemaleYoungest PopulationYoungest Population | MaleYoungest Population | Female
Families and Households
Largest Family SizeLargest Household SizeMost Single FathersMost Single MothersFewest Single FathersFewest Single MothersSmallest Family SizeSmallest Household Size
Female Fertility
Highest Birth Rate | All WomenHighest Birth Rate | Women 35+Highest Birth Rate | Below PovertyHighest Birth Rate | Public IncomeHighest Birth Rate | In Labor ForceLowest Birth Rate | All WomenLowest Birth Rate | Women 35+Lowest Birth Rate | Below PovertyLowest Birth Rate | Public IncomeLowest Birth Rate | In Labor Force
Female Fertility (Unmarried)
Race (Community Size)
Race (Percentage)
Ancestry (Community Size)
AfricanAmericanApacheArabArmenianAustrianBhutaneseBlackfeetBritishBurmeseCanadianCelticCherokeeChoctawCroatianCubanCzechCzechoslovakianDanishDominicanDutchDutch West IndianEastern EuropeanEcuadorianEnglishEthiopianEuropeanFrenchFrench CanadianGermanGreekHungarianIndian (Asian)IranianIrishItalianKoreanLebaneseLithuanianMexicanNorthern EuropeanNorwegianPakistaniPolishPortuguesePuerto RicanRussianSamoanScandinavianScotch-IrishScottishSerbianSlovakSouth AmericanSpaniardSpanishSri LankanSubsaharan AfricanSwedishSwissUkrainianVenezuelanWelsh
Ancestry (Percentage)
AfricanAmericanApacheArabArmenianAustrianBhutaneseBlackfeetBritishBurmeseCanadianCelticCherokeeChoctawCroatianCubanCzechCzechoslovakianDanishDominicanDutchDutch West IndianEastern EuropeanEcuadorianEnglishEthiopianEuropeanFrenchFrench CanadianGermanGreekHungarianIndian (Asian)IranianIrishItalianKoreanLebaneseLithuanianMexicanNorthern EuropeanNorwegianPakistaniPolishPortuguesePuerto RicanRussianSamoanScandinavianScotch-IrishScottishSerbianSlovakSouth AmericanSpaniardSpanishSri LankanSubsaharan AfricanSwedishSwissUkrainianVenezuelanWelsh
Immigrant Origin (Total)
AfricaAsiaAustraliaBrazilCanadaCaribbeanCentral AmericaChinaCubaEastern AsiaEastern EuropeEcuadorEnglandEuropeGermanyIranIraqJapanKoreaLatin AmericaMexicoNorthern EuropeOceaniaPhilippinesPortugalRussiaScotlandSouth AmericaSouth Central AsiaSouth Eastern AsiaSouthern EuropeSpainSwedenTaiwanThailandWestern AsiaWestern Europe
Immigrant Origin (Percentage)
AfricaAsiaAustraliaBrazilCanadaCaribbeanCentral AmericaChinaCubaEastern AsiaEastern EuropeEcuadorEnglandEuropeGermanyIranIraqJapanKoreaLatin AmericaMexicoNorthern EuropeOceaniaPhilippinesPortugalRussiaScotlandSouth AmericaSouth Central AsiaSouth Eastern AsiaSouthern EuropeSpainSwedenTaiwanThailandWestern AsiaWestern Europe
Income
Highest Per Capita IncomeHighest Earnings | MaleHighest Earnings | FemaleHighest Wage/Income Gap ($)Highest Wage/Income Gap (%)Highest Inequality / Gini IndexLowest Per Capita IncomeLowest Earnings | MaleLowest Earnings | FemaleLowest Wage/Income Gap ($)Lowest Wage/Income Gap (%)Lowest Inequality / Gini Index
Income (Families)
Highest Family IncomeLowest Family IncomeFamily Income | $0-10kFamily Income | $100k+Family Income | $200k+
Income (Households)
Highest Household IncomeLowest Household IncomeHousehold Income | $0-10kHousehold Income | $200k+Household Income | $100k+
Poverty
Highest PovertyHighest Poverty | MaleHighest Poverty | FemaleHighest Poverty | Female 18-24Highest Poverty | Female 25-34Highest Poverty | Child 0-5Highest Poverty | Child 0-16Highest Poverty | Boys 0-16Highest Poverty | Girls 0-16Highest Poverty | Seniors 65+Highest Poverty | Seniors 75+ Lowest PovertyLowest Poverty | MaleLowest Poverty | FemaleLowest Poverty | Child 0-5Lowest Poverty | Child 0-16Lowest Poverty | Boys 0-16Lowest Poverty | Girls 0-16Lowest Poverty | Seniors 65+Lowest Poverty | Seniors 75+
Poverty (Families)
Highest Family PovertyHighest Poverty | Married CoupleHighest Poverty | Single MaleHighest Poverty | Single FatherLowest Family PovertyLowest Poverty | Married CoupleLowest Poverty | Single MaleLowest Poverty | Single Father
Unemployment
Highest UnemploymentHighest Unemployment | MaleHighest Unemployment | FemaleHighest Unemployment | Youth < 25Highest Unemployment | Senior > 65Lowest UnemploymentLowest Unemployment | MaleLowest Unemployment | FemaleLowest Unemployment | Youth < 25Lowest Unemployment | Senior > 65
Employment Occupations
Architecture & EngineeringArts, Media & EntertainmentBusiness & FinancialCleaning & MaintenanceCommunity & Social Service Computer & MathematicsComputer, Engineering & ScienceConstruction & ExtractionEducation Instruction & LibraryEducation, Arts & MediaFirefighting & PreventionFood Preparation & ServingHealth Diagnosing & TreatingHealth TechnologistsHealthcare SupportInstallation, Maintenance & RepairLaw EnforcementLegal Services & SupportLife, Physical & Social ScienceManagementMaterial MovingOffice & AdministrationPersonal Care and ServiceProductionSales & RelatedSecurity & ProtectionTransportation
Employment Industries
Accommodation & Food ServicesAdministrative & Support ServicesArts, Entertainment & RecreationConstructionEducational ServicesFinance & InsuranceHealth Care & Social AssistanceInformation & TechnologyManufacturingMining, Quarrying, & ExtractionProfessional & Scientific ServicesPublic AdministrationReal Estate, Rental & LeasingRetail TradeTransportation & WarehousingUtilitiesWholesale Trade
Employer Class
Private Company EmployeesSelf-Employed / IncorporatedSelf-Employed / Not IncorporatedNot-for-profit OrganizationsLocal Government EmployeesState Government EmployeesFederal Government EmployeesUnpaid Family Workers
Commute Time
Longest CommuteLongest Commute | MaleLongest Commute | FemaleShortest CommuteShortest Commute | MaleShortest Commute | Female
Commute Means
School Enrollment
In Private SchoolNursery / PreschoolKindergartenElementary SchoolMiddle SchoolHigh SchoolCollegeUniversity
Education by Degree Field
Computers and MathematicsBio, Nature & AgriculturalPhysical and Health SciencesPsychologySocial SciencesEngineeringMultidisciplinary StudiesScience and EngineeringBusinessEducationLiterature and LanguagesLiberal Arts and HistoryVisual and Performing ArtsCommunicationsArts and Humanities
Occupancy
Finances
Highest Median Housing CostsHighest Property PricesHighest Owner Housing CostsHighest Renter Housing CostsHighest Housing Costs / IncomeLowest Median Housing CostsLowest Property PricesLowest Owner Housing CostsLowest Renter Housing CostsLowest Housing Costs / Income
Physical Characteristics
Leander
States
AlabamaAlaskaArizonaArkansasCaliforniaColoradoConnecticutDelawareDistrict Of ColumbiaFloridaGeorgiaHawaiiIdahoIllinoisIndianaIowaKansasKentuckyLouisianaMaineMarylandMassachusettsMichiganMinnesotaMississippiMissouriMontanaNebraskaNevadaNew HampshireNew JerseyNew MexicoNew YorkNorth CarolinaNorth DakotaOhioOklahomaOregonPennsylvaniaPuerto RicoRhode IslandSouth CarolinaSouth DakotaTennesseeTexasUtahVermontVirginiaWashingtonWest VirginiaWisconsinWyoming
Texas Cities
AbileneAllenArlingtonAustinBaytownBedfordBoerneBryanCarrolltonCollege StationConroeCorpus ChristiDallasDentonEl PasoEulessFlower MoundFort WorthFriscoGalvestonGatesvilleGeorgetownGranburyGrand PrairieHoustonHumbleHuntsvilleIrvingKatyKellerKilleenKingwoodLeanderLewisvilleLubbockMagnoliaMckinneyMesquiteMidlandPlanoRockwallRound RockSan AntonioSpringSugar LandTomballTylerWacoWeatherfordWichita Falls
Compare Zip Codes
Comparison Subject
Compare StatesCompare CitiesCompare Zip Codes
Map of Zip Codes with the Most Immigrants from Oceania in Leander
43
307
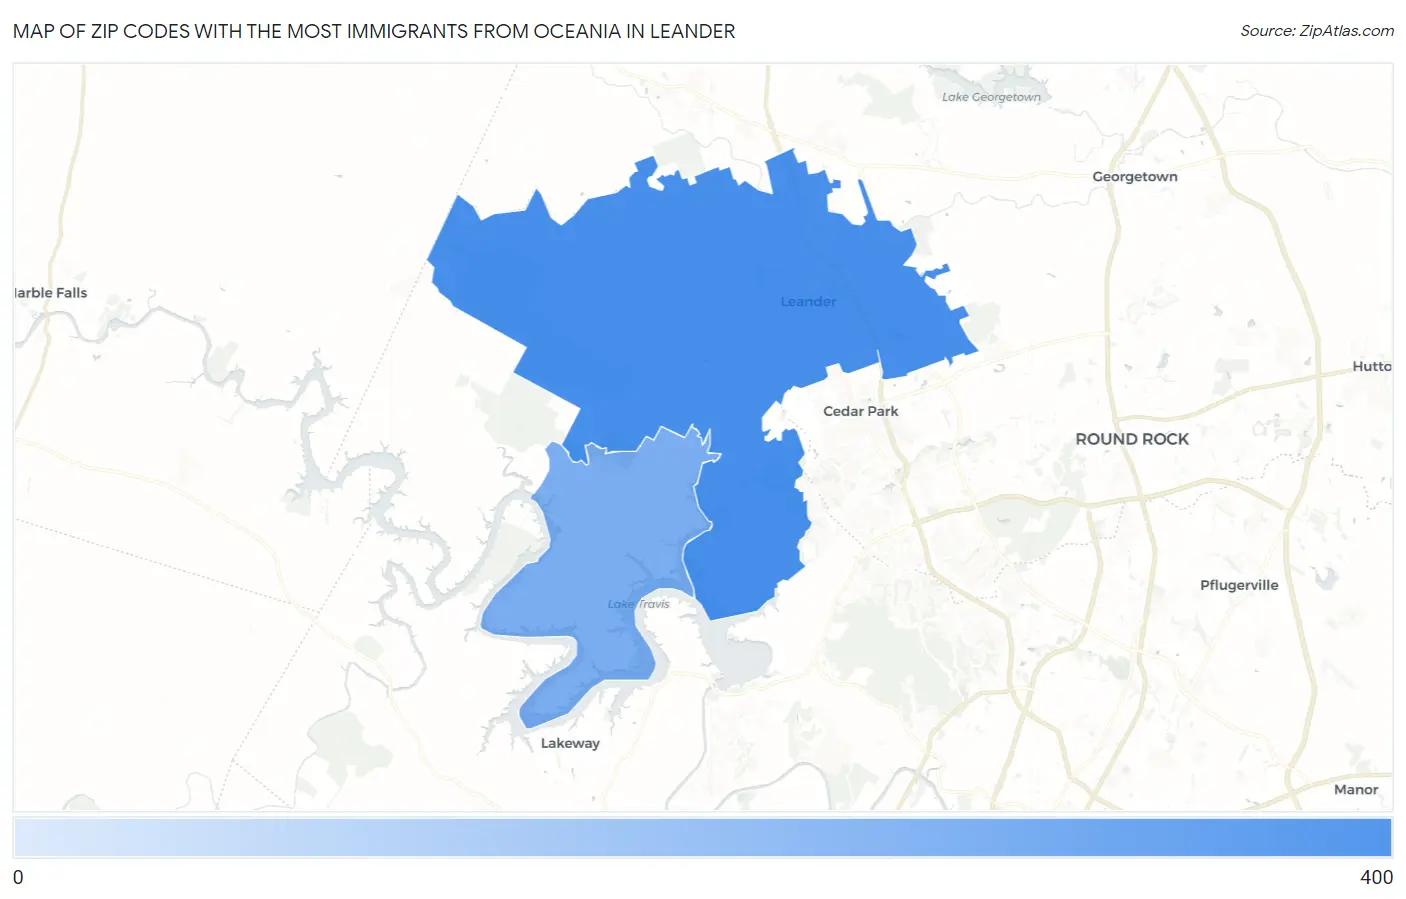
Zip Codes with the Most Immigrants from Oceania in Leander, TX
| Zip Code | Oceania | vs State | vs National | |
| 1. | 78641 | 307 | 14,629(2.10%)#2 | 293,459(0.10%)#118 |
| 2. | 78645 | 43 | 14,629(0.29%)#96 | 293,459(0.01%)#1,579 |
1
Common Questions
What are the Top Zip Codes with the Most Immigrants from Oceania in Leander, TX?
Top Zip Codes with the Most Immigrants from Oceania in Leander, TX are:
What zip code has the Most Immigrants from Oceania in Leander, TX?
78641 has the Most Immigrants from Oceania in Leander, TX with 307.
What is the Total Immigrants from Oceania in Leander, TX?
Total Immigrants from Oceania in Leander is 180.
What is the Total Immigrants from Oceania in Texas?
Total Immigrants from Oceania in Texas is 14,629.
What is the Total Immigrants from Oceania in the United States?
Total Immigrants from Oceania in the United States is 293,459.