Zip Codes with the Highest Percentage of Owner-Occupied Units in Amarillo, TX

RELATED REPORTS & OPTIONS

Highest Owner-Occupied
Population
Families and Households
Female Fertility
Female Fertility (Unmarried)
Race (Community Size)
Race (Percentage)
Ancestry (Community Size)
AfricanAmericanApacheArabArgentineanAustralianAustrianBasqueBelgianBhutaneseBlackfeetBritishBulgarianBurmeseCajunCanadianCelticCentral AmericanCentral American IndianCherokeeChickasawChoctawColombianComancheCreekCroatianCubanCzechCzechoslovakianDanishDominicanDutchDutch West IndianEastern EuropeanEcuadorianEnglishEthiopianEuropeanFinnishFrenchFrench American IndianFrench CanadianGermanGhanaianGreekGuamanian / ChamorroGuatemalanHonduranHungarianIndian (Asian)IndonesianIranianIraqiIrishIroquoisItalianJamaicanKoreanLebaneseLithuanianMalaysianMexicanMexican American IndianNative HawaiianNavajoNigerianNorthern EuropeanNorwegianPakistaniPanamanianPennsylvania GermanPeruvianPolishPortuguesePuerto RicanRomanianRussianSalvadoranSamoanScandinavianScotch-IrishScottishSiouxSlavicSomaliSouth AmericanSpaniardSpanishSpanish AmericanSri LankanSubsaharan AfricanSudaneseSwedishSwissThaiTurkishUkrainianVenezuelanWelshWest IndianYugoslavian
Ancestry (Percentage)
AfricanAmericanApacheArabArgentineanAustralianAustrianBasqueBelgianBhutaneseBlackfeetBritishBulgarianBurmeseCajunCanadianCelticCentral AmericanCentral American IndianCherokeeChickasawChoctawColombianComancheCreekCroatianCubanCzechCzechoslovakianDanishDominicanDutchDutch West IndianEastern EuropeanEcuadorianEnglishEthiopianEuropeanFinnishFrenchFrench American IndianFrench CanadianGermanGhanaianGreekGuamanian / ChamorroGuatemalanHonduranHungarianIndian (Asian)IndonesianIranianIraqiIrishIroquoisItalianJamaicanKoreanLebaneseLithuanianMalaysianMexicanMexican American IndianNative HawaiianNavajoNigerianNorthern EuropeanNorwegianPakistaniPanamanianPennsylvania GermanPeruvianPolishPortuguesePuerto RicanRomanianRussianSalvadoranSamoanScandinavianScotch-IrishScottishSiouxSlavicSomaliSouth AmericanSpaniardSpanishSpanish AmericanSri LankanSubsaharan AfricanSudaneseSwedishSwissThaiTurkishUkrainianVenezuelanWelshWest IndianYugoslavian
Immigrant Origin (Total)
Immigrant Origin (Percentage)
Income
Income (Families)
Income (Households)
Poverty
Poverty (Families)
Unemployment
Employment Occupations
Employment Industries
Employer Class
Commute Time
Commute Means
School Enrollment
Education by Degree Field
Occupancy
Finances
Physical Characteristics
Amarillo
Compare Zip Codes
Comparison Subject

Map of Zip Codes with the Highest Percentage of Owner-Occupied Units in Amarillo

0.84%
89.4%
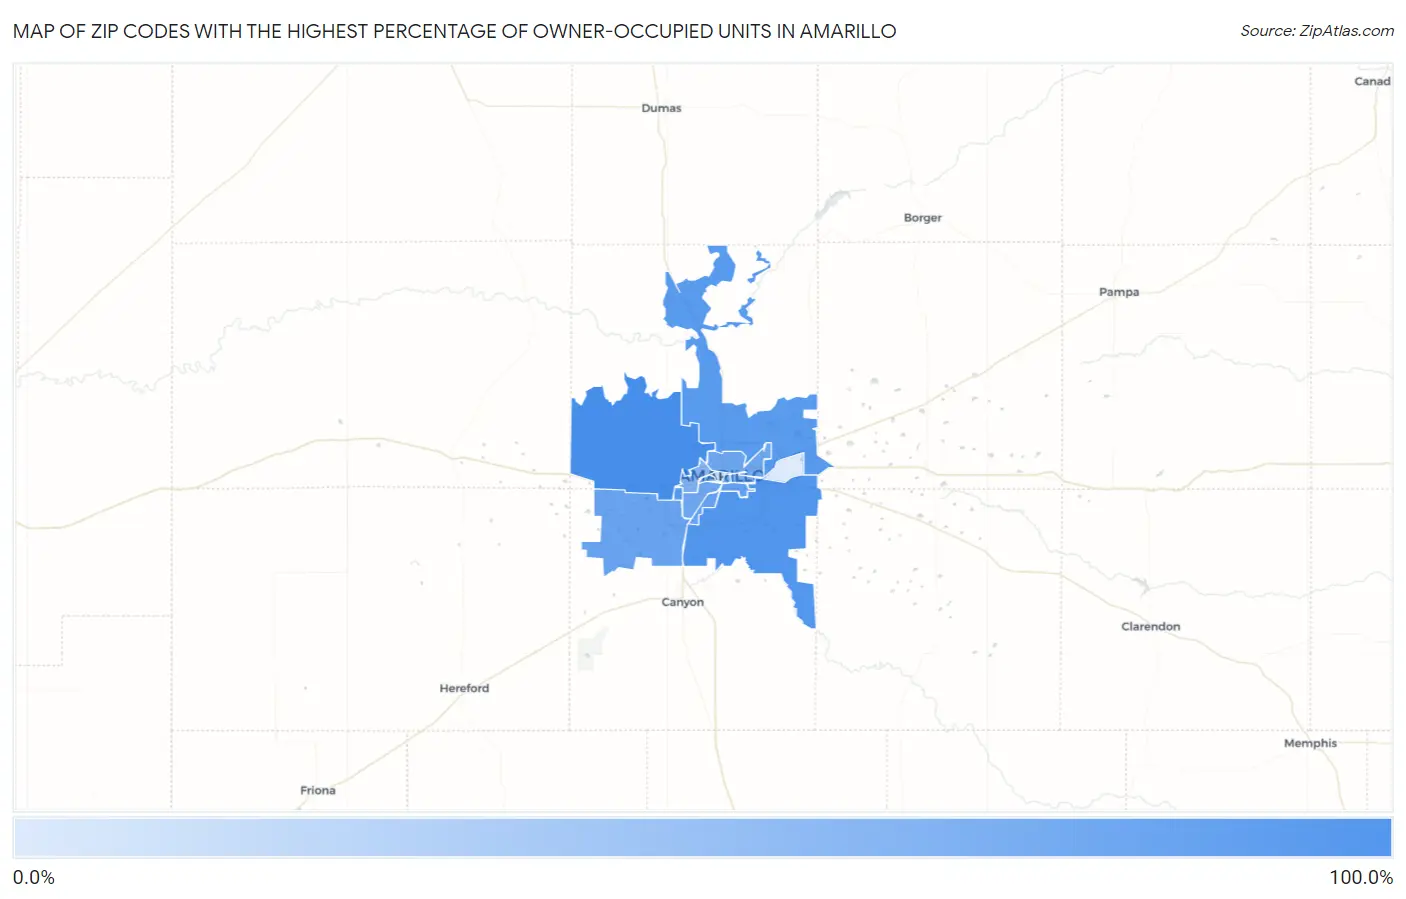
Zip Codes with the Highest Percentage of Owner-Occupied Units in Amarillo Map

Zip Codes with the Highest Percentage of Owner-Occupied Units in Amarillo, TX

Zip Code % Owner-Occupied vs State vs National
1. 79124 89.4% 62.4% (+27.0)#269 64.8% (+24.6)#5,927
2. 79118 80.0% 62.4% (+17.6)#670 64.8% (+15.2)#14,638
3. 79108 76.6% 62.4% (+14.2)#840 64.8% (+11.7)#17,788
4. 79121 74.8% 62.4% (+12.4)#936 64.8% (+10.0)#19,360
5. 79110 67.6% 62.4% (+5.18)#1,236 64.8% (+2.76)#24,200
6. 79103 66.4% 62.4% (+4.02)#1,274 64.8% (+1.60)#24,785
7. 79119 65.1% 62.4% (+2.71)#1,323 64.8% (+0.288)#25,412
8. 79109 60.6% 62.4% (-1.78)#1,440 64.8% (-4.20)#27,234
9. 79107 60.0% 62.4% (-2.38)#1,449 64.8% (-4.80)#27,399
10. 79104 51.2% 62.4% (-11.1)#1,634 64.8% (-13.6)#29,495
11. 79102 48.5% 62.4% (-13.9)#1,678 64.8% (-16.3)#29,974
12. 79106 47.3% 62.4% (-15.1)#1,693 64.8% (-17.5)#30,150
13. 79101 10.2% 62.4% (-52.2)#1,867 64.8% (-54.6)#32,346
14. 79111 0.84% 62.4% (-61.6)#1,881 64.8% (-64.0)#32,495

Common Questions

What are the Top 10 Zip Codes with the Highest Percentage of Owner-Occupied Units in Amarillo, TX?
Top 10 Zip Codes with the Highest Percentage of Owner-Occupied Units in Amarillo, TX are:
#1
89.4%
#2
80.0%
#3
76.6%
#4
74.8%
#5
67.6%
#6
66.4%
#7
65.1%
#8
60.6%
#9
60.0%
#10
51.2%
What zip code has the Highest Percentage of Owner-Occupied Units in Amarillo, TX?
79124 has the Highest Percentage of Owner-Occupied Units in Amarillo, TX with 89.4%.
What is the Percentage of Owner-Occupied Units in Amarillo, TX?
Percentage of Owner-Occupied Units in Amarillo is 59.6%.
What is the Percentage of Owner-Occupied Units in Texas?
Percentage of Owner-Occupied Units in Texas is 62.4%.
What is the Percentage of Owner-Occupied Units in the United States?
Percentage of Owner-Occupied Units in the United States is 64.8%.