Zip Codes with the Highest Percentage of Renter-Occupied Units in Amarillo, TX

RELATED REPORTS & OPTIONS

Highest Renter-Occupied
Population
Families and Households
Female Fertility
Female Fertility (Unmarried)
Race (Community Size)
Race (Percentage)
Ancestry (Community Size)
AfricanAmericanApacheArabArgentineanAustralianAustrianBasqueBelgianBhutaneseBlackfeetBritishBulgarianBurmeseCajunCanadianCelticCentral AmericanCentral American IndianCherokeeChickasawChoctawColombianComancheCreekCroatianCubanCzechCzechoslovakianDanishDominicanDutchDutch West IndianEastern EuropeanEcuadorianEnglishEthiopianEuropeanFinnishFrenchFrench American IndianFrench CanadianGermanGhanaianGreekGuamanian / ChamorroGuatemalanHonduranHungarianIndian (Asian)IndonesianIranianIraqiIrishIroquoisItalianJamaicanKoreanLebaneseLithuanianMalaysianMexicanMexican American IndianNative HawaiianNavajoNigerianNorthern EuropeanNorwegianPakistaniPanamanianPennsylvania GermanPeruvianPolishPortuguesePuerto RicanRomanianRussianSalvadoranSamoanScandinavianScotch-IrishScottishSiouxSlavicSomaliSouth AmericanSpaniardSpanishSpanish AmericanSri LankanSubsaharan AfricanSudaneseSwedishSwissThaiTurkishUkrainianVenezuelanWelshWest IndianYugoslavian
Ancestry (Percentage)
AfricanAmericanApacheArabArgentineanAustralianAustrianBasqueBelgianBhutaneseBlackfeetBritishBulgarianBurmeseCajunCanadianCelticCentral AmericanCentral American IndianCherokeeChickasawChoctawColombianComancheCreekCroatianCubanCzechCzechoslovakianDanishDominicanDutchDutch West IndianEastern EuropeanEcuadorianEnglishEthiopianEuropeanFinnishFrenchFrench American IndianFrench CanadianGermanGhanaianGreekGuamanian / ChamorroGuatemalanHonduranHungarianIndian (Asian)IndonesianIranianIraqiIrishIroquoisItalianJamaicanKoreanLebaneseLithuanianMalaysianMexicanMexican American IndianNative HawaiianNavajoNigerianNorthern EuropeanNorwegianPakistaniPanamanianPennsylvania GermanPeruvianPolishPortuguesePuerto RicanRomanianRussianSalvadoranSamoanScandinavianScotch-IrishScottishSiouxSlavicSomaliSouth AmericanSpaniardSpanishSpanish AmericanSri LankanSubsaharan AfricanSudaneseSwedishSwissThaiTurkishUkrainianVenezuelanWelshWest IndianYugoslavian
Immigrant Origin (Total)
Immigrant Origin (Percentage)
Income
Income (Families)
Income (Households)
Poverty
Poverty (Families)
Unemployment
Employment Occupations
Employment Industries
Employer Class
Commute Time
Commute Means
School Enrollment
Education by Degree Field
Occupancy
Finances
Physical Characteristics
Amarillo
Compare Zip Codes
Comparison Subject

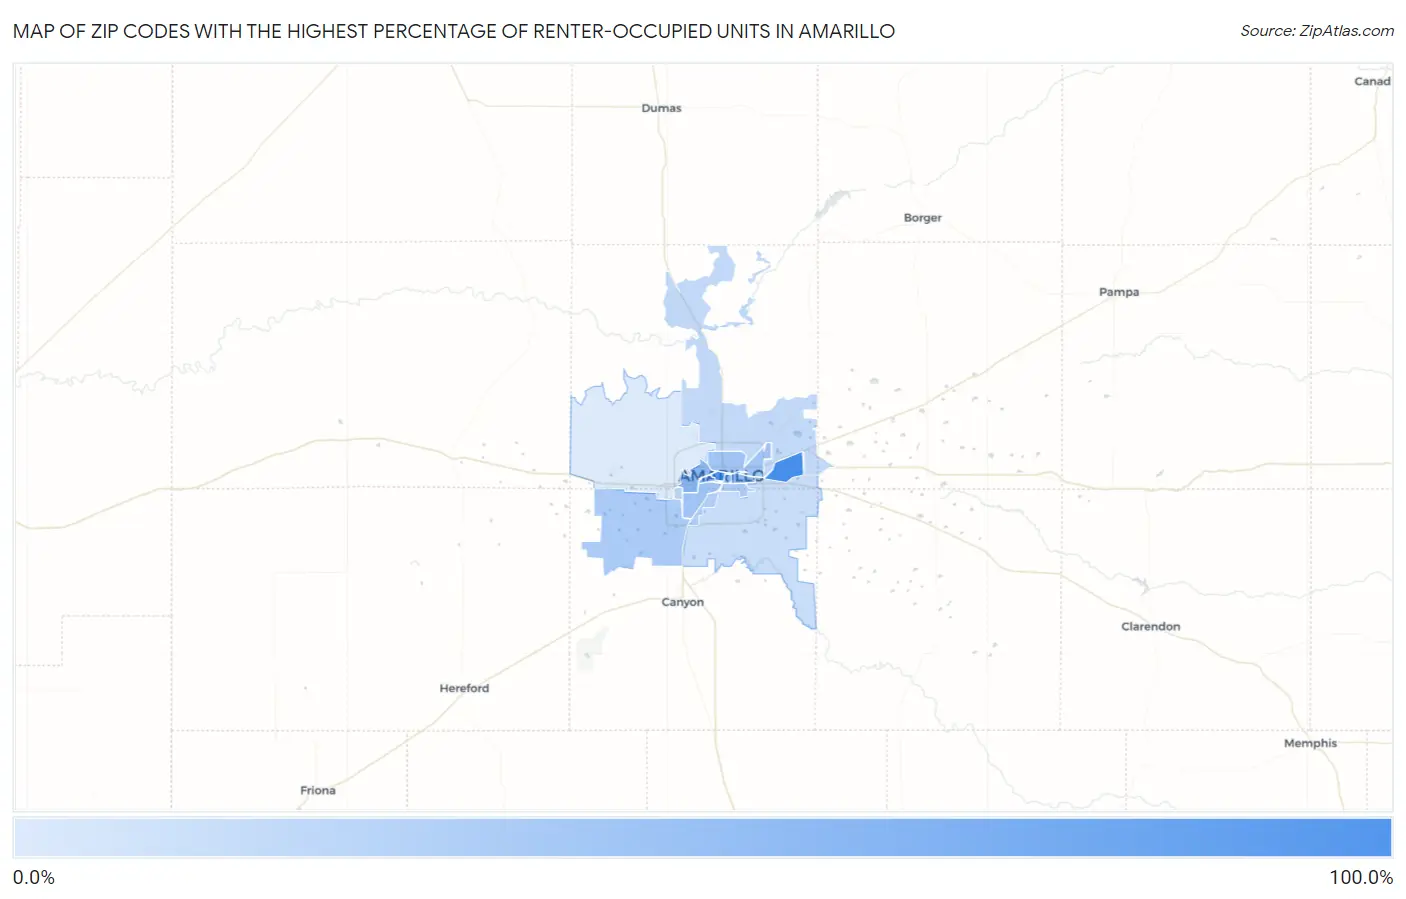
Map of Zip Codes with the Highest Percentage of Renter-Occupied Units in Amarillo

0.0%
100.0%
Zip Codes with the Highest Percentage of Renter-Occupied Units in Amarillo Map

Zip Codes with the Highest Percentage of Renter-Occupied Units in Amarillo, TX

Zip Code % Renter-Occupied vs State vs National
1.7911199.2%37.6%(+61.6)#2535.2%(+64.0)#324
2.7910189.8%37.6%(+52.2)#3935.2%(+54.6)#473
3.7910652.7%37.6%(+15.1)#21335.2%(+17.5)#2,669
4.7910251.5%37.6%(+13.9)#22835.2%(+16.3)#2,845
5.7910448.8%37.6%(+11.1)#27235.2%(+13.6)#3,324
6.7910740.0%37.6%(+2.38)#45735.2%(+4.80)#5,420
7.7910939.4%37.6%(+1.78)#46635.2%(+4.20)#5,585
8.7911934.9%37.6%(-2.71)#58335.2%(-0.288)#7,406
9.7910333.6%37.6%(-4.02)#63235.2%(-1.60)#8,034
10.7911032.4%37.6%(-5.18)#67035.2%(-2.76)#8,619
11.7912125.2%37.6%(-12.4)#97035.2%(-10.0)#13,459
12.7910823.4%37.6%(-14.2)#1,06635.2%(-11.7)#15,031
13.7911820.0%37.6%(-17.6)#1,23635.2%(-15.2)#18,181
14.7912410.6%37.6%(-27.0)#1,63735.2%(-24.6)#26,892

Common Questions

What are the Top 10 Zip Codes with the Highest Percentage of Renter-Occupied Units in Amarillo, TX?
Top 10 Zip Codes with the Highest Percentage of Renter-Occupied Units in Amarillo, TX are:
#1
99.2%
#2
89.8%
#3
52.7%
#4
51.5%
#5
48.8%
#6
40.0%
#7
39.4%
#8
34.9%
#9
33.6%
#10
32.4%
What zip code has the Highest Percentage of Renter-Occupied Units in Amarillo, TX?
79111 has the Highest Percentage of Renter-Occupied Units in Amarillo, TX with 99.2%.
What is the Percentage of Renter-Occupied Units in Amarillo, TX?
Percentage of Renter-Occupied Units in Amarillo is 40.4%.
What is the Percentage of Renter-Occupied Units in Texas?
Percentage of Renter-Occupied Units in Texas is 37.6%.
What is the Percentage of Renter-Occupied Units in the United States?
Percentage of Renter-Occupied Units in the United States is 35.2%.