Zip Codes with the Highest Percentage of Households Without a Vehicle in Amarillo, TX
RELATED REPORTS & OPTIONS
Households without a Cars
Amarillo
Compare Zip Codes
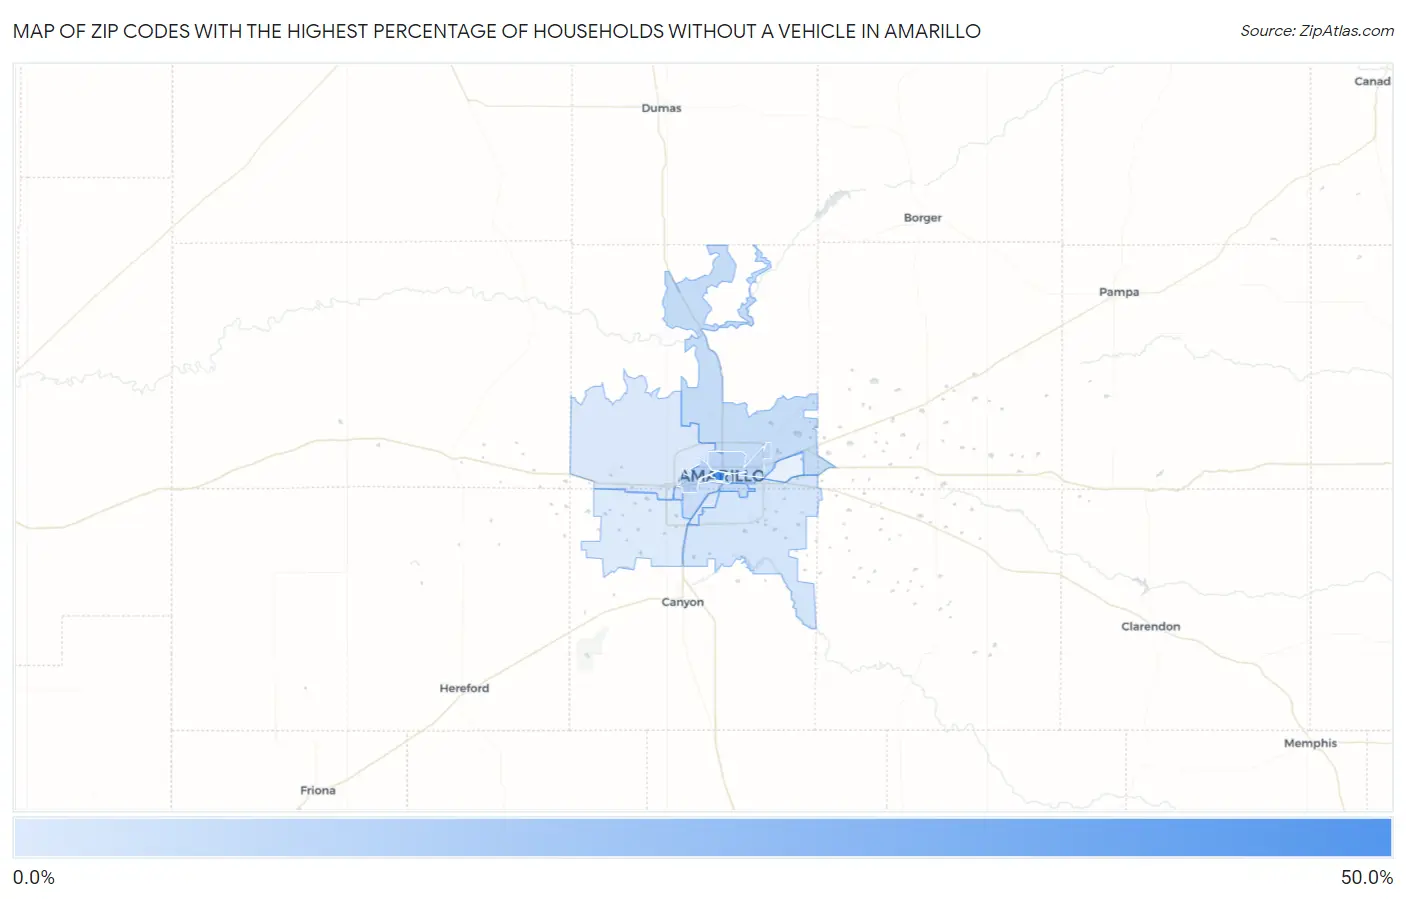
Map of Zip Codes with the Highest Percentage of Households Without a Vehicle in Amarillo
0.60%
42.9%
Zip Codes with the Highest Percentage of Households Without a Vehicle in Amarillo, TX
| Zip Code | Housholds Without a Car | vs State | vs National | |
| 1. | 79101 | 42.9% | 5.3%(+37.6)#6 | 8.3%(+34.6)#453 |
| 2. | 79106 | 10.1% | 5.3%(+4.80)#221 | 8.3%(+1.80)#4,775 |
| 3. | 79107 | 8.4% | 5.3%(+3.10)#311 | 8.3%(+0.100)#6,420 |
| 4. | 79102 | 8.2% | 5.3%(+2.90)#324 | 8.3%(-0.100)#6,685 |
| 5. | 79103 | 6.0% | 5.3%(+0.700)#542 | 8.3%(-2.30)#10,495 |
| 6. | 79108 | 5.9% | 5.3%(+0.600)#553 | 8.3%(-2.40)#10,739 |
| 7. | 79104 | 5.6% | 5.3%(+0.300)#587 | 8.3%(-2.70)#11,440 |
| 8. | 79109 | 5.2% | 5.3%(-0.100)#628 | 8.3%(-3.10)#12,321 |
| 9. | 79118 | 2.6% | 5.3%(-2.70)#1,158 | 8.3%(-5.70)#20,427 |
| 10. | 79121 | 2.4% | 5.3%(-2.90)#1,198 | 8.3%(-5.90)#21,155 |
| 11. | 79110 | 1.1% | 5.3%(-4.20)#1,450 | 8.3%(-7.20)#25,351 |
| 12. | 79124 | 0.90% | 5.3%(-4.40)#1,493 | 8.3%(-7.40)#25,890 |
| 13. | 79119 | 0.60% | 5.3%(-4.70)#1,539 | 8.3%(-7.70)#26,569 |
1
Common Questions
What are the Top 10 Zip Codes with the Highest Percentage of Households Without a Vehicle in Amarillo, TX?
Top 10 Zip Codes with the Highest Percentage of Households Without a Vehicle in Amarillo, TX are:
What zip code has the Highest Percentage of Households Without a Vehicle in Amarillo, TX?
79101 has the Highest Percentage of Households Without a Vehicle in Amarillo, TX with 42.9%.
What is the Percentage of Households Without a Vehicle in Amarillo, TX?
Percentage of Households Without a Vehicle in Amarillo is 6.1%.
What is the Percentage of Households Without a Vehicle in Texas?
Percentage of Households Without a Vehicle in Texas is 5.3%.
What is the Percentage of Households Without a Vehicle in the United States?
Percentage of Households Without a Vehicle in the United States is 8.3%.