Zip Codes with the Highest Percentage of Population with a Degree in Visual and Performing Arts in Beaverton, OR
RELATED REPORTS & OPTIONS
Visual and Performing Arts
Beaverton
Compare Zip Codes
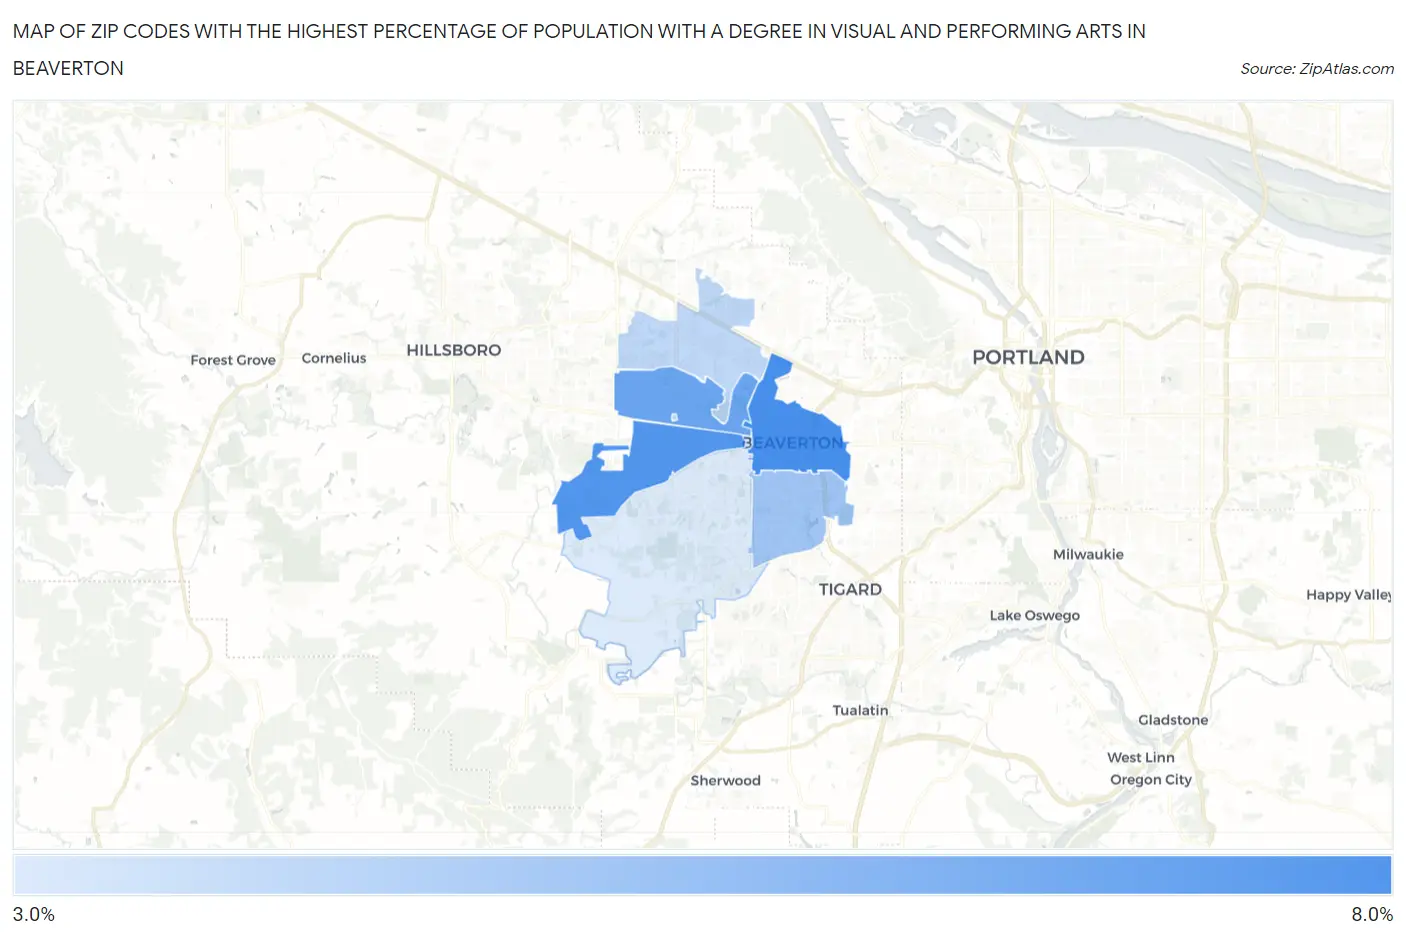
Map of Zip Codes with the Highest Percentage of Population with a Degree in Visual and Performing Arts in Beaverton
3.4%
6.7%
Zip Codes with the Highest Percentage of Population with a Degree in Visual and Performing Arts in Beaverton, OR
| Zip Code | % Graduates | vs State | vs National | |
| 1. | 97005 | 6.7% | 5.7%(+1.06)#70 | 4.3%(+2.48)#3,946 |
| 2. | 97078 | 6.5% | 5.7%(+0.823)#78 | 4.3%(+2.25)#4,225 |
| 3. | 97003 | 5.9% | 5.7%(+0.210)#94 | 4.3%(+1.63)#5,028 |
| 4. | 97008 | 4.7% | 5.7%(-0.947)#132 | 4.3%(+0.477)#7,235 |
| 5. | 97006 | 4.1% | 5.7%(-1.62)#163 | 4.3%(-0.199)#9,074 |
| 6. | 97007 | 3.4% | 5.7%(-2.25)#193 | 4.3%(-0.828)#11,164 |
1
Common Questions
What are the Top 5 Zip Codes with the Highest Percentage of Population with a Degree in Visual and Performing Arts in Beaverton, OR?
Top 5 Zip Codes with the Highest Percentage of Population with a Degree in Visual and Performing Arts in Beaverton, OR are:
What zip code has the Highest Percentage of Population with a Degree in Visual and Performing Arts in Beaverton, OR?
97005 has the Highest Percentage of Population with a Degree in Visual and Performing Arts in Beaverton, OR with 6.7%.
What is the Percentage of Population with a Degree in Visual and Performing Arts in Beaverton, OR?
Percentage of Population with a Degree in Visual and Performing Arts in Beaverton is 5.0%.
What is the Percentage of Population with a Degree in Visual and Performing Arts in Oregon?
Percentage of Population with a Degree in Visual and Performing Arts in Oregon is 5.7%.
What is the Percentage of Population with a Degree in Visual and Performing Arts in the United States?
Percentage of Population with a Degree in Visual and Performing Arts in the United States is 4.3%.