Zip Codes with the Highest Percentage of Population Employed in Installation, Maintenance & Repair in Beaverton, OR
RELATED REPORTS & OPTIONS
Installation, Maintenance & Repair
Beaverton
Compare Zip Codes
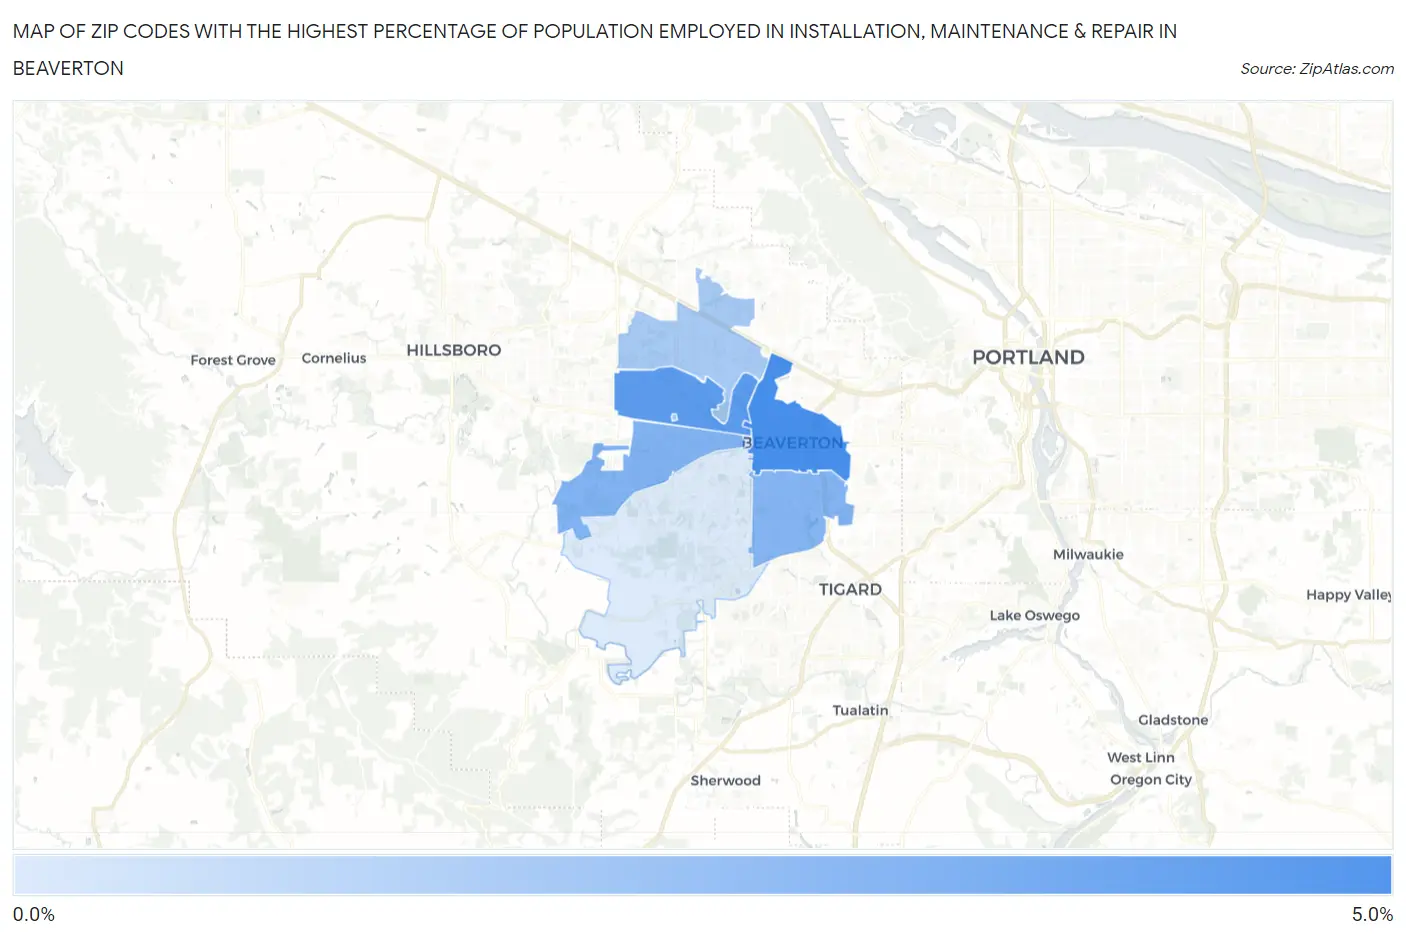
Map of Zip Codes with the Highest Percentage of Population Employed in Installation, Maintenance & Repair in Beaverton
1.00%
4.4%
Zip Codes with the Highest Percentage of Population Employed in Installation, Maintenance & Repair in Beaverton, OR
| Zip Code | % Employed | vs State | vs National | |
| 1. | 97005 | 4.4% | 2.7%(+1.64)#96 | 3.1%(+1.28)#10,945 |
| 2. | 97003 | 3.9% | 2.7%(+1.21)#114 | 3.1%(+0.859)#12,680 |
| 3. | 97078 | 3.0% | 2.7%(+0.324)#173 | 3.1%(-0.030)#16,809 |
| 4. | 97008 | 2.9% | 2.7%(+0.217)#178 | 3.1%(-0.137)#17,347 |
| 5. | 97006 | 2.2% | 2.7%(-0.561)#222 | 3.1%(-0.915)#21,295 |
| 6. | 97007 | 1.00% | 2.7%(-1.72)#302 | 3.1%(-2.07)#25,939 |
1
Common Questions
What are the Top 5 Zip Codes with the Highest Percentage of Population Employed in Installation, Maintenance & Repair in Beaverton, OR?
Top 5 Zip Codes with the Highest Percentage of Population Employed in Installation, Maintenance & Repair in Beaverton, OR are:
What zip code has the Highest Percentage of Population Employed in Installation, Maintenance & Repair in Beaverton, OR?
97005 has the Highest Percentage of Population Employed in Installation, Maintenance & Repair in Beaverton, OR with 4.4%.
What is the Percentage of Population Employed in Installation, Maintenance & Repair in Beaverton, OR?
Percentage of Population Employed in Installation, Maintenance & Repair in Beaverton is 2.1%.
What is the Percentage of Population Employed in Installation, Maintenance & Repair in Oregon?
Percentage of Population Employed in Installation, Maintenance & Repair in Oregon is 2.7%.
What is the Percentage of Population Employed in Installation, Maintenance & Repair in the United States?
Percentage of Population Employed in Installation, Maintenance & Repair in the United States is 3.1%.