Zip Codes with the Highest Percentage of Population Employed in Office & Administration in Lawton, OK

RELATED REPORTS & OPTIONS

Office & Administration
Population
Families and Households
Female Fertility
Female Fertility (Unmarried)
Race (Community Size)
Race (Percentage)
Ancestry (Community Size)
AfricanAmericanApacheArabArapahoAustralianAustrianBelgianBhutaneseBlackfeetBritishBritish West IndianBurmeseCanadianCentral AmericanCentral American IndianCherokeeCheyenneChickasawChileanChoctawColombianComancheCreekCrowCubanCzechCzechoslovakianDanishDelawareDominicanDutchDutch West IndianEastern EuropeanEnglishEuropeanFinnishFrenchFrench CanadianGermanGreekGuamanian / ChamorroGuatemalanHoumaHungarianIndian (Asian)IrishIroquoisItalianJamaicanKiowaKoreanLebaneseLithuanianMexicanMexican American IndianNative HawaiianNavajoNorthern EuropeanNorwegianPakistaniPanamanianPolishPortuguesePotawatomiPuerto RicanRomanianRussianSamoanScandinavianScotch-IrishScottishSeminoleSerbianShoshoneSiouxSouth AfricanSouth AmericanSpaniardSpanishSri LankanSubsaharan AfricanSwedishSwissThaiTurkishUkrainianWelshYugoslavian
Ancestry (Percentage)
AfricanAmericanApacheArabArapahoAustralianAustrianBelgianBhutaneseBlackfeetBritishBritish West IndianBurmeseCanadianCentral AmericanCentral American IndianCherokeeCheyenneChickasawChileanChoctawColombianComancheCreekCrowCubanCzechCzechoslovakianDanishDelawareDominicanDutchDutch West IndianEastern EuropeanEnglishEuropeanFinnishFrenchFrench CanadianGermanGreekGuamanian / ChamorroGuatemalanHoumaHungarianIndian (Asian)IrishIroquoisItalianJamaicanKiowaKoreanLebaneseLithuanianMexicanMexican American IndianNative HawaiianNavajoNorthern EuropeanNorwegianPakistaniPanamanianPolishPortuguesePotawatomiPuerto RicanRomanianRussianSamoanScandinavianScotch-IrishScottishSeminoleSerbianShoshoneSiouxSouth AfricanSouth AmericanSpaniardSpanishSri LankanSubsaharan AfricanSwedishSwissThaiTurkishUkrainianWelshYugoslavian
Immigrant Origin (Total)
Immigrant Origin (Percentage)
Income
Income (Families)
Income (Households)
Poverty
Poverty (Families)
Unemployment
Employment Occupations
Employment Industries
Employer Class
Commute Time
Commute Means
School Enrollment
Education by Degree Field
Occupancy
Finances
Physical Characteristics
Lawton
Compare Zip Codes
Comparison Subject

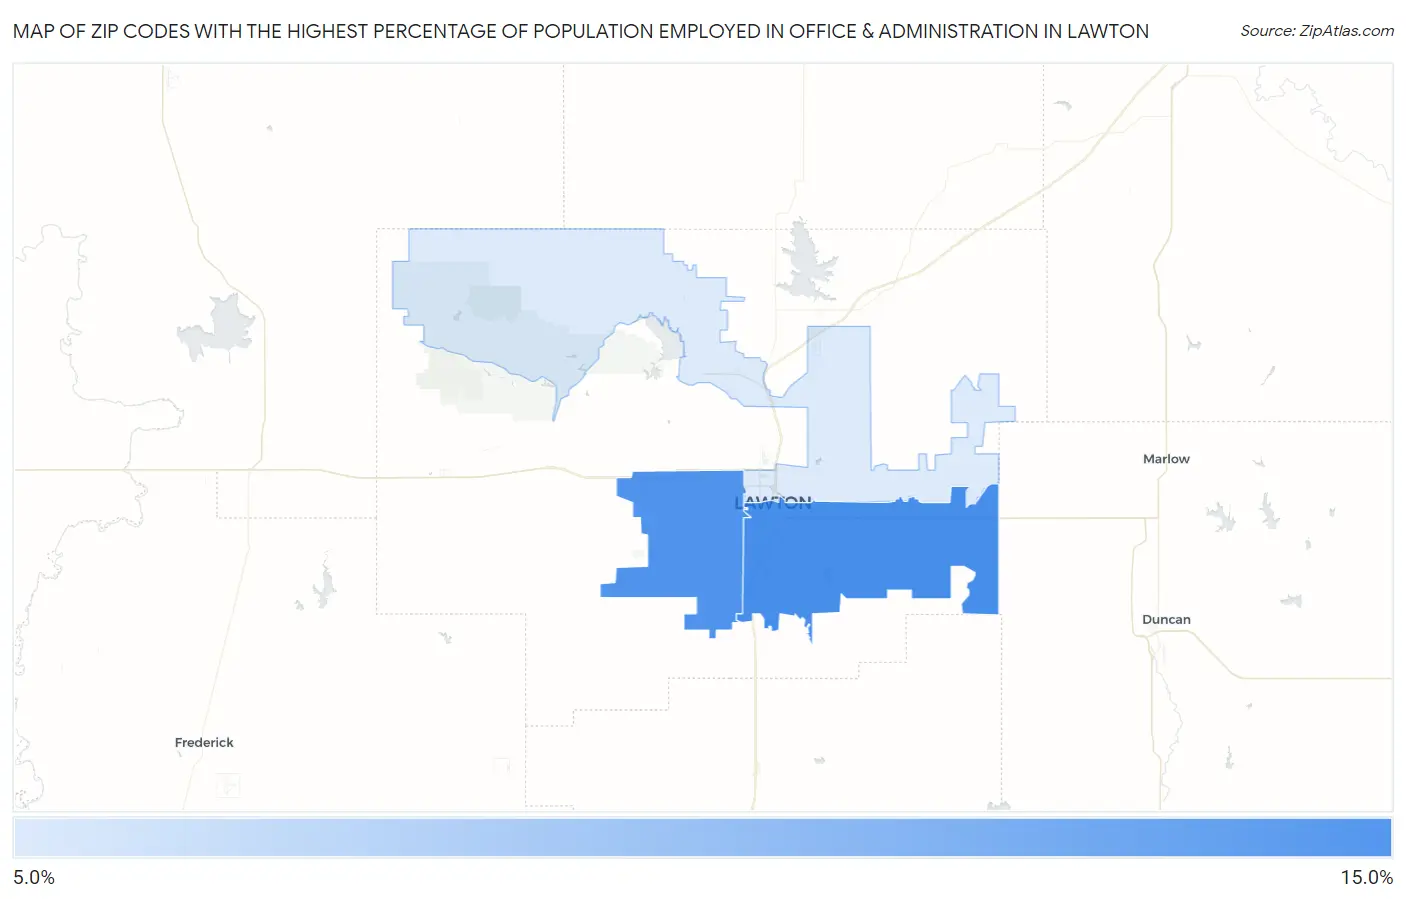
Map of Zip Codes with the Highest Percentage of Population Employed in Office & Administration in Lawton

0.0%
15.0%
Zip Codes with the Highest Percentage of Population Employed in Office & Administration in Lawton Map

Zip Codes with the Highest Percentage of Population Employed in Office & Administration in Lawton, OK

Zip Code % Employed vs State vs National
1.7350113.2%11.5%(+1.63)#16410.9%(+2.31)#7,652
2.7350512.9%11.5%(+1.38)#18410.9%(+2.06)#8,259
3.735079.2%11.5%(-2.37)#44310.9%(-1.68)#19,741

Common Questions

What are the Top Zip Codes with the Highest Percentage of Population Employed in Office & Administration in Lawton, OK?
Top Zip Codes with the Highest Percentage of Population Employed in Office & Administration in Lawton, OK are:
#1
13.2%
#2
12.9%
#3
9.2%
What zip code has the Highest Percentage of Population Employed in Office & Administration in Lawton, OK?
73501 has the Highest Percentage of Population Employed in Office & Administration in Lawton, OK with 13.2%.
What is the Percentage of Population Employed in Office & Administration in Lawton, OK?
Percentage of Population Employed in Office & Administration in Lawton is 11.9%.
What is the Percentage of Population Employed in Office & Administration in Oklahoma?
Percentage of Population Employed in Office & Administration in Oklahoma is 11.5%.
What is the Percentage of Population Employed in Office & Administration in the United States?
Percentage of Population Employed in Office & Administration in the United States is 10.9%.