Zip Codes with the Highest Percentage of Immigrants from Eastern Asia in Edmond, OK
RELATED REPORTS & OPTIONS
Eastern Asia
Edmond
Compare Zip Codes
Map of Zip Codes with the Highest Percentage of Immigrants from Eastern Asia in Edmond
0.37%
1.38%
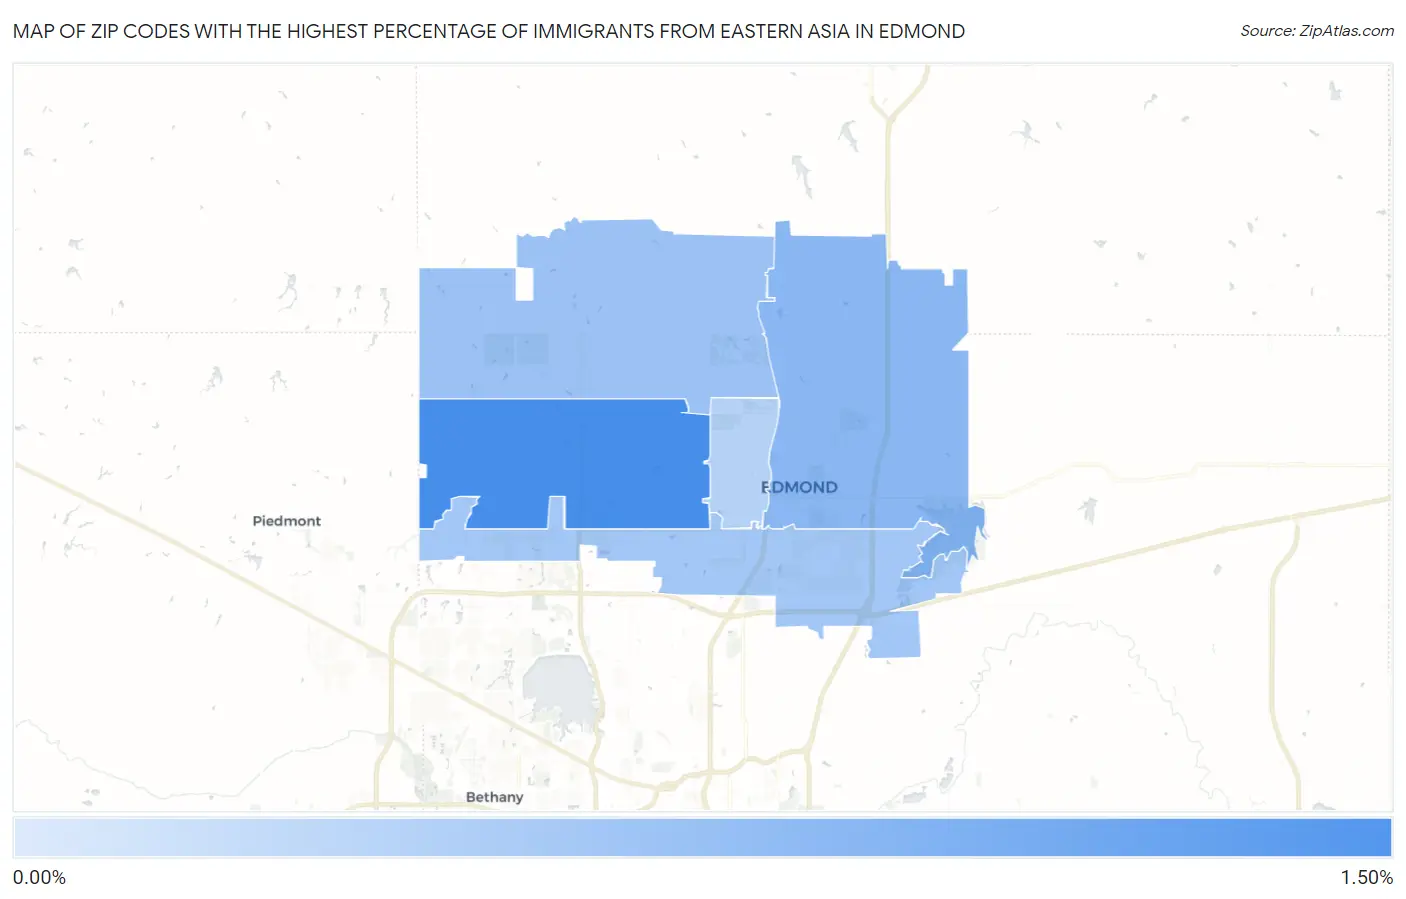
Zip Codes with the Highest Percentage of Immigrants from Eastern Asia in Edmond, OK
| Zip Code | Eastern Asia | vs State | vs National | |
| 1. | 73012 | 1.38% | 0.37% (+1.01)#13 | 1.28% (+0.104)#2,894 |
| 2. | 73034 | 0.76% | 0.37% (+0.388)#49 | 1.28% (-0.514)#4,893 |
| 3. | 73025 | 0.60% | 0.37% (+0.222)#59 | 1.28% (-0.680)#5,856 |
| 4. | 73013 | 0.53% | 0.37% (+0.159)#68 | 1.28% (-0.743)#6,328 |
| 5. | 73003 | 0.37% | 0.37% (-0.005)#93 | 1.28% (-0.907)#7,930 |
1
Common Questions
What are the Top 3 Zip Codes with the Highest Percentage of Immigrants from Eastern Asia in Edmond, OK?
Top 3 Zip Codes with the Highest Percentage of Immigrants from Eastern Asia in Edmond, OK are:
What zip code has the Highest Percentage of Immigrants from Eastern Asia in Edmond, OK?
73012 has the Highest Percentage of Immigrants from Eastern Asia in Edmond, OK with 1.38%.
What is the Percentage of Immigrants from Eastern Asia in Edmond, OK?
Percentage of Immigrants from Eastern Asia in Edmond is 0.72%.
What is the Percentage of Immigrants from Eastern Asia in Oklahoma?
Percentage of Immigrants from Eastern Asia in Oklahoma is 0.37%.
What is the Percentage of Immigrants from Eastern Asia in the United States?
Percentage of Immigrants from Eastern Asia in the United States is 1.28%.