Zip Codes with the Highest Percentage of Households Heated by Electricity in Gardnerville, NV
RELATED REPORTS & OPTIONS
Electrical Heating
Gardnerville
Compare Zip Codes
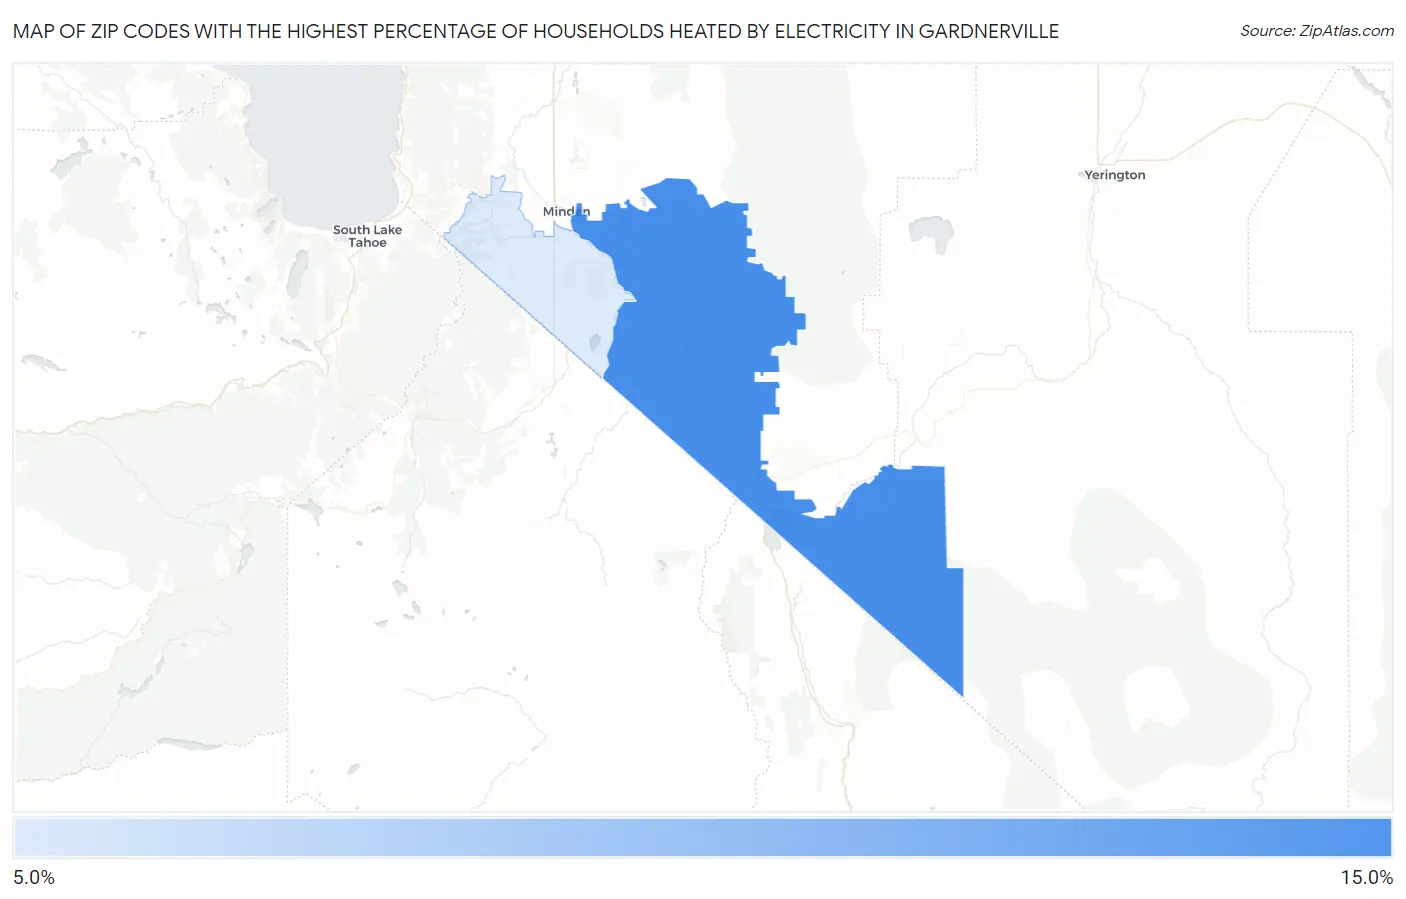
Map of Zip Codes with the Highest Percentage of Households Heated by Electricity in Gardnerville
11.8%
14.6%
Zip Codes with the Highest Percentage of Households Heated by Electricity in Gardnerville, NV
| Zip Code | Electrical Heating | vs State | vs National | |
| 1. | 89410 | 14.6% | 35.8%(-21.2)#146 | 40.2%(-25.6)#23,472 |
| 2. | 89460 | 11.8% | 35.8%(-24.0)#152 | 40.2%(-28.4)#25,235 |
1
Common Questions
What are the Top Zip Codes with the Highest Percentage of Households Heated by Electricity in Gardnerville, NV?
Top Zip Codes with the Highest Percentage of Households Heated by Electricity in Gardnerville, NV are:
What zip code has the Highest Percentage of Households Heated by Electricity in Gardnerville, NV?
89410 has the Highest Percentage of Households Heated by Electricity in Gardnerville, NV with 14.6%.
What is the Percentage of Households Heated by Electricity in Gardnerville, NV?
Percentage of Households Heated by Electricity in Gardnerville is 12.2%.
What is the Percentage of Households Heated by Electricity in Nevada?
Percentage of Households Heated by Electricity in Nevada is 35.8%.
What is the Percentage of Households Heated by Electricity in the United States?
Percentage of Households Heated by Electricity in the United States is 40.2%.