Zip Codes with the Highest Percentage of Population Employed in Agriculture, Fishing & Hunting in Gardnerville, NV
RELATED REPORTS & OPTIONS
Agriculture, Fishing & Hunting
Gardnerville
Compare Zip Codes
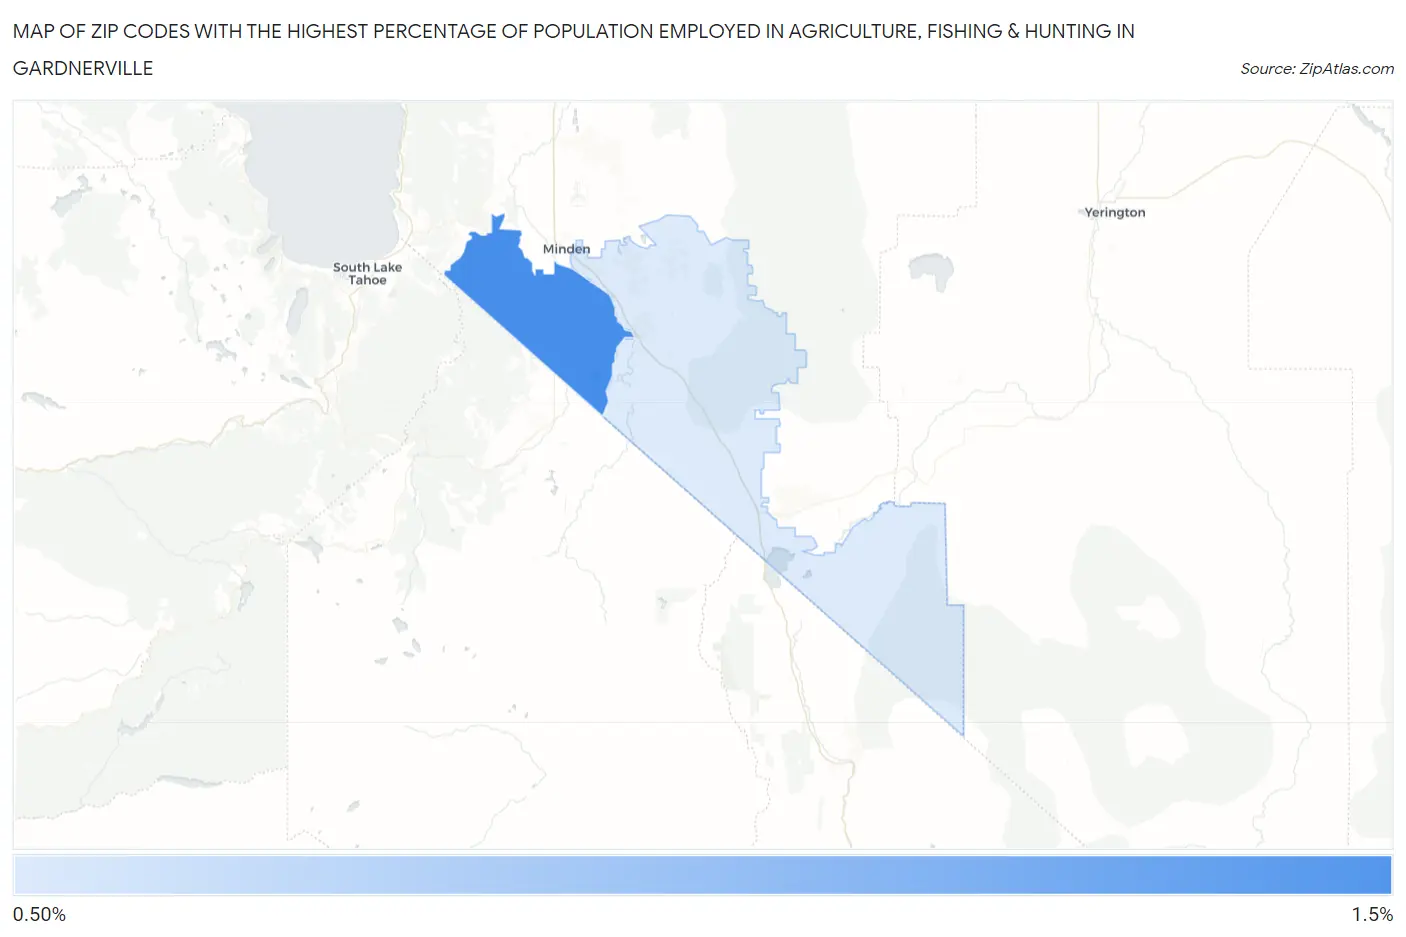
Map of Zip Codes with the Highest Percentage of Population Employed in Agriculture, Fishing & Hunting in Gardnerville
0.86%
1.2%
Zip Codes with the Highest Percentage of Population Employed in Agriculture, Fishing & Hunting in Gardnerville, NV
| Zip Code | % Employed | vs State | vs National | |
| 1. | 89460 | 1.2% | 0.40%(+0.837)#39 | 1.2%(+0.034)#15,280 |
| 2. | 89410 | 0.86% | 0.40%(+0.464)#42 | 1.2%(-0.339)#16,922 |
1
Common Questions
What are the Top Zip Codes with the Highest Percentage of Population Employed in Agriculture, Fishing & Hunting in Gardnerville, NV?
Top Zip Codes with the Highest Percentage of Population Employed in Agriculture, Fishing & Hunting in Gardnerville, NV are:
What zip code has the Highest Percentage of Population Employed in Agriculture, Fishing & Hunting in Gardnerville, NV?
89460 has the Highest Percentage of Population Employed in Agriculture, Fishing & Hunting in Gardnerville, NV with 1.2%.
What is the Percentage of Population Employed in Agriculture, Fishing & Hunting in Gardnerville, NV?
Percentage of Population Employed in Agriculture, Fishing & Hunting in Gardnerville is 1.2%.
What is the Percentage of Population Employed in Agriculture, Fishing & Hunting in Nevada?
Percentage of Population Employed in Agriculture, Fishing & Hunting in Nevada is 0.40%.
What is the Percentage of Population Employed in Agriculture, Fishing & Hunting in the United States?
Percentage of Population Employed in Agriculture, Fishing & Hunting in the United States is 1.2%.