Zip Codes with the Highest Percentage of Self-Employed / Incorporated in Gardnerville, NV
RELATED REPORTS & OPTIONS
Self-Employed / Incorporated
Gardnerville
Compare Zip Codes
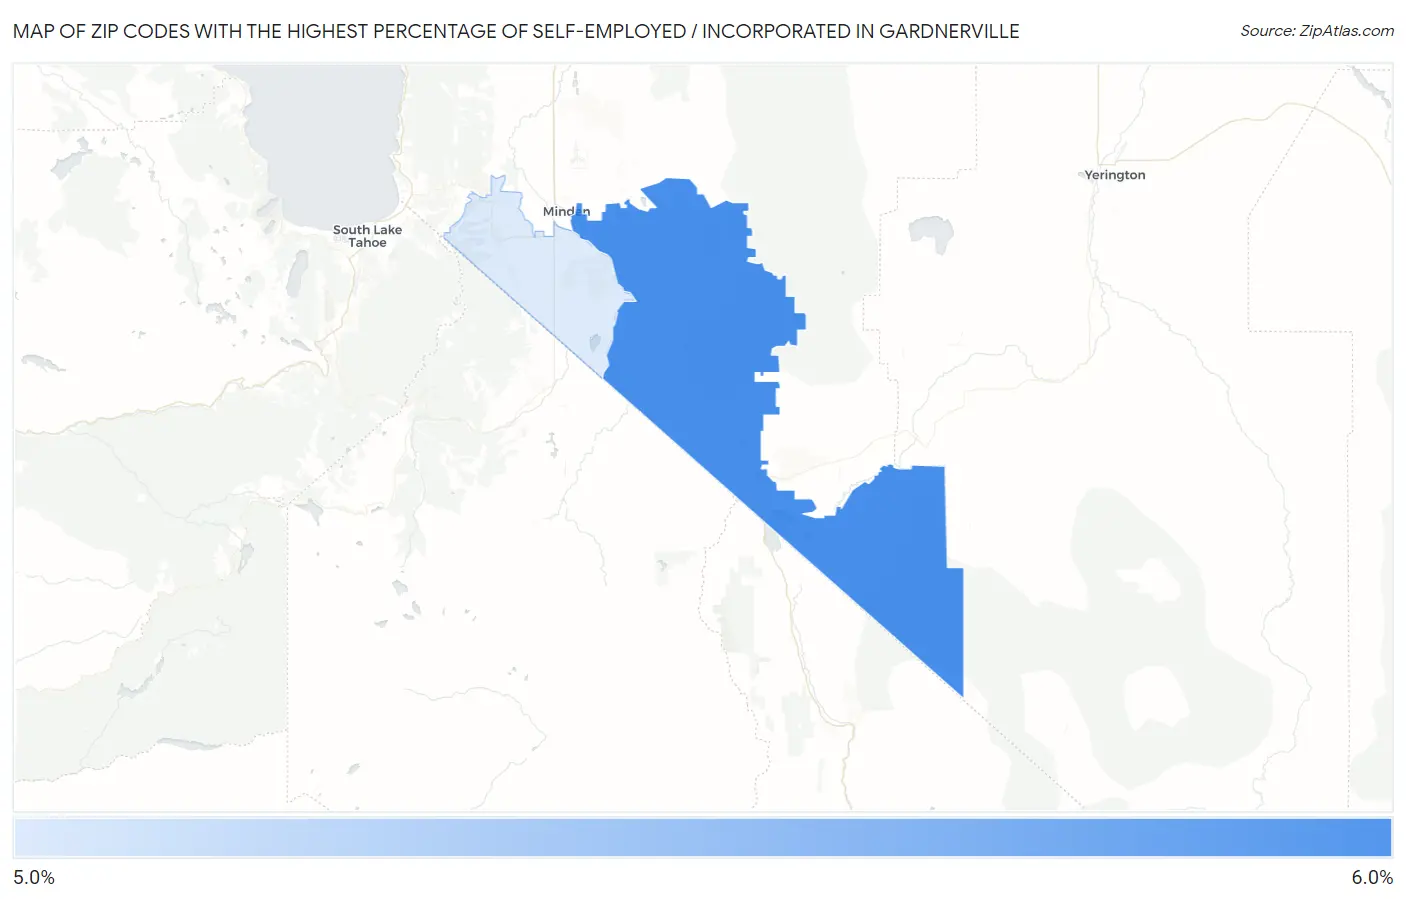
Map of Zip Codes with the Highest Percentage of Self-Employed / Incorporated in Gardnerville
0.0%
6.0%
Zip Codes with the Highest Percentage of Self-Employed / Incorporated in Gardnerville, NV
| Zip Code | % Self-Employed / Incorporated | vs State | vs National | |
| 1. | 89410 | 5.8% | 3.7%(+2.12)#36 | 3.8%(+2.01)#6,654 |
| 2. | 89460 | 5.8% | 3.7%(+2.07)#38 | 3.8%(+1.96)#6,750 |
1
Common Questions
What are the Top Zip Codes with the Highest Percentage of Self-Employed / Incorporated in Gardnerville, NV?
Top Zip Codes with the Highest Percentage of Self-Employed / Incorporated in Gardnerville, NV are:
What zip code has the Highest Percentage of Self-Employed / Incorporated in Gardnerville, NV?
89410 has the Highest Percentage of Self-Employed / Incorporated in Gardnerville, NV with 5.8%.
What is the Percentage of Self-Employed / Incorporated in Gardnerville, NV?
Percentage of Self-Employed / Incorporated in Gardnerville is 5.9%.
What is the Percentage of Self-Employed / Incorporated in Nevada?
Percentage of Self-Employed / Incorporated in Nevada is 3.7%.
What is the Percentage of Self-Employed / Incorporated in the United States?
Percentage of Self-Employed / Incorporated in the United States is 3.8%.