Zip Codes with the Highest Percentage of Population Employed in Professional & Scientific Services in Gardnerville, NV
RELATED REPORTS & OPTIONS
Professional & Scientific Services
Gardnerville
Compare Zip Codes
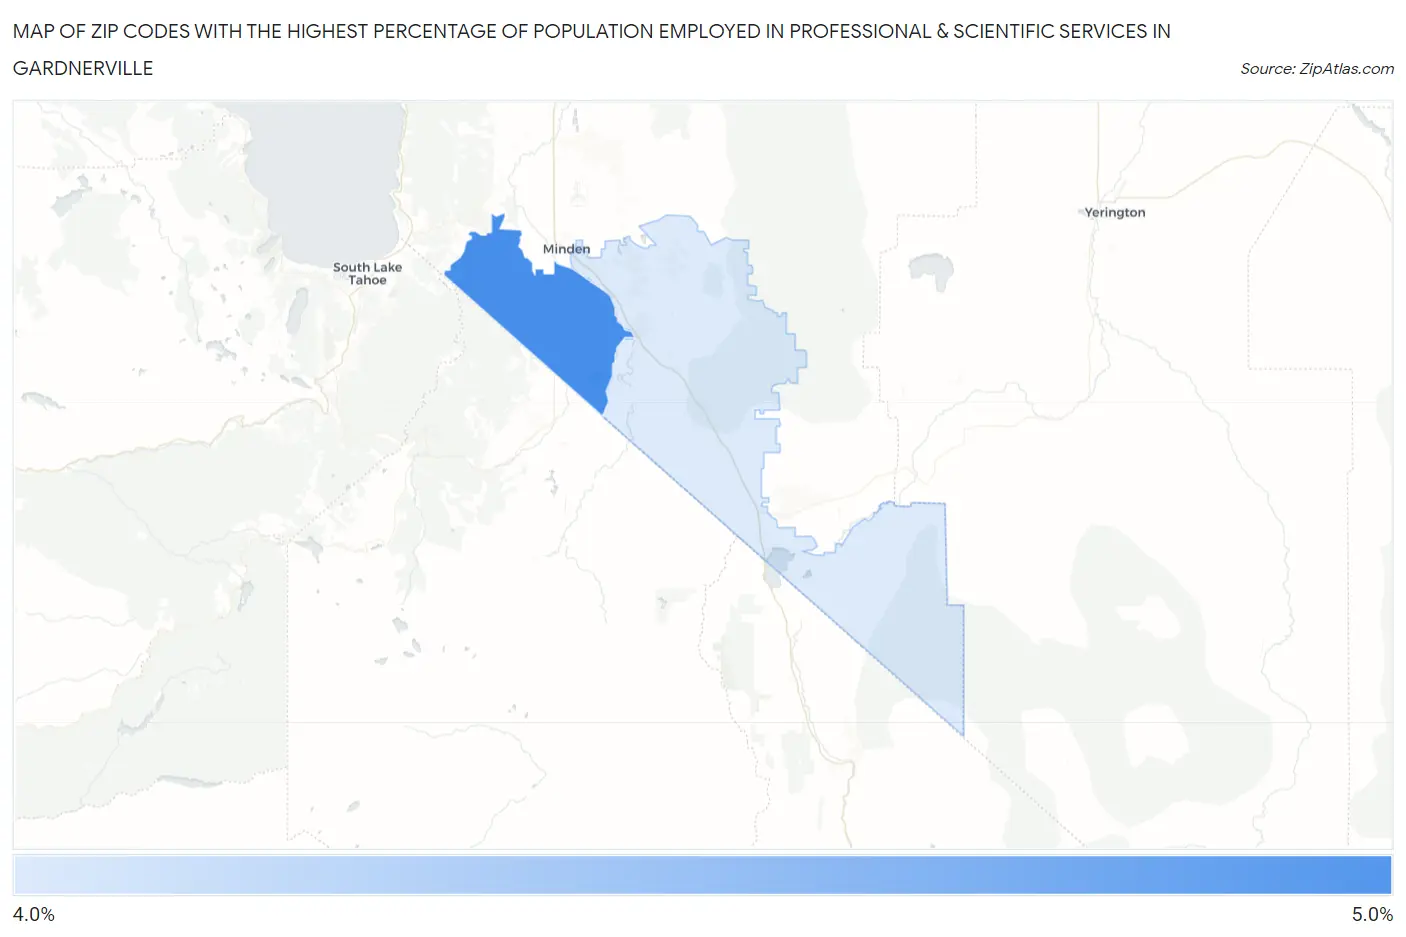
Map of Zip Codes with the Highest Percentage of Population Employed in Professional & Scientific Services in Gardnerville
4.8%
4.8%
Zip Codes with the Highest Percentage of Population Employed in Professional & Scientific Services in Gardnerville, NV
| Zip Code | % Employed | vs State | vs National | |
| 1. | 89460 | 4.8% | 6.3%(-1.54)#83 | 7.8%(-3.06)#12,868 |
| 2. | 89410 | 4.8% | 6.3%(-1.55)#85 | 7.8%(-3.08)#12,909 |
1
Common Questions
What are the Top Zip Codes with the Highest Percentage of Population Employed in Professional & Scientific Services in Gardnerville, NV?
Top Zip Codes with the Highest Percentage of Population Employed in Professional & Scientific Services in Gardnerville, NV are:
What zip code has the Highest Percentage of Population Employed in Professional & Scientific Services in Gardnerville, NV?
89460 has the Highest Percentage of Population Employed in Professional & Scientific Services in Gardnerville, NV with 4.8%.
What is the Percentage of Population Employed in Professional & Scientific Services in Gardnerville, NV?
Percentage of Population Employed in Professional & Scientific Services in Gardnerville is 1.3%.
What is the Percentage of Population Employed in Professional & Scientific Services in Nevada?
Percentage of Population Employed in Professional & Scientific Services in Nevada is 6.3%.
What is the Percentage of Population Employed in Professional & Scientific Services in the United States?
Percentage of Population Employed in Professional & Scientific Services in the United States is 7.8%.